![]()
BUSINESS
DLH Holdings Corp. provides technology-enabled business process outsourcing, program management solutions, and public health research and analytics services in the United States. It offers defense and veteran health solutions, including healthcare, technology, and logistics solutions to the VA, Defense Health Agency, Tele-medicine and Advanced Technology Research Center, Navy Bureau of Medicine and Surgery, and the Army Medical Research and Material Command. The company also provides a range of human services and solutions, which consists of monitoring and evaluation, electronic medical records migration, data collection and management, and nutritional and social health assessments; and IT system architecture design, migration plan, and ongoing maintenance services.
INVESTMENT RATING
DLHC is expected to continue to be a modest Value Builder reflecting capital returns that are forecasted to exceed the cost of capital.
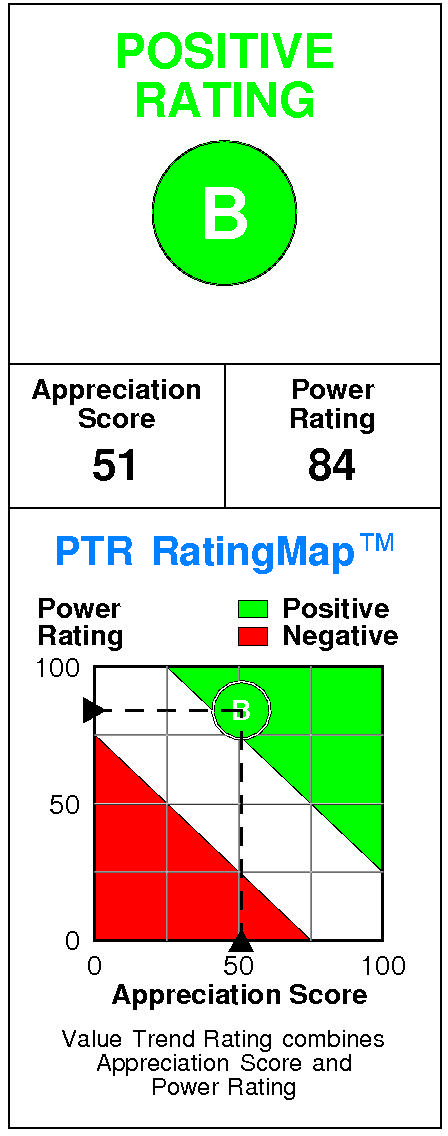
DLH Holdings has a current Value Trend Rating of B (Positive).
The Value Trend Rating reflects inconsistent signals from PTR’s two proprietary measures of a stock’s attractiveness. DLH Holdings has a neutral Appreciation Score of 51 but a good Power Rating of 84, leading to the Positive Value Trend Rating.
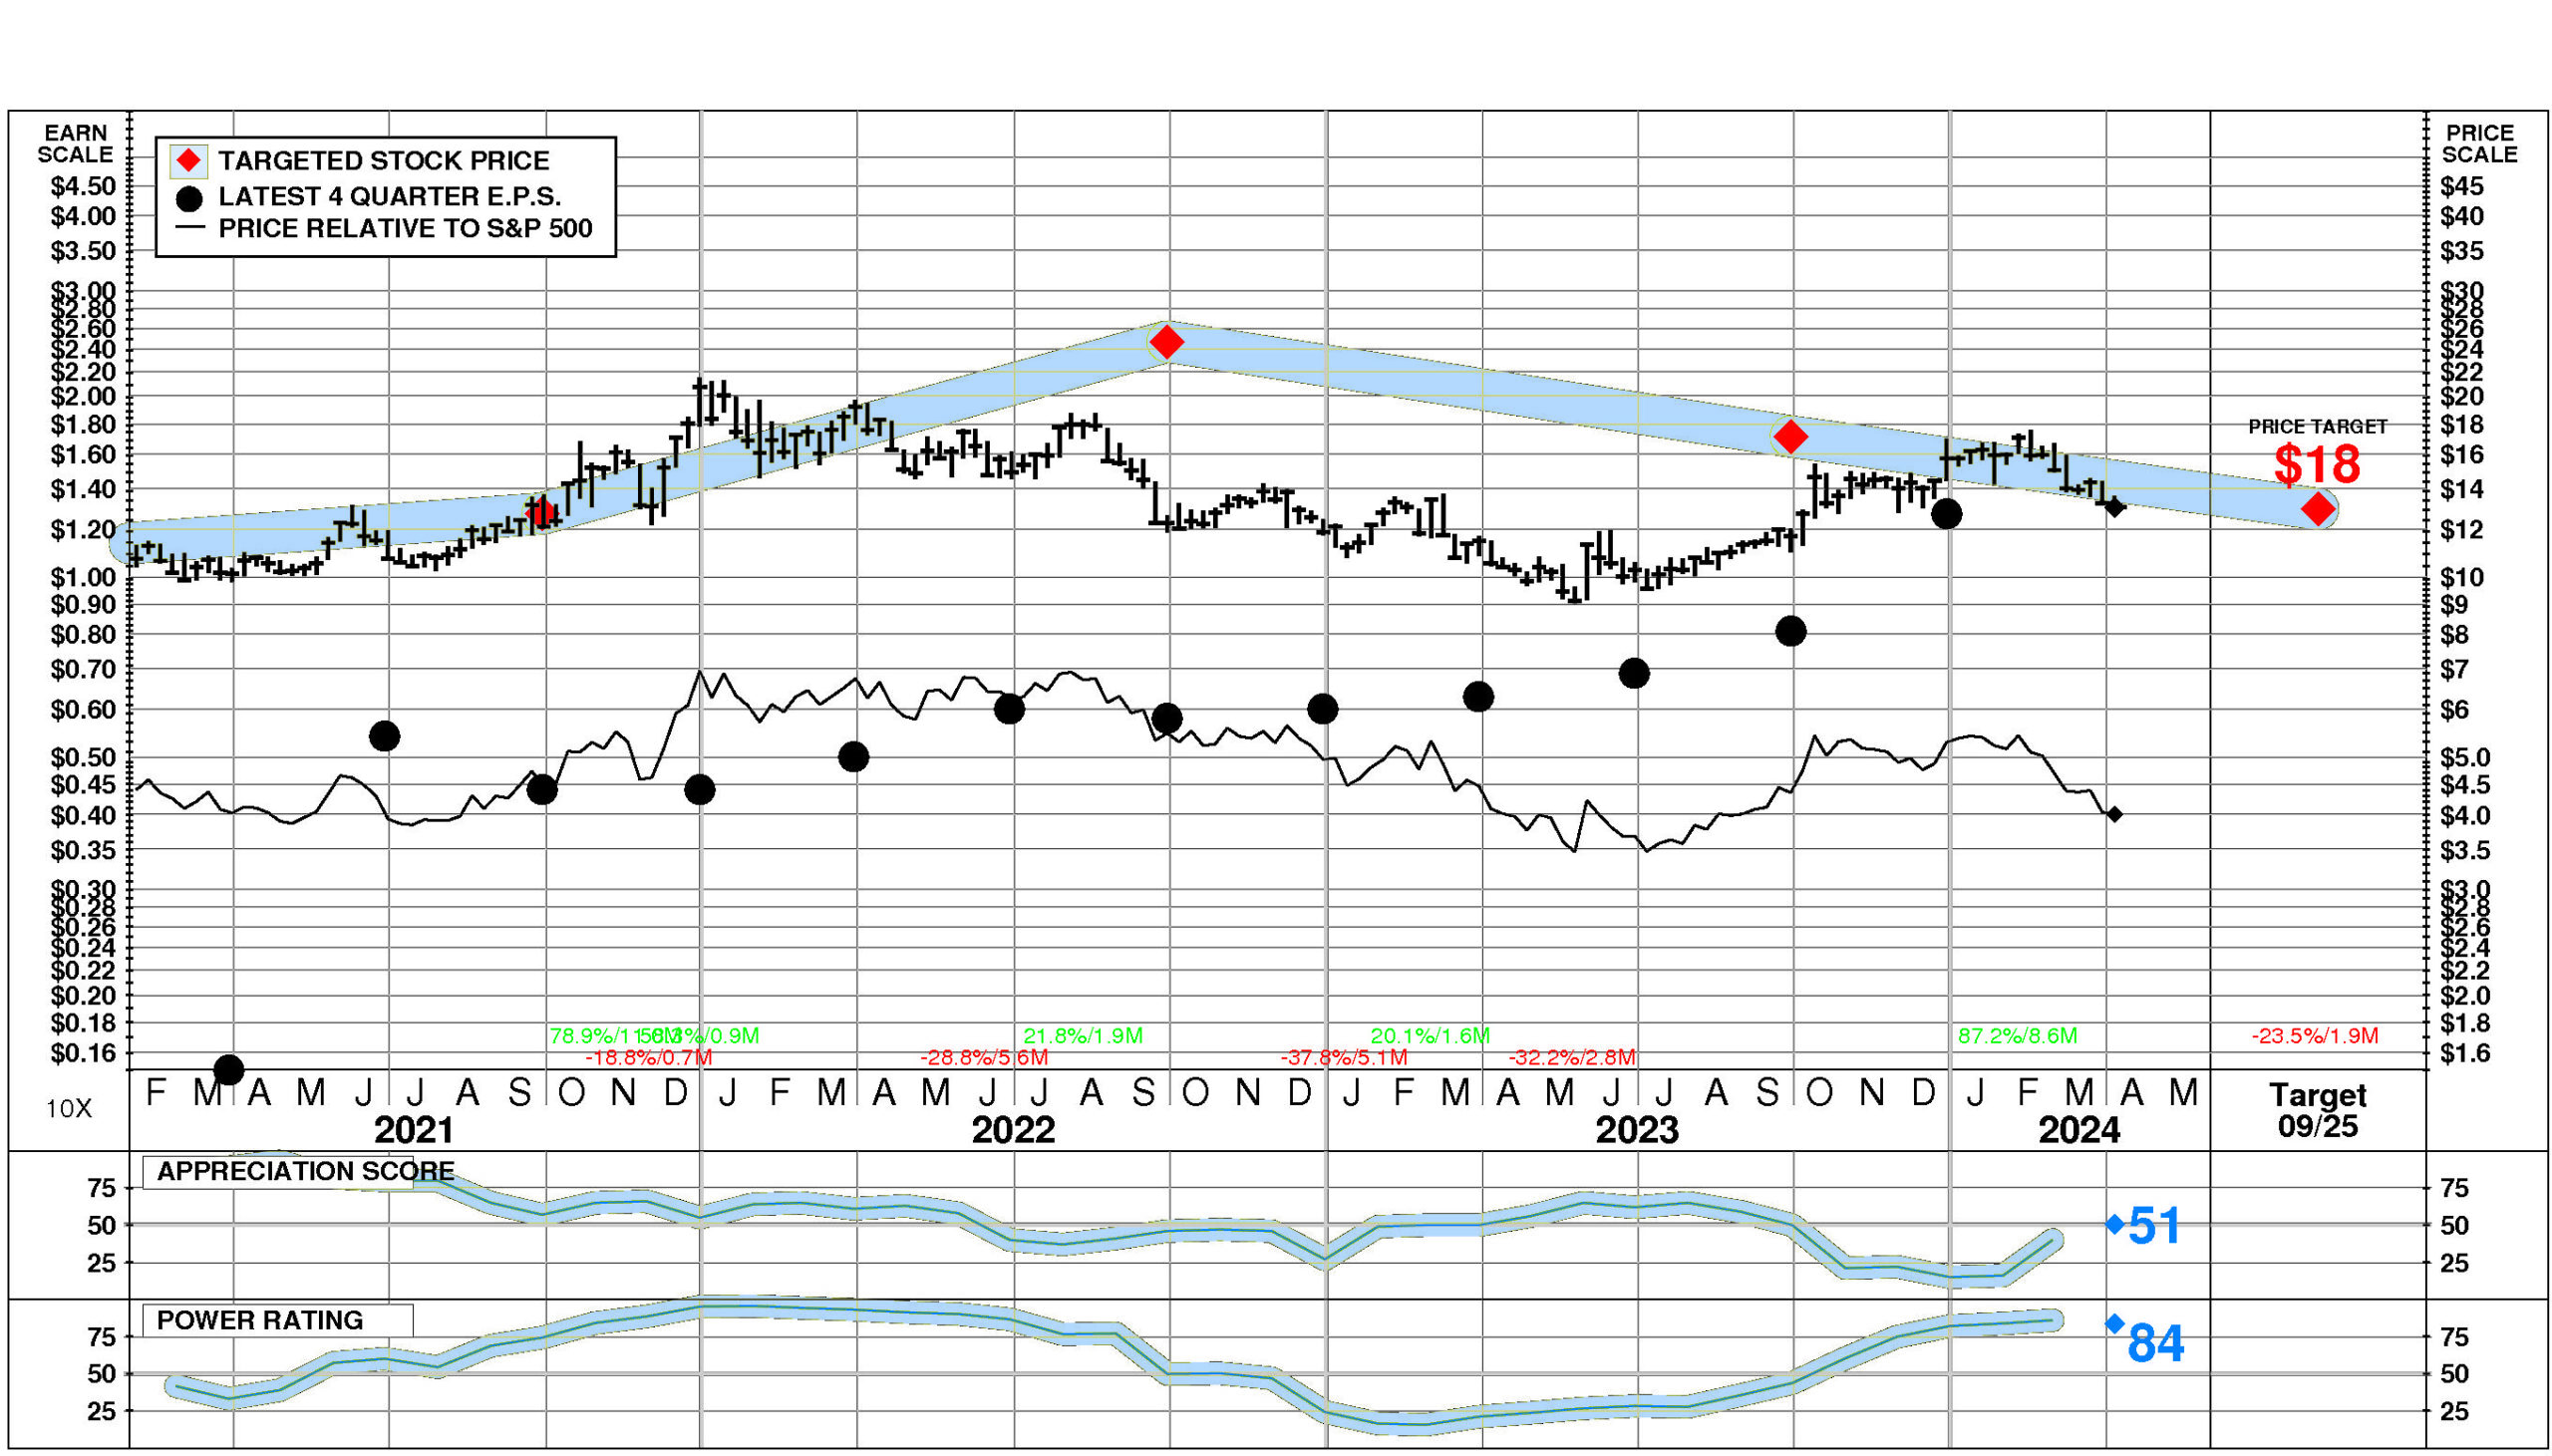
DLH Holdings’ stock is selling at targeted value. The current stock price of $13.04 compares to targeted value 12 months forward of $13.
This neutral appreciation potential results in an appreciation score of 51 (49% of the universe has greater appreciation potential.)
DLH Holdings has a Power Rating of 84. (This good Power Rating indicates that DLHC has a better chance of achieving attractive investment performance over the near to intermediate term than all but 16% of companies in the universe.)
Factors contributing to this good Power Rating include: recent price action has been extremely favorable; and earnings estimate behavior for DLHC has been slightly favorable recently. An offsetting factor is the Miscellaneous Health & Allied Services, NEC comparison group is currently in an unfavorable position.
INVESTMENT PROFILE
DLHC’s financial strength is below average. Financial strength rating is 36.
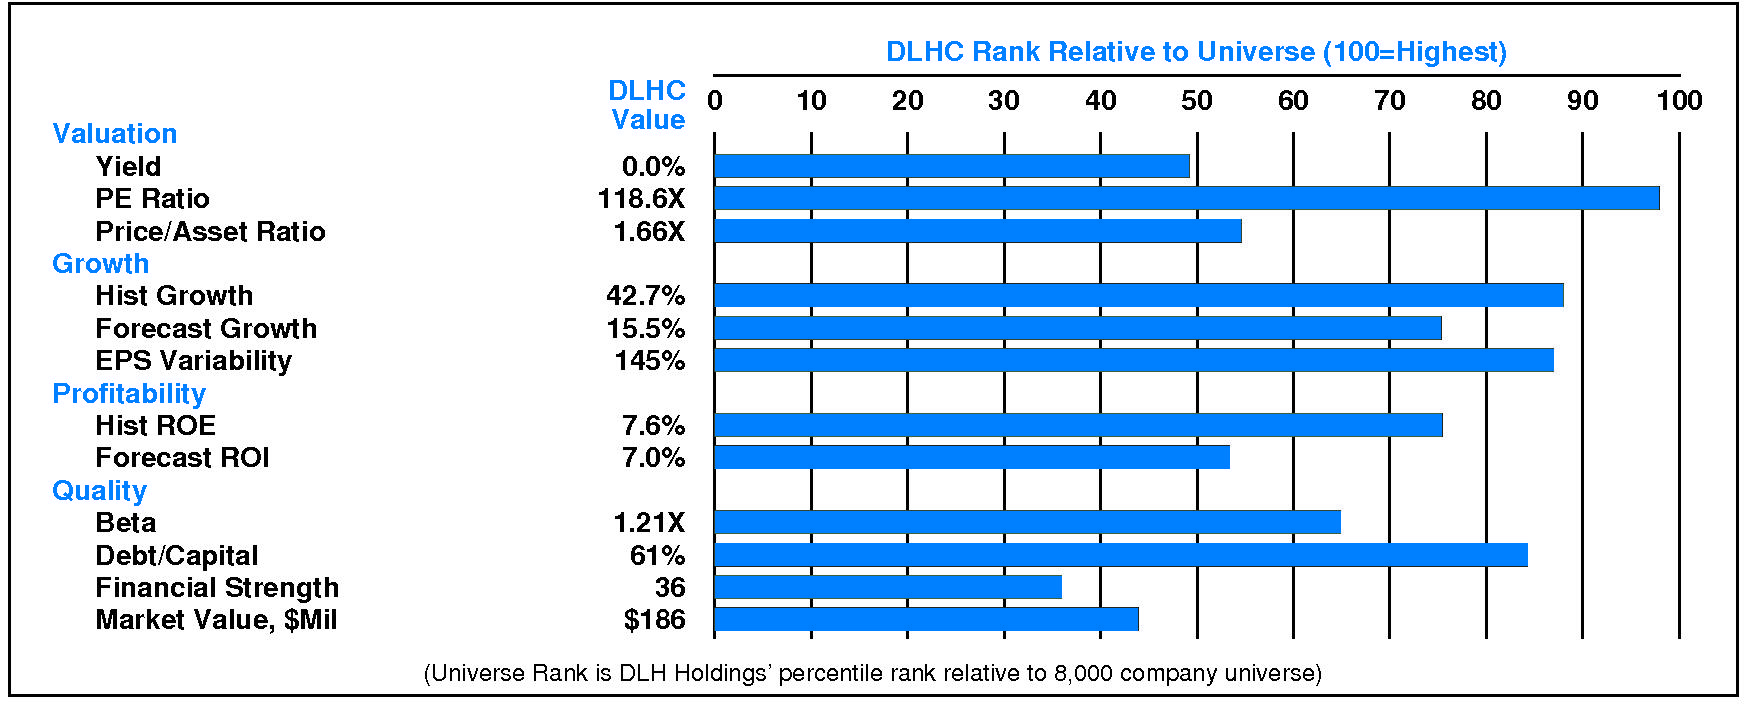
Relative to the S&P 500 Composite, DLH Holdings Corp has both Growth and Value characteristics; its appeal is likely to be to Capital Gain-oriented investors; the perception is that DLHC is extremely high risk. Relative weaknesses include: low forecasted profitability, low historical profitability, low financial strength, high financial leverage, and high earnings variability. DLHC’s valuation is moderate: low dividend yield, moderate P/E ratio, and low price/book ratio. DLHC has unusually low market capitalization.
CURRENT SIGNALS
DLH Holdings’ current operations are eroding. Return on equity is falling, reflecting: falling asset utilization; declining pretax margin; and falling leverage.
DLH Holdings’ current technical position is mixed. The stock price is in a 1.9 month down move. The stock has declined 19.0% from its prior high. The 200 day moving average is in an uptrend. The stock price is below its 200 day moving average. The stock has just fallen below its 200 day moving average.
ALERTS
Significant negative changes in investment behavior have recently occurred for DLH Holdings Corp (NASDAQ: DLHC): the stock’s recent price decline challenged its longer term uptrend.
DLH Holdings Corp (NASDAQ: DLHC). Important positive changes in fundamentals have recently occurred: significant quarterly earnings acceleration occurred, and significant quarterly sales acceleration occurred.
The stock is currently rated B.
On 4/5/24, DLH Holdings Corp (NASDAQ: DLHC) stock declined modestly by -1.4%, closing at $13.04. However, trading volume in this decline was exceptionally low at 47% of normal. Relative to the market the stock has been exceptionally strong over the last nine months but has declined -6.3% during the last week.
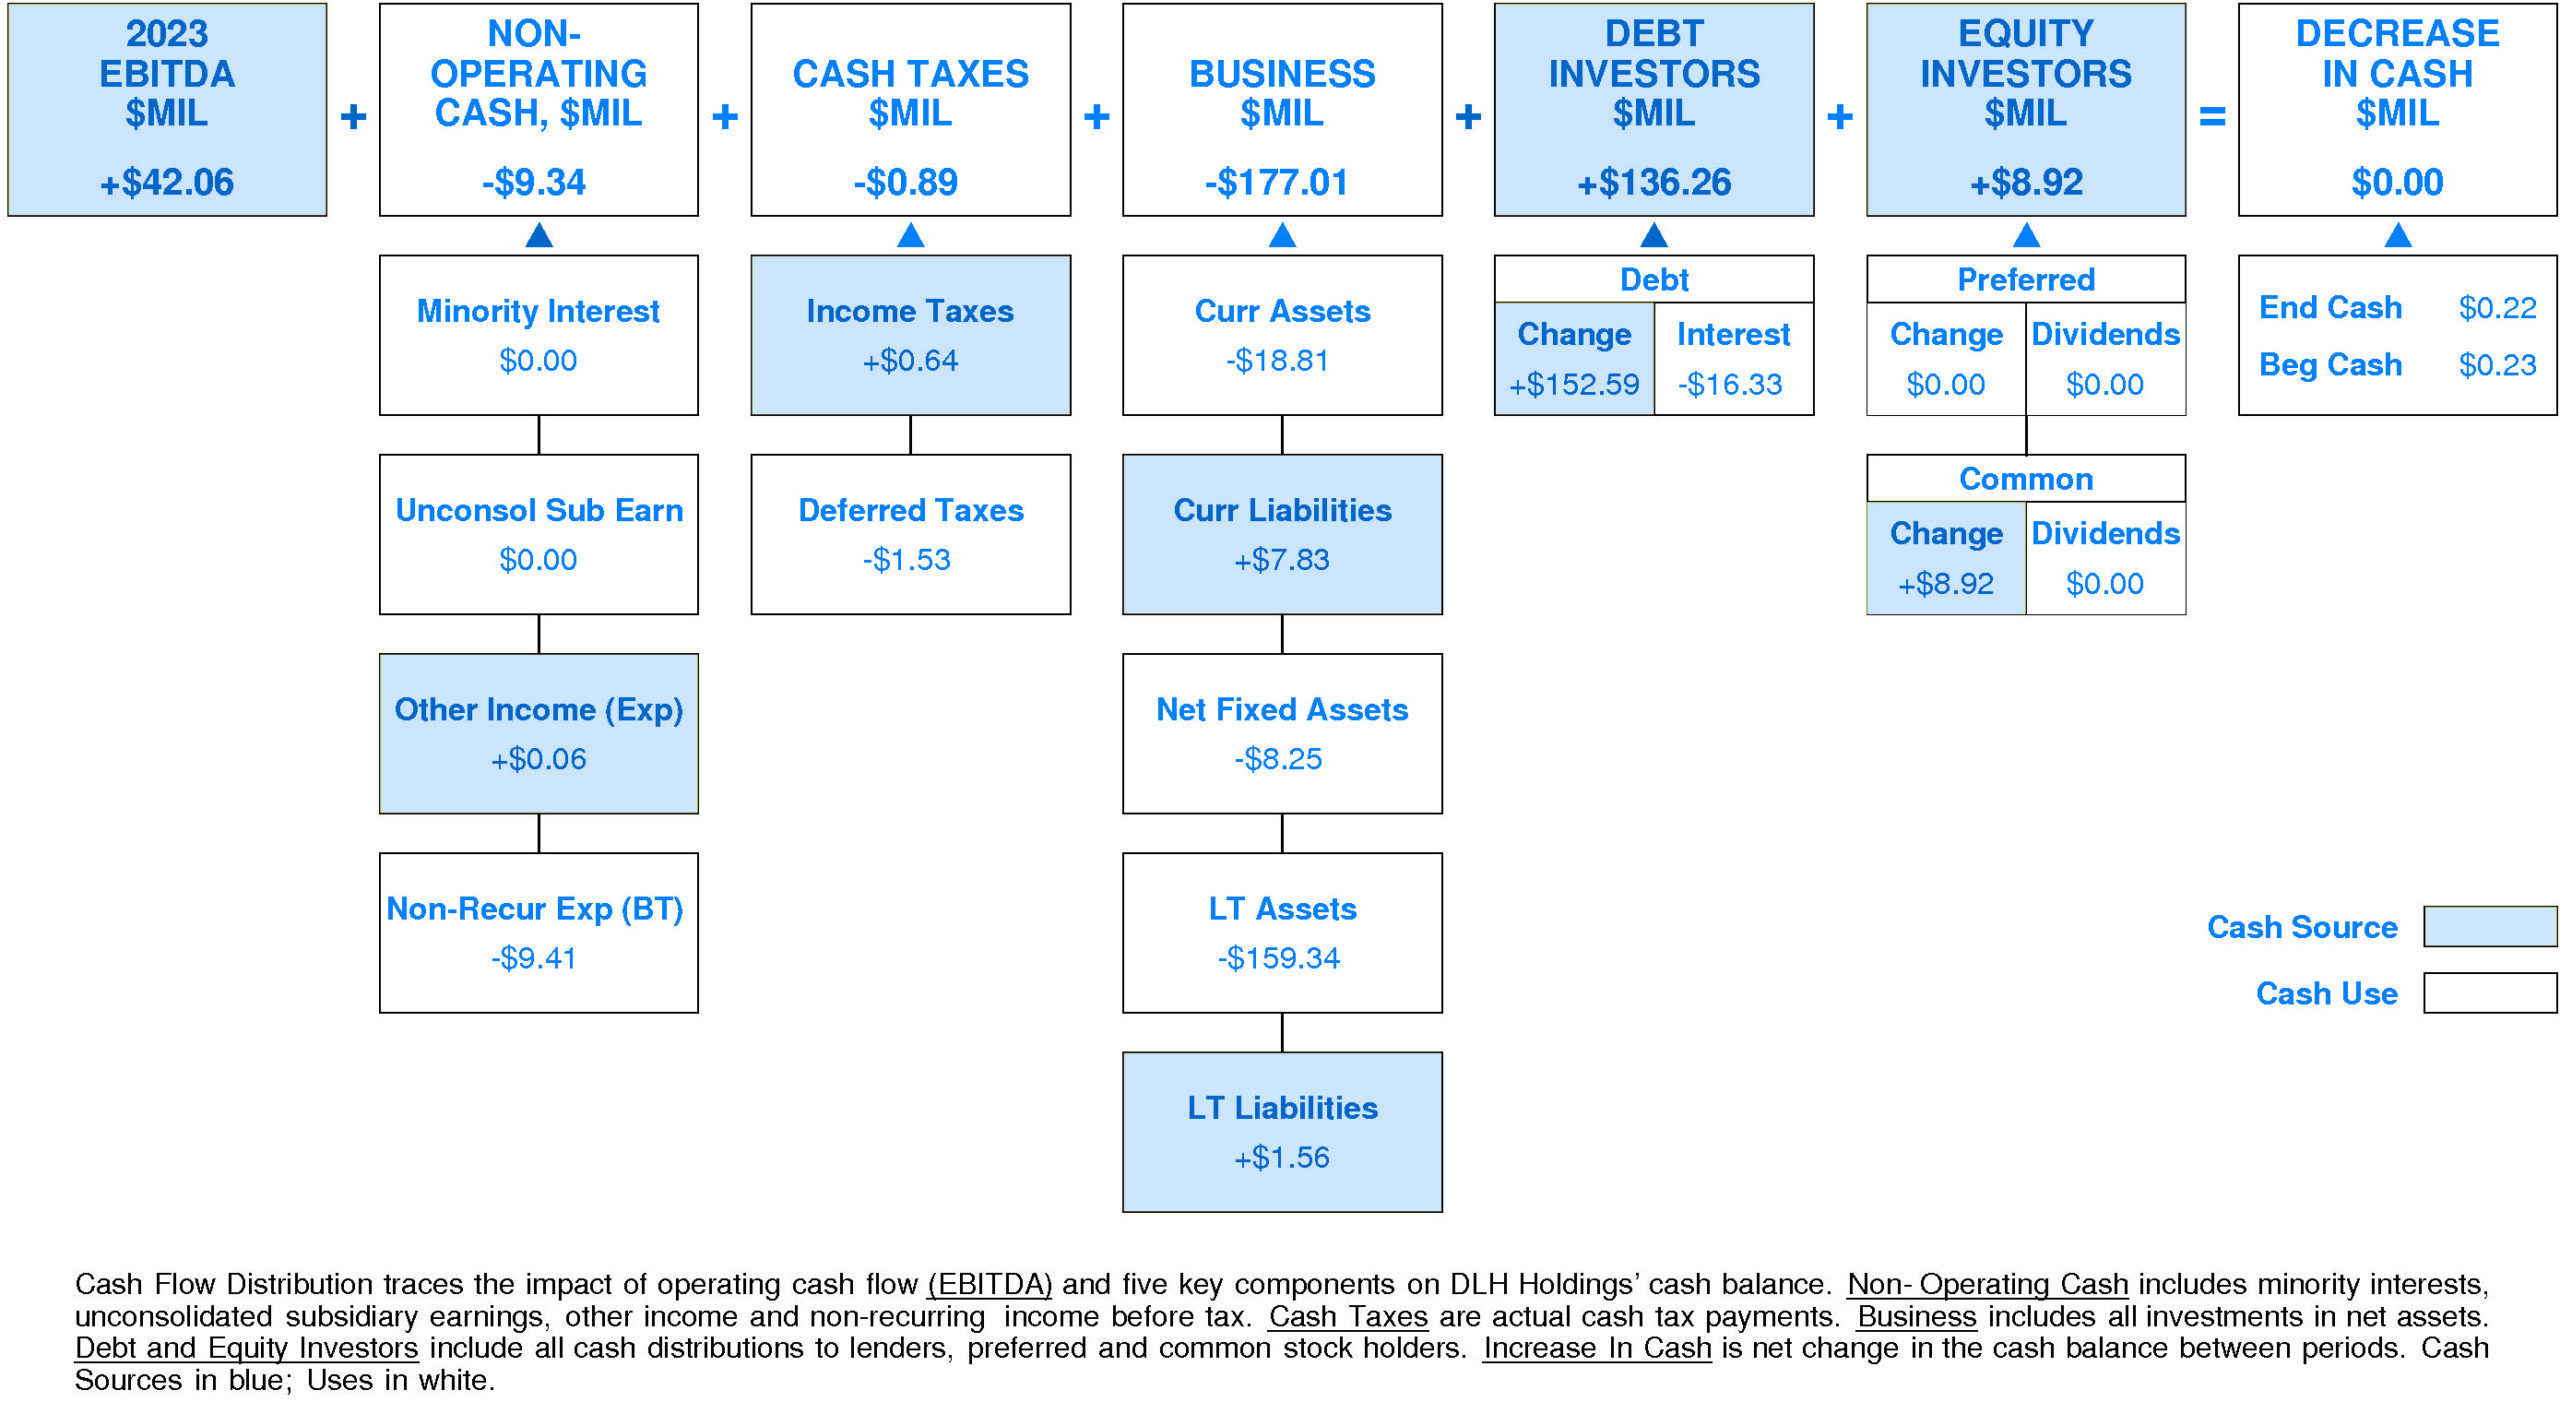
CASH FLOW
In 2023, DLH Holdings experienced a slight decrease in cash of $0.00 million (-6%). Sources of cash were slightly lower than uses. Cash generated from 2023 EBITDA totaled +$42.06 million. Non-operating uses consumed -$9.34 million (-22% of EBITDA). Cash taxes consumed -$0.89 million (-2% of EBITDA). Re-investment in the business amounted to -$177.01 million (-421% of EBITDA). On a net basis, debt investors supplied +$136.26 million (+324% of EBITDA) while equity investors supplied +$8.92 million (+21% of EBITDA).
DLH Holdings’ Non-operating Income, %EBITDA has suffered a strong overall downtrend over the period. This downtrend was accompanied by stability for the Dlh Holdings Peer Group. In most years, DLH Holdings was in the third quartile and top quartile. Currently, DLH Holdings is substantially below median at -22% of EBITDA (-$9.34 million).
DLH Holdings’ Cash Taxes, %EBITDA experienced a very strong overall downtrend over the period. This downtrend was accompanied by an opposite trend for the Dlh Holdings Peer Group. In most years, DLH Holdings was in the top quartile and third quartile. Currently, DLH Holdings is at the upper quartile at -2% of EBITDA (-$0.89 million).
DLH Holdings’ Business Re-investment, %EBITDA has enjoyed a volatile overall uptrend over the period. This improvement was accompanied by an opposite trend for the Dlh Holdings Peer Group. (Since 2021 Business Re-investment, %EBITDA has experienced a very sharp decline.) In most years, DLH Holdings was in the lower quartile and top quartile. Currently, DLH Holdings is lower quartile at -421% of EBITDA (-$177.01 million).
DLH Holdings’ Debt Investors, %EBITDA has experienced a volatile overall uptrend over the period. This improvement was accompanied by a similar trend for the Dlh Holdings Peer Group. (Since 2021 Debt Investors, %EBITDA has accelerated very sharply.) In most years, DLH Holdings was in the lower quartile and top quartile. Currently, DLH Holdings is at the upper quartile at +324% of EBITDA (+$136.26 million).
DLH Holdings’ Equity Investors, %EBITDA has suffered a very strong overall downtrend over the period. This downtrend was accompanied by stability for the Dlh Holdings Peer Group. (Since 2020 Equity Investors, %EBITDA has experienced a very sharp recovery.) In most years, DLH Holdings was in the top quartile. Currently, DLH Holdings is upper quartile at +21% of EBITDA (+$8.92 million).
DLH Holdings’ Change in Cash, %EBITDA has experienced a volatile overall downtrend over the period. This downtrend was accompanied by stability for the Dlh Holdings Peer Group. In most years, DLH Holdings was in the third quartile and top quartile. Currently, DLH Holdings is substantially below median at 0% of EBITDA ( $0.00 million).
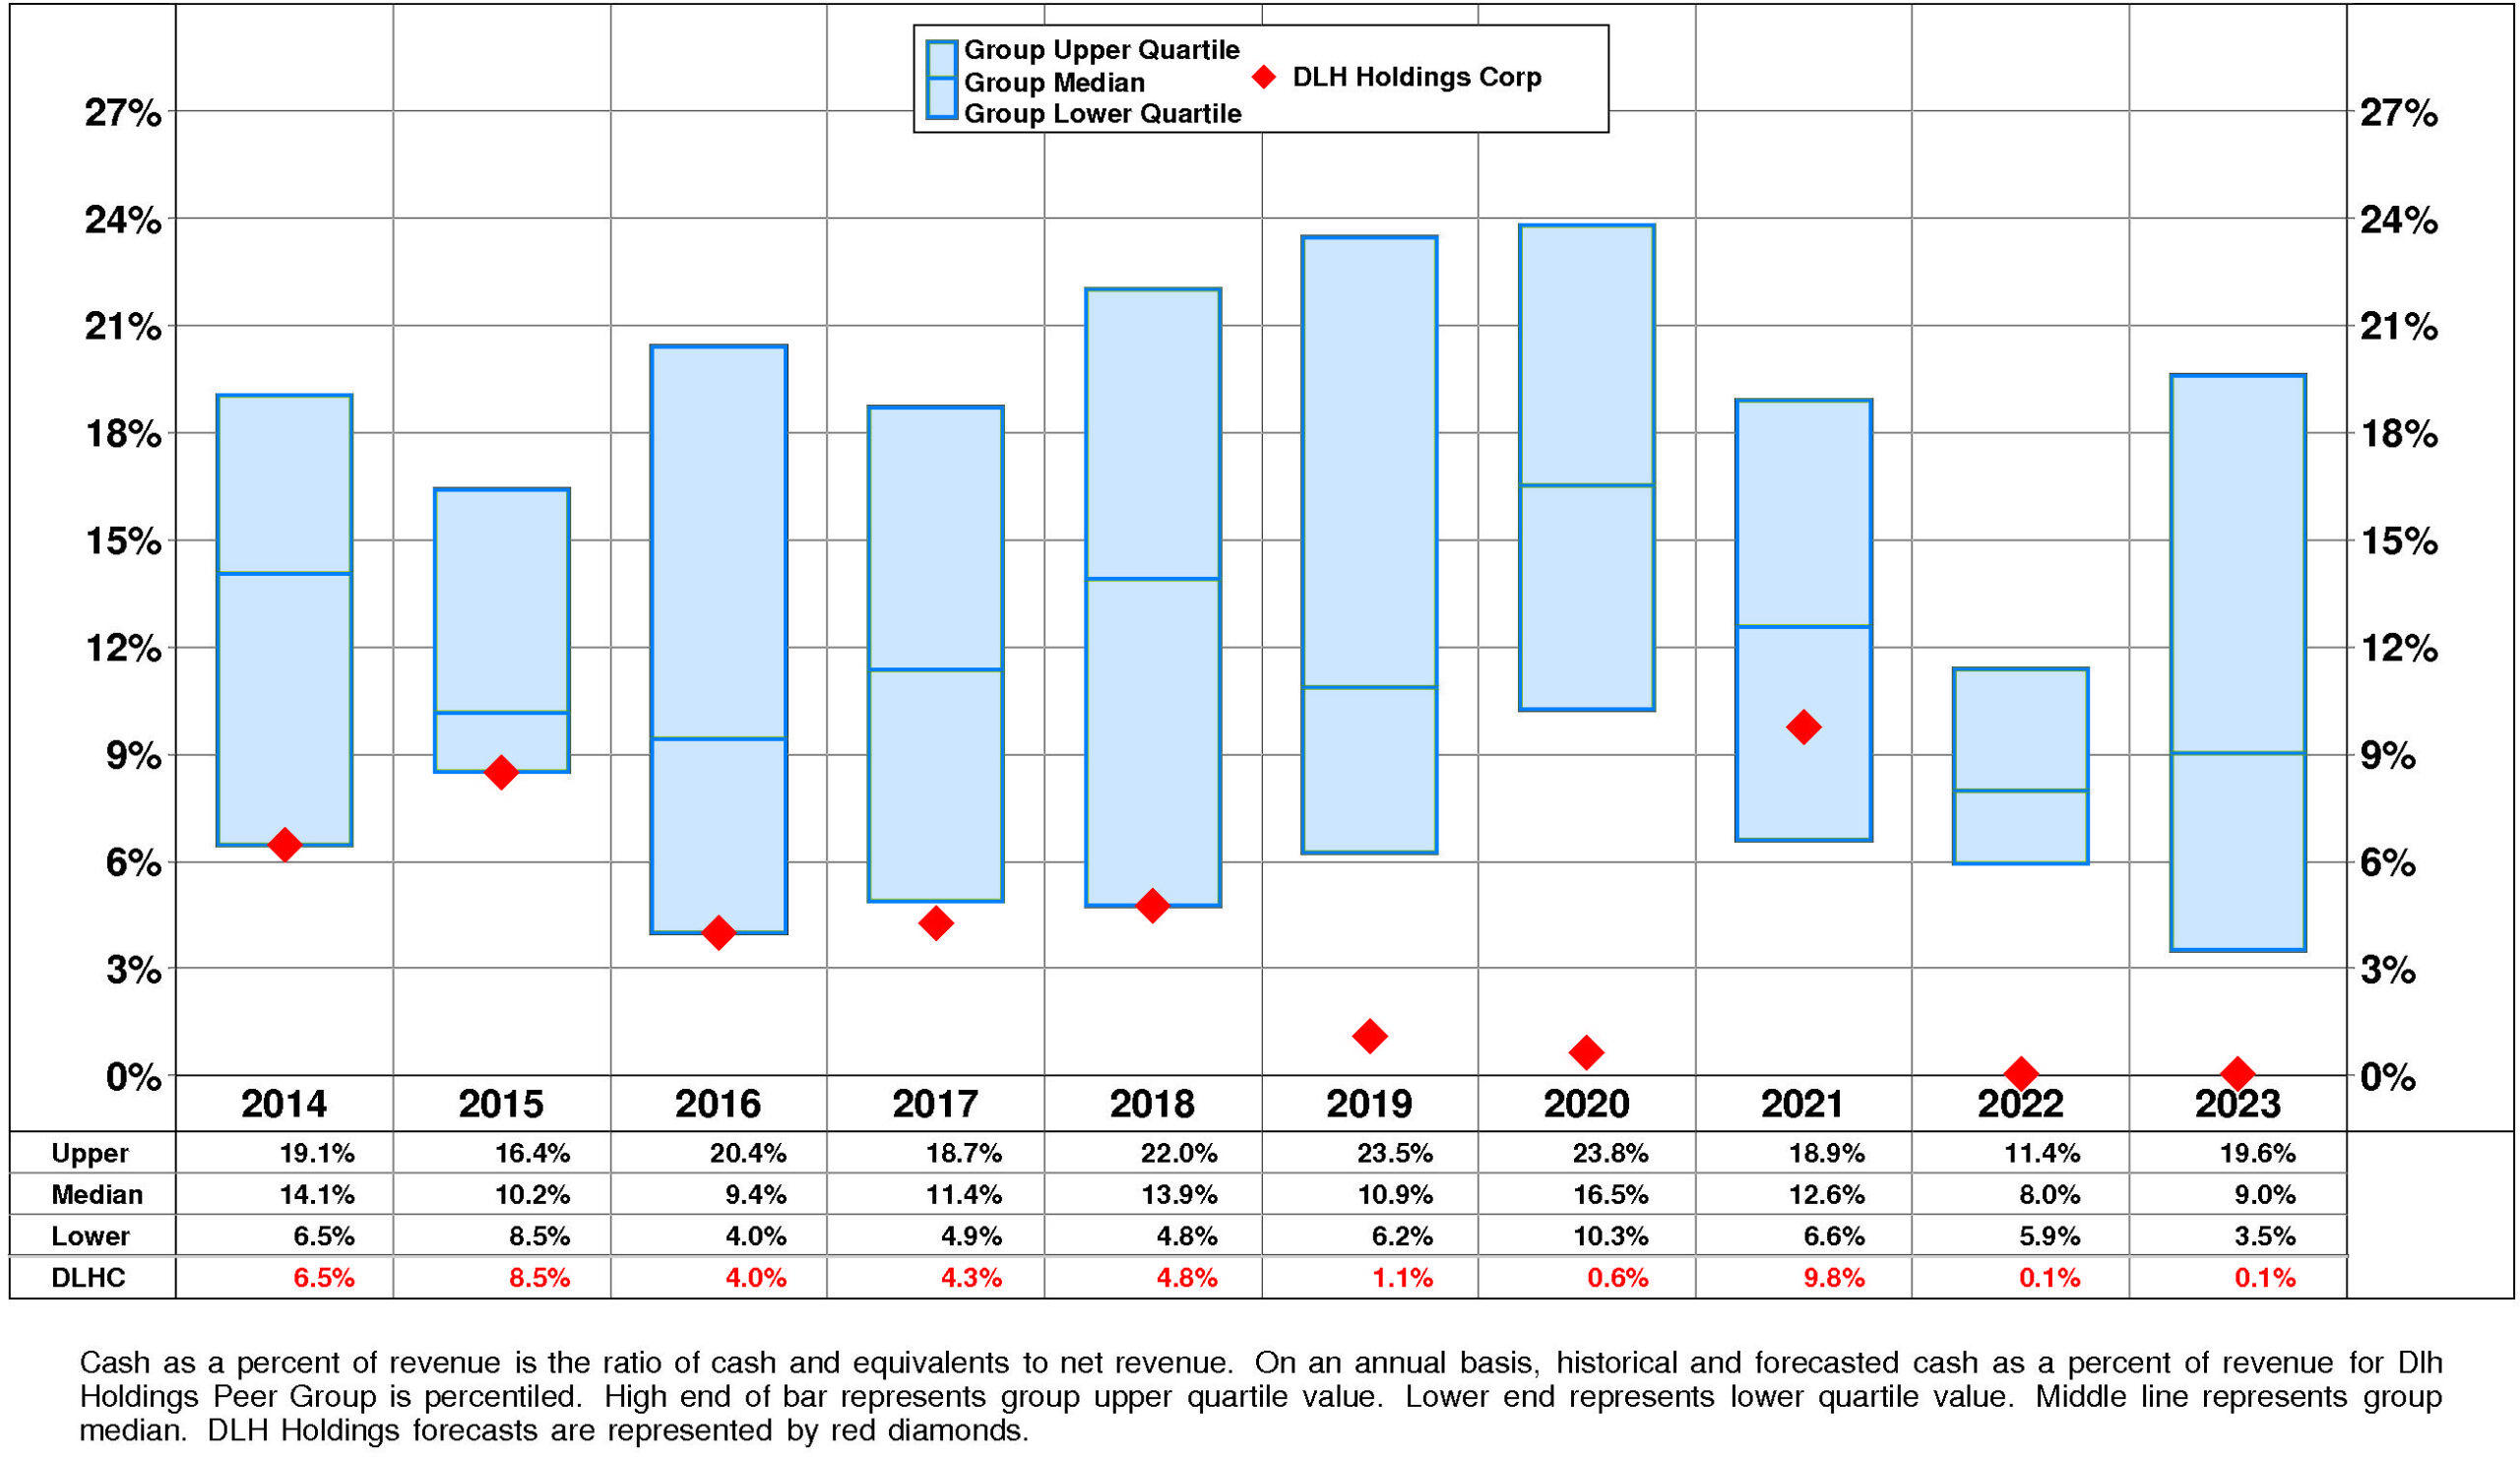
DLH Holdings’ Cash, %Revenue has experienced a small downtrend over the period. This downtrend was accompanied by stability for the Dlh Holdings Peer Group. (Since 2021 Cash, %Revenue has acccelerated.) In most years, DLH Holdings was in the third quartile and lower quartile. Currently, DLH Holdings is lower quartile at +0%.
PROFITABILITY
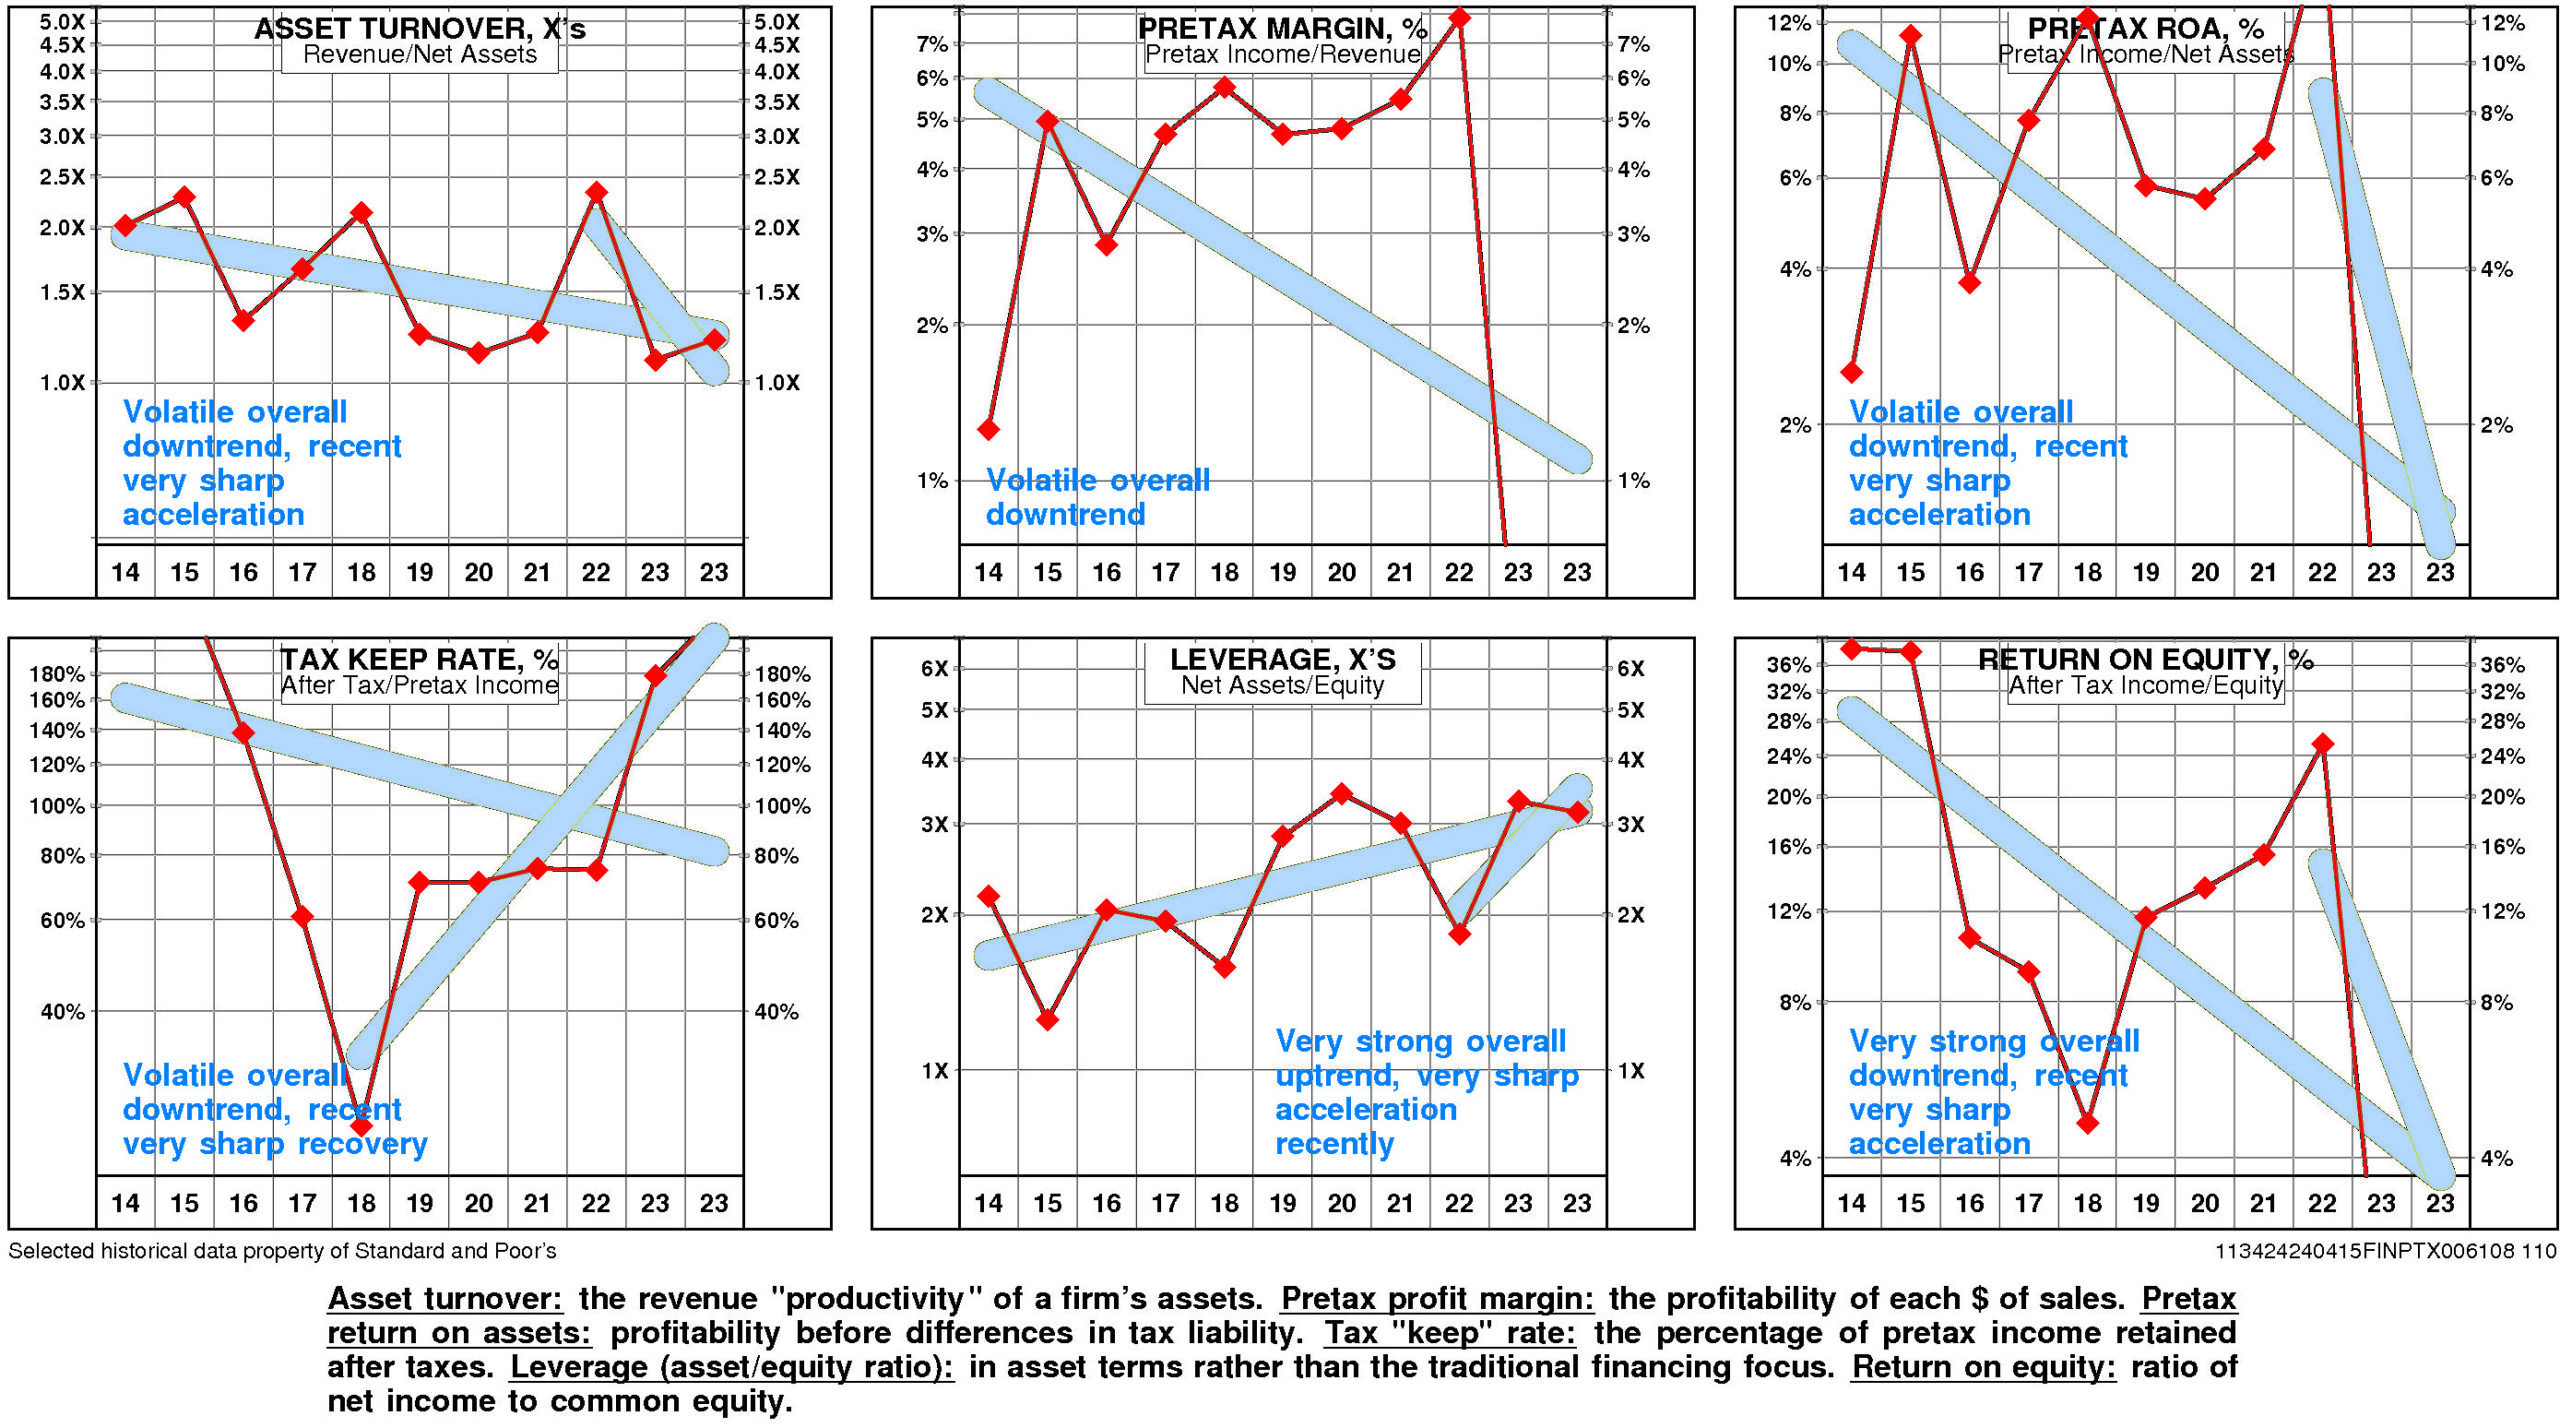
DLH Holdings’ return on equity has eroded very significantly since 2014. The current level of 2.0% is 1.38X the low for the period and is -94.9% from the high.
This very significant erosion was due to very strong negative trend in pretax operating return and little change in non-operating factors.
The productivity of DLH Holdings’ assets declined over the full period 2014-2023: asset turnover has suffered a volatile overall downtrend that accelerated very sharply after the 2022 level.
DLH Holdings’ pretax margin experienced a volatile overall downtrend over the period 2014-2023.
Non-operating factors (income taxes and financial leverage) had little influence on return on equity.
DLH Holdings’ return on equity is lower quartile (2.0%) for the four quarters ended December, 2023.
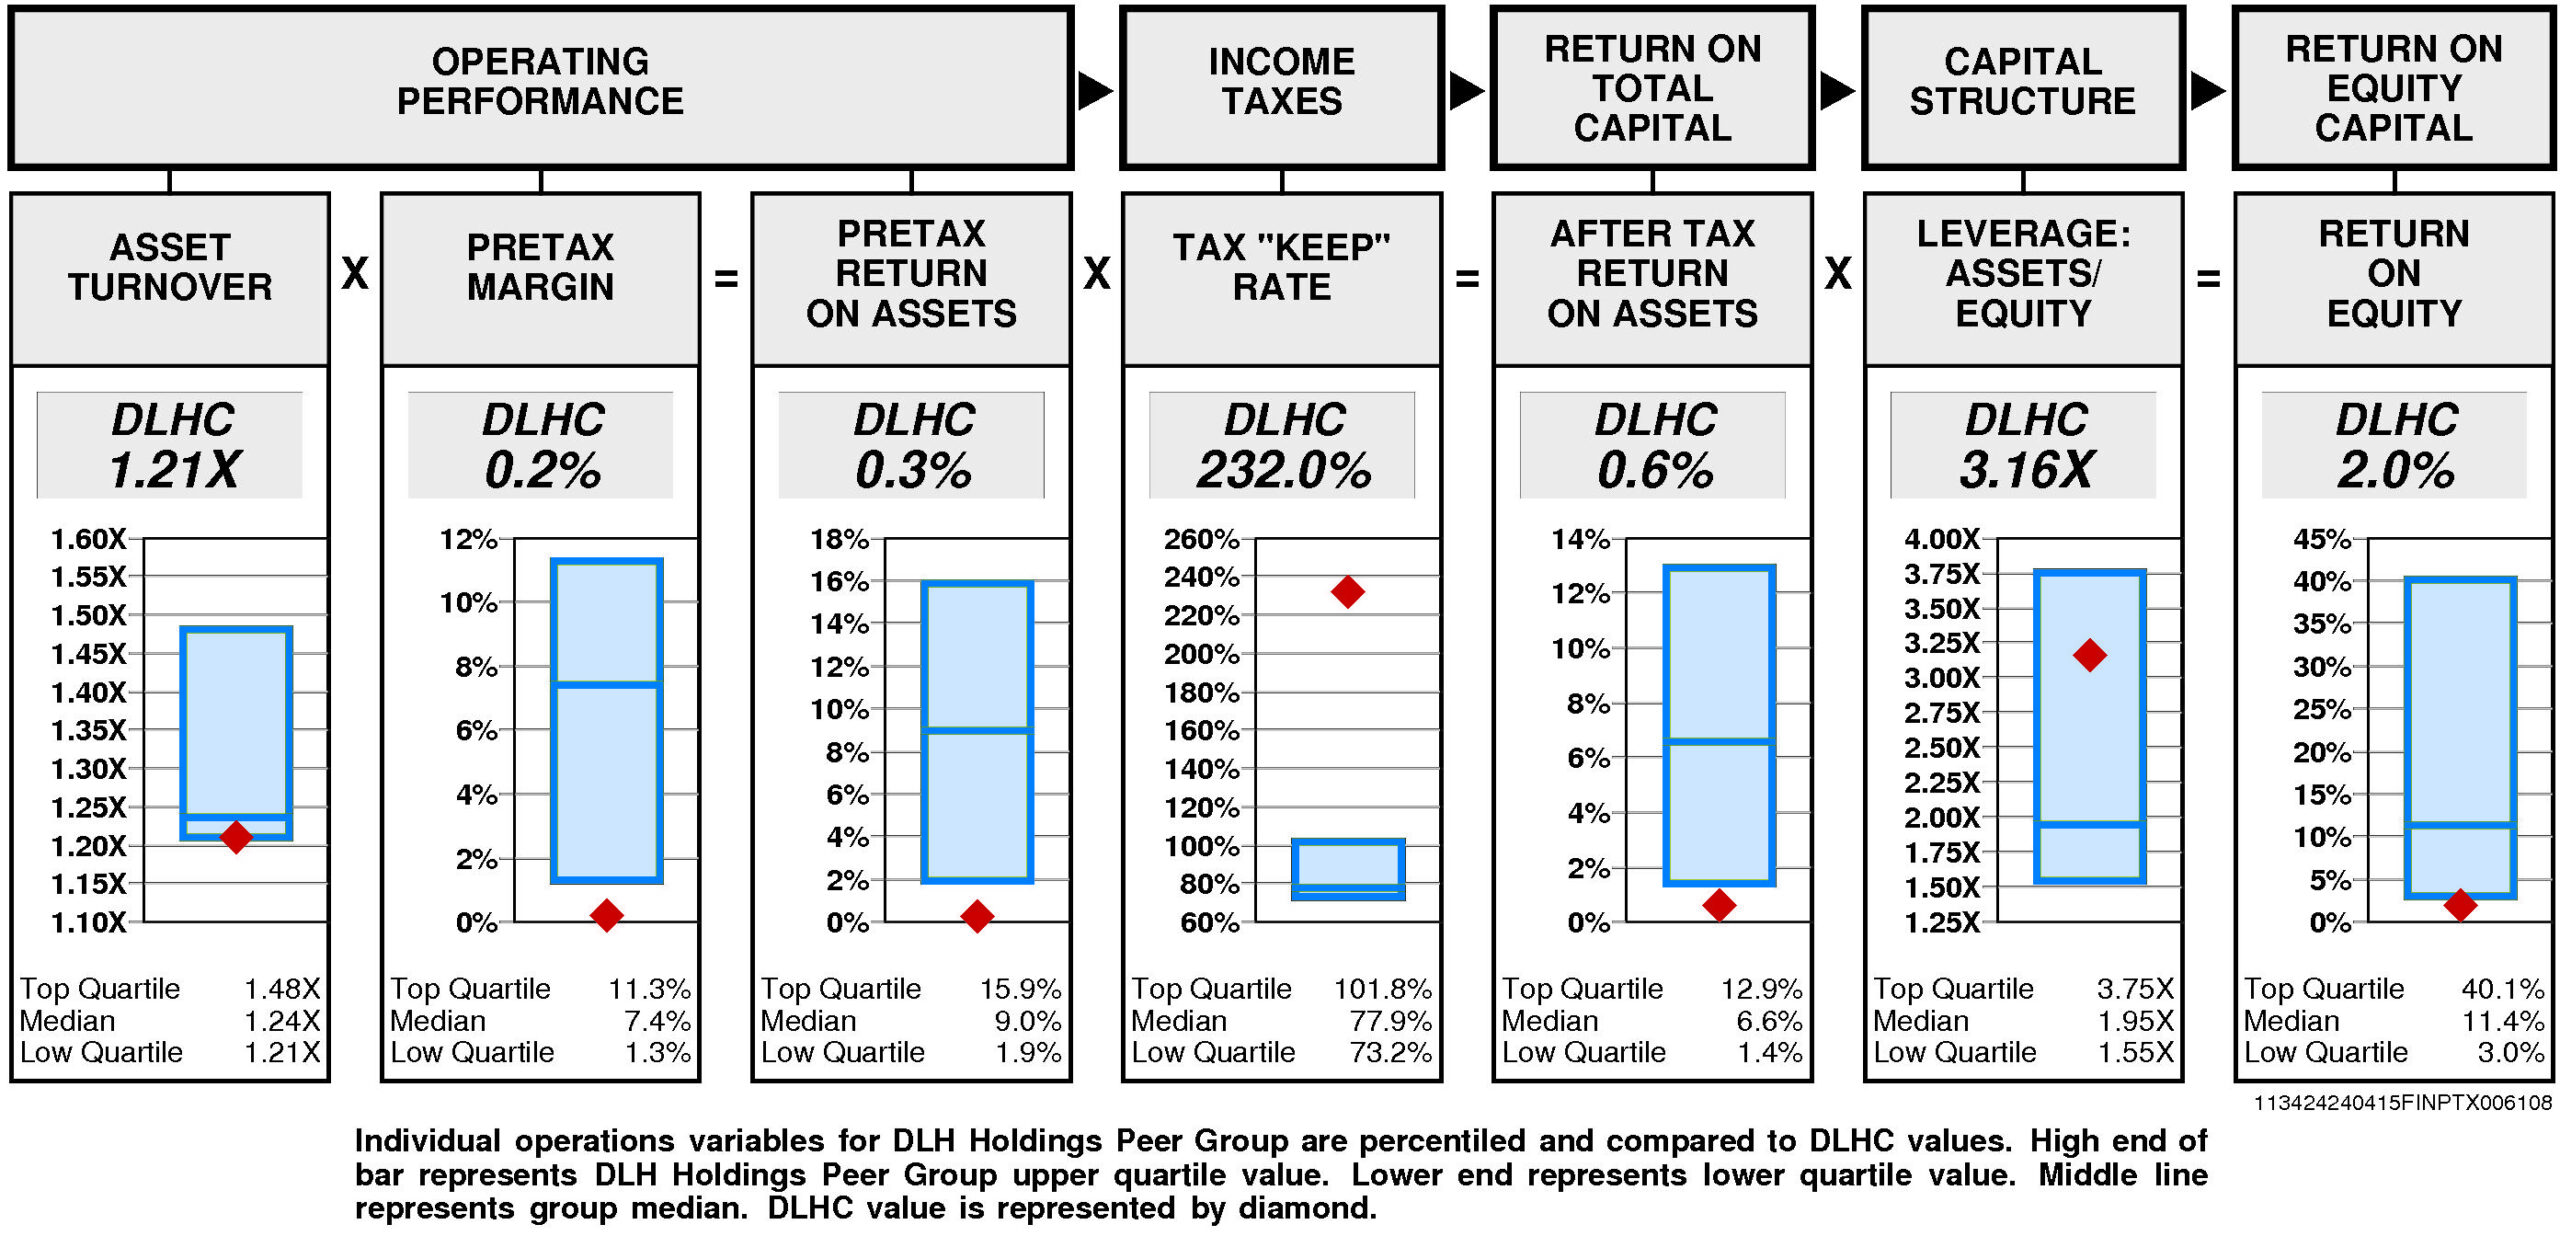
Operating performance (pretax return on assets) is lower quartile (0.3%) reflecting asset turnover that is at the lower quartile (1.21X) and lower quartile pretax margin (0.2%).
Tax “keep” rate (income tax management) is upper quartile (232.0%) resulting in after tax return on assets that is lower quartile.
Financial leverage (leverage) is above median (3.16X).
GROWTH RATES
There are no significant differences between DLH Holdings’ longer term growth and growth in recent years.
DLH Holdings’ historical income statement and balance sheet growth are not available.
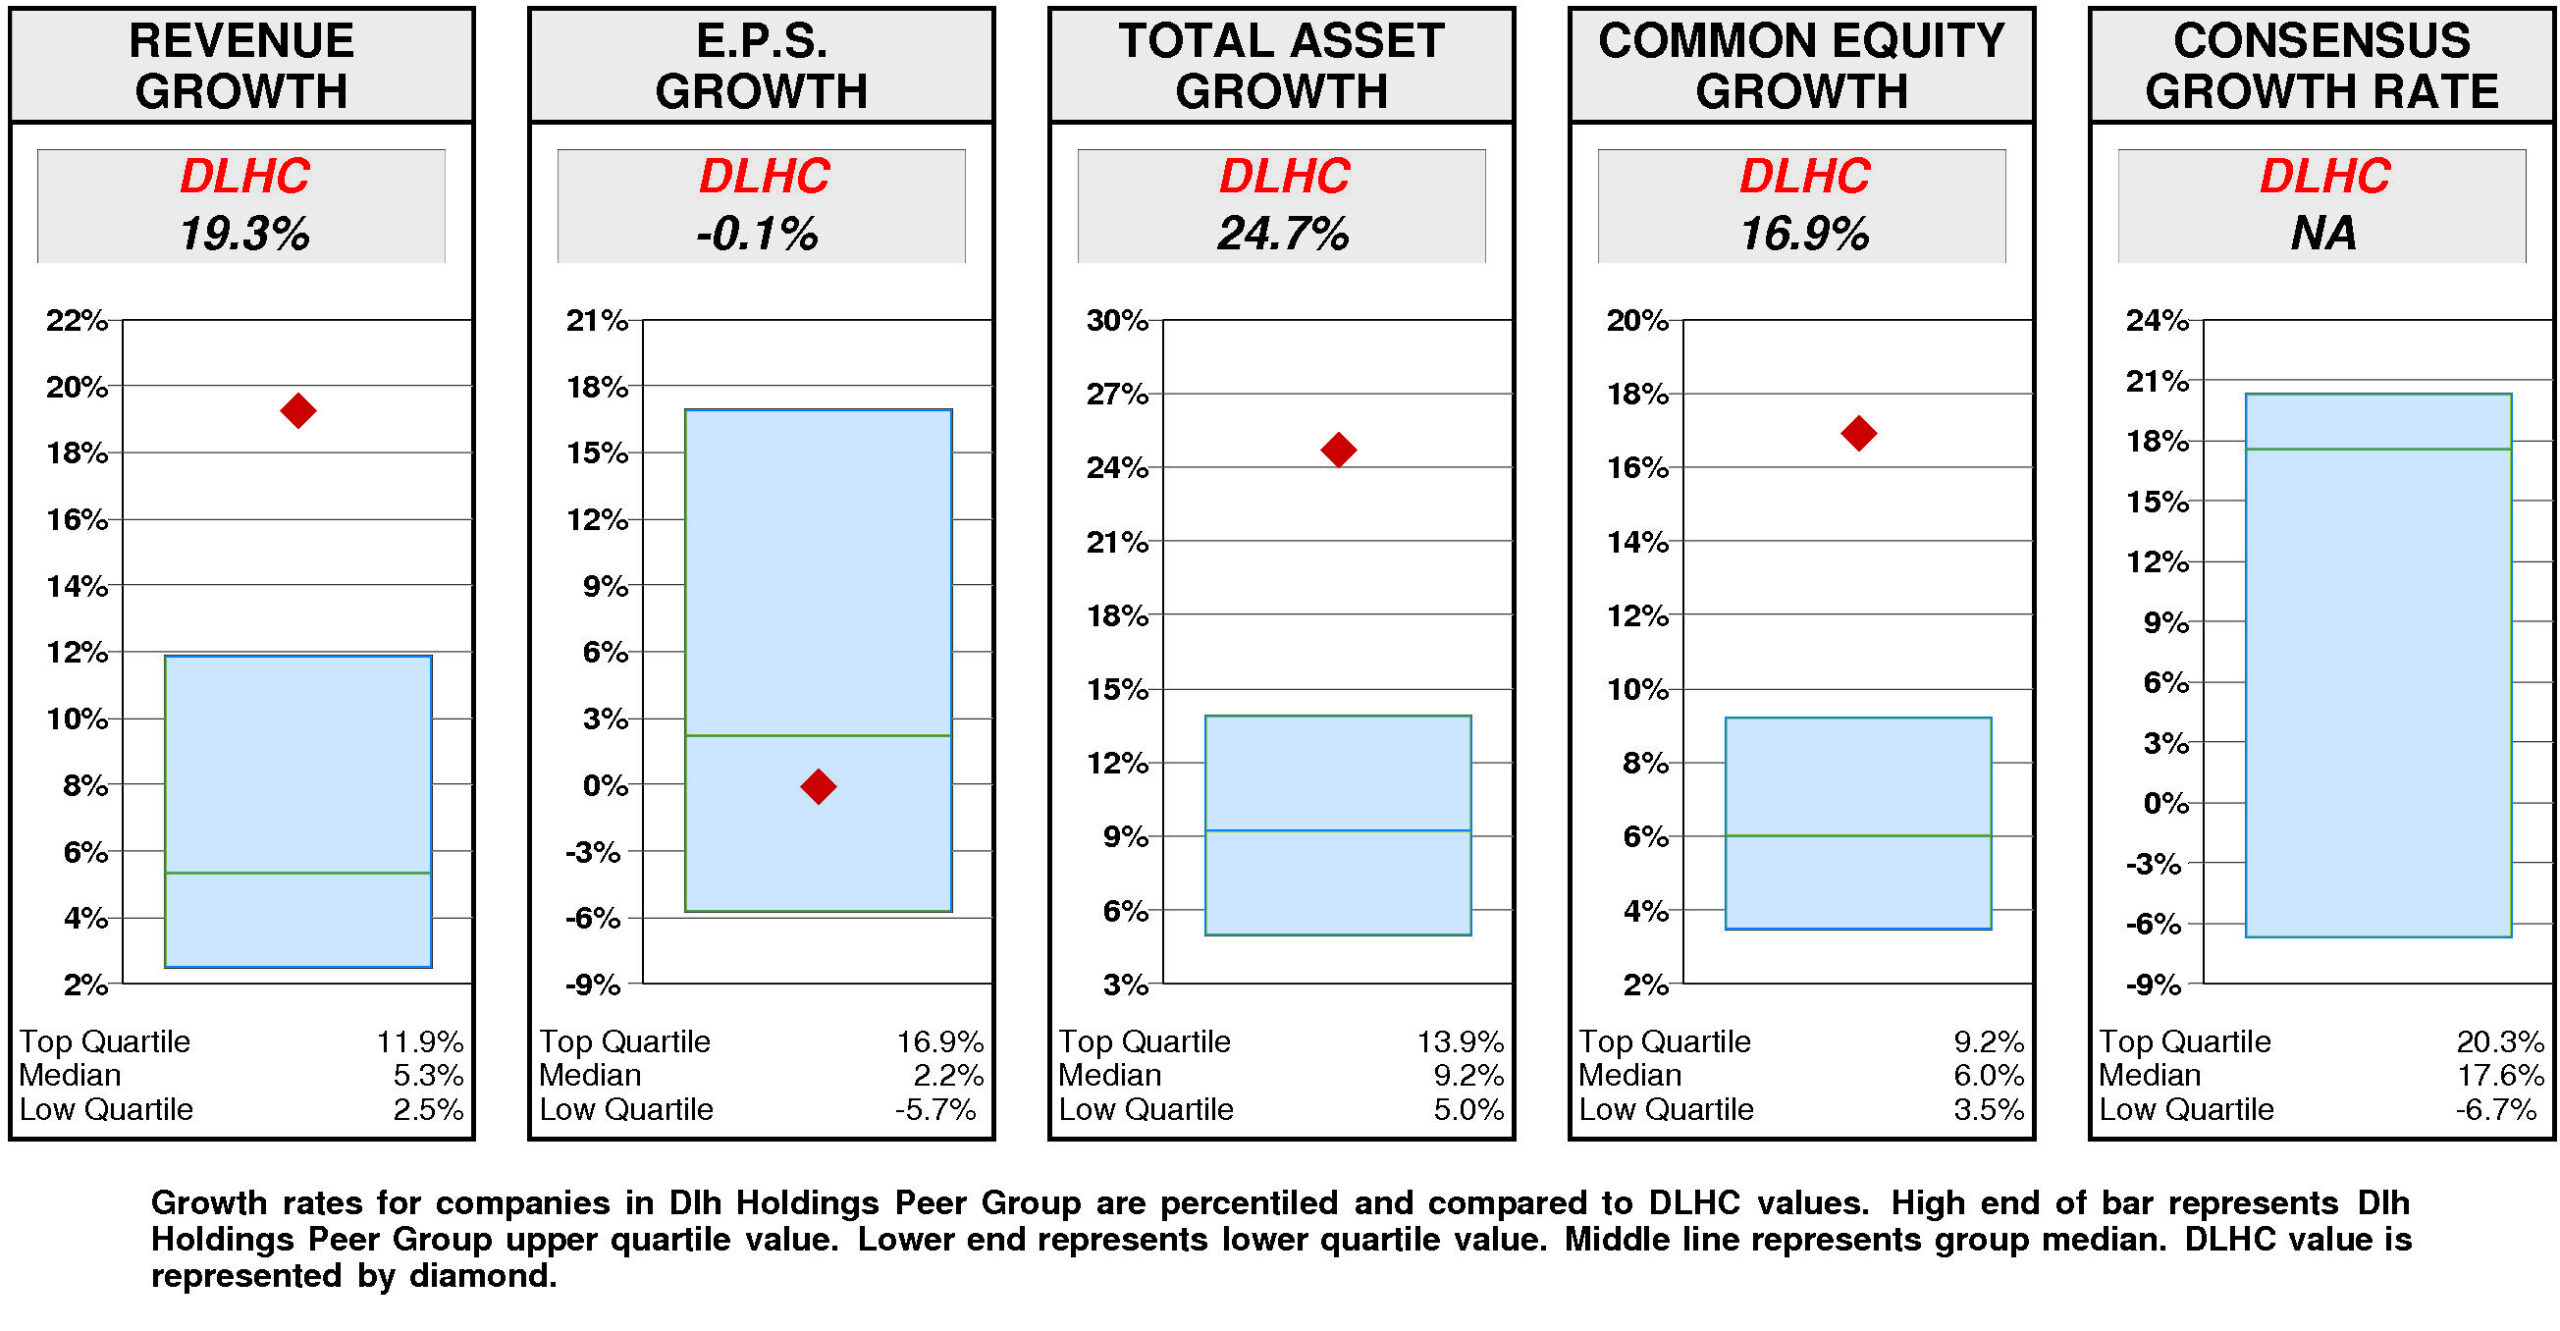
Annual revenue growth has been 19.3% per year.
Total asset growth has been 24.7% per year.
Annual E.P.S. growth has been -0.1% per year.
Equity growth has been 16.9% per year.
No consensus growth rate forecast is available for DLH Holdings.

Relative to the Dlh Holdings Peer Group, DLH Holdings’ historical growth measures are generally top quartile. Revenue growth (19.3%) has been upper quartile. Total asset growth (24.7%) has been upper quartile. Equity growth (16.9%) has been upper quartile. E.P.S. growth (-0.1%) has been below median.
Consensus growth forecast is unavailable.
PRICE HISTORY
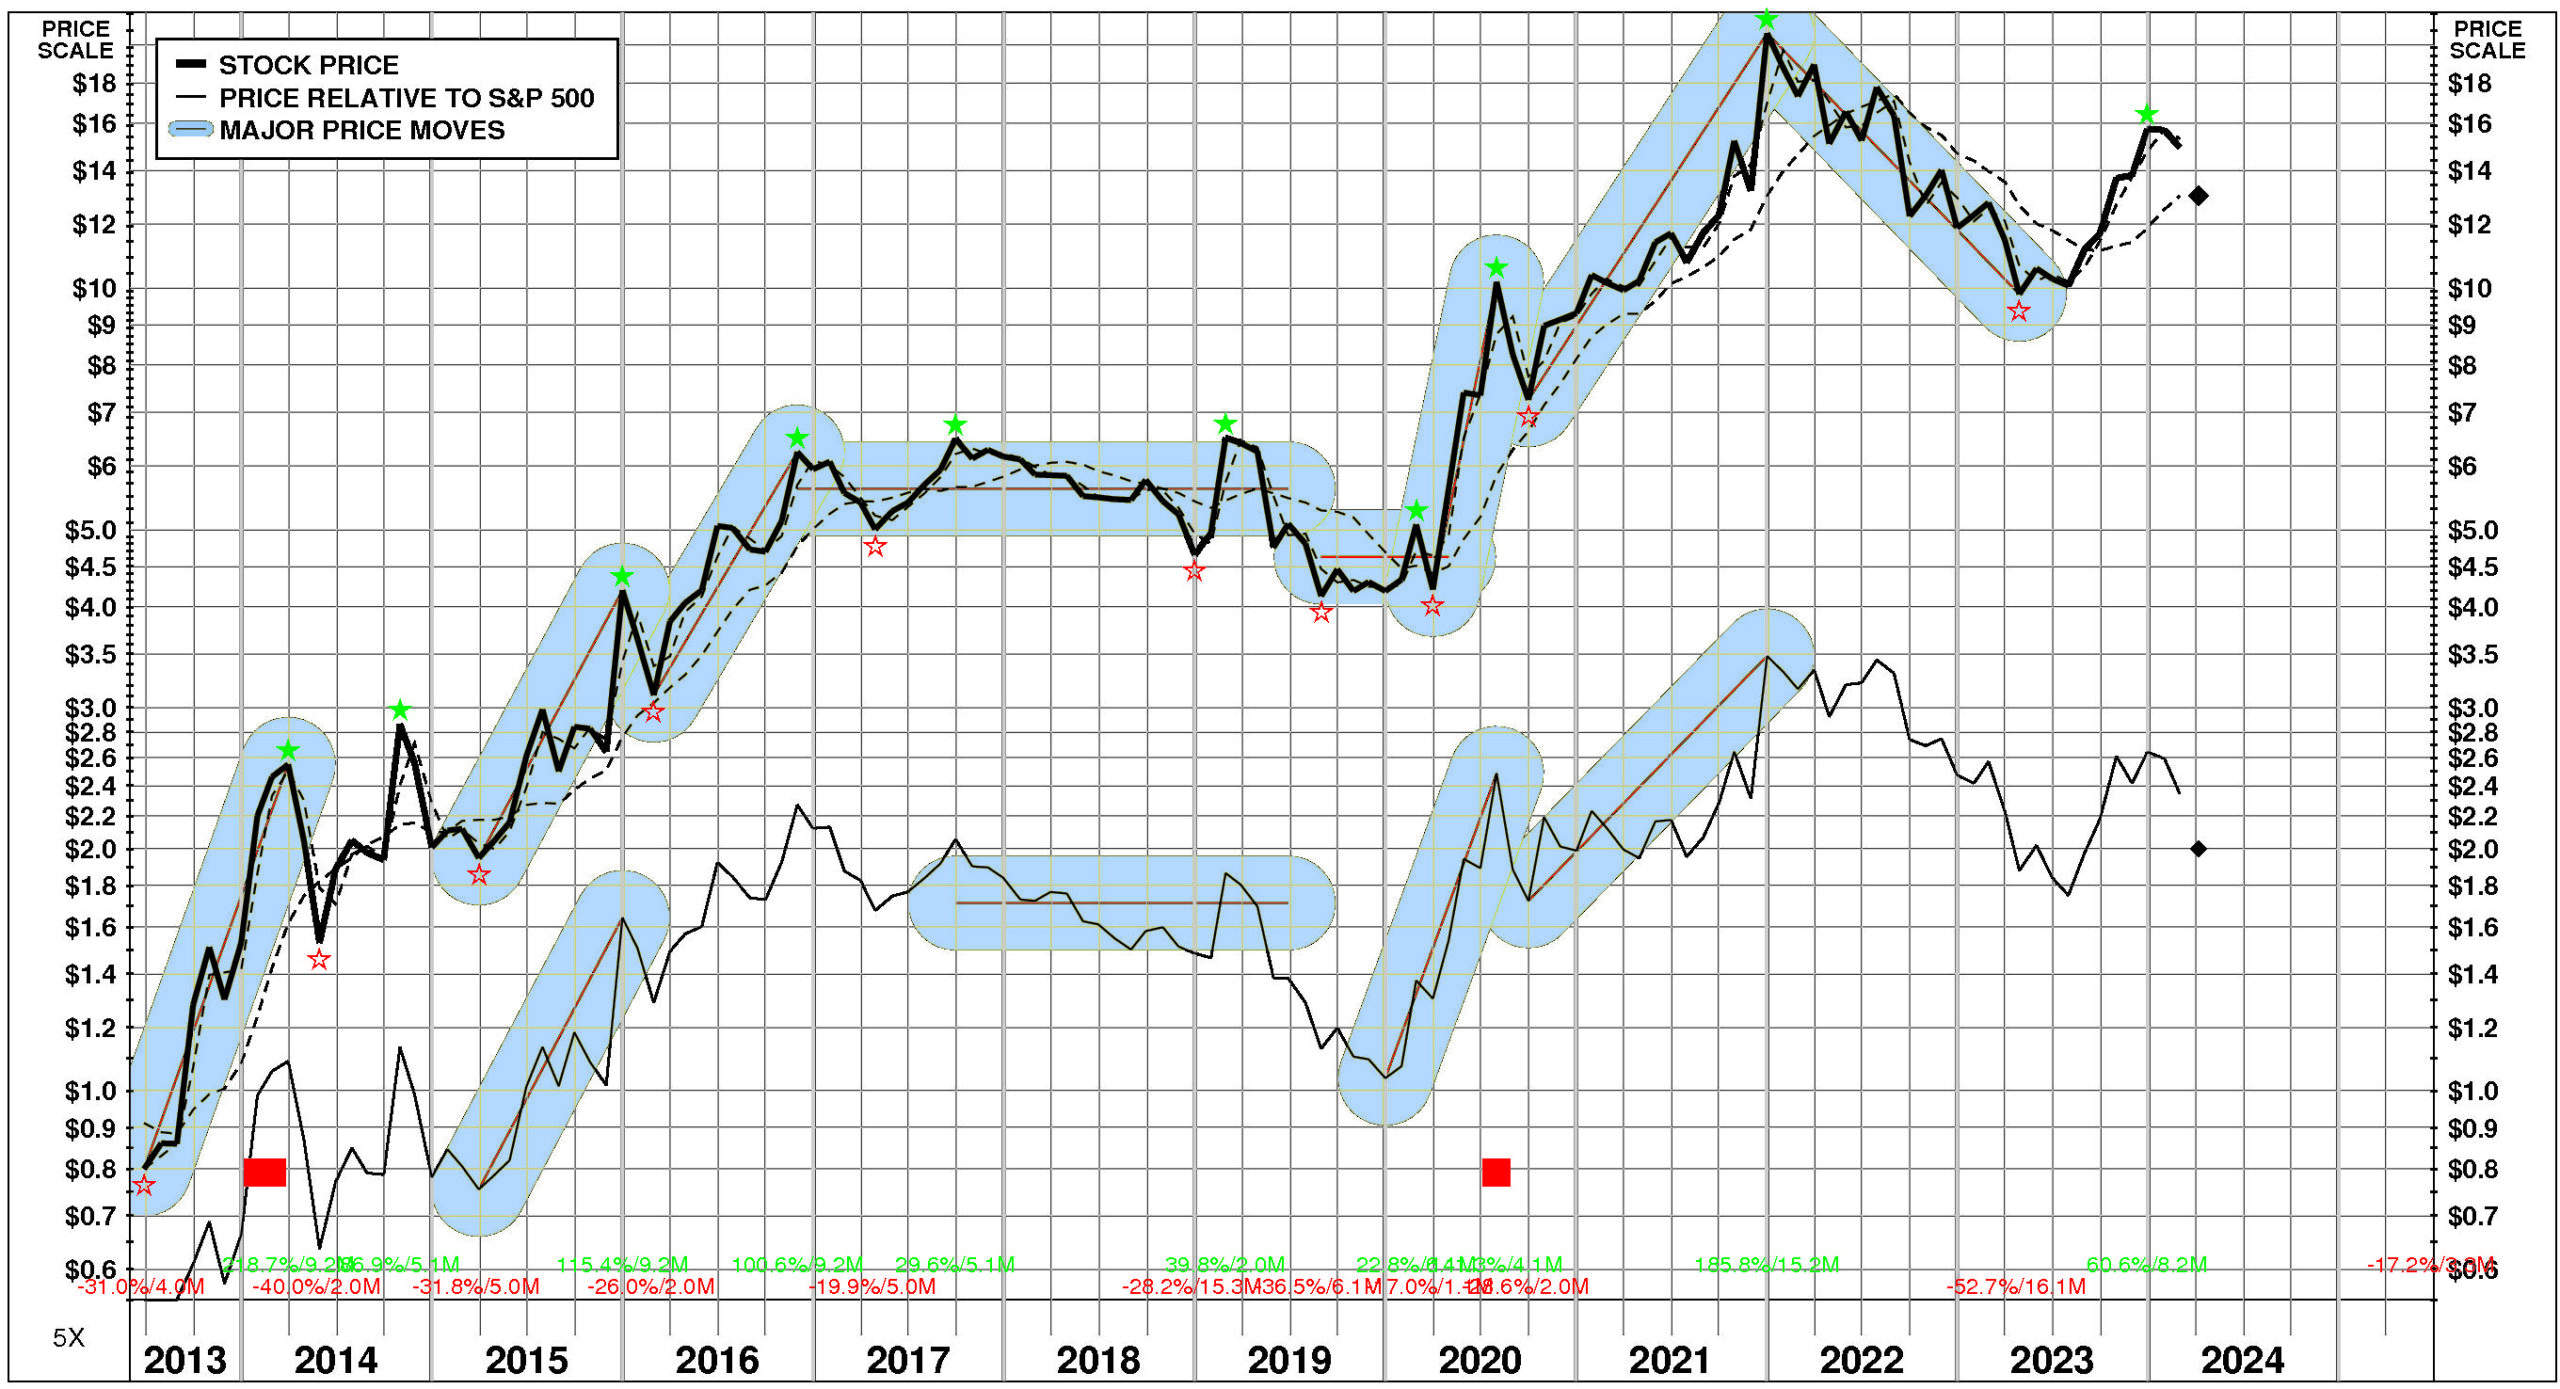
Over the full time period, DLH Holdings’ stock price performance has been volatile and exceptional. Between June, 2013 and April, 2024, DLH Holdings’ stock price rose +1530%; relative to the market, this was a +403% gain. Significant price moves during the period: 1) December, 2021 – April, 2023: -53%; 2) September, 2020 – December, 2021: +186%; 3) March, 2020 – July, 2020: +141%; 4) February, 2016 – November, 2016: +101%; 5) March, 2015 – December, 2015: +115%; and 6) June, 2013 – March, 2014: +219%.
TOTAL INVESTMENT RETURNS
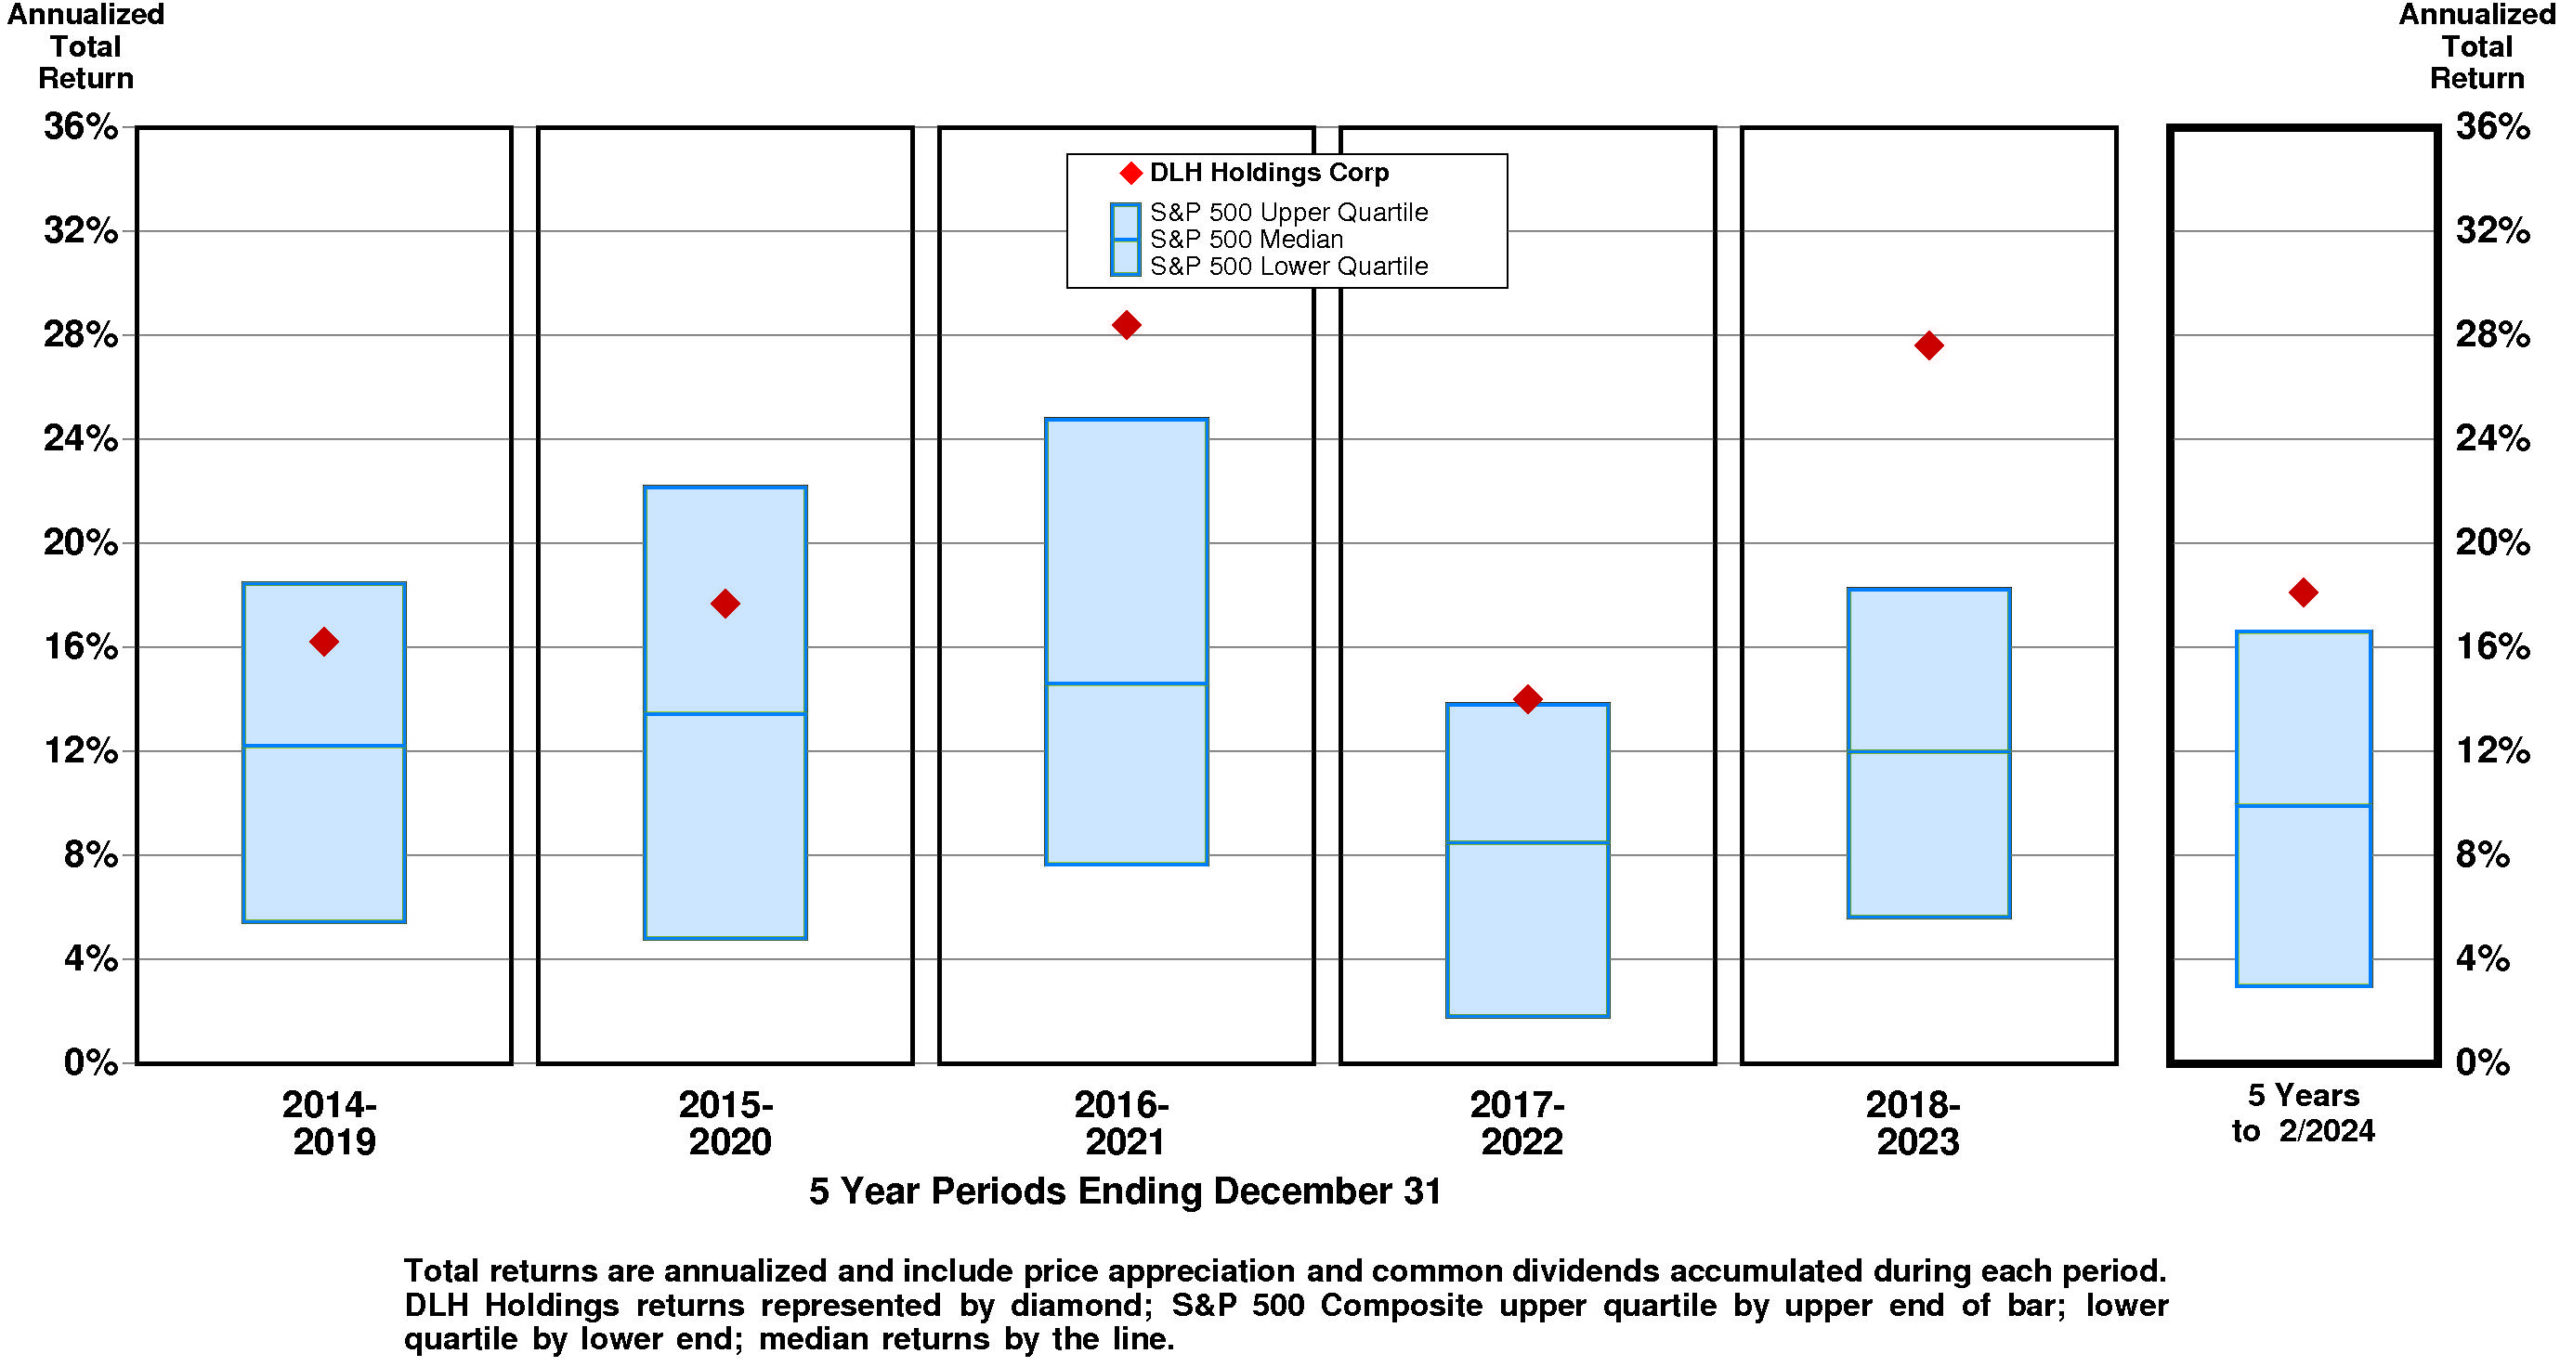
Current annual total return performance of 17.2% is above median relative to the S&P 500 Composite.
In addition to being above median relative to S&P 500 Composite, current annual total return performance through February, 2024 of 17.2% is at median relative to DLH Holdings Corp Peer Group.
Current 5-year total return performance of 18.1% is upper quartile relative to the S&P 500 Composite.
Through February, 2024, with upper quartile current 5-year total return of 18.1% relative to S&P 500 Composite, DLH Holdings’ total return performance is at the upper quartile relative to DLH Holdings Corp Peer Group.
VALUATION BENCHMARKS
Relative to S&P 500 Composite, DLHC’s overall valuation is low. The highest factor, the price/earnings ratio, is upper quartile. Ratio of enterprise value/assets is near the lower quartile. Ratio of enterprise value/earnings before interest and taxes is lower quartile. Price/equity ratio is lower quartile. The lowest factor, the ratio of enterprise value/revenue, is lower quartile.
Relative to DLH Holdings Peer Group, DLHC’s overall valuation is high. The highest factor, the price/earnings ratio, is upper quartile. Ratio of enterprise value/revenue is near the upper quartile. Ratio of enterprise value/assets is above median. Price/equity ratio is near the upper quartile. The lowest factor, the ratio of enterprise value/earnings before interest and taxes, is at the lower quartile.
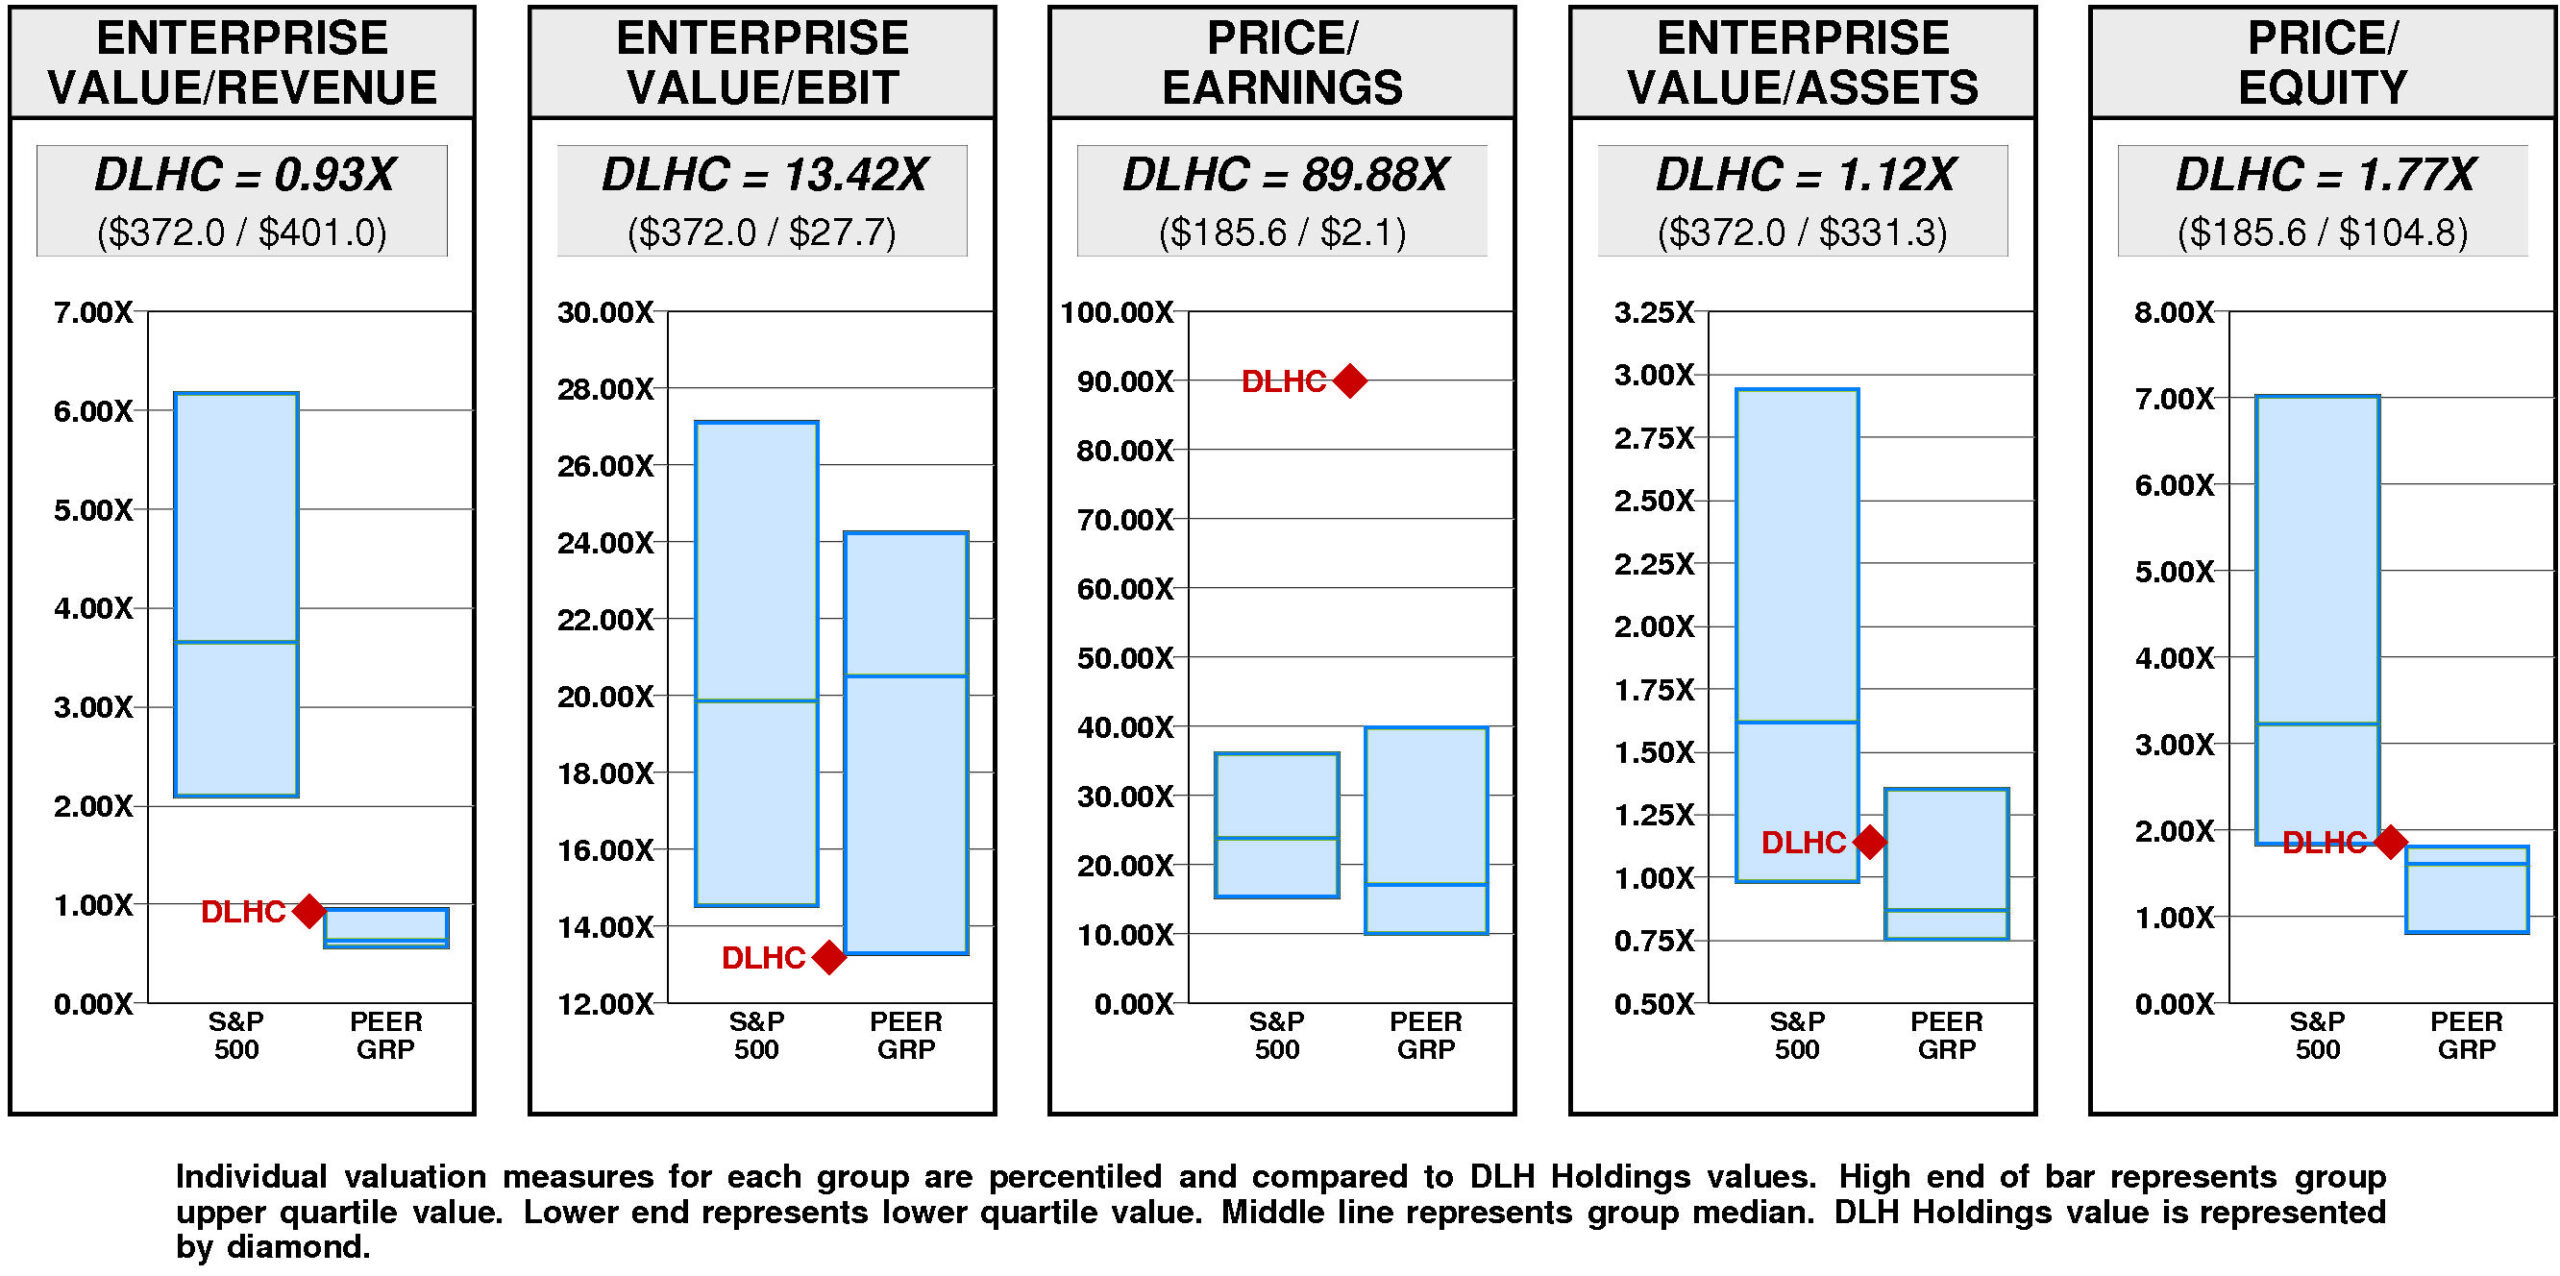
DLH Holdings has a major value gap compared to the median. For DLHC to achieve median valuation, its current ratio of enterprise value/revenue would have to fall from the current level of 0.93X to 0.64X. If DLHC’s ratio of enterprise value/revenue were to fall to 0.64X, its stock price would be lower by $-8 to $5.
For DLHC to achieve upper quartile valuation relative to the DLH Holdings Peer Group, its current ratio of enterprise value/revenue would have to rise from the current level of 0.93X to 0.95X. If DLHC’s ratio of enterprise value/revenue were to rise to 0.95X, its stock price would increase by $1 from the current level of $13.
VALUE TARGETS
DLHC is expected to continue to be a modest Value Builder reflecting capital returns that are forecasted to exceed the cost of capital.
DLH Holdings’ current Price Target of $18 represents a +37% change from the current price of $13.04.
This neutral appreciation potential results in an appreciation score of 51 (49% of the universe has greater appreciation potential.)
With this neutral Appreciation Score of 51, the high Power Rating of 84 results in an Value Trend Rating of B.
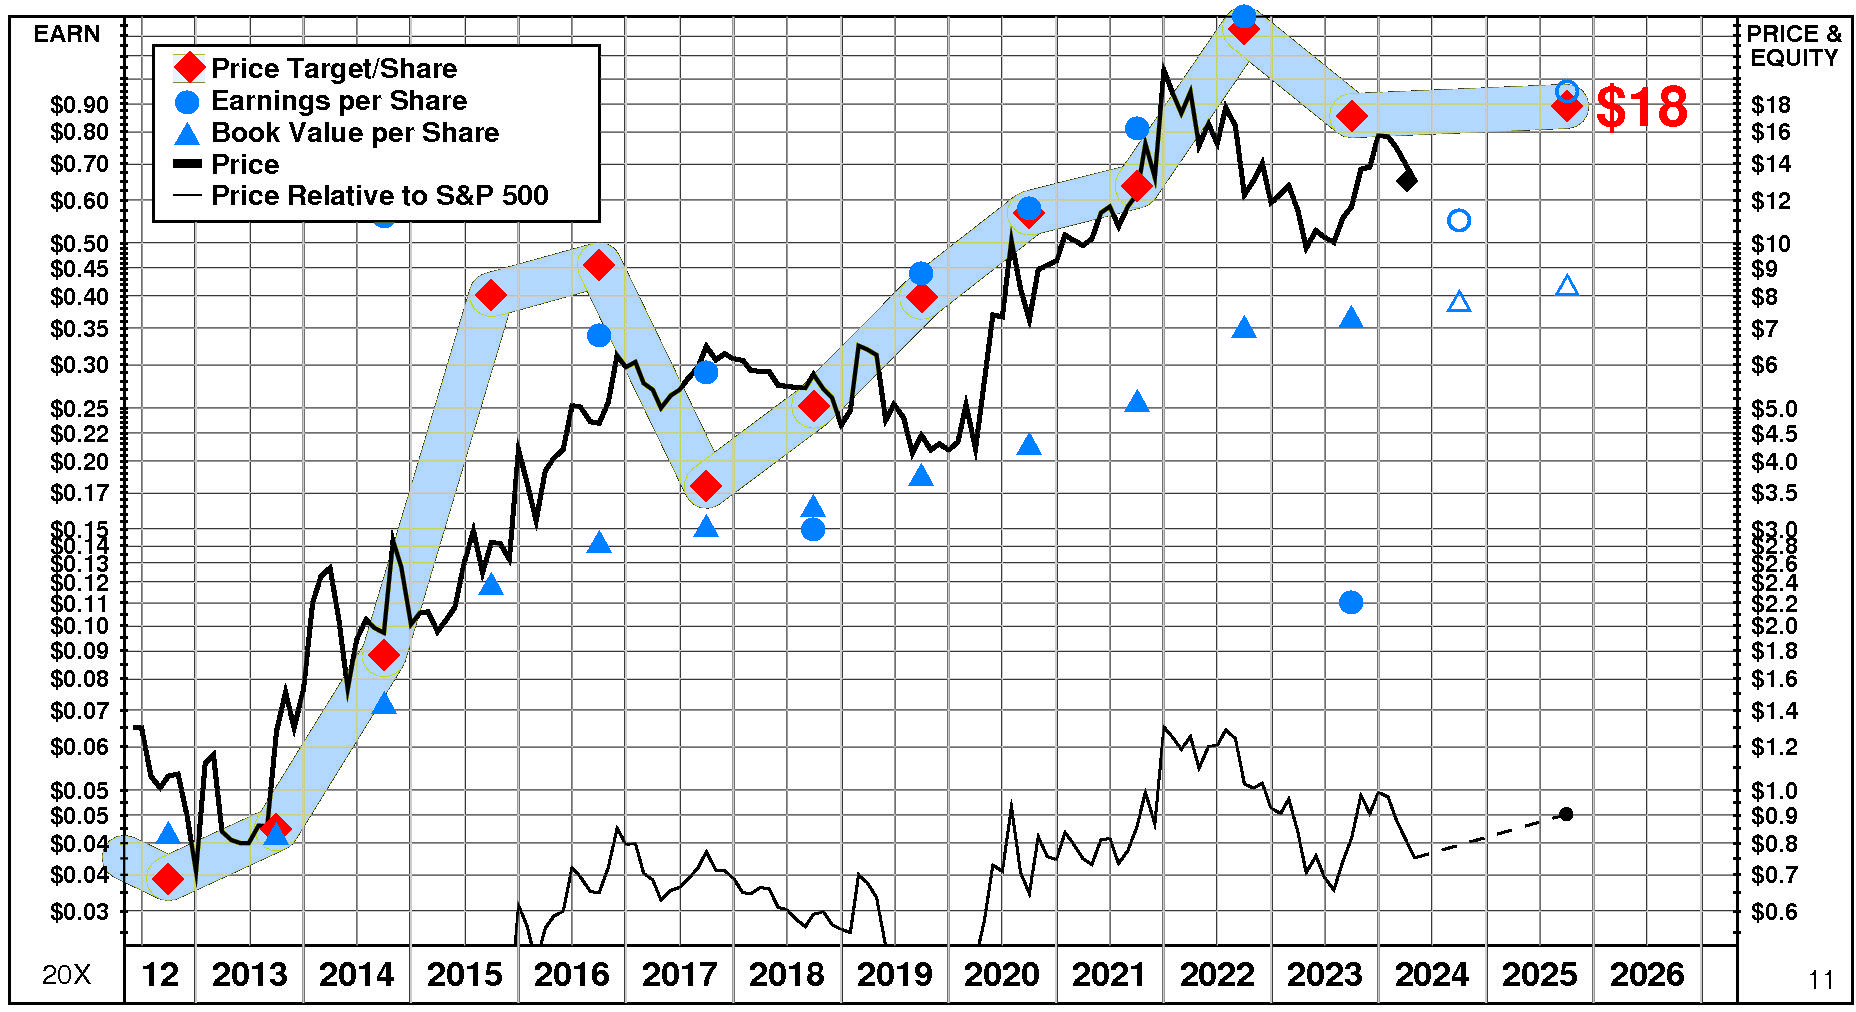
DLH Holdings’ current Price Target is $18 (+4% from the 2023 Target of $17 and +37% from the 04/05/24 price of $13.04). This plateau in the Target is the result of a +13% increase in the equity base and a -8% decrease in the price/equity multiple. The forecasted decline in return on equity has a very large negative impact on the price/equity multiple and the forecasted decline in growth has a large negative impact as well. Partially offsetting these Drivers, the forecasted decline in cost of equity has a very large positive impact.
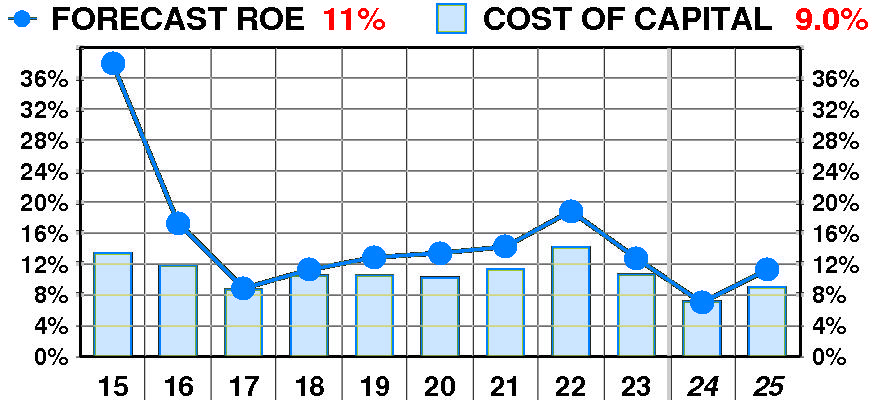
PTR’s return on equity forecast is 11.3% — in line with our recent forecasts. Forecasted return on equity suffered a dramatic, erratic decline between 2015 and 2023. The current forecast is significantly below the 2015 peak of 38%.
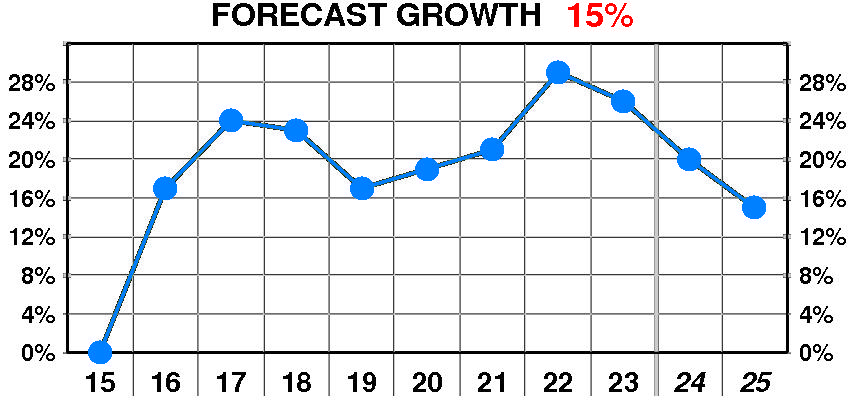
PTR’s growth forecast is 15.0% — significantly below our recent forecasts. Forecasted growth enjoyed a dramatic, erratic increase between 2016 and 2023. The current forecast is well below the 2017 peak of 24%.
PTR’s cost of equity forecast is 9.0% — in line with recent levels. Forecasted cost of equity erratic but little changed between 2015 and 2023. The current forecast is well below the 2022 peak of 14.2%.
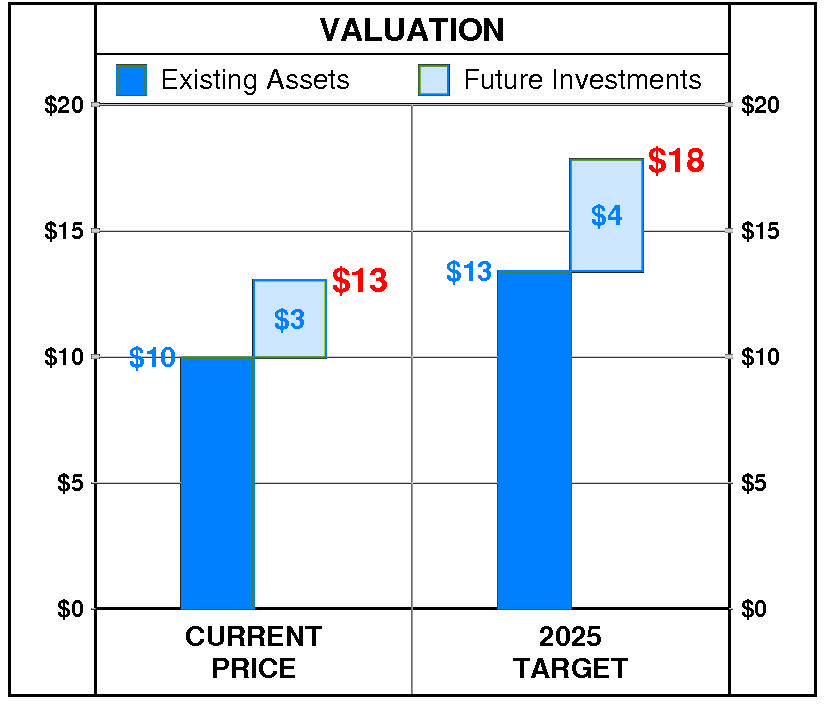
At DLH Holdings’ current price of $13.04, investors are placing a positive value of $3 on its future investments. This view is consistent with the company’s most recent performance that reflected a growth rate of 26.0% per year, and a return on equity of 12.7% versus a cost of equity of 10.6%.
PTR’s 2025 Price Target of $18 is based on these forecasts and reflects an estimated value of existing assets of $13 and a value of future investments of $4.
Be the first to comment