![]()
BUSINESS
Gray Television, Inc., a television broadcasting company, owns and/or operates television stations and digital assets in the United States. It also broadcasts secondary digital channels affiliated to ABC, CBS, NBC, and FOX, as well as various other networks and program services, including CW Plus Network, MY Network, the MeTV Network, Justice, This TV Network, Antenna TV, Telemundo, Cozi, Heroes and Icons, and MOVIES! Network; and local news/weather channels in various markets. In addition, the company offers video program production services. It owns and operates television stations and digital assets that serve 113 television markets in the United States. The company was formerly known as Gray Communications Systems, Inc. and changed its name to Gray Television, Inc. in August 2002. Gray Television, Inc. was founded in 1891 and is headquartered in Atlanta, Georgia.
INVESTMENT RATING
GTN’s future returns on capital are forecasted to exceed the cost of capital. Accordingly, the company is expected to continue to be a modest Value Builder.
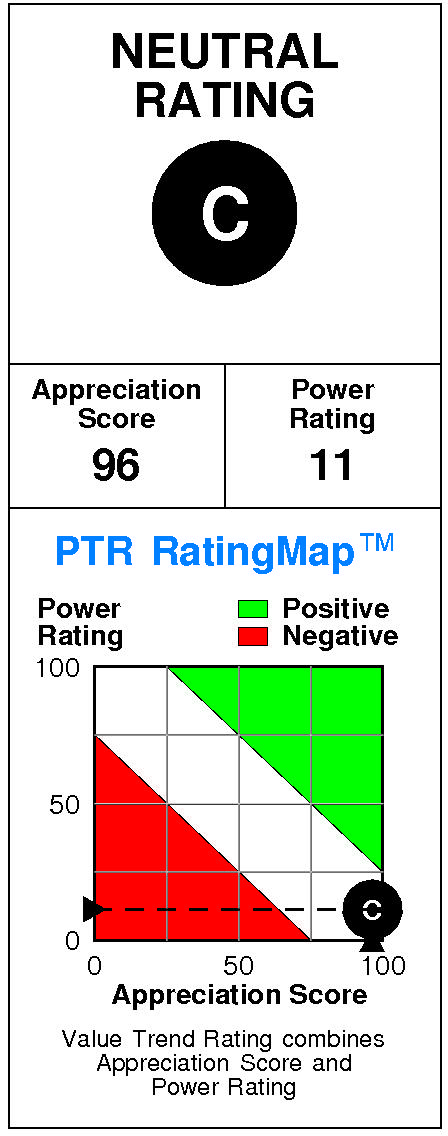
Gray Television has a current Value Trend Rating of C (Neutral).
With this rating, PTR’s two proprietary measures of a stock’s current attractiveness are providing very contradictory signals. Gray Television has a very high Appreciation Score of 96 but a very low Power Rating of 11, with the Neutral Value Trend Rating the result.
Gray Television’s stock is selling well below targeted value. The current stock price of $5.83 compares to targeted value 12 months forward of $52.
Gray Television’s very high appreciation potential results in an appreciation score of 96 (only 4% of the universe has greater appreciation potential.)
Gray Television has a Power Rating of 11. (GTN’s very low Power Rating indicates that it only has a higher likelihood of achieving favorable investment performance over the near to intermediate term than 11% of companies in the universe.)
Factors contributing to this very low Power Rating include: GTN’s earnings estimates have fallen very significantly in recent months; recent price action has been unfavorable; and the Television Broadcast Stations comparison group is currently in an unfavorable position.
INVESTMENT PROFILE
GTN’s financial strength is average. Financial strength rating is 51.
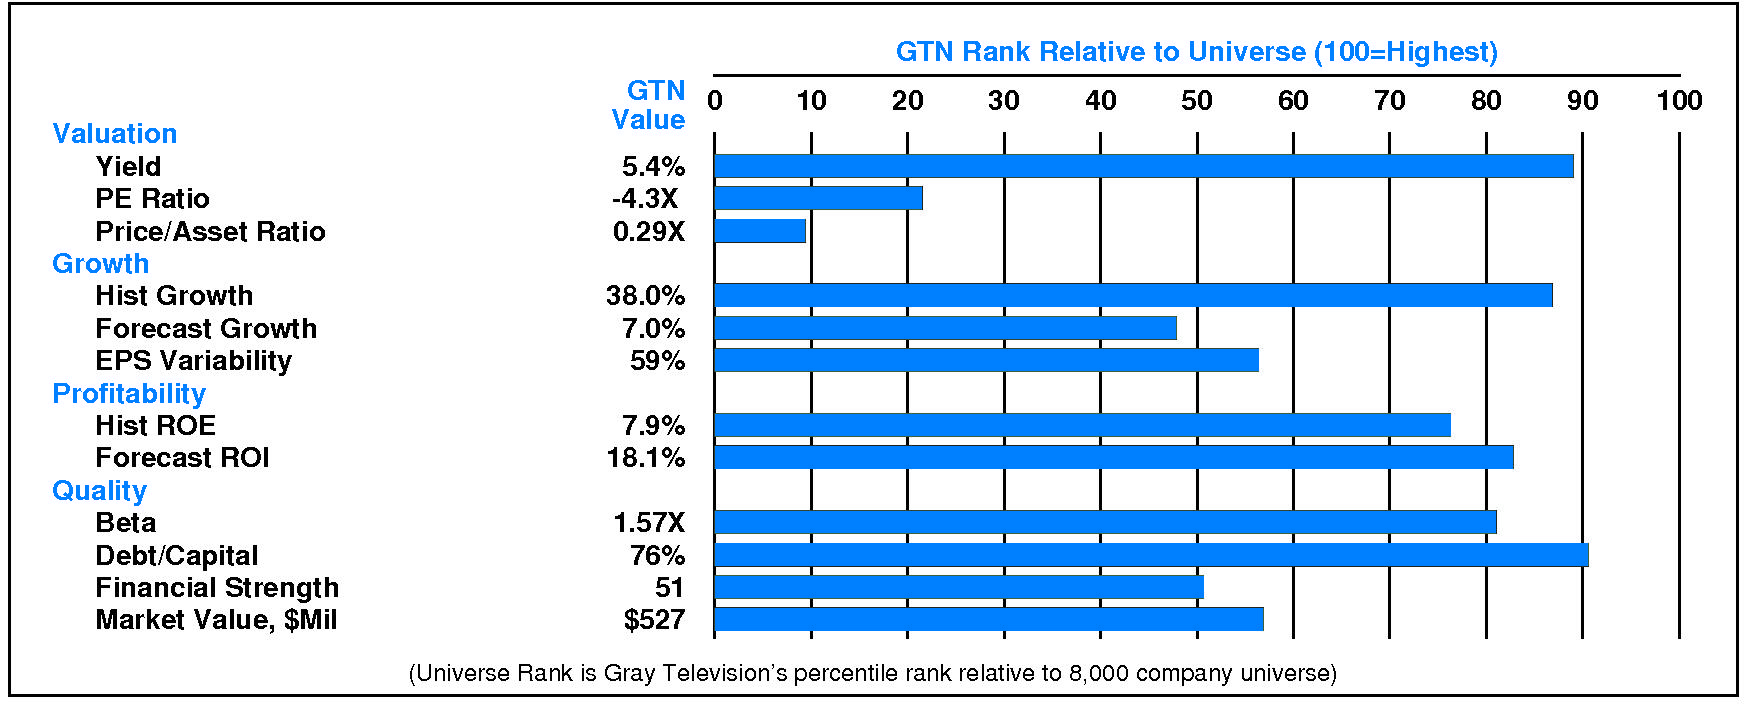
Relative to the S&P 500 Composite, Gray Television Inc. has moderate Value characteristics; its appeal is likely to be to investors heavily oriented toward Income; the perception is that GTN is higher risk. High historical growth is a positive for GTN. Relative weaknesses include: low historical profitability, low financial strength, high stock price volatility, and high financial leverage. GTN’s valuation is low: high dividend yield, low P/E ratio, and low price/book ratio. GTN has unusually low market capitalization.
CURRENT SIGNALS
Gray Television’s current operations are strong. Return on equity is rising, reflecting: improving asset utilization; widening pretax margins; rising tax keep rate; and rising leverage.
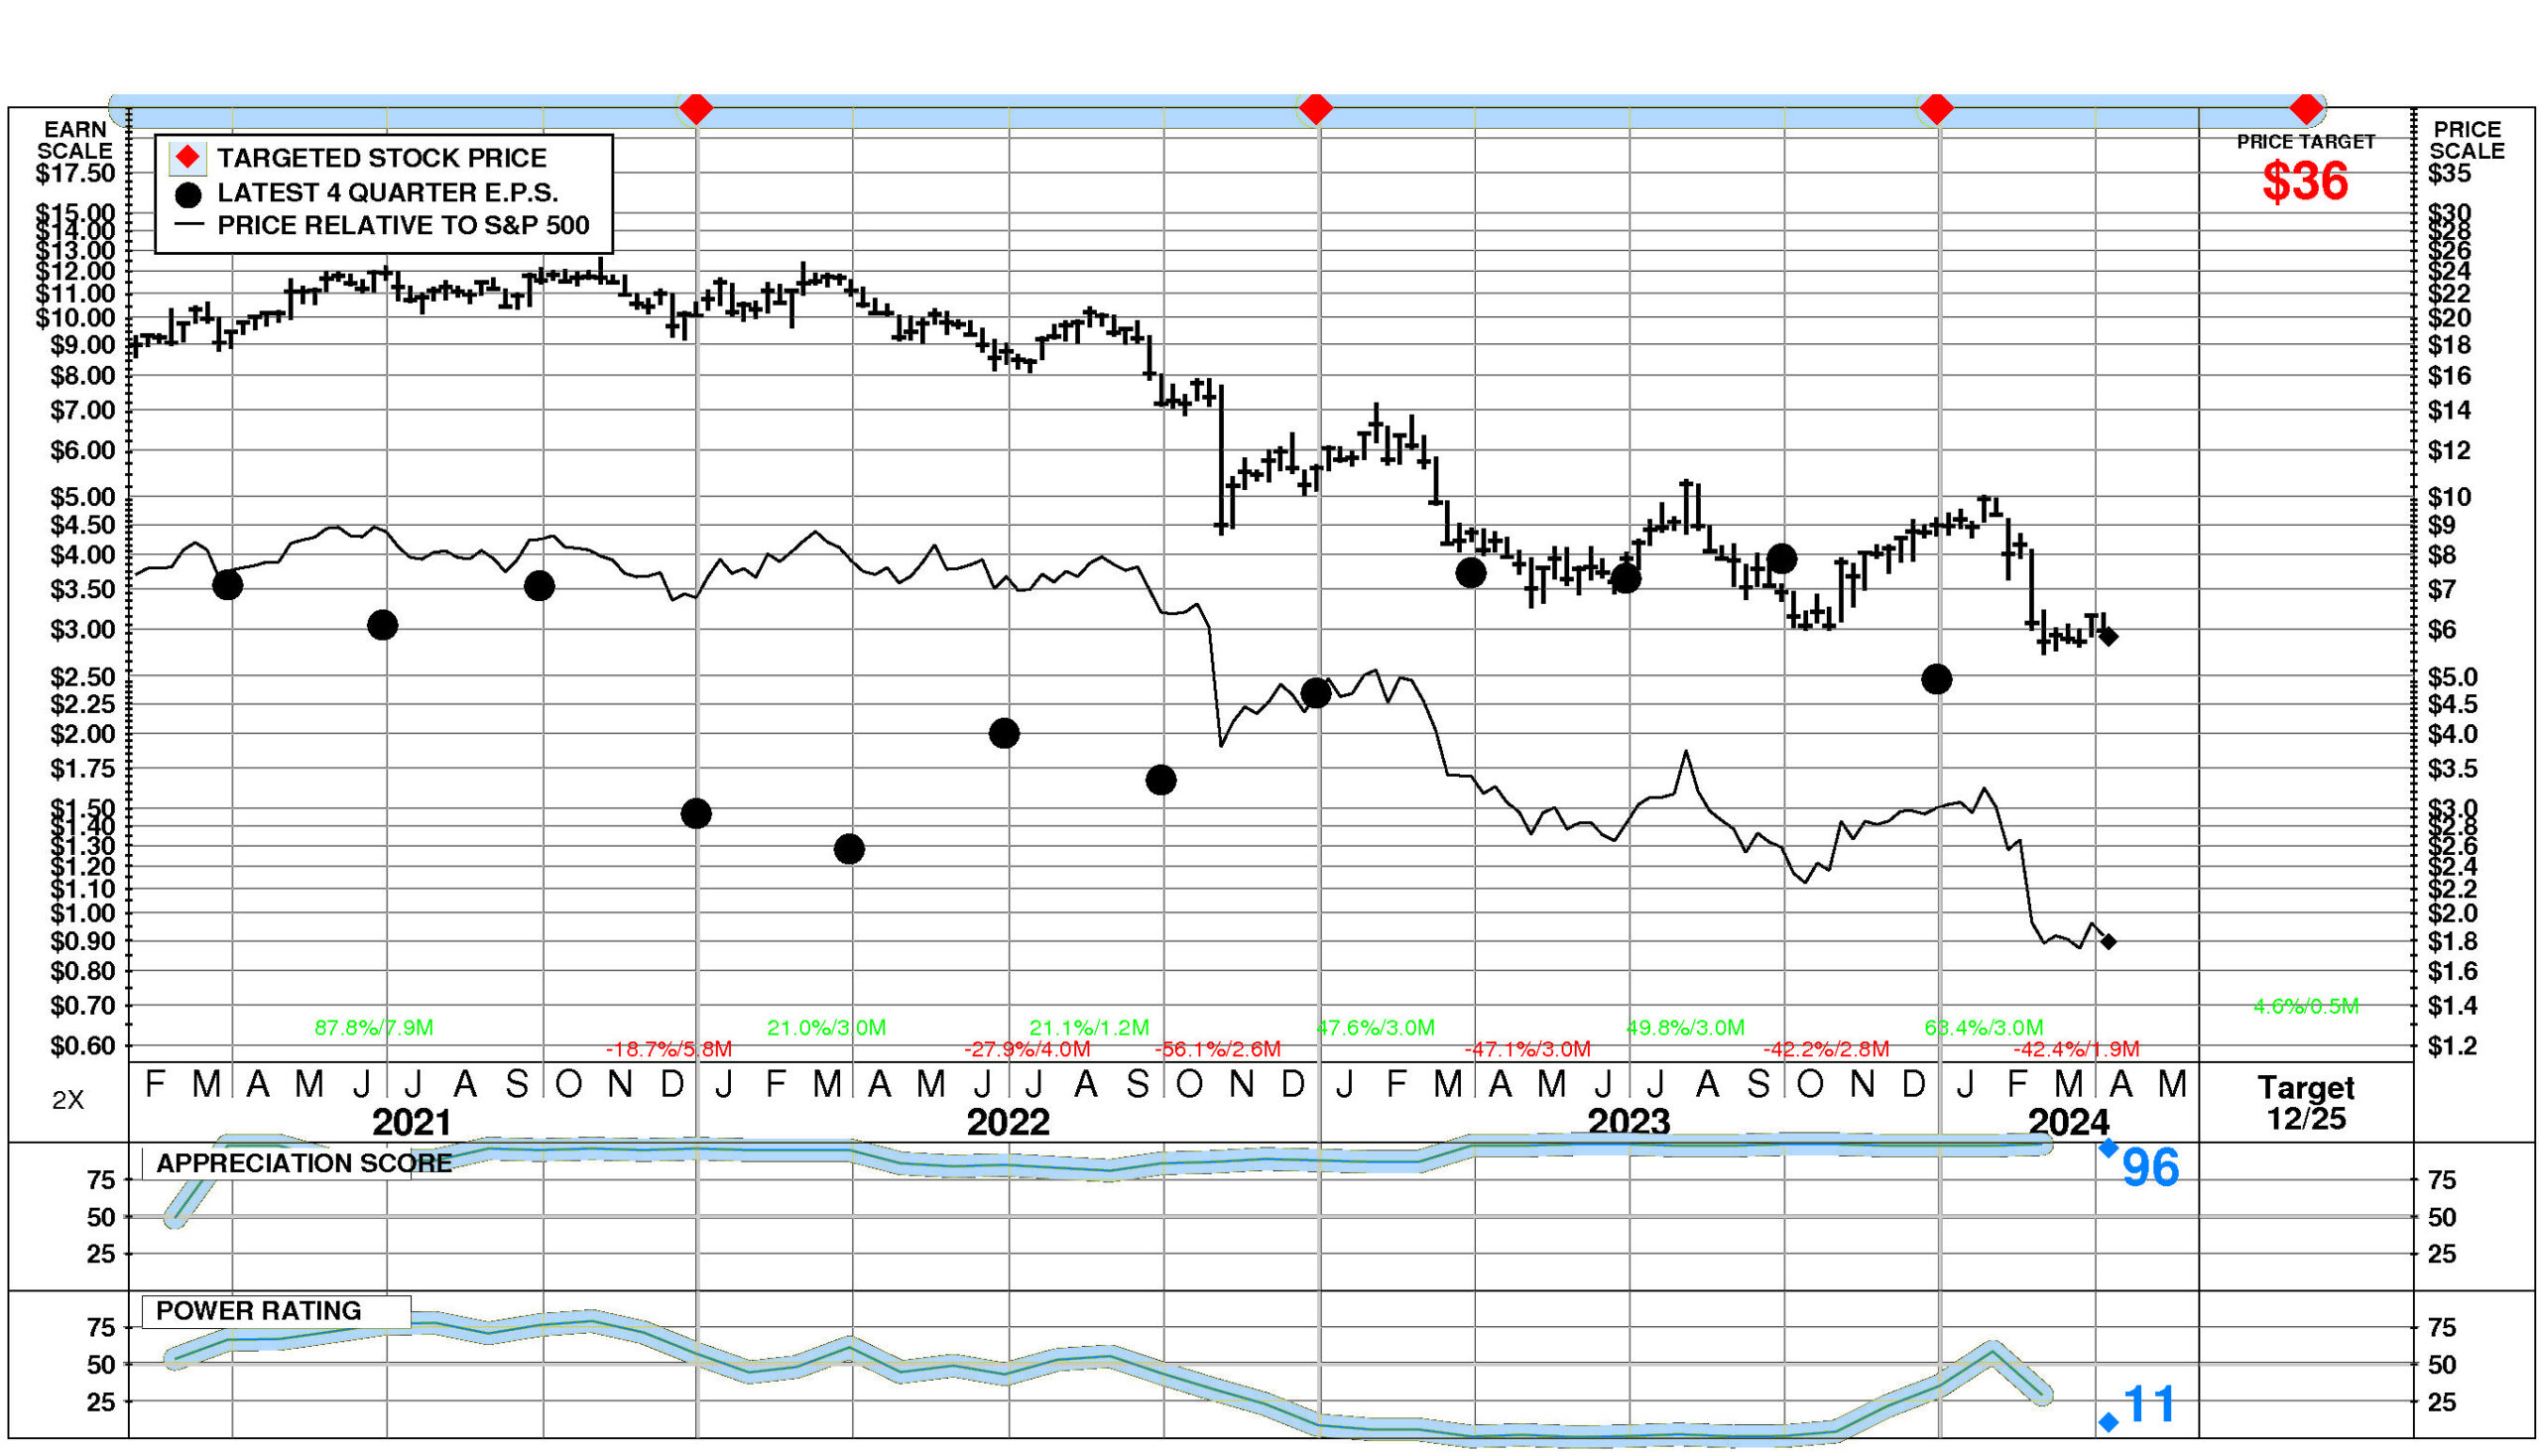
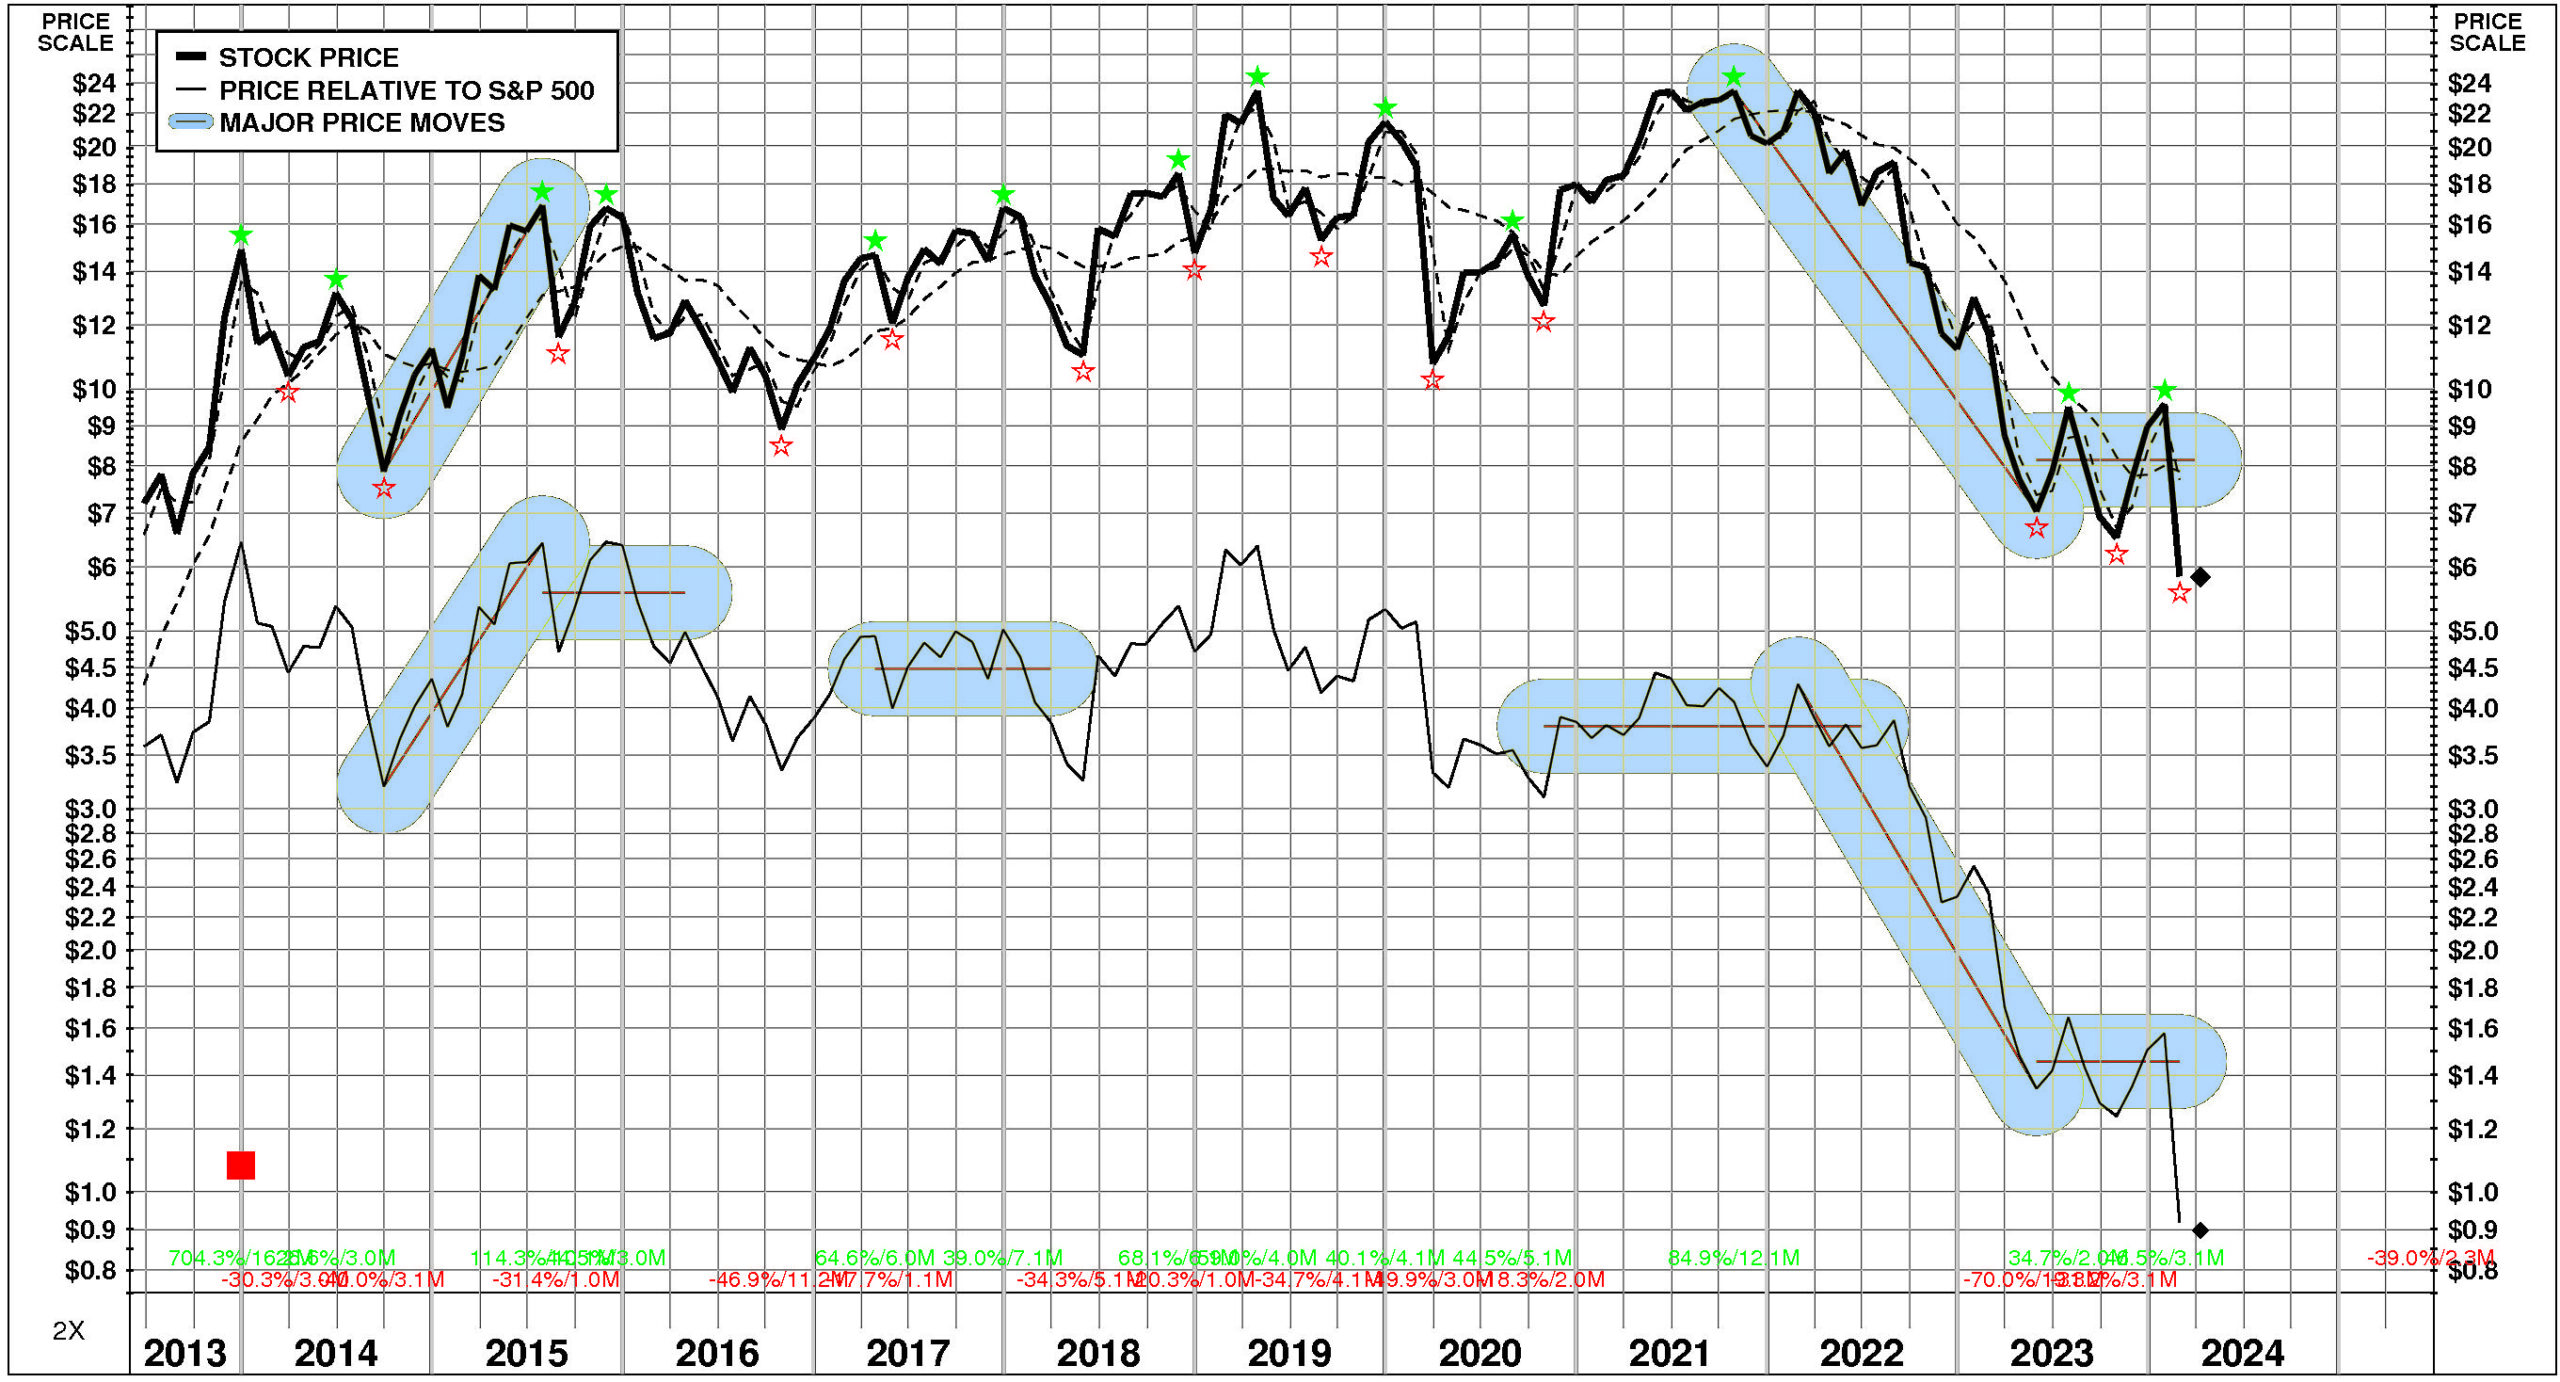
Gray Television’s current technical position is very weak. The stock price is in a 1.9 month down move. The stock has declined 29.8% from its prior high. The stock price is below its 200 day moving average which is in a downtrend.
ALERTS
Gray Television Inc. (NYSE: GTN) has recently experienced slight negative changes in fundamentals: significant quarterly earnings deceleration occurred.
The stock is currently rated C.
On 4/8/24, Gray Television Inc. (NYSE: GTN) stock declined by -2.3%, closing at $5.83. Moreover, trading volume in this decline was above average at 134% of normal. Relative to the market the stock has been weak over the last nine months and has declined -7.8% during the last week.
CASH FLOW
In 2023, Gray Television experienced a very significant reduction in cash of -$40.0 million (-66%). Sources of cash were much lower than uses. Cash generated from 2023 EBITDA totaled +$821.0 million. Non-operating uses consumed -$104.0 million (-13% of EBITDA). Cash taxes consumed -$89.0 million (-11% of EBITDA). Withdrawal of investment from the business totaled +$154.0 million (+19% of EBITDA). On a net basis, debt investors pulled out -$753.0 million (-92% of EBITDA) while equity investors removed -$69.0 million (-8% of EBITDA).
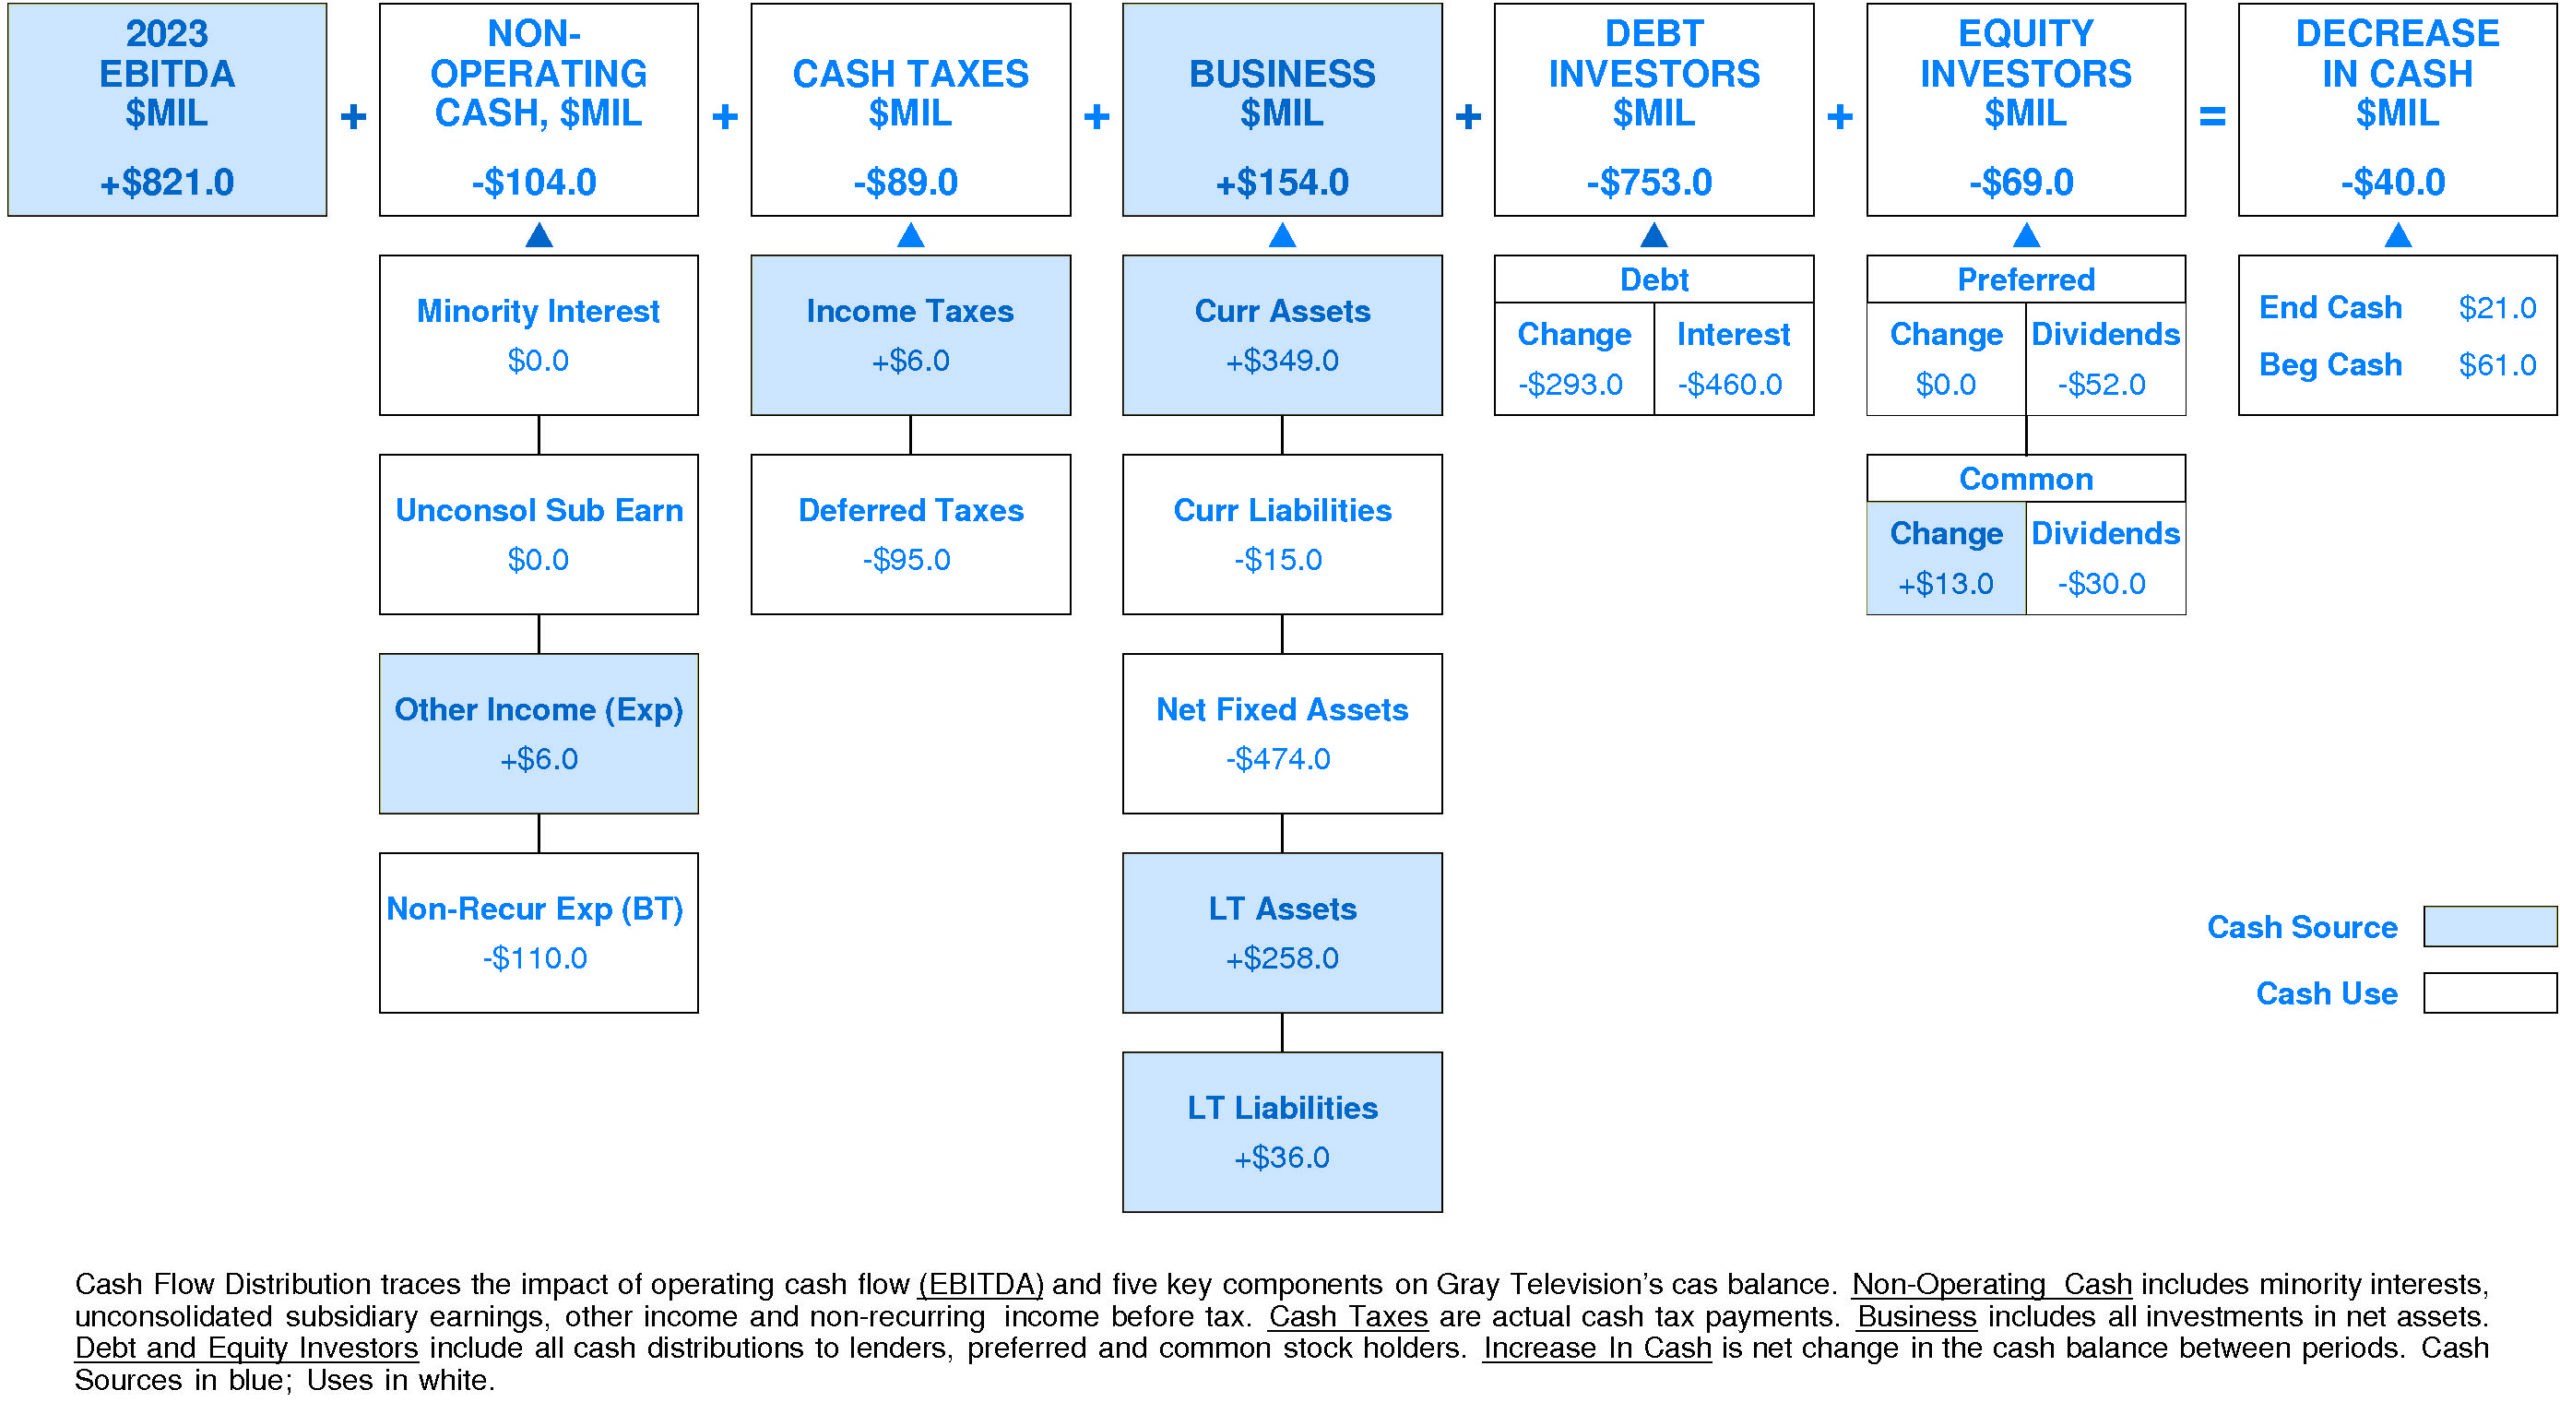
Gray Television’s Non-operating Income, %EBITDA has experienced a downtrend over the period. This downtrend was accompanied by stability for the Gray Television Peer Group. In most years, Gray Television was in the third quartile and second quartile. Currently, Gray Television is substantially below median at -13% of EBITDA (-$104.0 million).
Gray Television’s Cash Taxes, %EBITDA has exhibited little to no overall change over the period. This stability was accompanied by stability for the Gray Television Peer Group as well. In most years, Gray Television was in the top quartile and lower quartile. Currently, Gray Television is substantially below median at -11% of EBITDA (-$89.0 million).
Gray Television’s Business Re-investment, %EBITDA has enjoyed a volatile overall uptrend over the period. This improvement was accompanied by a similar trend for the Gray Television Peer Group. (Since 2021 Business Re-investment, %EBITDA has accelerated very sharply.) In most years, Gray Television was in the lower quartile and top quartile. Currently, Gray Television is upper quartile at +19% of EBITDA (+$154.0 million).
Gray Television’s Debt Investors, %EBITDA has experienced a volatile overall downtrend over the period. This downtrend was accompanied by a similar trend for the Gray Television Peer Group. (Since 2021 Debt Investors, %EBITDA has accelerated very sharply.) In most years, Gray Television was in the top quartile and third quartile. Currently, Gray Television is lower quartile at -92% of EBITDA (-$753.0 million).
Gray Television’s Equity Investors, %EBITDA has suffered a volatile overall downtrend over the period. This downtrend was accompanied by a similar trend for the Gray Television Peer Group. In most years, Gray Television was in the third quartile and top quartile. Currently, Gray Television is substantially below median at -8% of EBITDA (-$69.0 million).
Gray Television’s Change in Cash, %EBITDA has experienced a volatile overall downtrend over the period. This downtrend was accompanied by stability for the Gray Television Peer Group. (Since 2021 Change in Cash, %EBITDA has experienced a very sharp recovery.) In most years, Gray Television was in the top quartile and lower quartile. Currently, Gray Television is slightly below median at -5% of EBITDA (-$40.0 million).

Gray Television’s Cash, %Revenue has suffered a volatile overall downtrend over the period. This downtrend was accompanied by an opposite trend for the Gray Television Peer Group. (Since 2020 Cash, %Revenue has accelerated sharply.) In most years, Gray Television was in the top quartile and lower quartile. Currently, Gray Television is lower quartile at +1%.
PROFITABILITY
Gray Television’s return on equity has eroded very significantly since 2014. The current level is -3.9% versus the high of 22.2% and the low of -3.9%.
A major analytical focus for GTN is a very strong negative trend in pretax operating return significantly augmented by a very strong negative trend in non-operating factors.
The productivity of Gray Television’s assets rose over the full period 2014-2023: asset turnover has exhibited a volatile overall uptrend that sharply accelerated after the 2021 level.
More than offsetting this trend, however, pretax margin experienced a very strong overall downtrend that decelerated very sharply from the 2022 level.
Non-operating factors (income taxes and financial leverage) had a significant negative influence on return on equity.
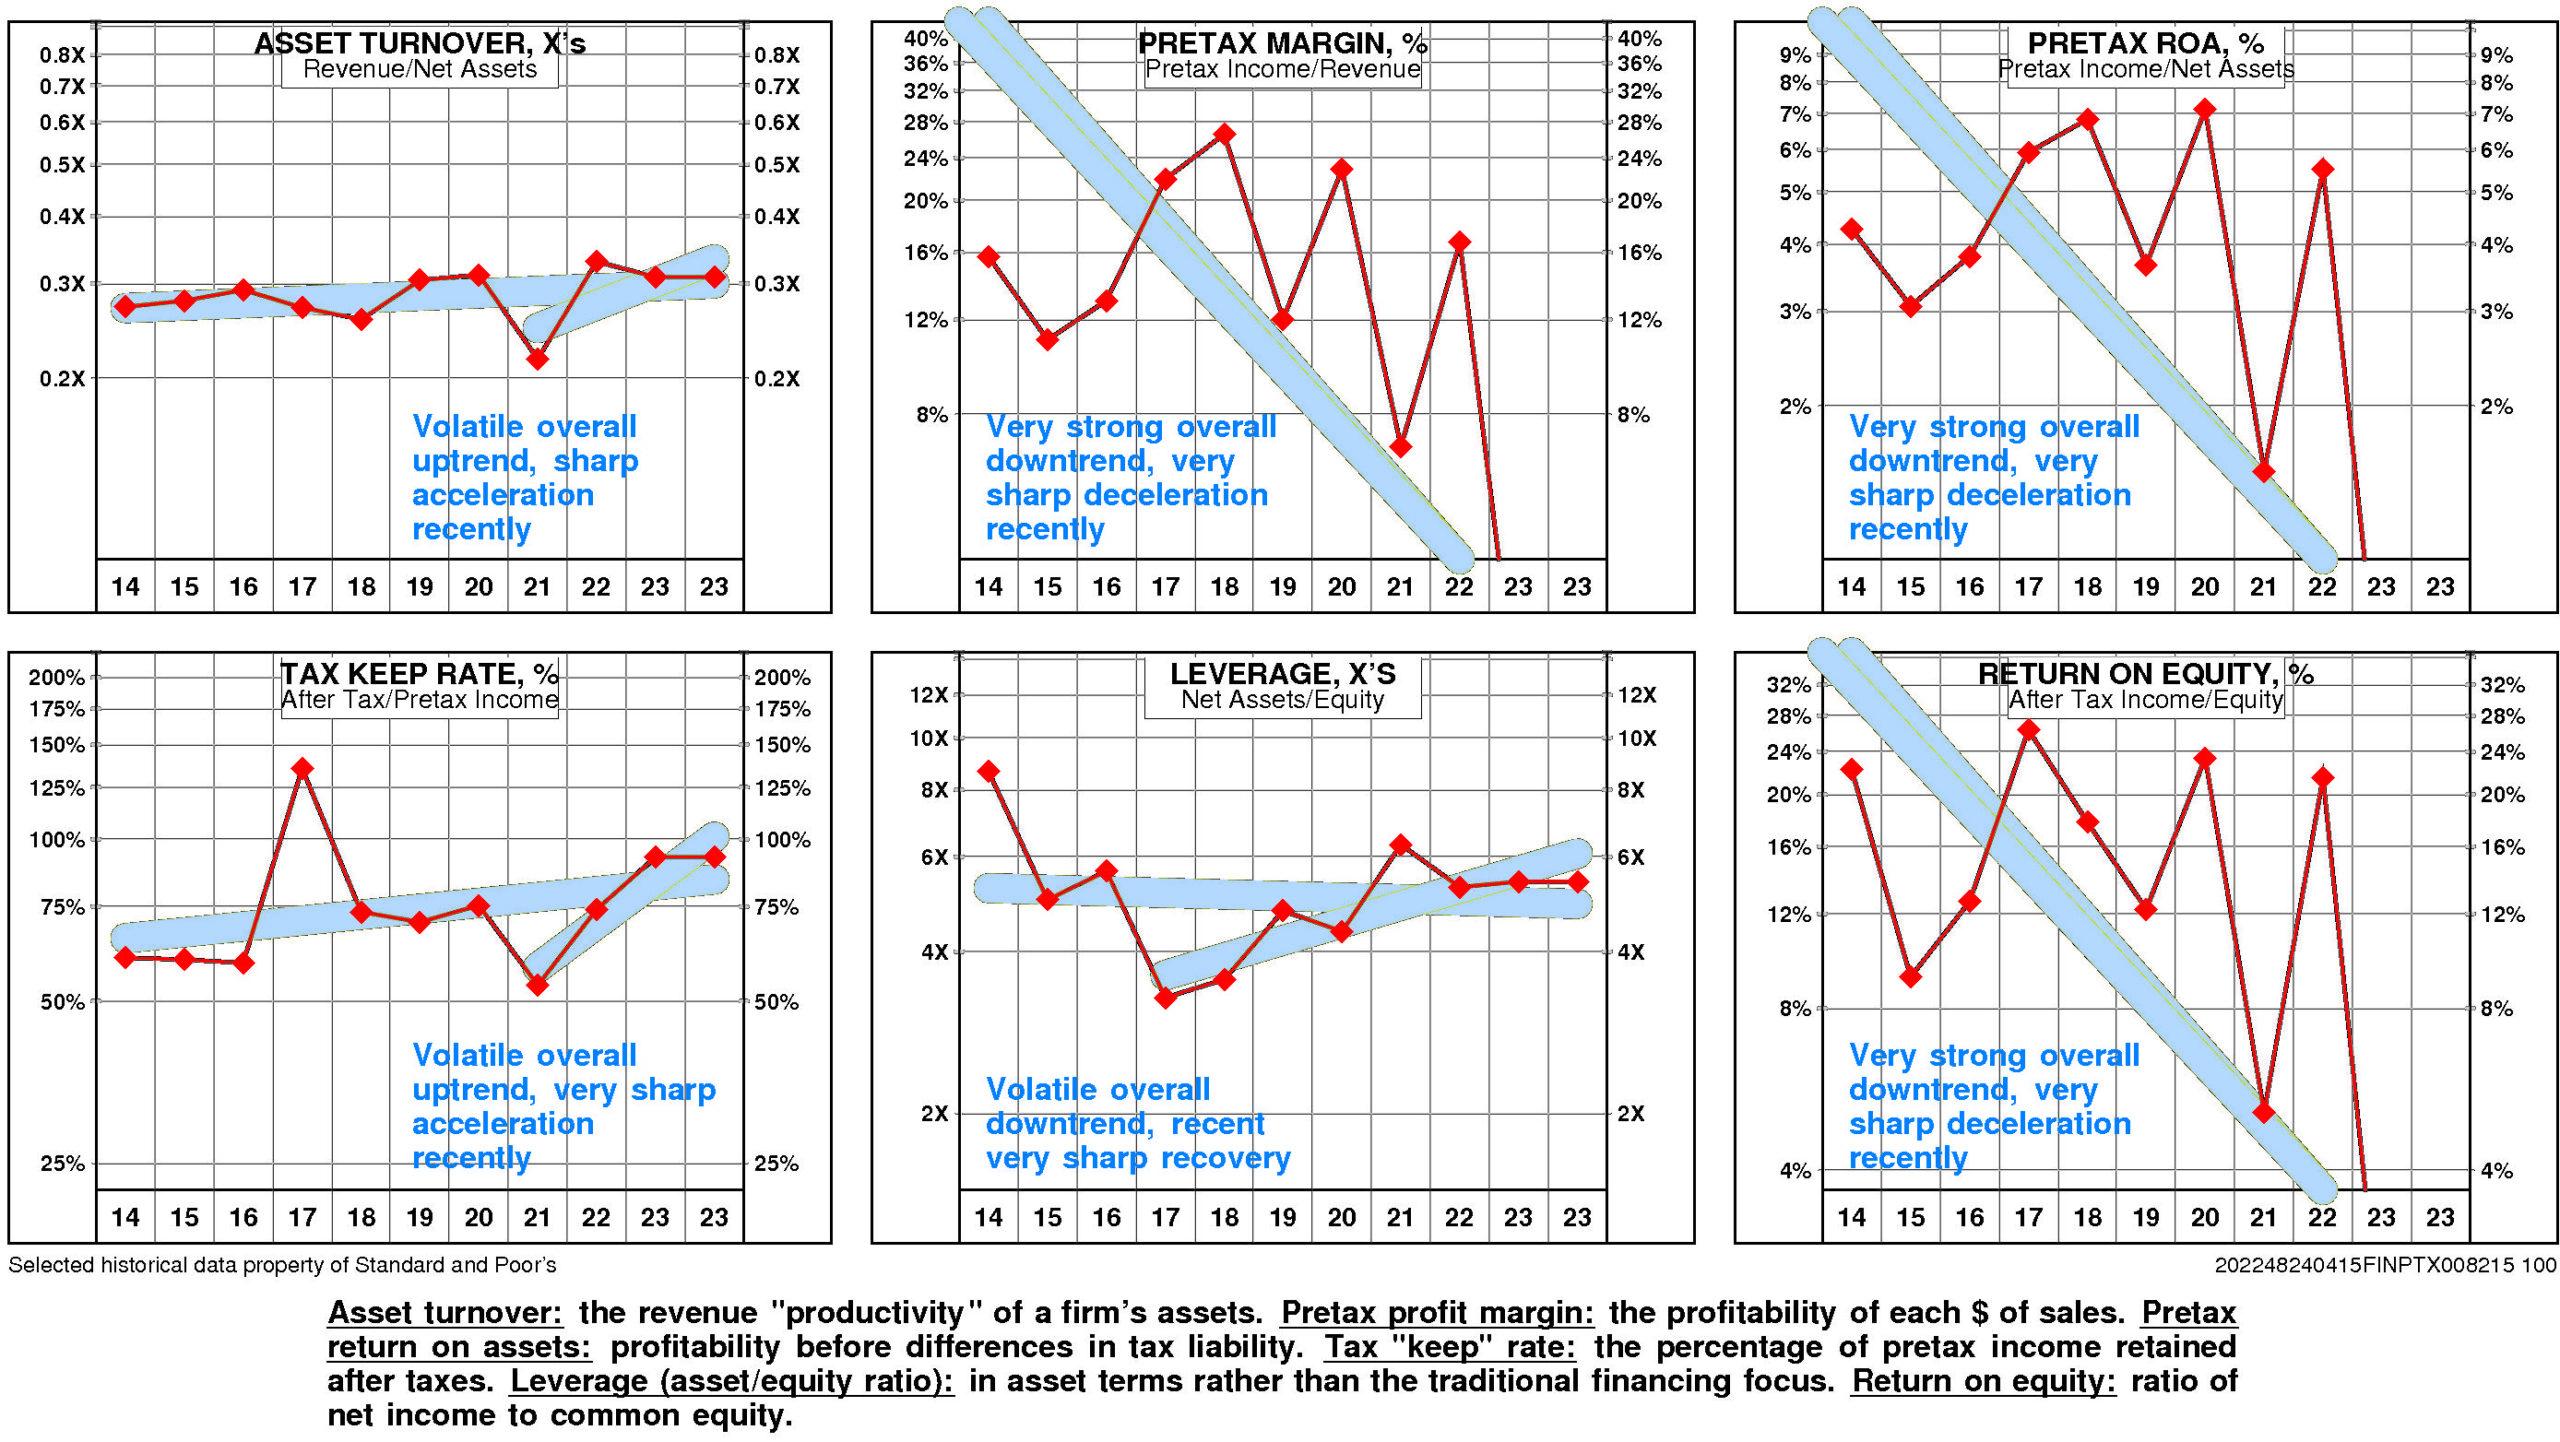
Gray Television’s return on equity is lower quartile (-3.9%) for the four quarters ended December, 2023.
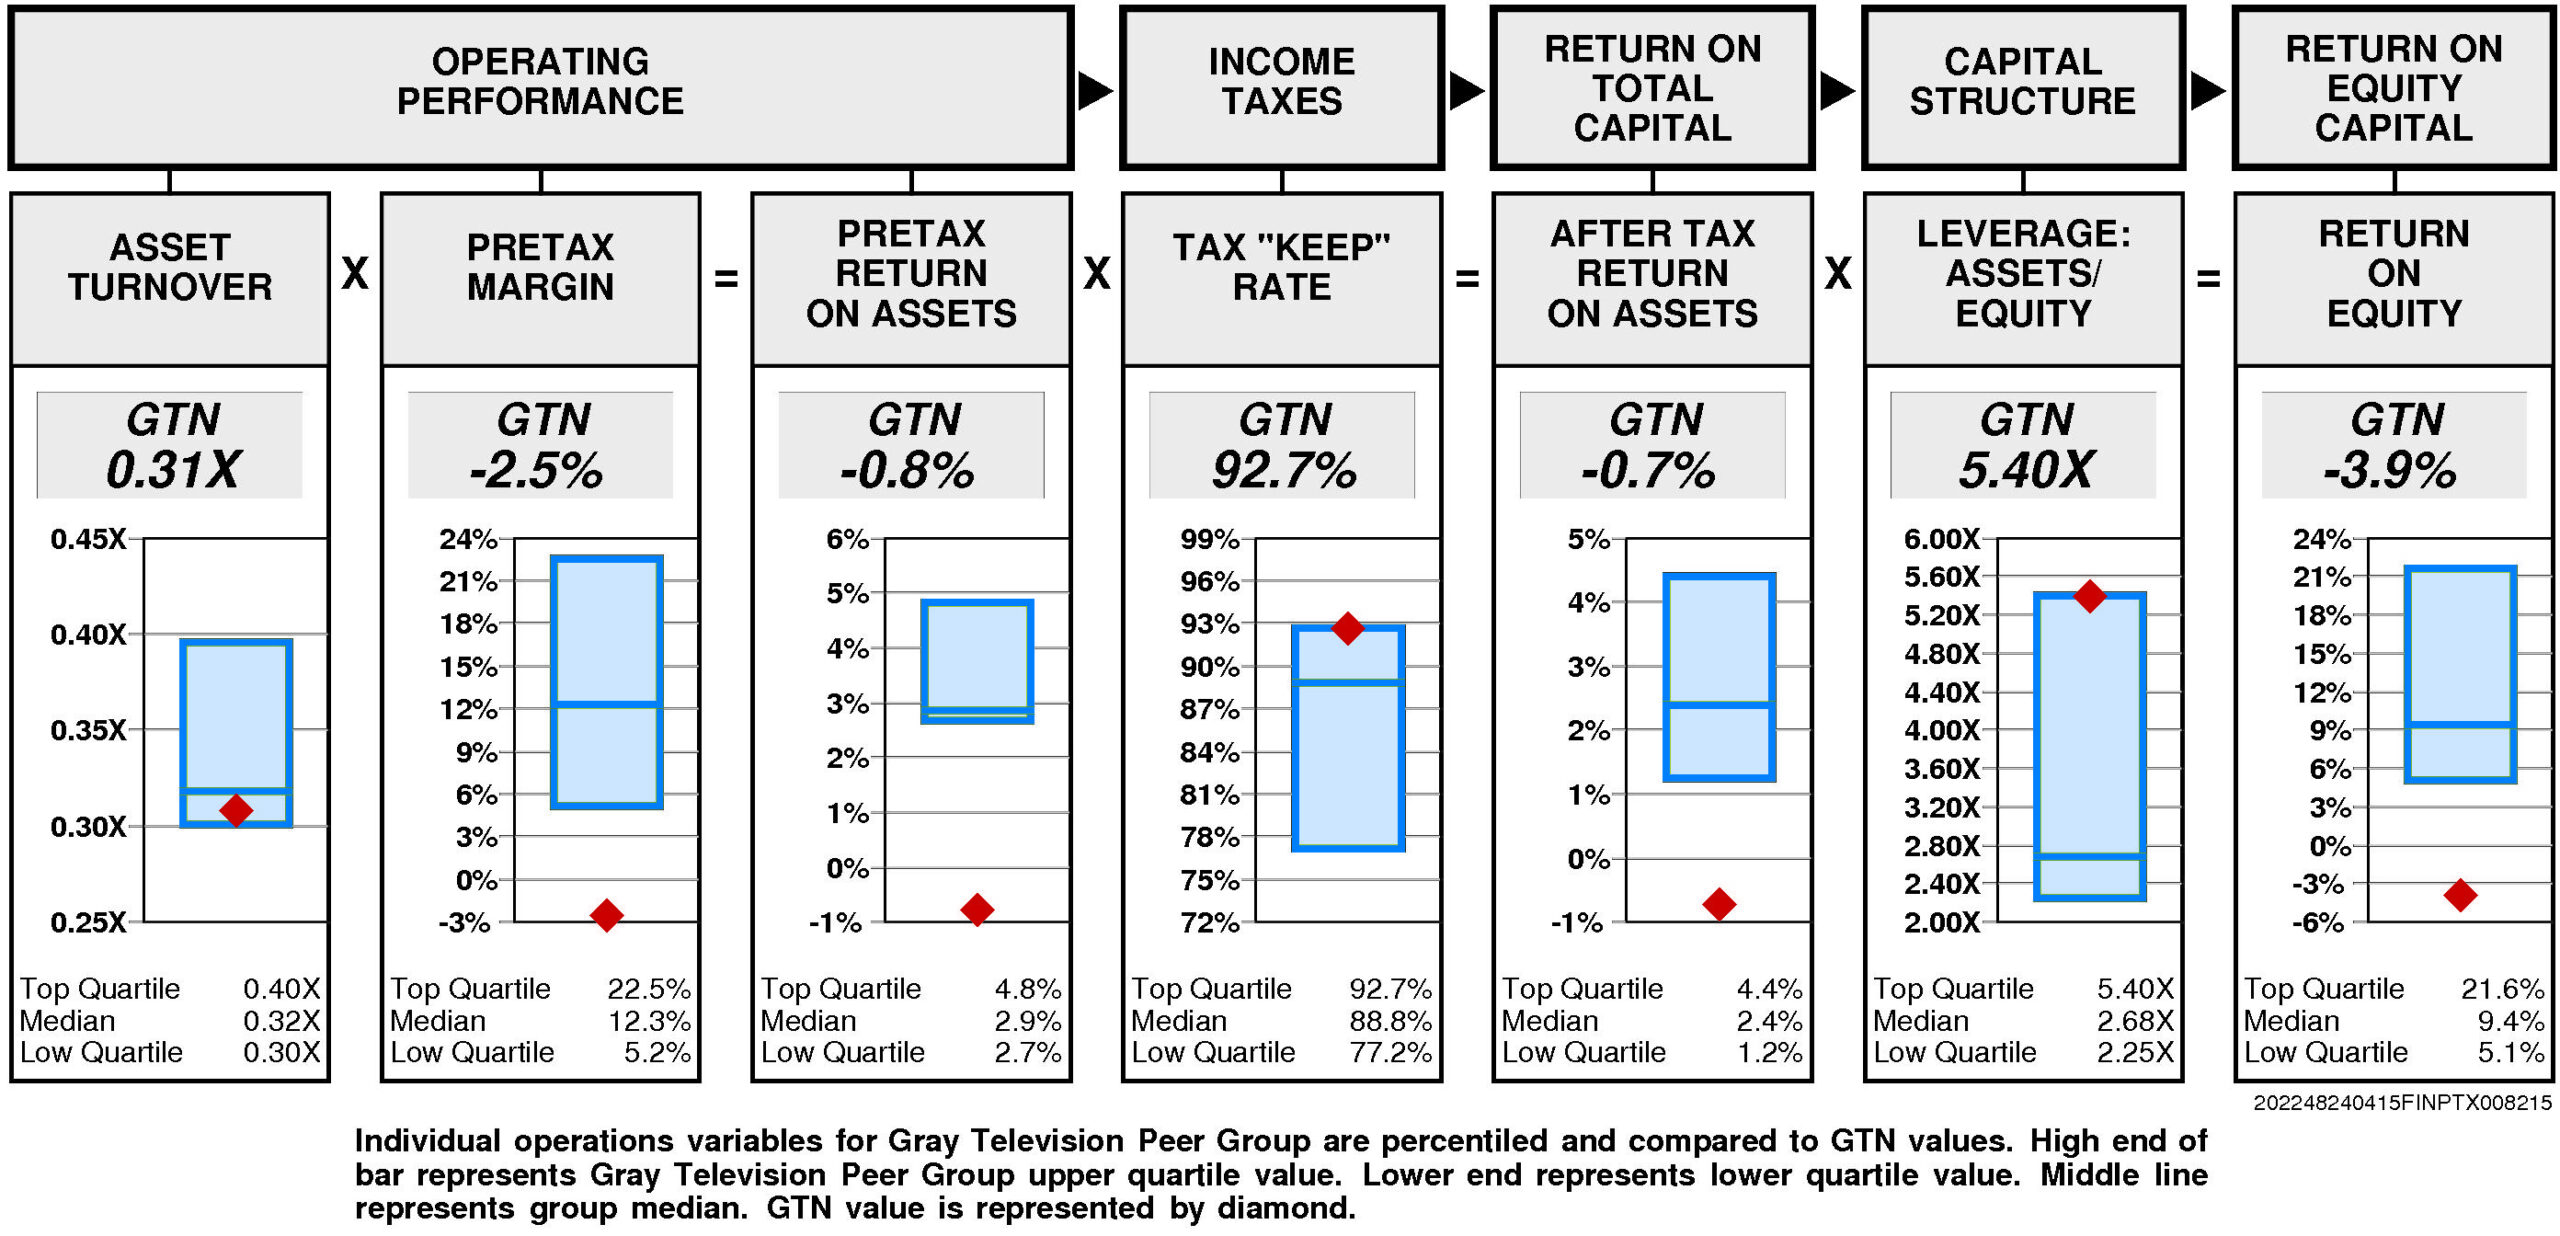
Operating performance (pretax return on assets) is lower quartile (-0.8%) reflecting asset turnover that is below median (0.31X) and lower quartile pretax margin (-2.5%).
Tax “keep” rate (income tax management) is at the upper quartile (92.7%) resulting in after tax return on assets that is lower quartile.
Financial leverage (leverage) is at the upper quartile (5.40X).
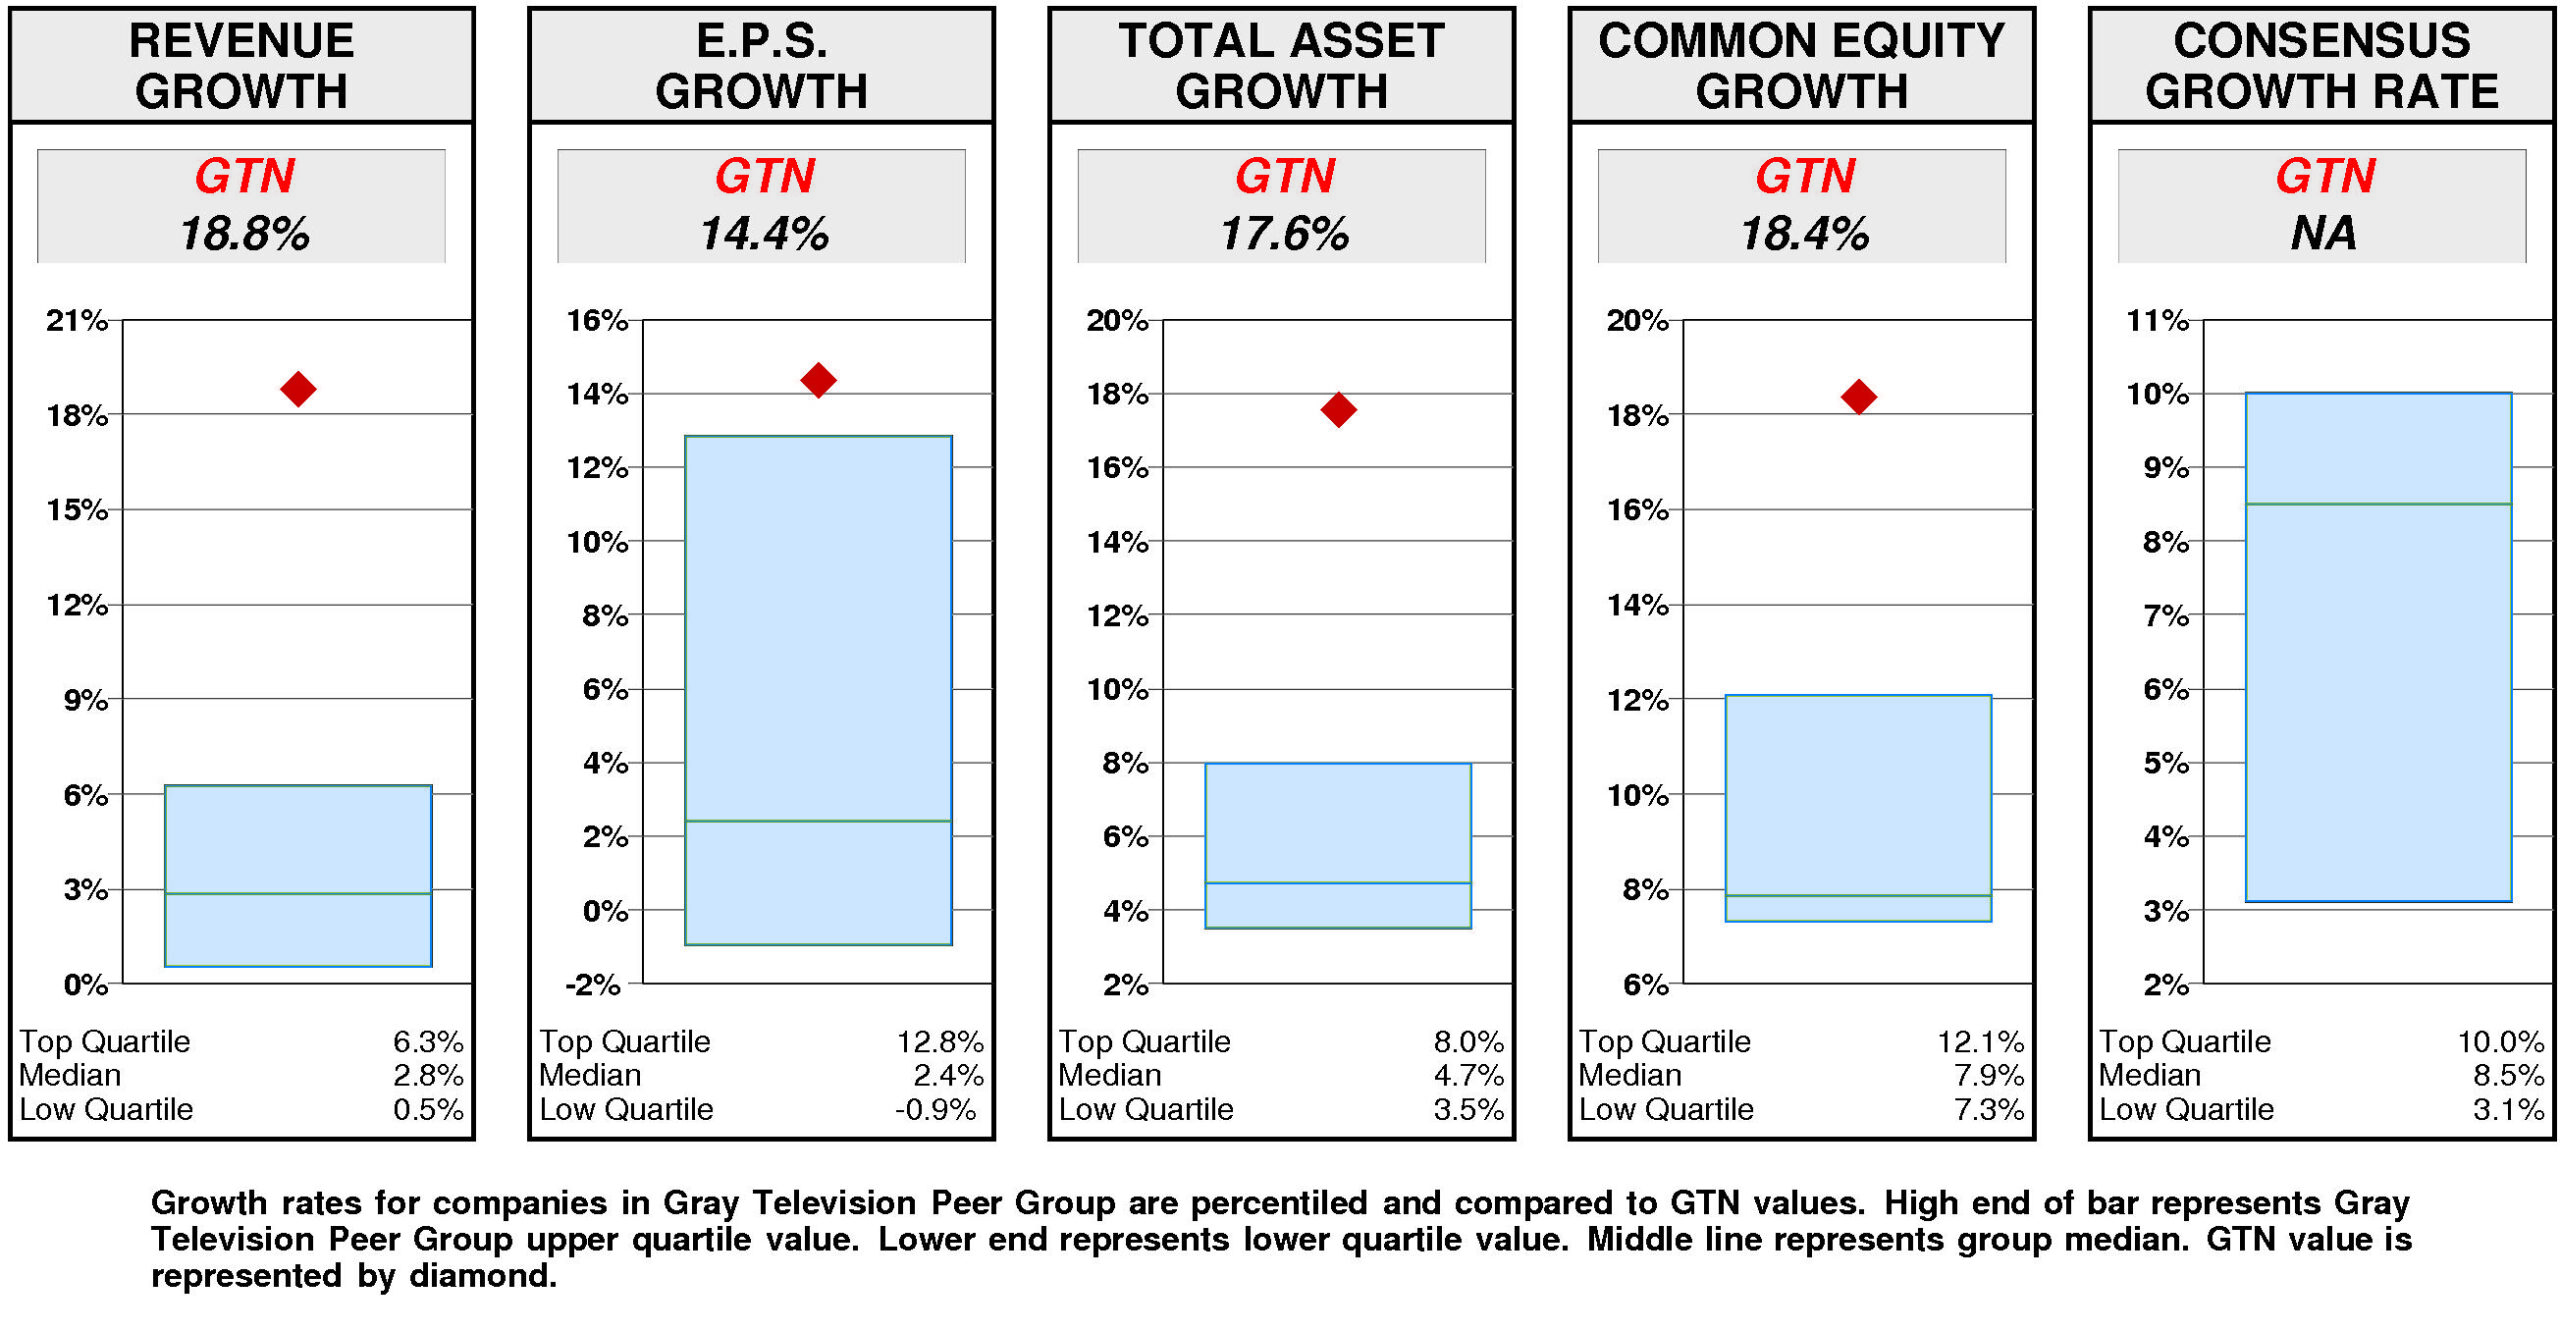
GROWTH RATES
Overall, Gray Television’s growth rate has slowed very considerably in recent years.
Gray Television’s historical income statement growth has been in line with balance sheet growth. Revenue growth has paralleled asset growth; earnings growth has paralleled equity growth.
Annual revenue growth has been 18.8% per year.
Total asset growth has been 17.6% per year. (More recently it has been -2.3%.)
Annual E.P.S. growth has been 14.4% per year.
Equity growth has been 18.4% per year. (More recently it has been 8.1%.)
No consensus growth rate forecast is available for Gray Television.
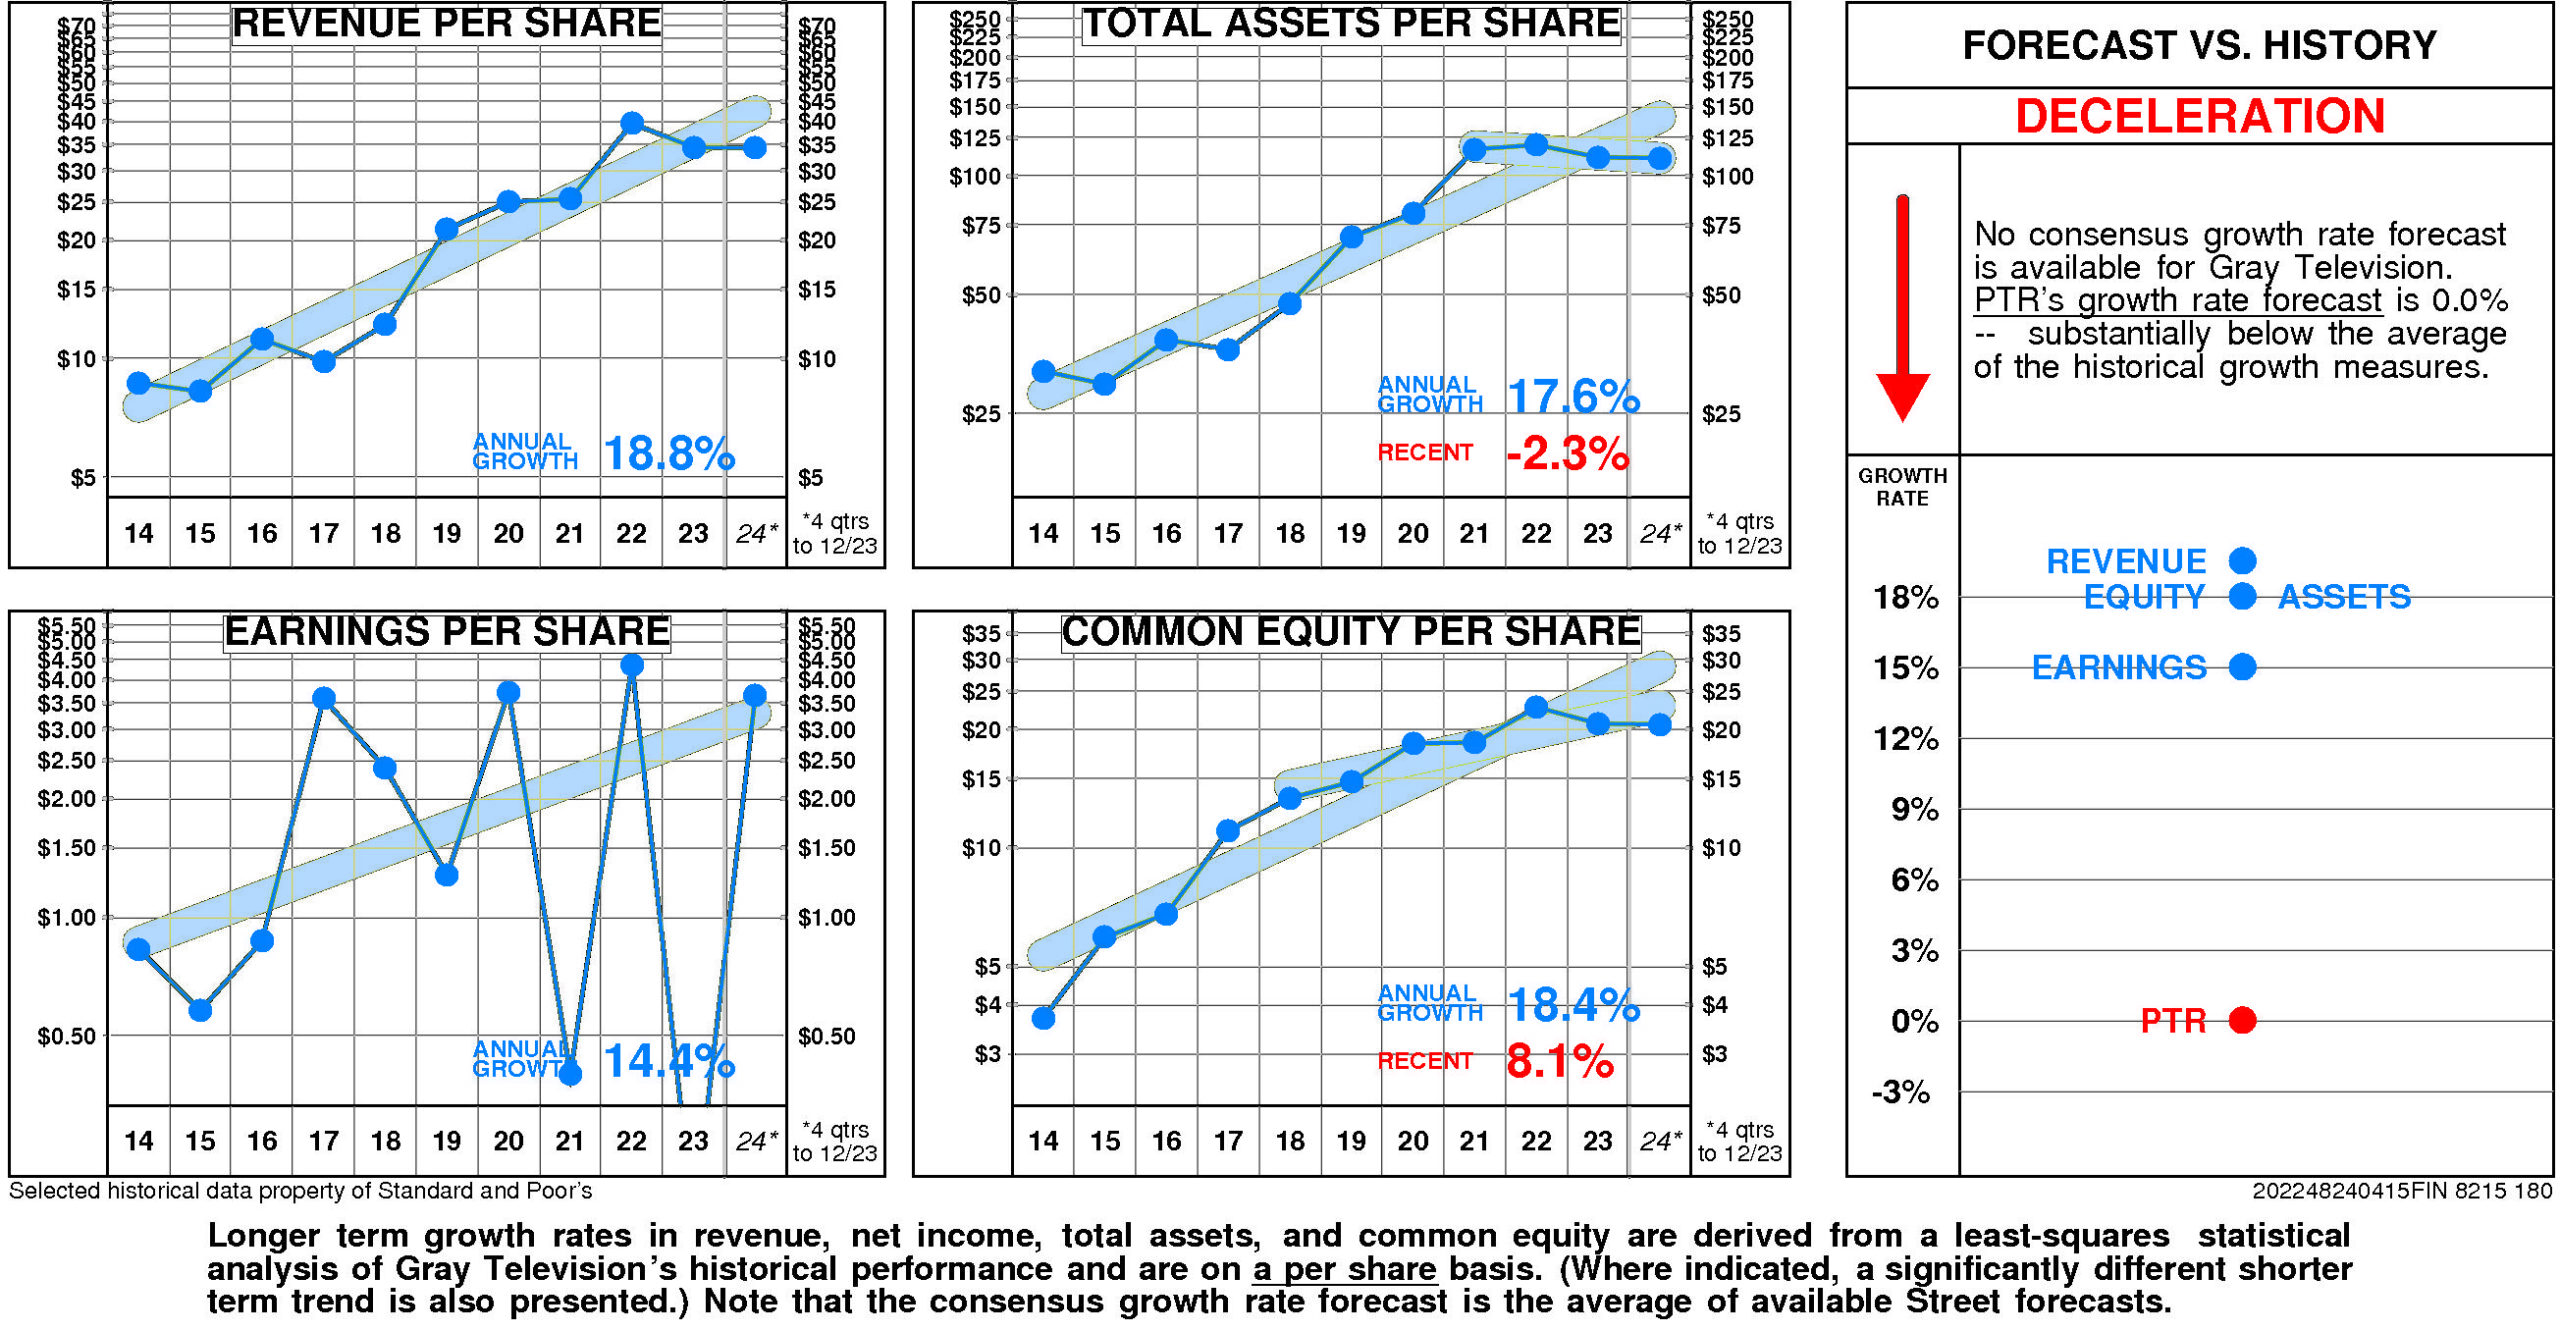
Relative to the Gray Television Peer Group, Gray Television’s historical growth measures are consistently top quartile. Revenue growth (18.8%) has been upper quartile. Total asset growth (17.6%) has been upper quartile. E.P.S. growth (14.4%) has been upper quartile. Equity growth (18.4%) has been upper quartile.
Consensus growth forecast is unavailable.
PRICE HISTORY
Over the full time period, Gray Television’s stock price performance has been volatile and significantly below market. Between June, 2013 and April, 2024, Gray Television’s stock price fell -19%; relative to the market, this was a -75% loss. Significant price moves during the period: 1) October, 2021 – May, 2023: -70%; and 2) September, 2014 – July, 2015: +114%.
TOTAL INVESTMENT RETURNS
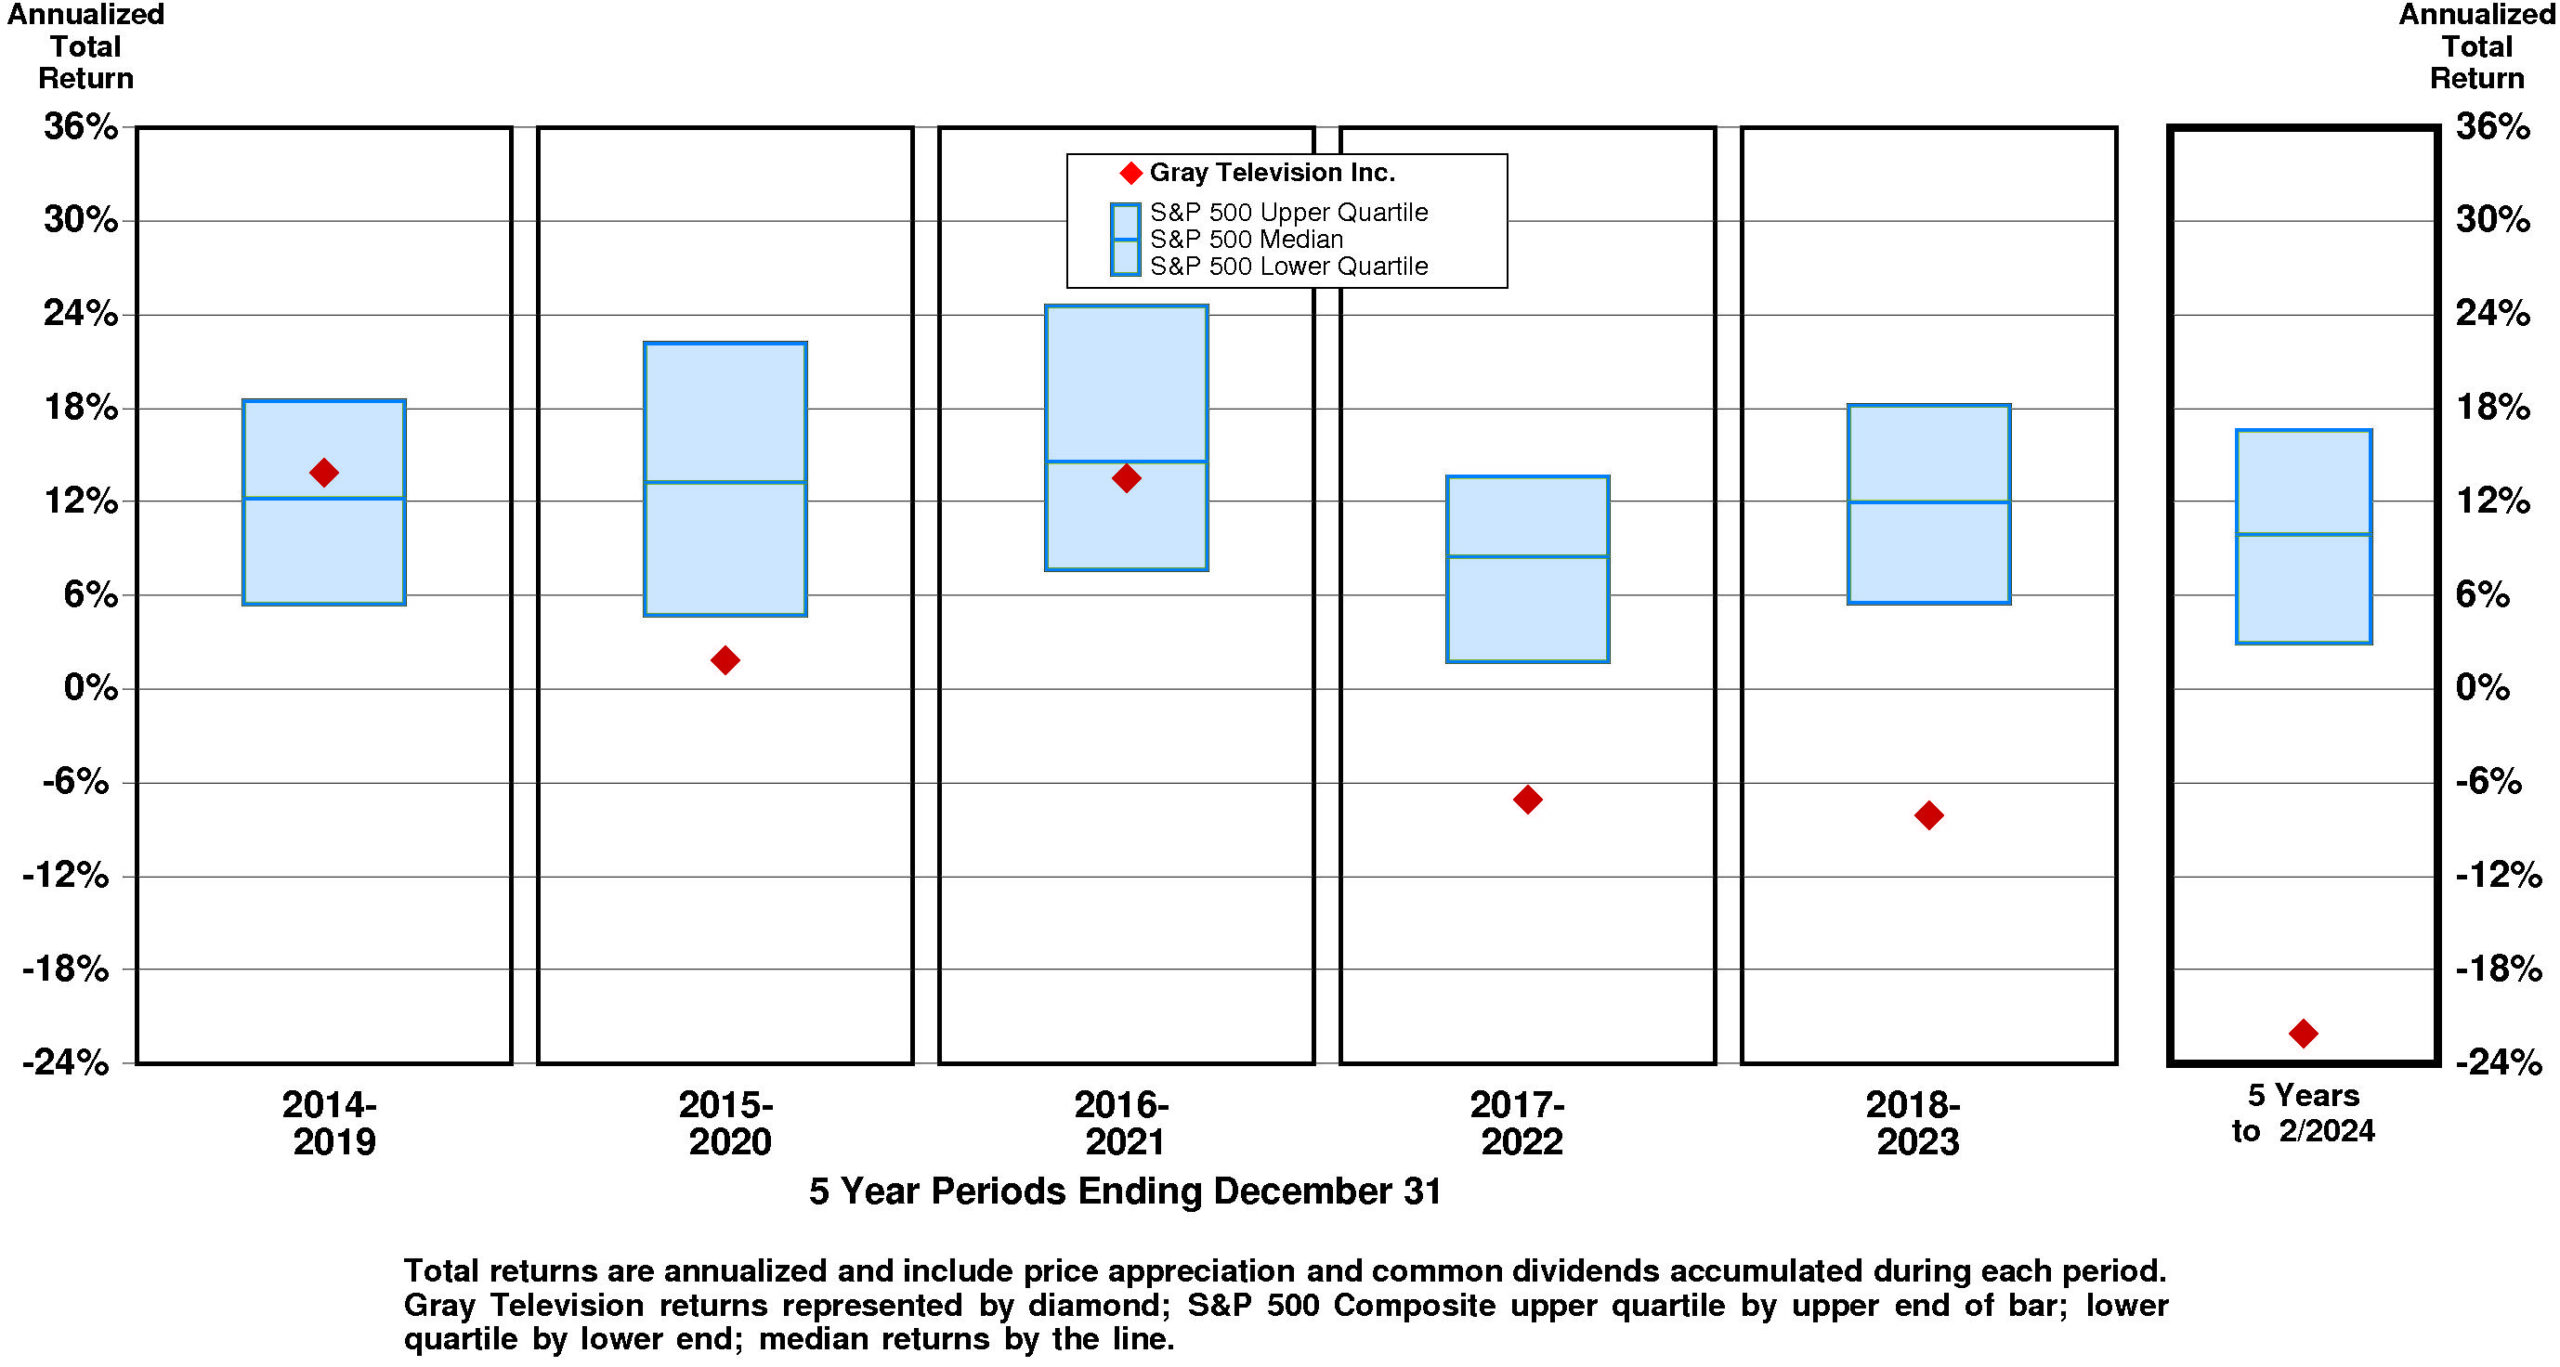
Current annual total return performance of -48.1% is lower quartile relative to the S&P 500 Composite.
In addition to being lower quartile relative to S&P 500 Composite, current annual total return performance through February, 2024 of -48.1% is lower quartile relative to Gray Television Inc. Peer Group.
Current 5-year total return performance of -22.1% is lower quartile relative to the S&P 500 Composite.
Through February, 2024, with lower quartile current 5-year total return of -22.1% relative to S&P 500 Composite, Gray Television’s total return performance is lower quartile relative to Gray Television Inc. Peer Group.
VALUATION BENCHMARKS
Relative to S&P 500 Composite, GTN’s overall valuation is exceptionally low. Ratio of enterprise value/earnings before interest and taxes is lower quartile. Ratio of enterprise value/revenue is at the lower quartile. Ratio of enterprise value/assets is lower quartile. Price/equity ratio is lower quartile. Price/earnings ratio is unavailable.
Relative to Gray Television Peer Group, GTN’s overall valuation is quite low. Ratio of enterprise value/earnings before interest and taxes is near the lower quartile. Ratio of enterprise value/assets is lower quartile. Ratio of enterprise value/revenue is lower quartile. Price/equity ratio is lower quartile. Price/earnings ratio is unavailable.
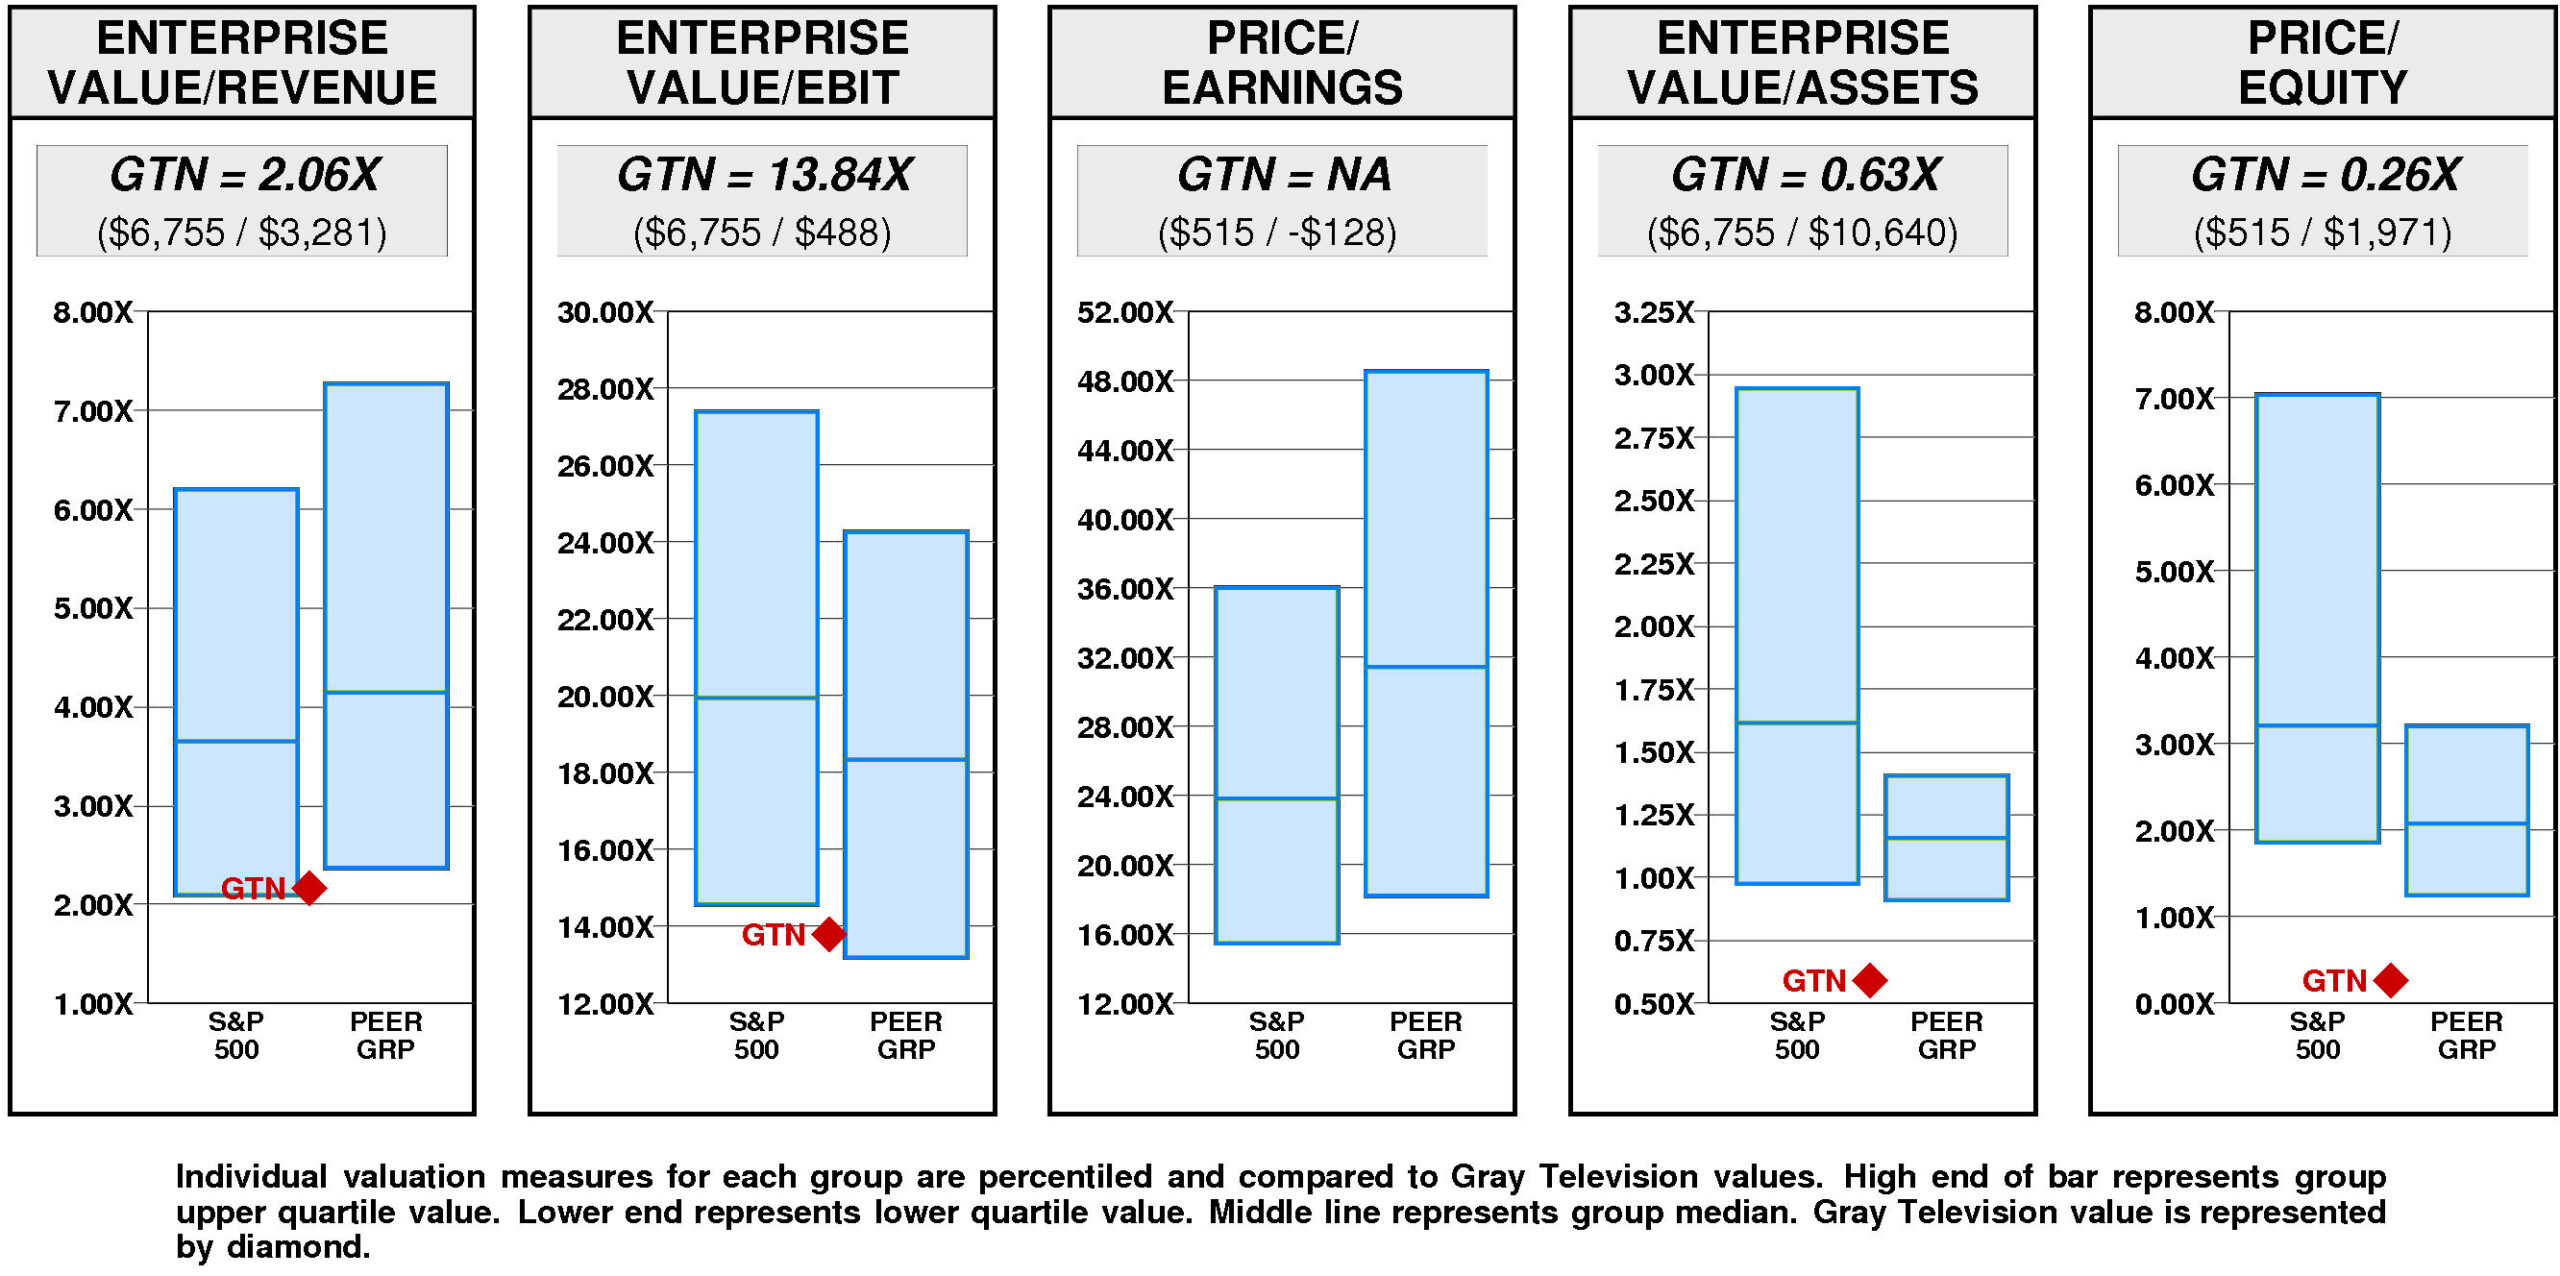
Gray Television has a major value gap compared to the median. For GTN to hit median valuation, its current ratio of enterprise value/revenue would have to rise from the current level of 2.06X to 4.15X. If GTN’s ratio of enterprise value/revenue were to rise to 4.15X, its stock price would be higher by $78 to $83.
For GTN to achieve upper quartile valuation relative to the Gray Television Peer Group, its current ratio of enterprise value/revenue would have to rise from the current level of 2.06X to 7.27X. If GTN’s ratio of enterprise value/revenue were to rise to 7.27X, its stock price would increase by $194 from the current level of $5.83.
VALUE TARGETS
GTN’s future returns on capital are forecasted to exceed the cost of capital. Accordingly, the company is expected to continue to be a modest Value Builder.
Gray Television’s current Price Target of $36 represents a +524% change from the current price of $5.83.
This very high appreciation potential results in an appreciation score of 96 (only 4% of the universe has greater appreciation potential.)
Notwithstanding this high Appreciation Score of 96, the low Power Rating of 11 results in an Value Trend Rating of C.
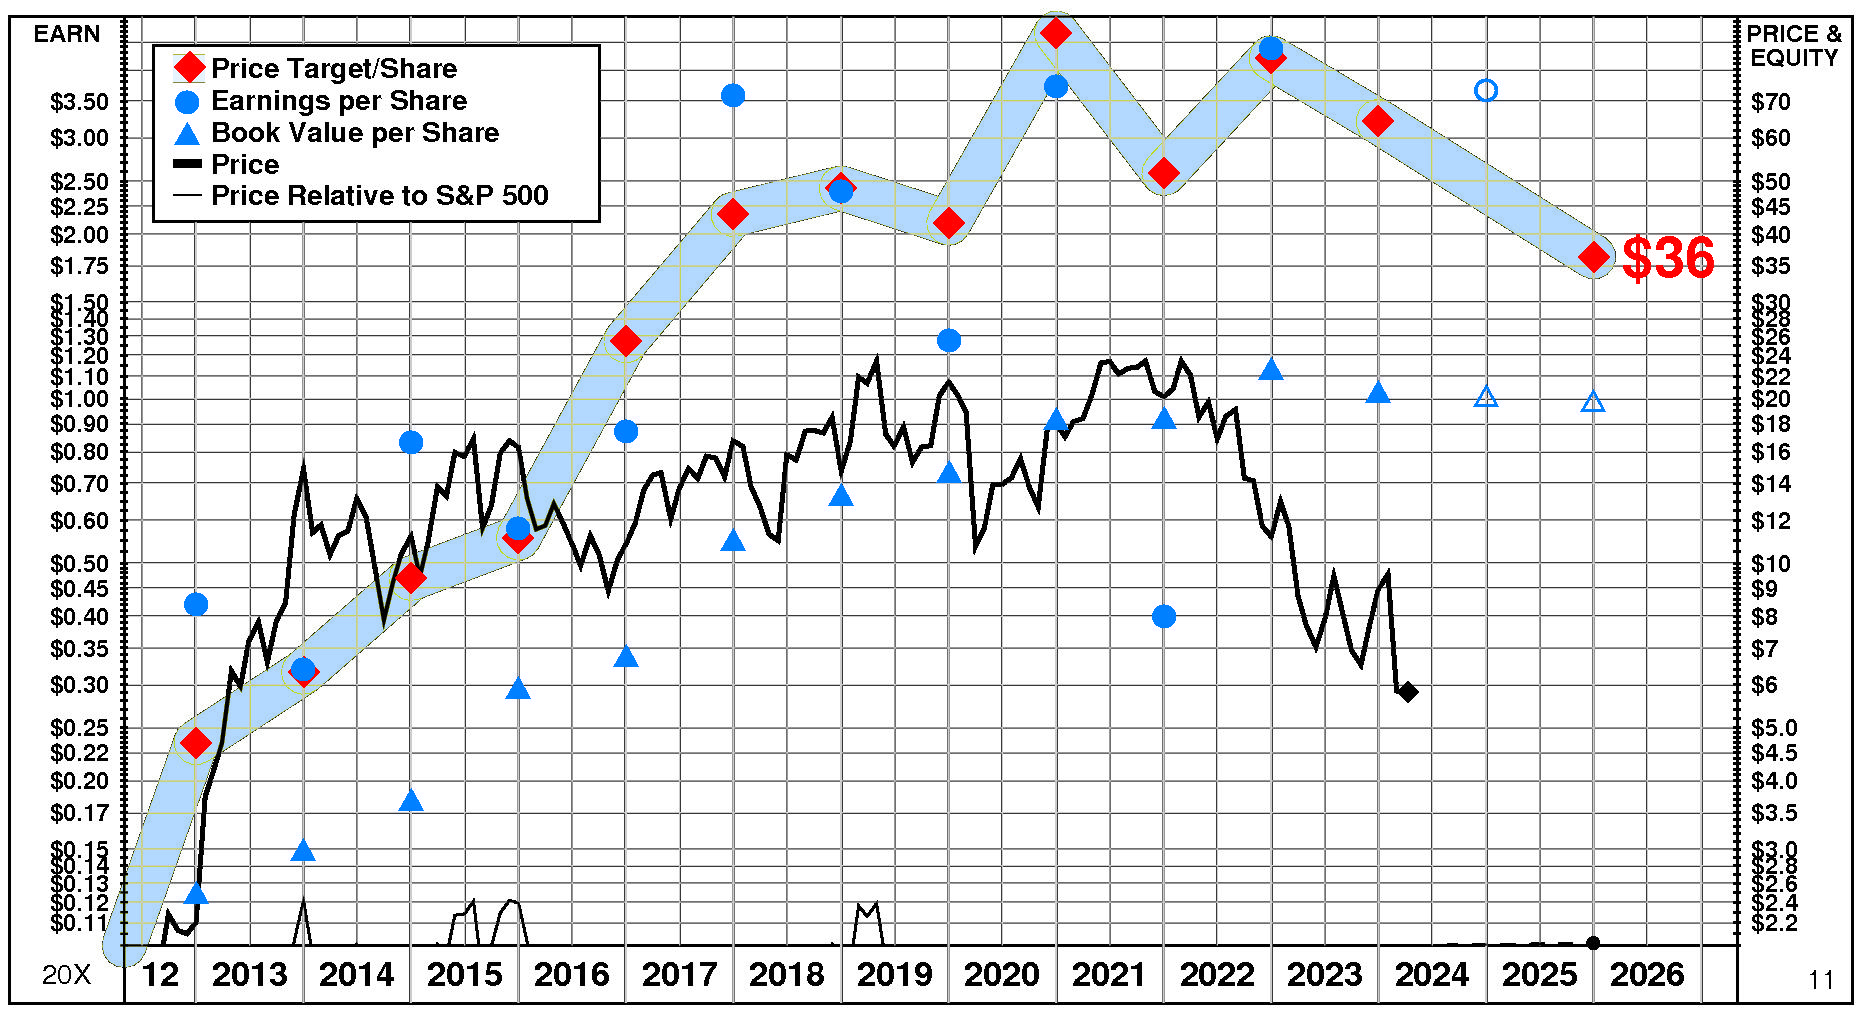
Gray Television’s current Price Target is $36 (-43% from the 2023 Target of $64 but +524% from the 04/08/24 price of $5.83). This dramatic fall in the Target is the result of a -13% decrease in the equity base and a -35% decrease in the price/equity multiple. The forecasted decline in return on equity has a very large negative impact on the price/equity multiple and the forecasted decline in growth has a very large negative impact as well. Partially offsetting these Drivers, the forecasted decline in cost of equity has a huge positive impact.
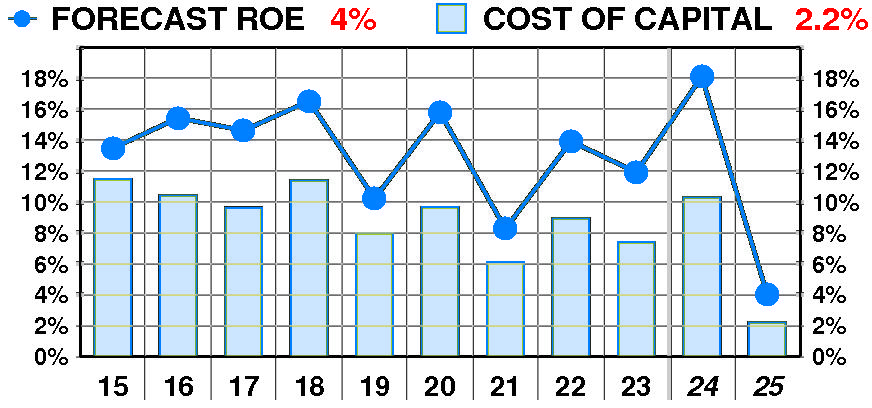
PTR’s return on equity forecast is 4.0% — below our recent forecasts. Forecasted return on equity suffered a dramatic, erratic decline between 2015 and 2023. The current forecast is significantly below the 2018 peak of 17%.
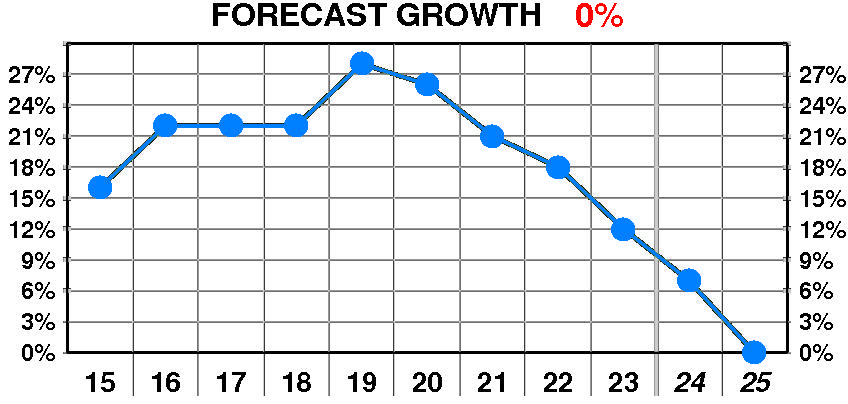
PTR’s growth forecast is 0.0% — significantly below our recent forecasts. Forecasted growth suffered a dramatic, erratic decline between 2015 and 2023. The current forecast is significantly below the 2019 peak of 28%.
PTR’s cost of equity forecast is 2.2% — below recent levels. Forecasted cost of equity enjoyed a dramatic, erratic decline between 2015 and 2023. The current forecast is well below the 2015 peak of 11.5%.
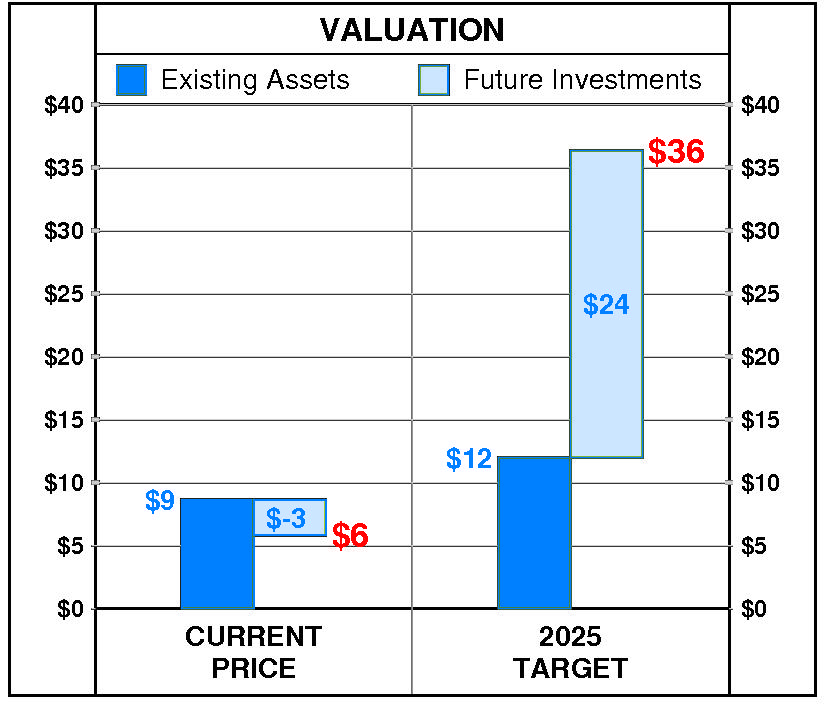
At Gray Television’s current price of $5.83, investors are placing a negative value of $-3 on its future investments. This view is not supported by the company’s most recent performance that reflected a growth rate of 12.0% per year, and a return on equity of 11.9% versus a cost of equity of 7.4%.
PTR’s 2025 Price Target of $36 is based on these forecasts and reflects an estimated value of existing assets of $12 and a value of future investments of $24.
Be the first to comment