![]()
BUSINESS
Best Buy Co., Inc. retails technology products in the United States and Canada. The company operates in two segments, Domestic and International. Its stores provide computing products, such as desktops, notebooks, and peripherals; mobile phones comprising related mobile network carrier commissions; networking products; tablets covering e-readers; smartwatches; and consumer electronics consisting of digital imaging, health and fitness, home theater, portable audio comprising headphones and portable speakers, and smart home products.
INVESTMENT RATING
With future capital returns forecasted to exceed the cost of capital, BBY is expected to continue to be a major Value Builder.
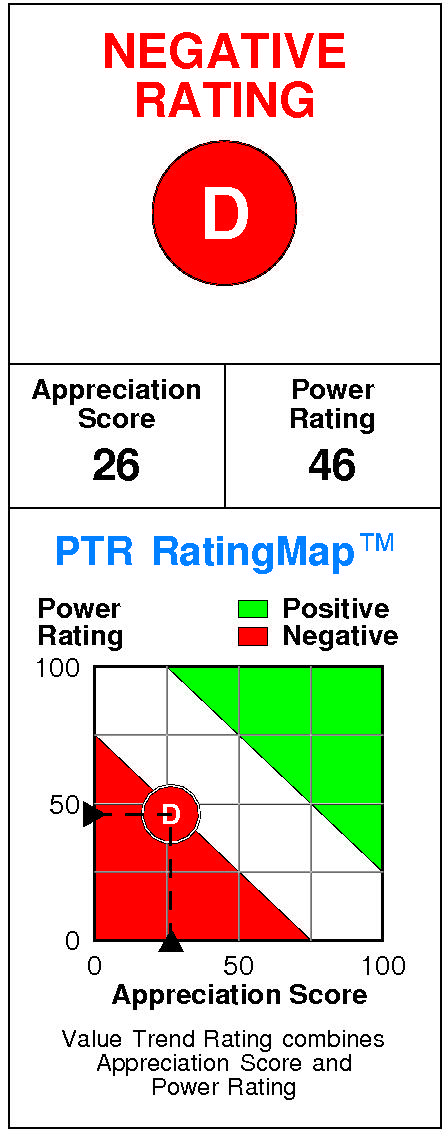
Best Buy has a current Value Trend Rating of D (Negative).
This rating combines inconsistent signals from two proprietary PTR measures of a stock’s attractiveness. Best Buy has a neutral Power Rating of 46 but a poor Appreciation Score of 26, triggering the Negative Value Trend Rating.
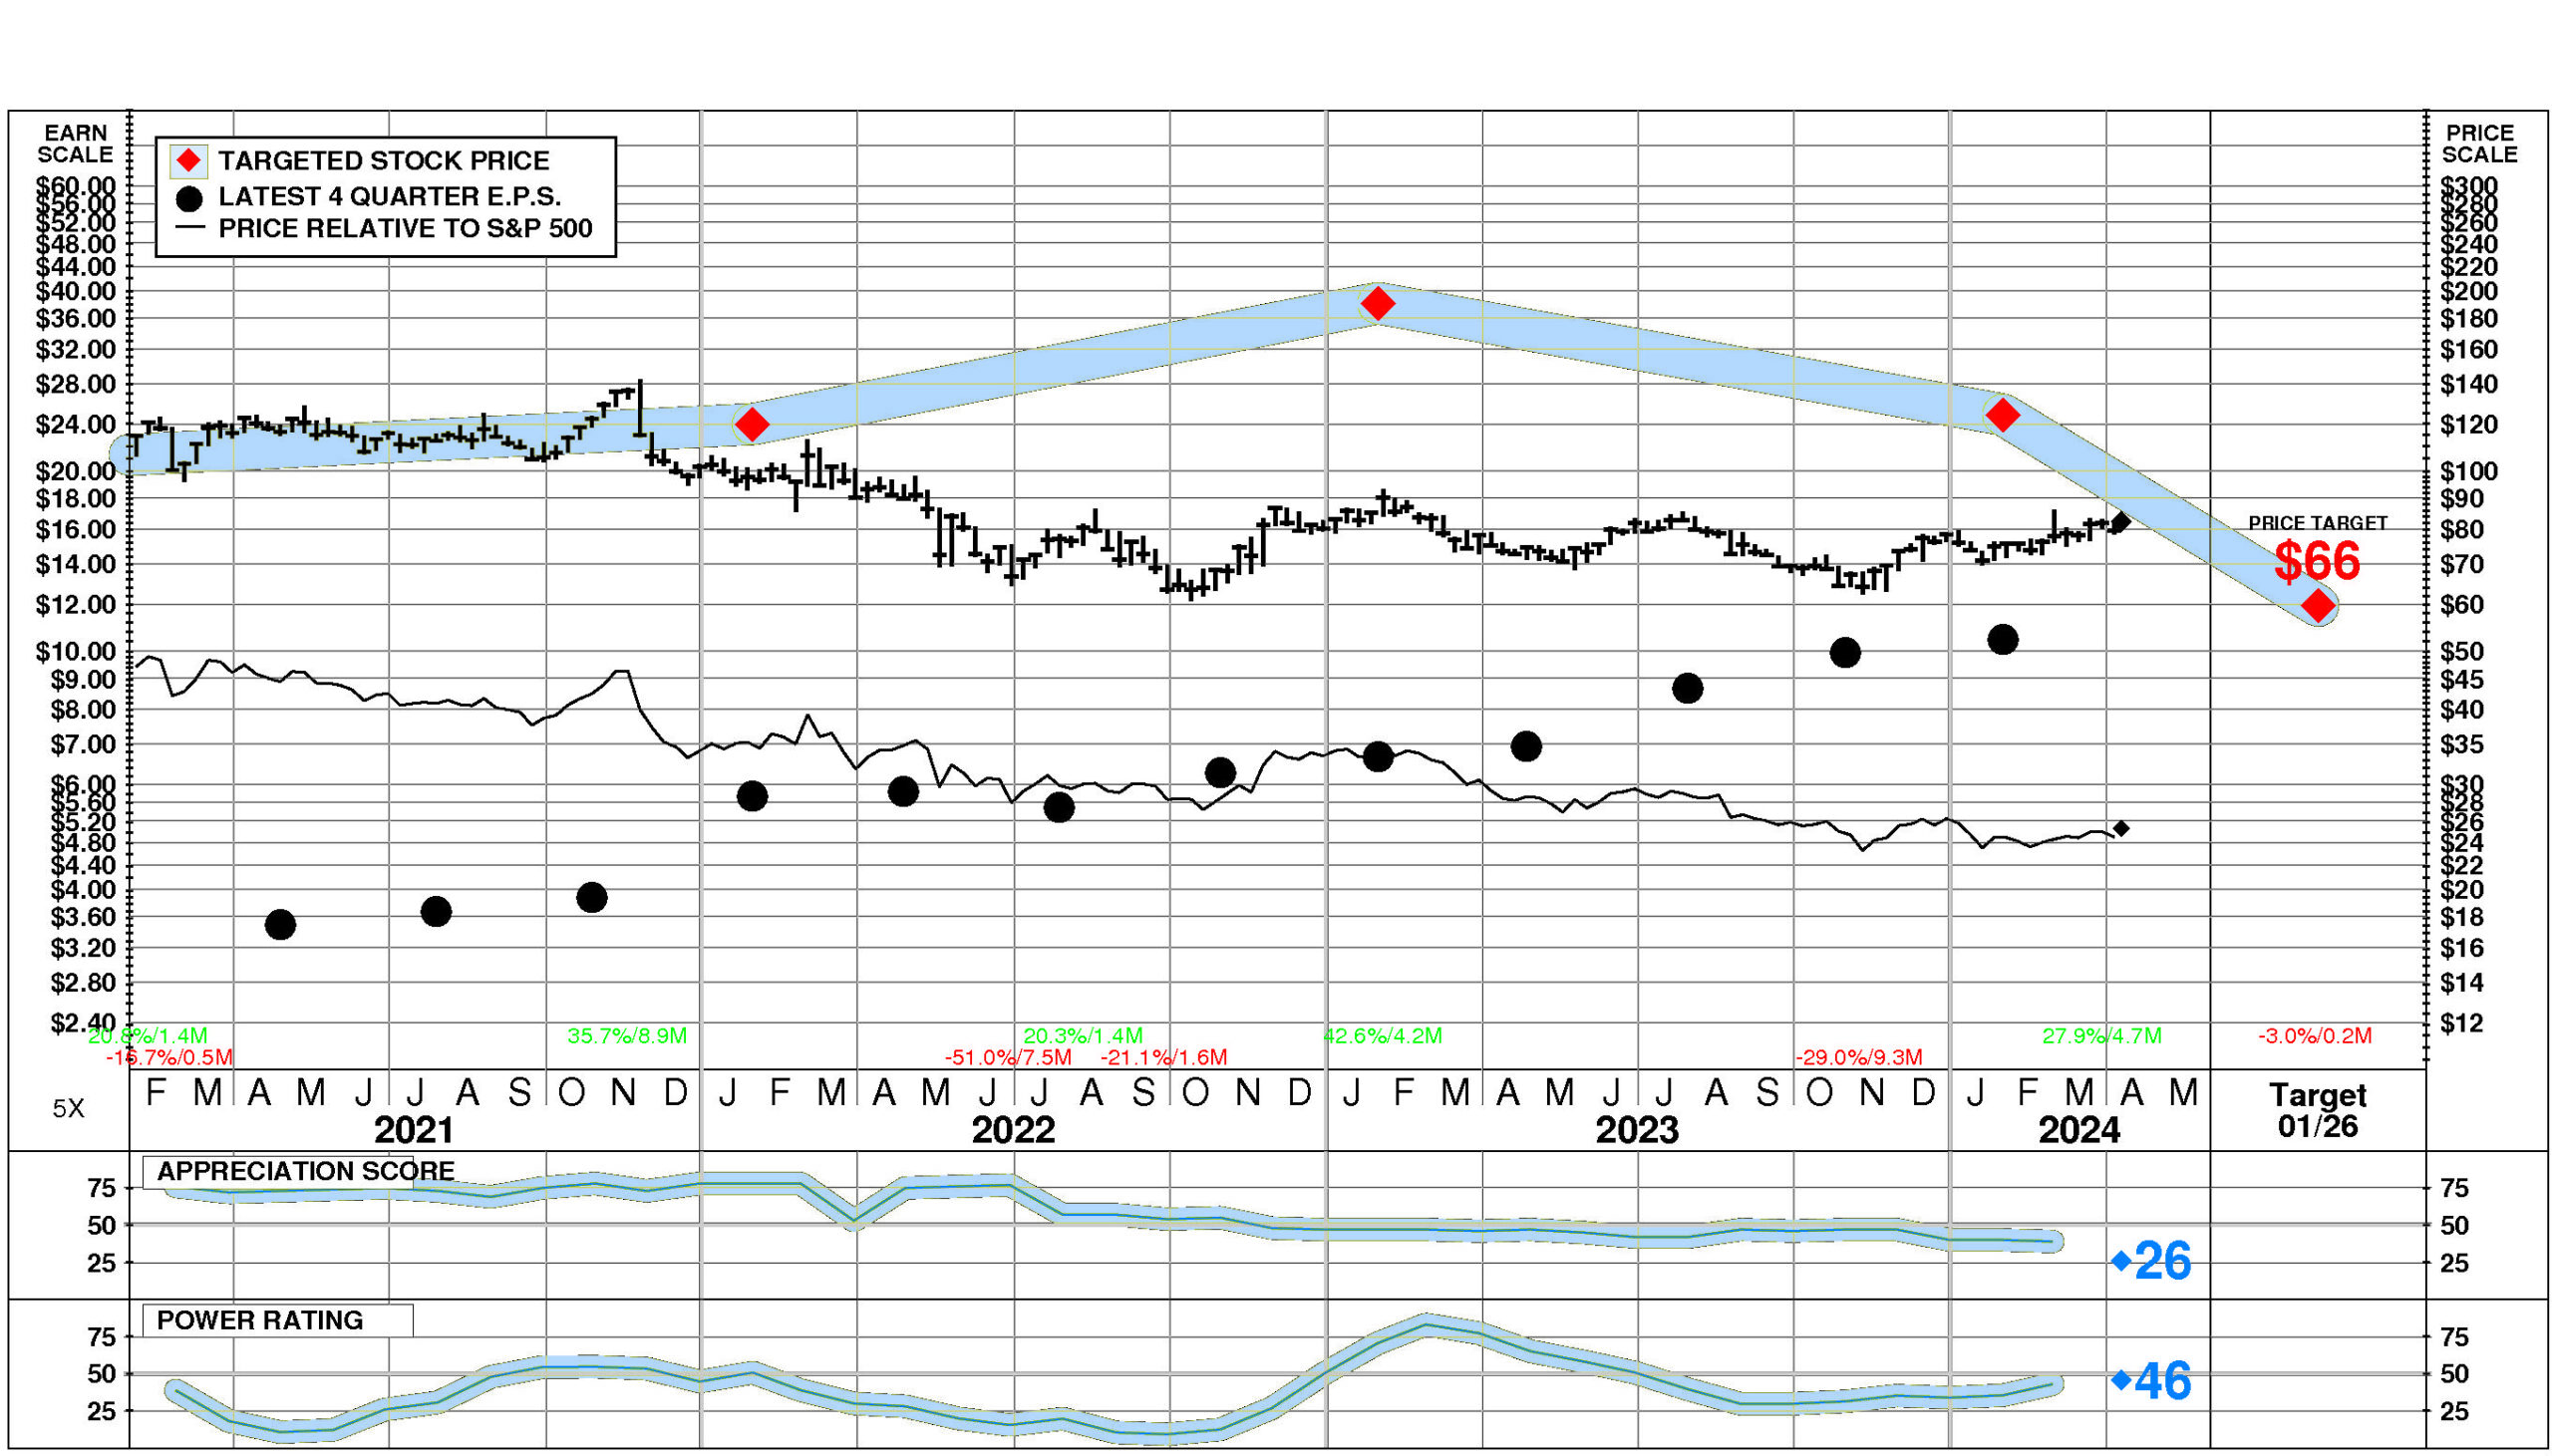
Best Buy’s stock is selling well above targeted value. The current stock price of $82.55 compares to targeted value 12 months forward of $60.
This low appreciation potential results in an appreciation score of 26 (74% of the universe has greater appreciation potential.)
Best Buy has a Power Rating of 46. (This neutral Power Rating indicates that BBY’s chances of enjoying attractive investment performance over the near to intermediate term are only average.)
Factors contributing to this neutral Power Rating include: earnings estimate behavior for BBY has been slightly negative recently; and the Radio, TV, Consumer Electric Stores comparison group is in a slightly weakened position currently. An offsetting factor is recent price action has been neutral.
INVESTMENT PROFILE
Best Buy’s financial strength is above average. Financial strength rating is 64.
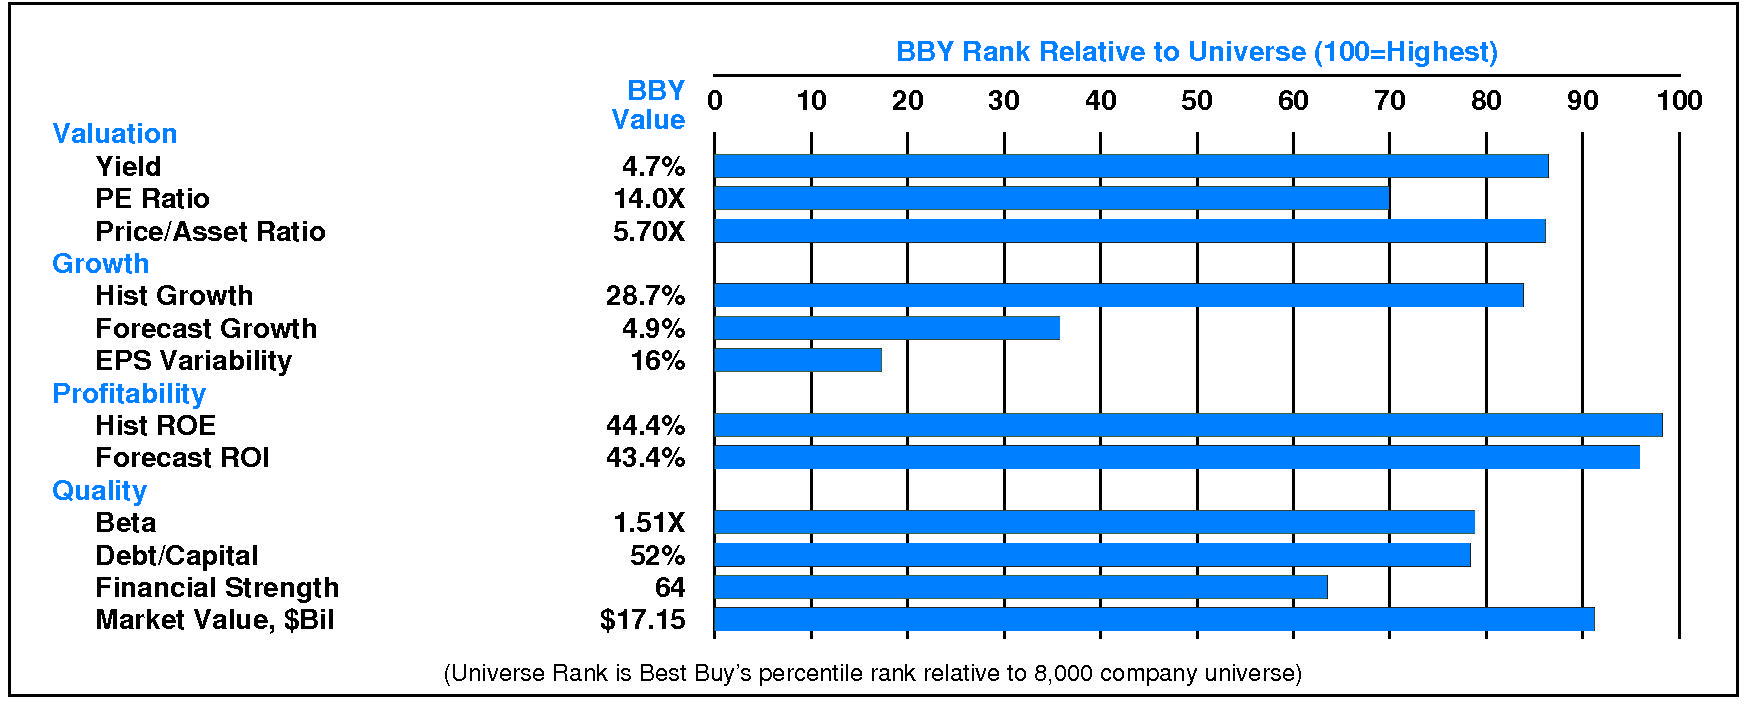
Relative to the S&P 500 Composite, Best Buy Co Inc has slightly more Growth than Value characteristics; its appeal is likely to be to Income-oriented investors; the perception is that BBY is normal risk. Relative weaknesses include: high stock price volatility, and low expected growth. Best Buy’s valuation is low: high dividend yield, low P/E ratio, and moderate price/book ratio. BBY has low market capitalization.
CURRENT SIGNALS
Best Buy’s current operations are eroding. Return on equity is falling, reflecting: falling asset utilization; declining pretax margin; falling tax keep rate; and falling leverage.
Best Buy’s current technical position is mixed. The stock price is in a 4.7 month up move. The stock has appreciated 27.9% from its prior low. The 200 day moving average is in a downtrend. The stock price is above its 200 day moving average. The stock has just risen above its 200 day moving average.
ALERTS
Best Buy Co Inc (NYSE: BBY) has recently enjoyed extremely meaningful positive changes in investment behavior: positive upside/downside volume developed, and the stock’s recent price rise disrupted its longer term downtrend.
Best Buy Co Inc (NYSE: BBY) has recently enjoyed minimal positive changes in fundamentals: significant quarterly earnings acceleration occurred.
The stock is currently rated D.
Best Buy Co Inc (NYSE: BBY) stock enjoyed a large increase of 3.0% on 4/9/24. The stock closed at $82.55. This advance was accompanied by normal trading volume. The stock has performed in line with the market over the last nine months and has risen 1.1% during the last week.
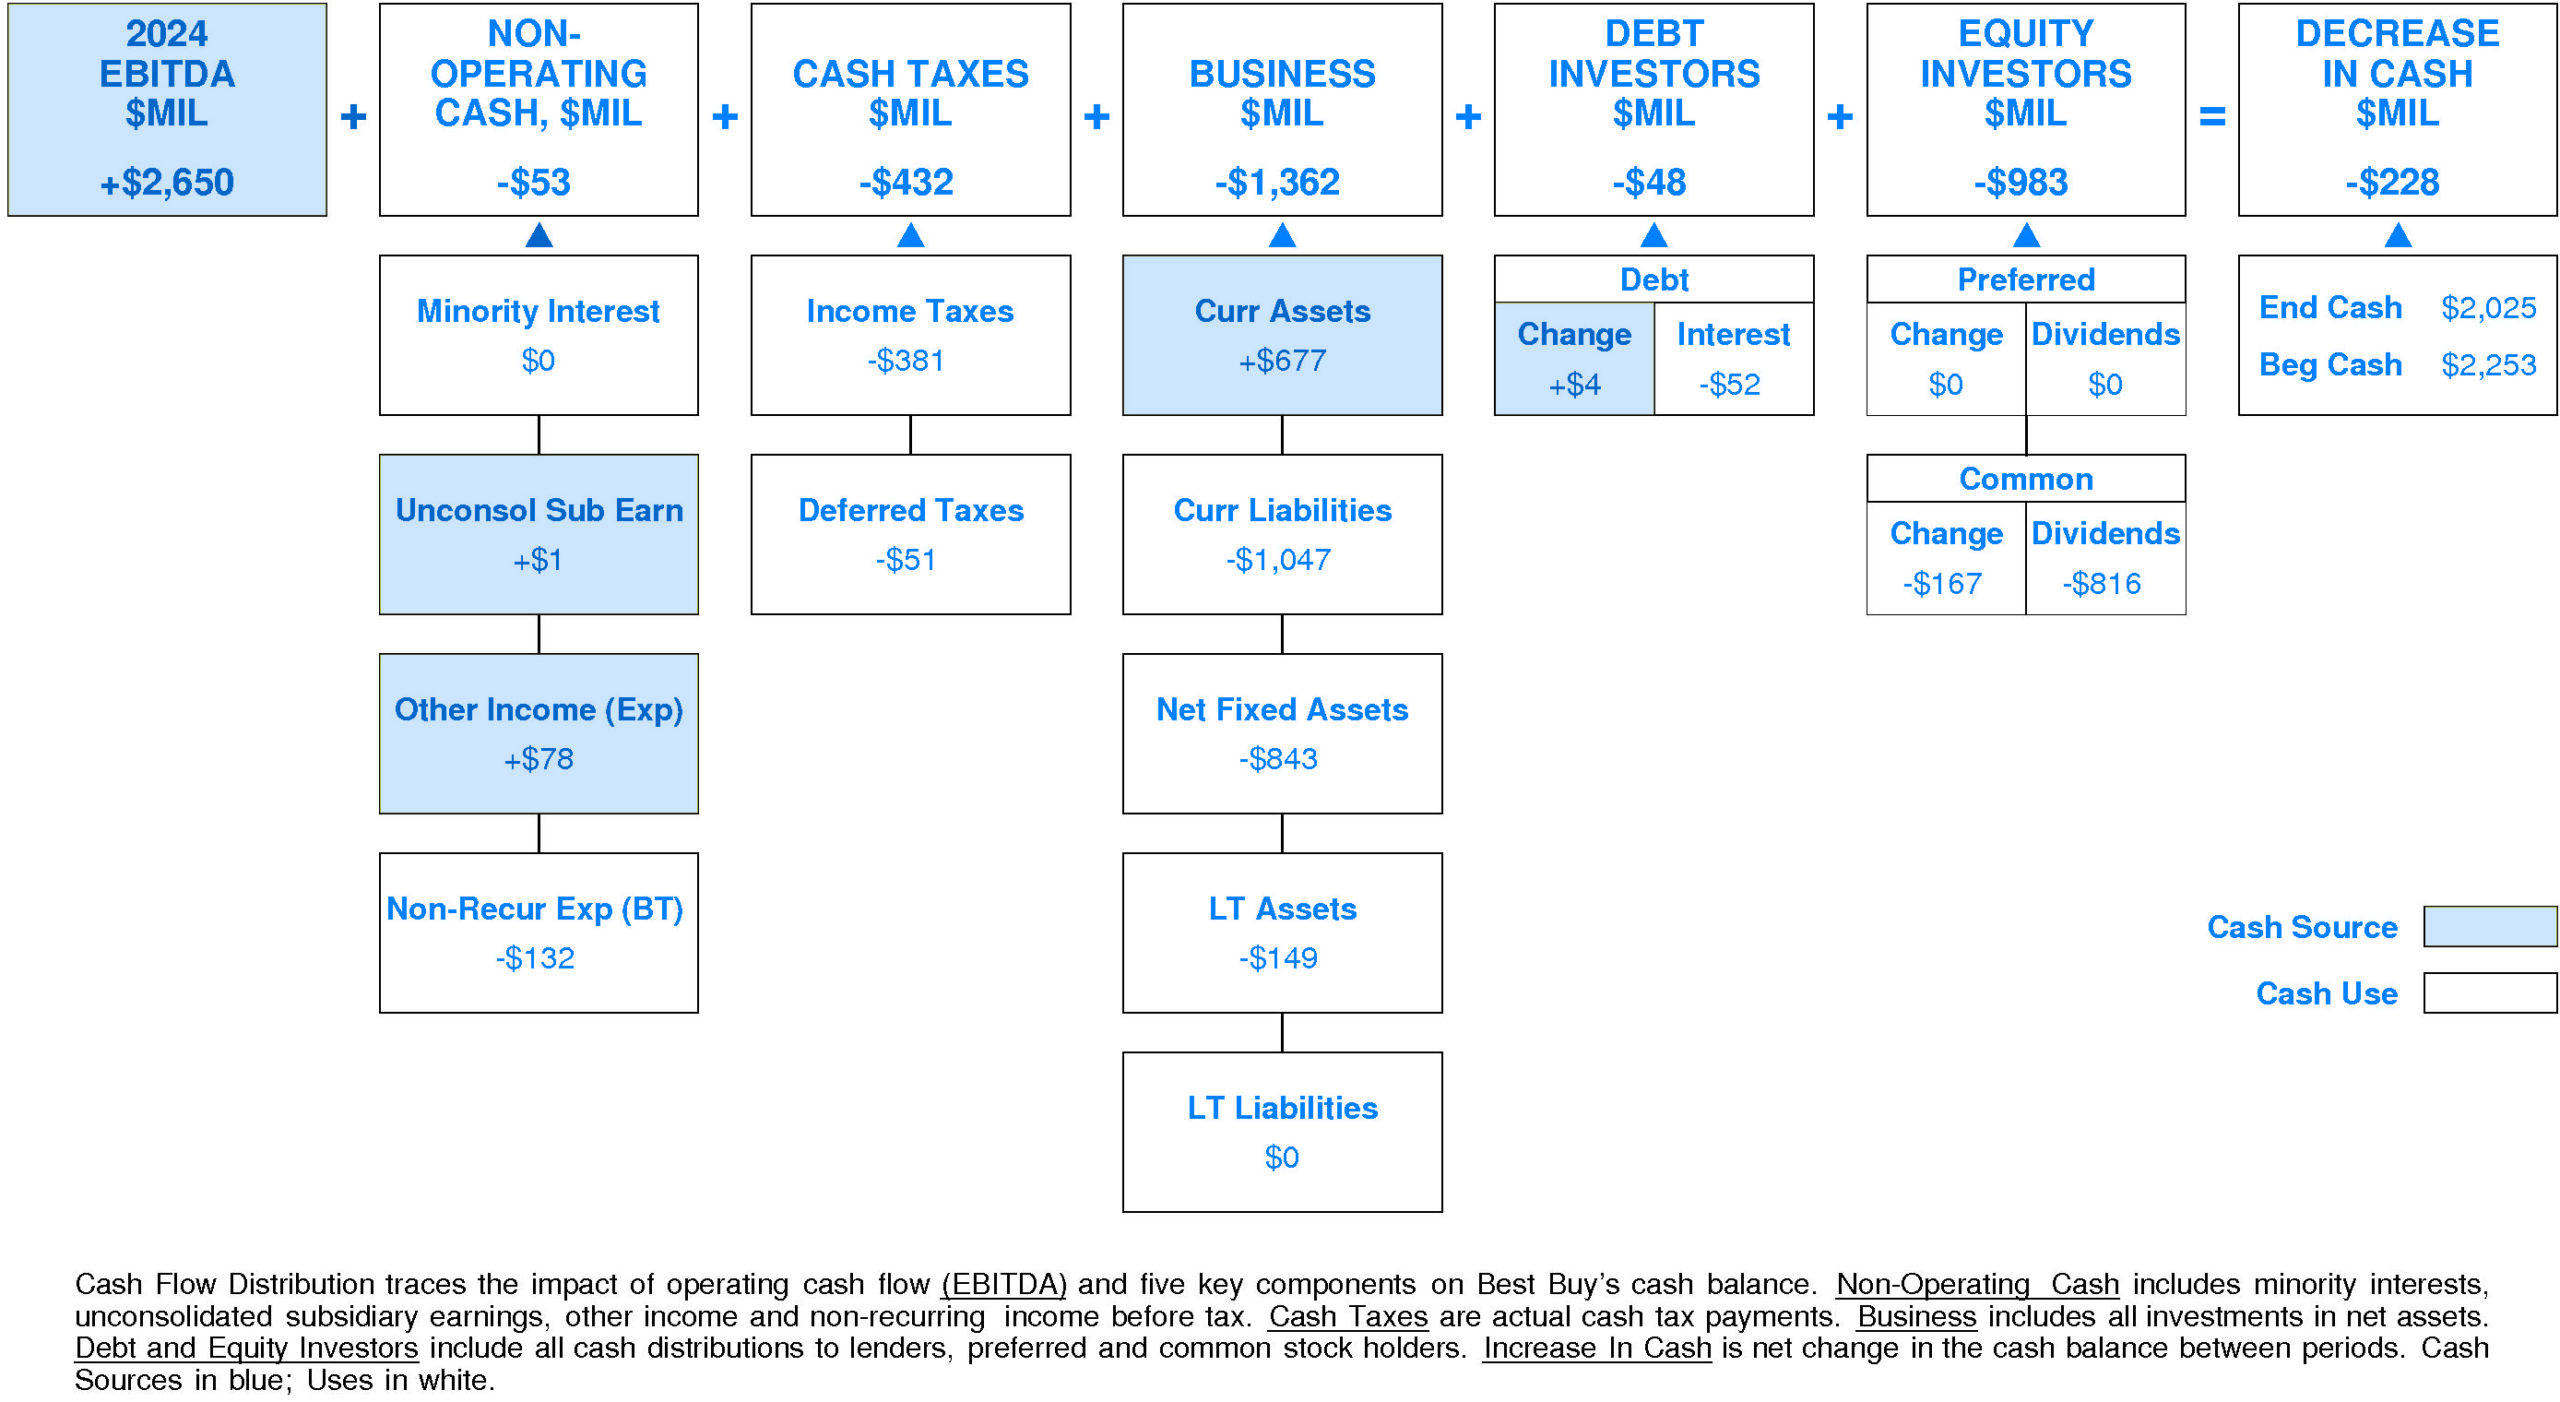
CASH FLOW
In 2024, Best Buy experienced a significant decline in cash of -$228 million (-10%). Sources of cash were lower than uses. Cash generated from 2024 EBITDA totaled +$2,650 million. Non-operating uses consumed -$53 million (-2% of EBITDA). Cash taxes consumed -$432 million (-16% of EBITDA). Re-investment in the business amounted to -$1,362 million (-51% of EBITDA). On a net basis, debt investors removed -$48 million (-2% of EBITDA) while equity investors received -$983 million (-37% of EBITDA).
Best Buy’s Non-operating Income, %EBITDA has exhibited little to no overall change over the period. This stability was accompanied by stability for the Best Buy Peer Group as well. In most years, Best Buy was in the top quartile and second quartile. Currently, Best Buy is substantially above median at -2% of EBITDA (-$53 million).
Best Buy’s Cash Taxes, %EBITDA has exhibited a volatile overall uptrend over the period. This improvement was accompanied by a similar trend for the Best Buy Peer Group. In most years, Best Buy was in the third quartile and second quartile. Currently, Best Buy is below median at -16% of EBITDA (-$432 million).
Best Buy’s Business Re-investment, %EBITDA has suffered a volatile overall downtrend over the period. This downtrend was accompanied by a similar trend for the Best Buy Peer Group. In most years, Best Buy was in the third quartile and top quartile. Currently, Best Buy is substantially below median at -51% of EBITDA (-$1,362 million).
Best Buy’s Debt Investors, %EBITDA has exhibited a volatile overall uptrend over the period. This improvement was accompanied by stability for the Best Buy Peer Group. In most years, Best Buy was in the second quartile and third quartile. Currently, Best Buy is slightly above median at -2% of EBITDA (-$48 million).
Best Buy’s Equity Investors, %EBITDA has experienced a downtrend over the period. This downtrend was accompanied by stability for the Best Buy Peer Group. (Since 2022 Equity Investors, %EBITDA has experienced a very sharp recovery.) In most years, Best Buy was in the top quartile and lower quartile. Currently, Best Buy is substantially below median at -37% of EBITDA (-$983 million).
Best Buy’s Change in Cash, %EBITDA has experienced a volatile overall downtrend over the period. This downtrend was accompanied by stability for the Best Buy Peer Group. (Since 2022 Change in Cash, %EBITDA has experienced a very sharp recovery.) In most years, Best Buy was in the lower quartile and top quartile. Currently, Best Buy is lower quartile at -9% of EBITDA (-$228 million).
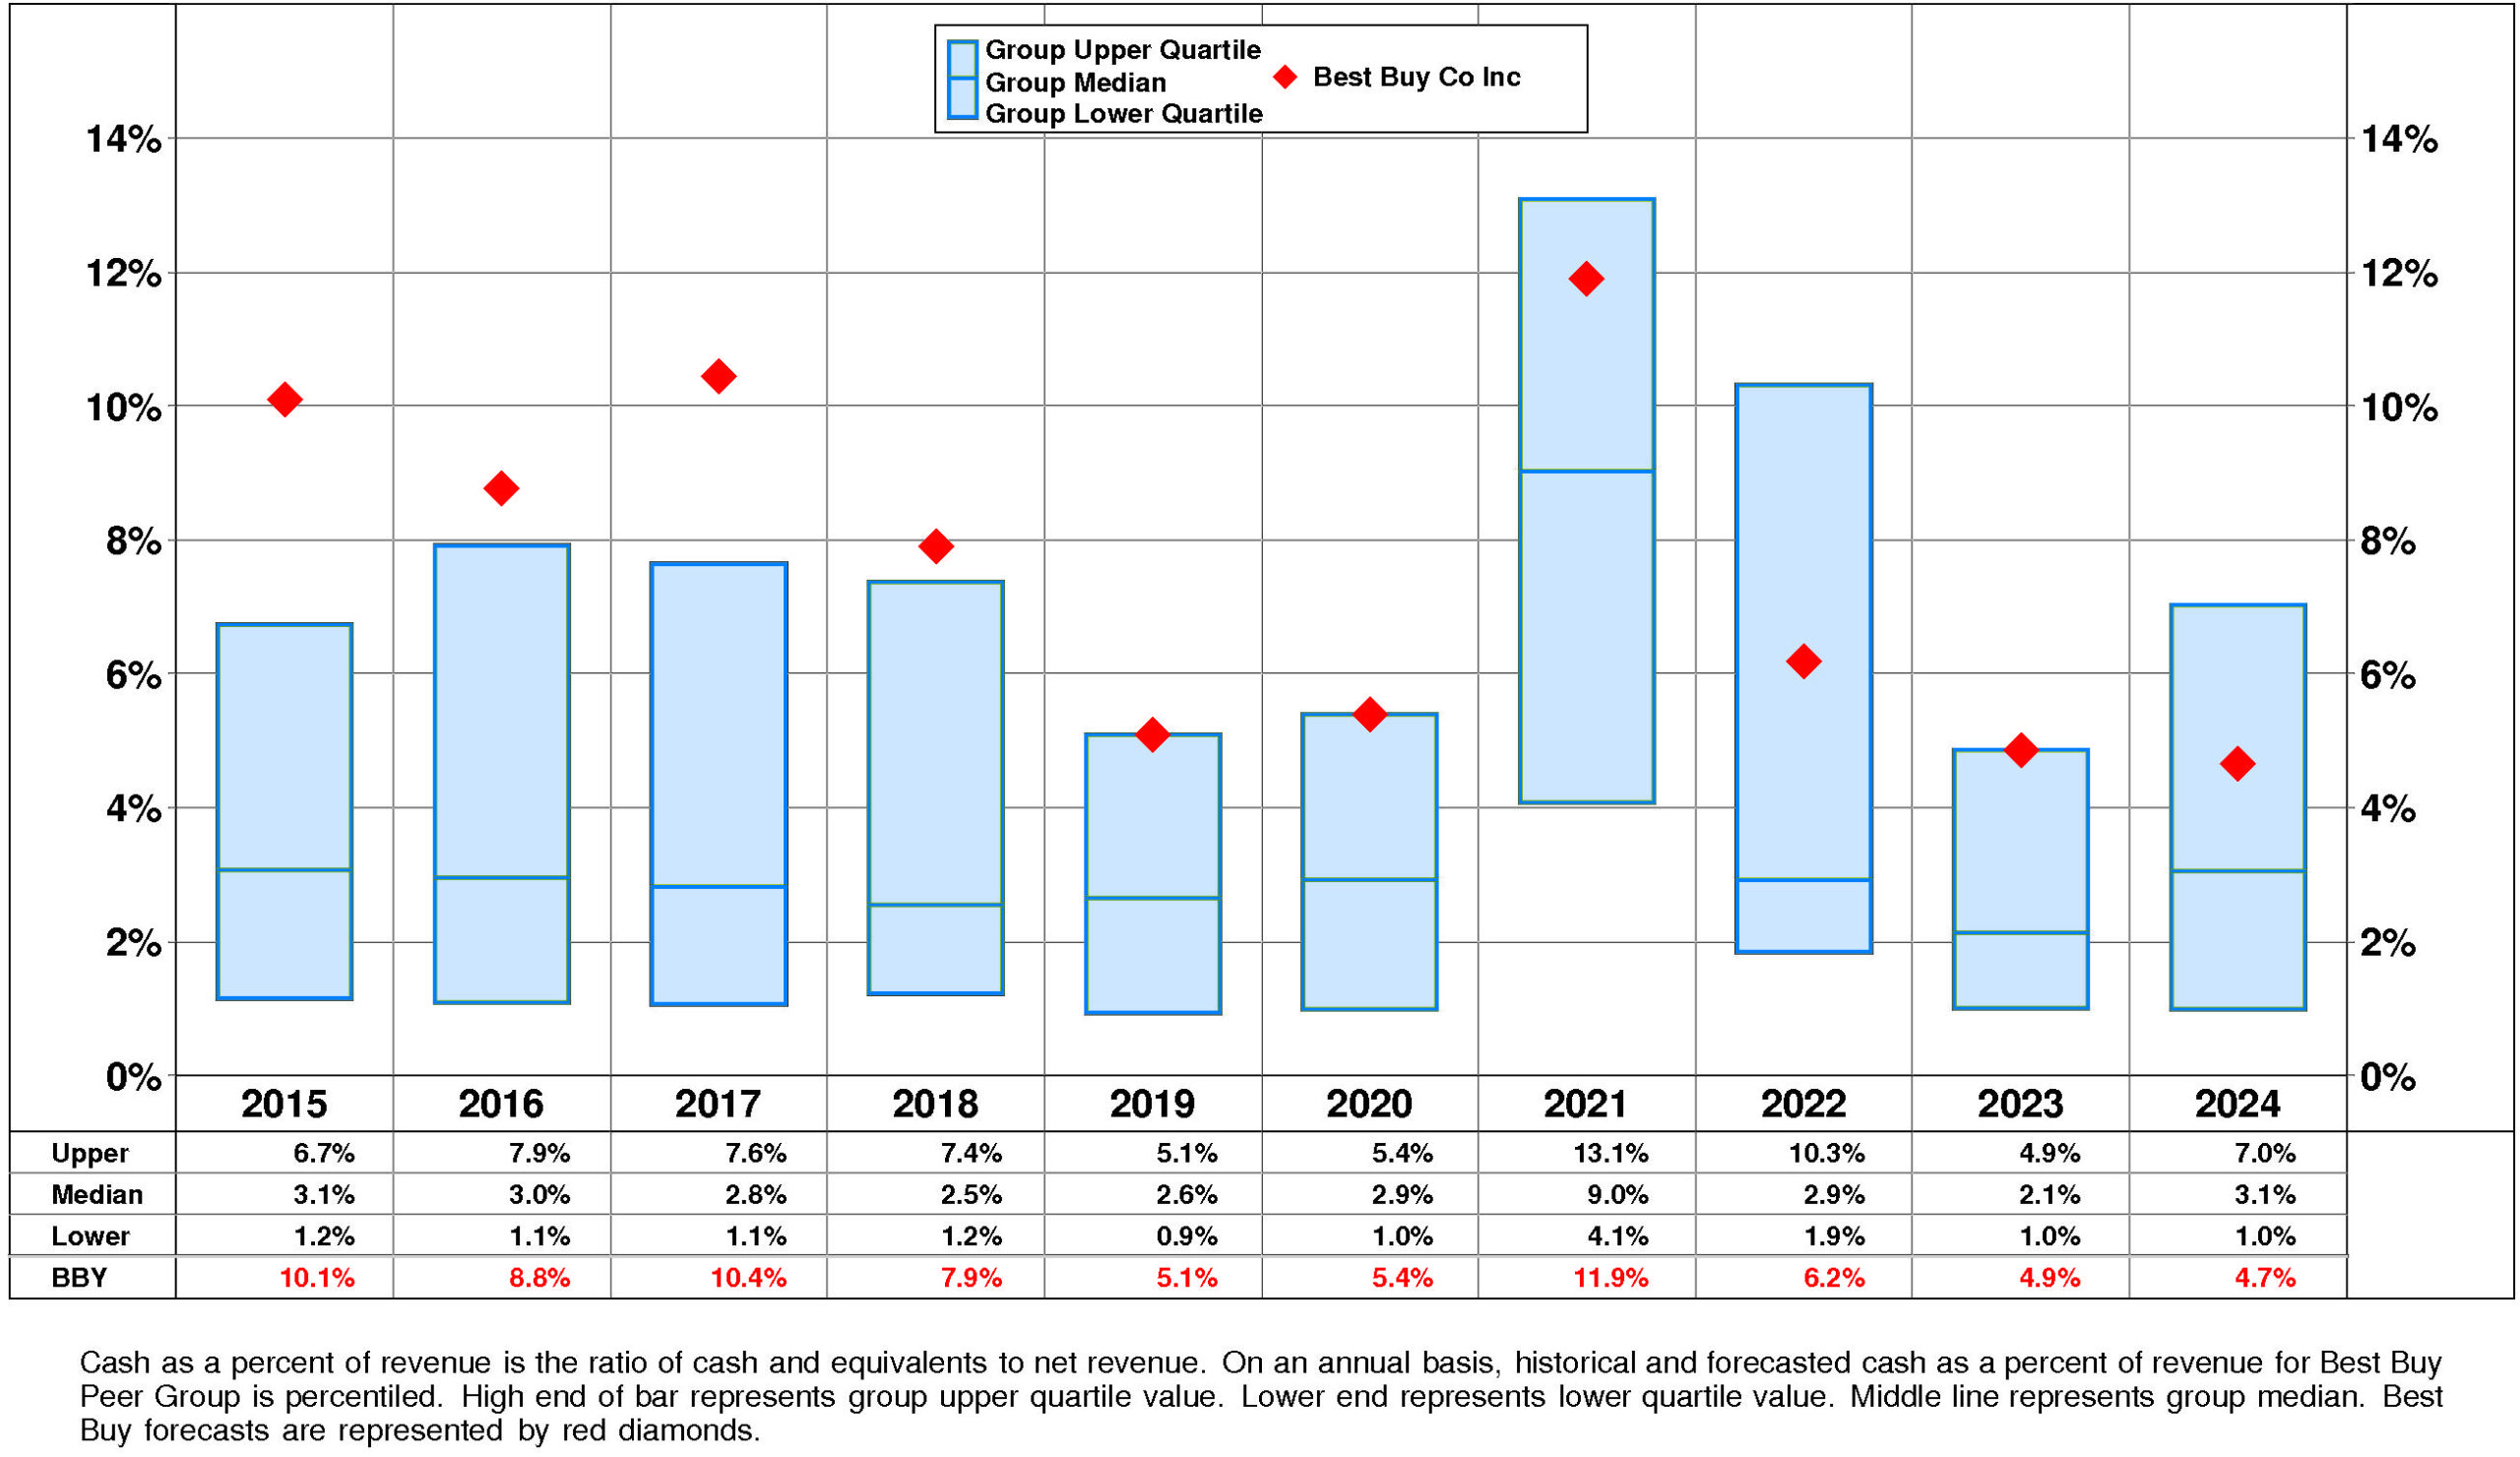
Best Buy’s Cash, %Revenue has experienced a small downtrend over the period. This downtrend was accompanied by stability for the Best Buy Peer Group. In most years, Best Buy was in the top quartile. Currently, Best Buy is above median at +5%.
PROFITABILITY
Best Buy’s return on equity has improved very significantly since 2015. The current level of 40.6% is 1.63X the low for the period and is -8.2% from the high.
The key to the story for BBY is a very small positive trend in pretax operating return significantly augmented by a very strong positive trend in non-operating factors.
The productivity of Best Buy’s assets remained stable over the full period 2015-2024: asset turnover has exhibited little to no overall change.
Additionally, pretax margin has exhibited a volatile overall uptrend but it experienced a very sharp decline after the 2022 high.
Non-operating factors (income taxes and financial leverage) had a very significant positive influence on return on equity.

Best Buy’s return on equity is substantially above median (40.6%) for the four quarters ended January, 2024.
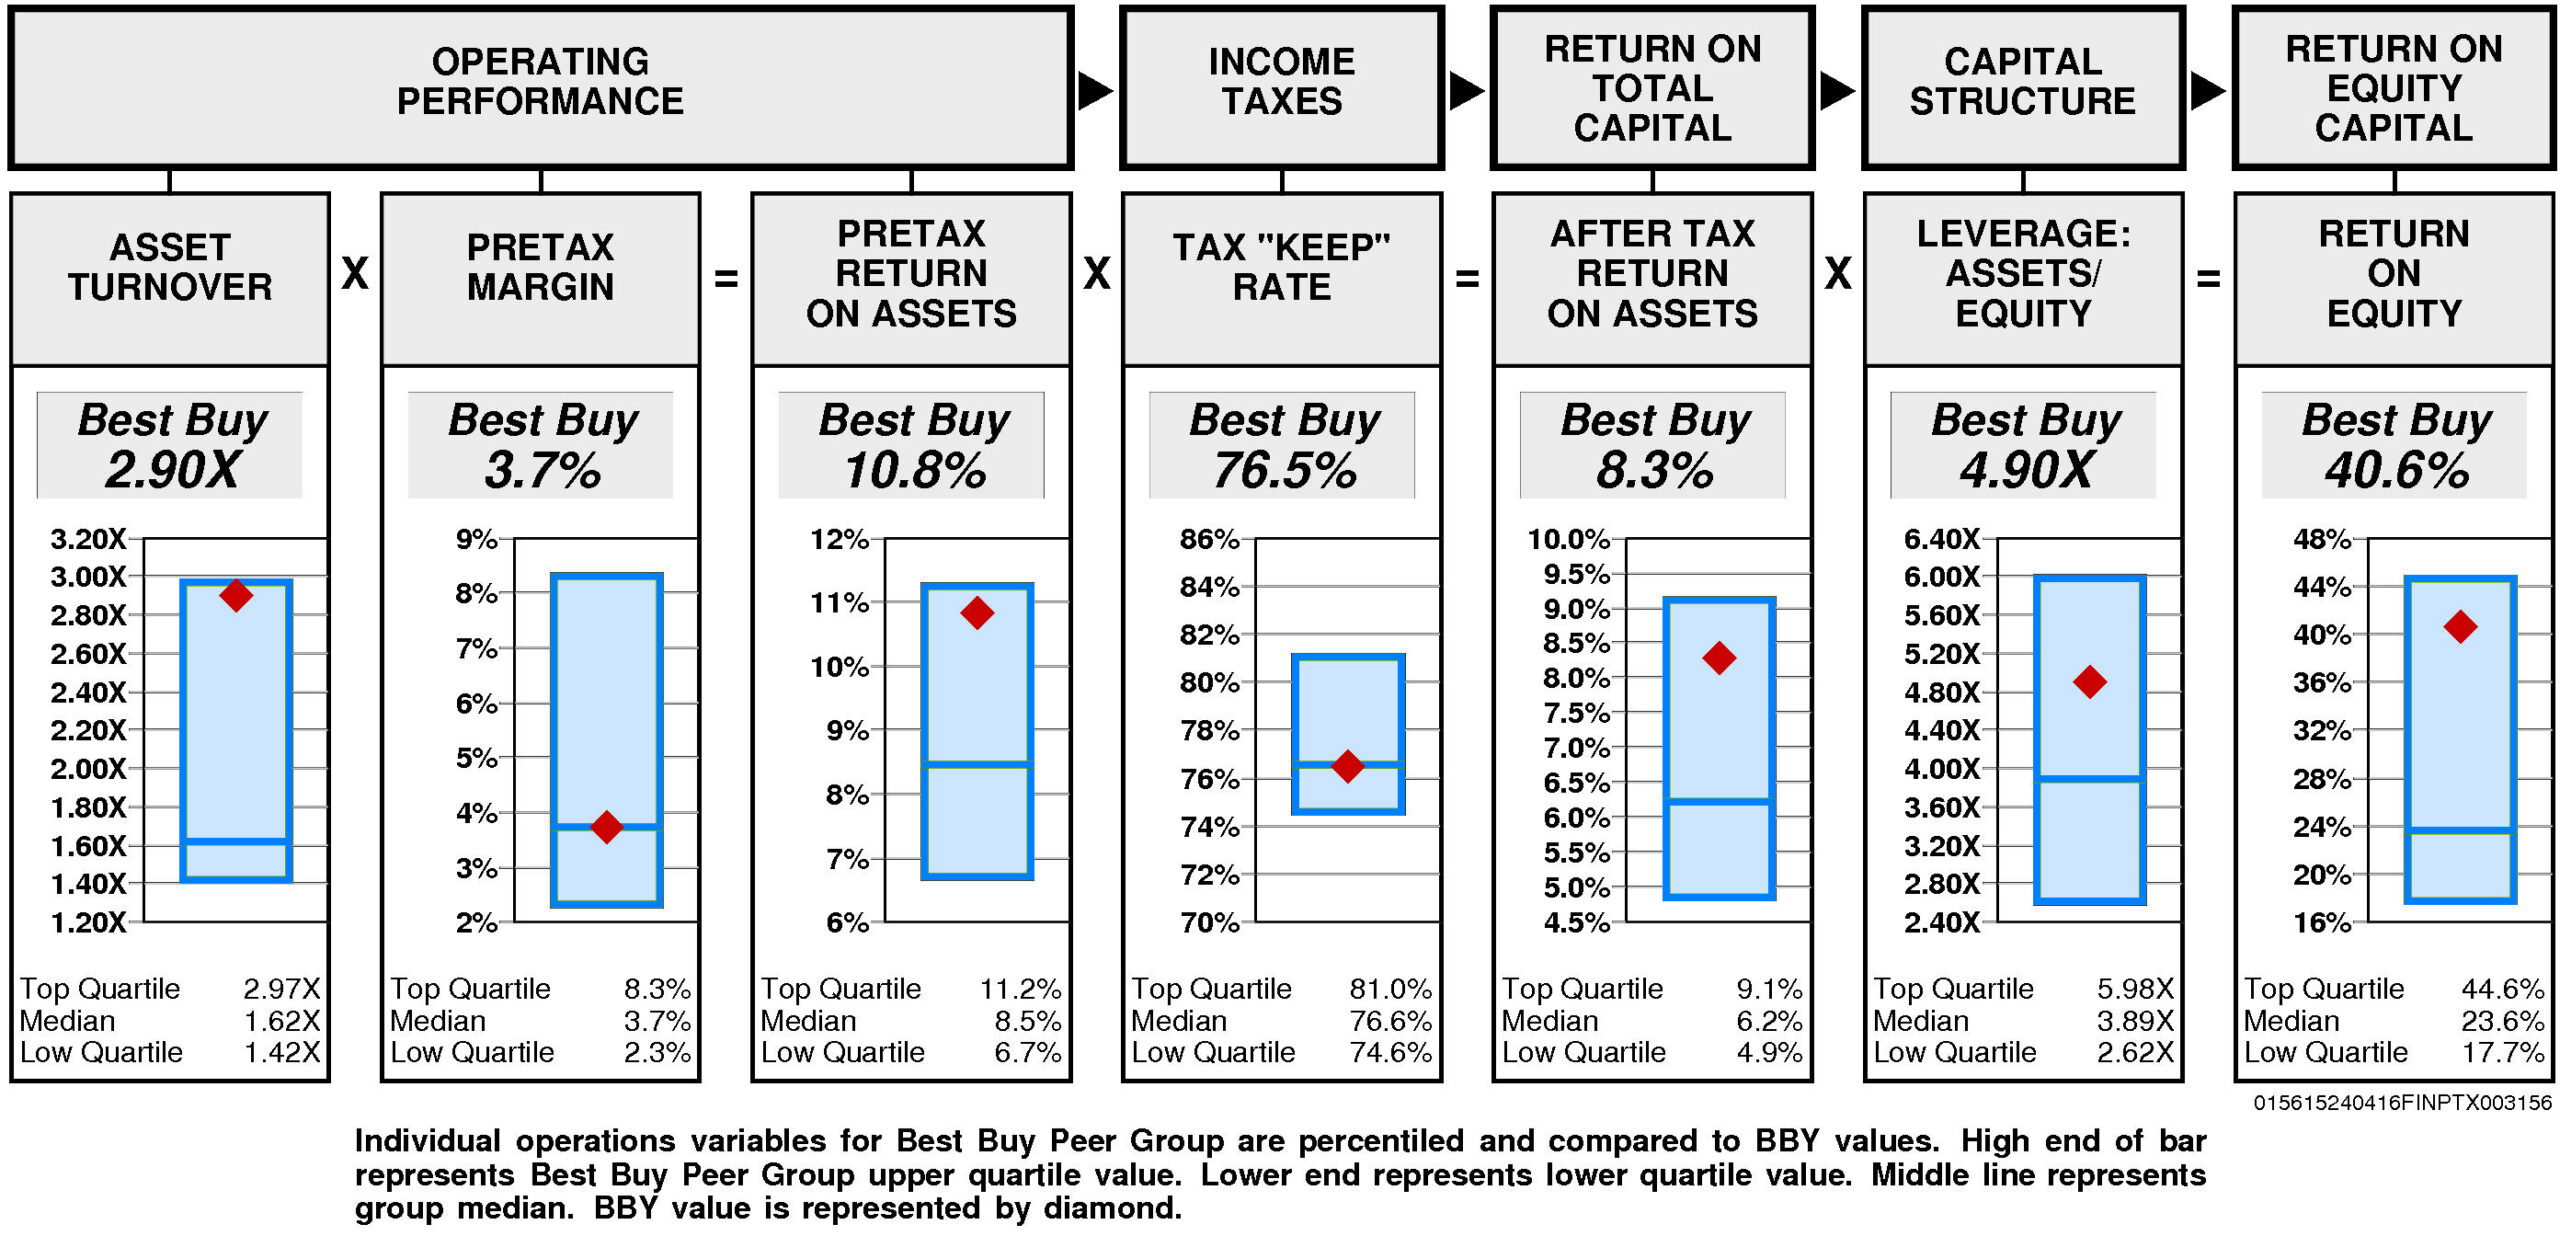
Operating performance (pretax return on assets) is substantially above median (10.8%) reflecting asset turnover that is substantially above median (2.90X) and at median pretax margin (3.7%).
Tax “keep” rate (income tax management) is at median (76.5%) resulting in after tax return on assets that is above median.
Financial leverage (leverage) is above median (4.90X).
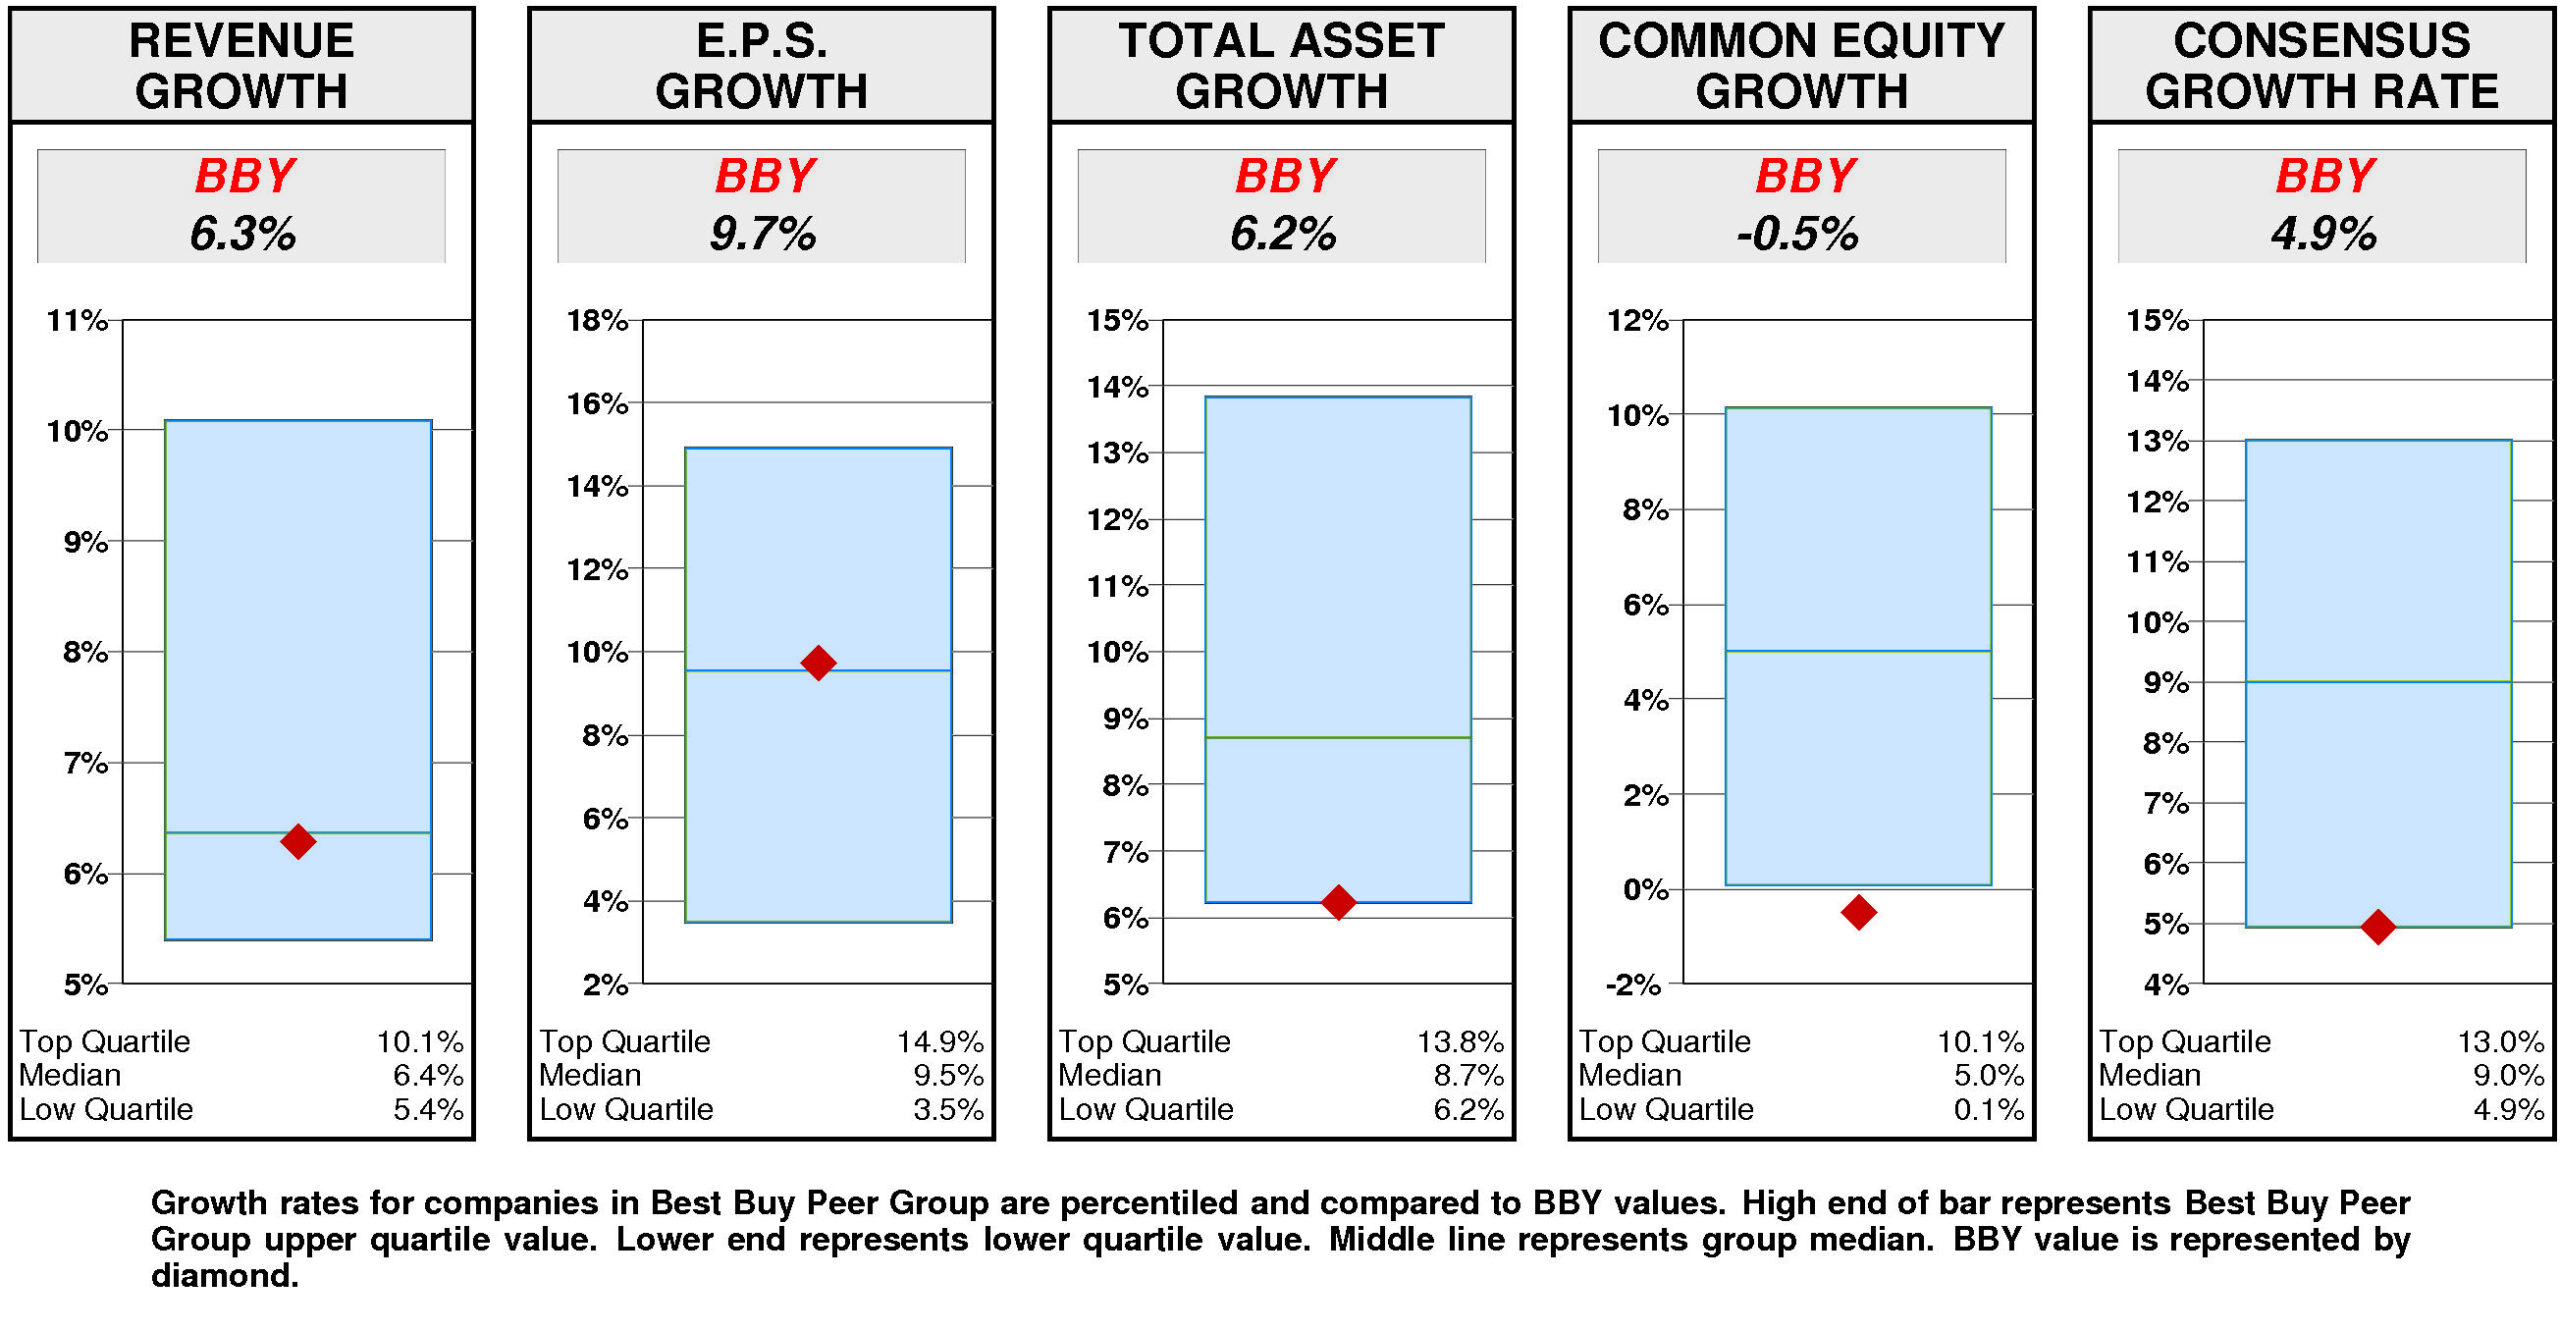
GROWTH RATES
Overall, Best Buy’s growth rate has slowed very considerably in recent years.
Best Buy’s historical income statement growth and balance sheet growth have diverged. Revenue growth has paralleled asset growth; earnings growth has exceeded equity growth.
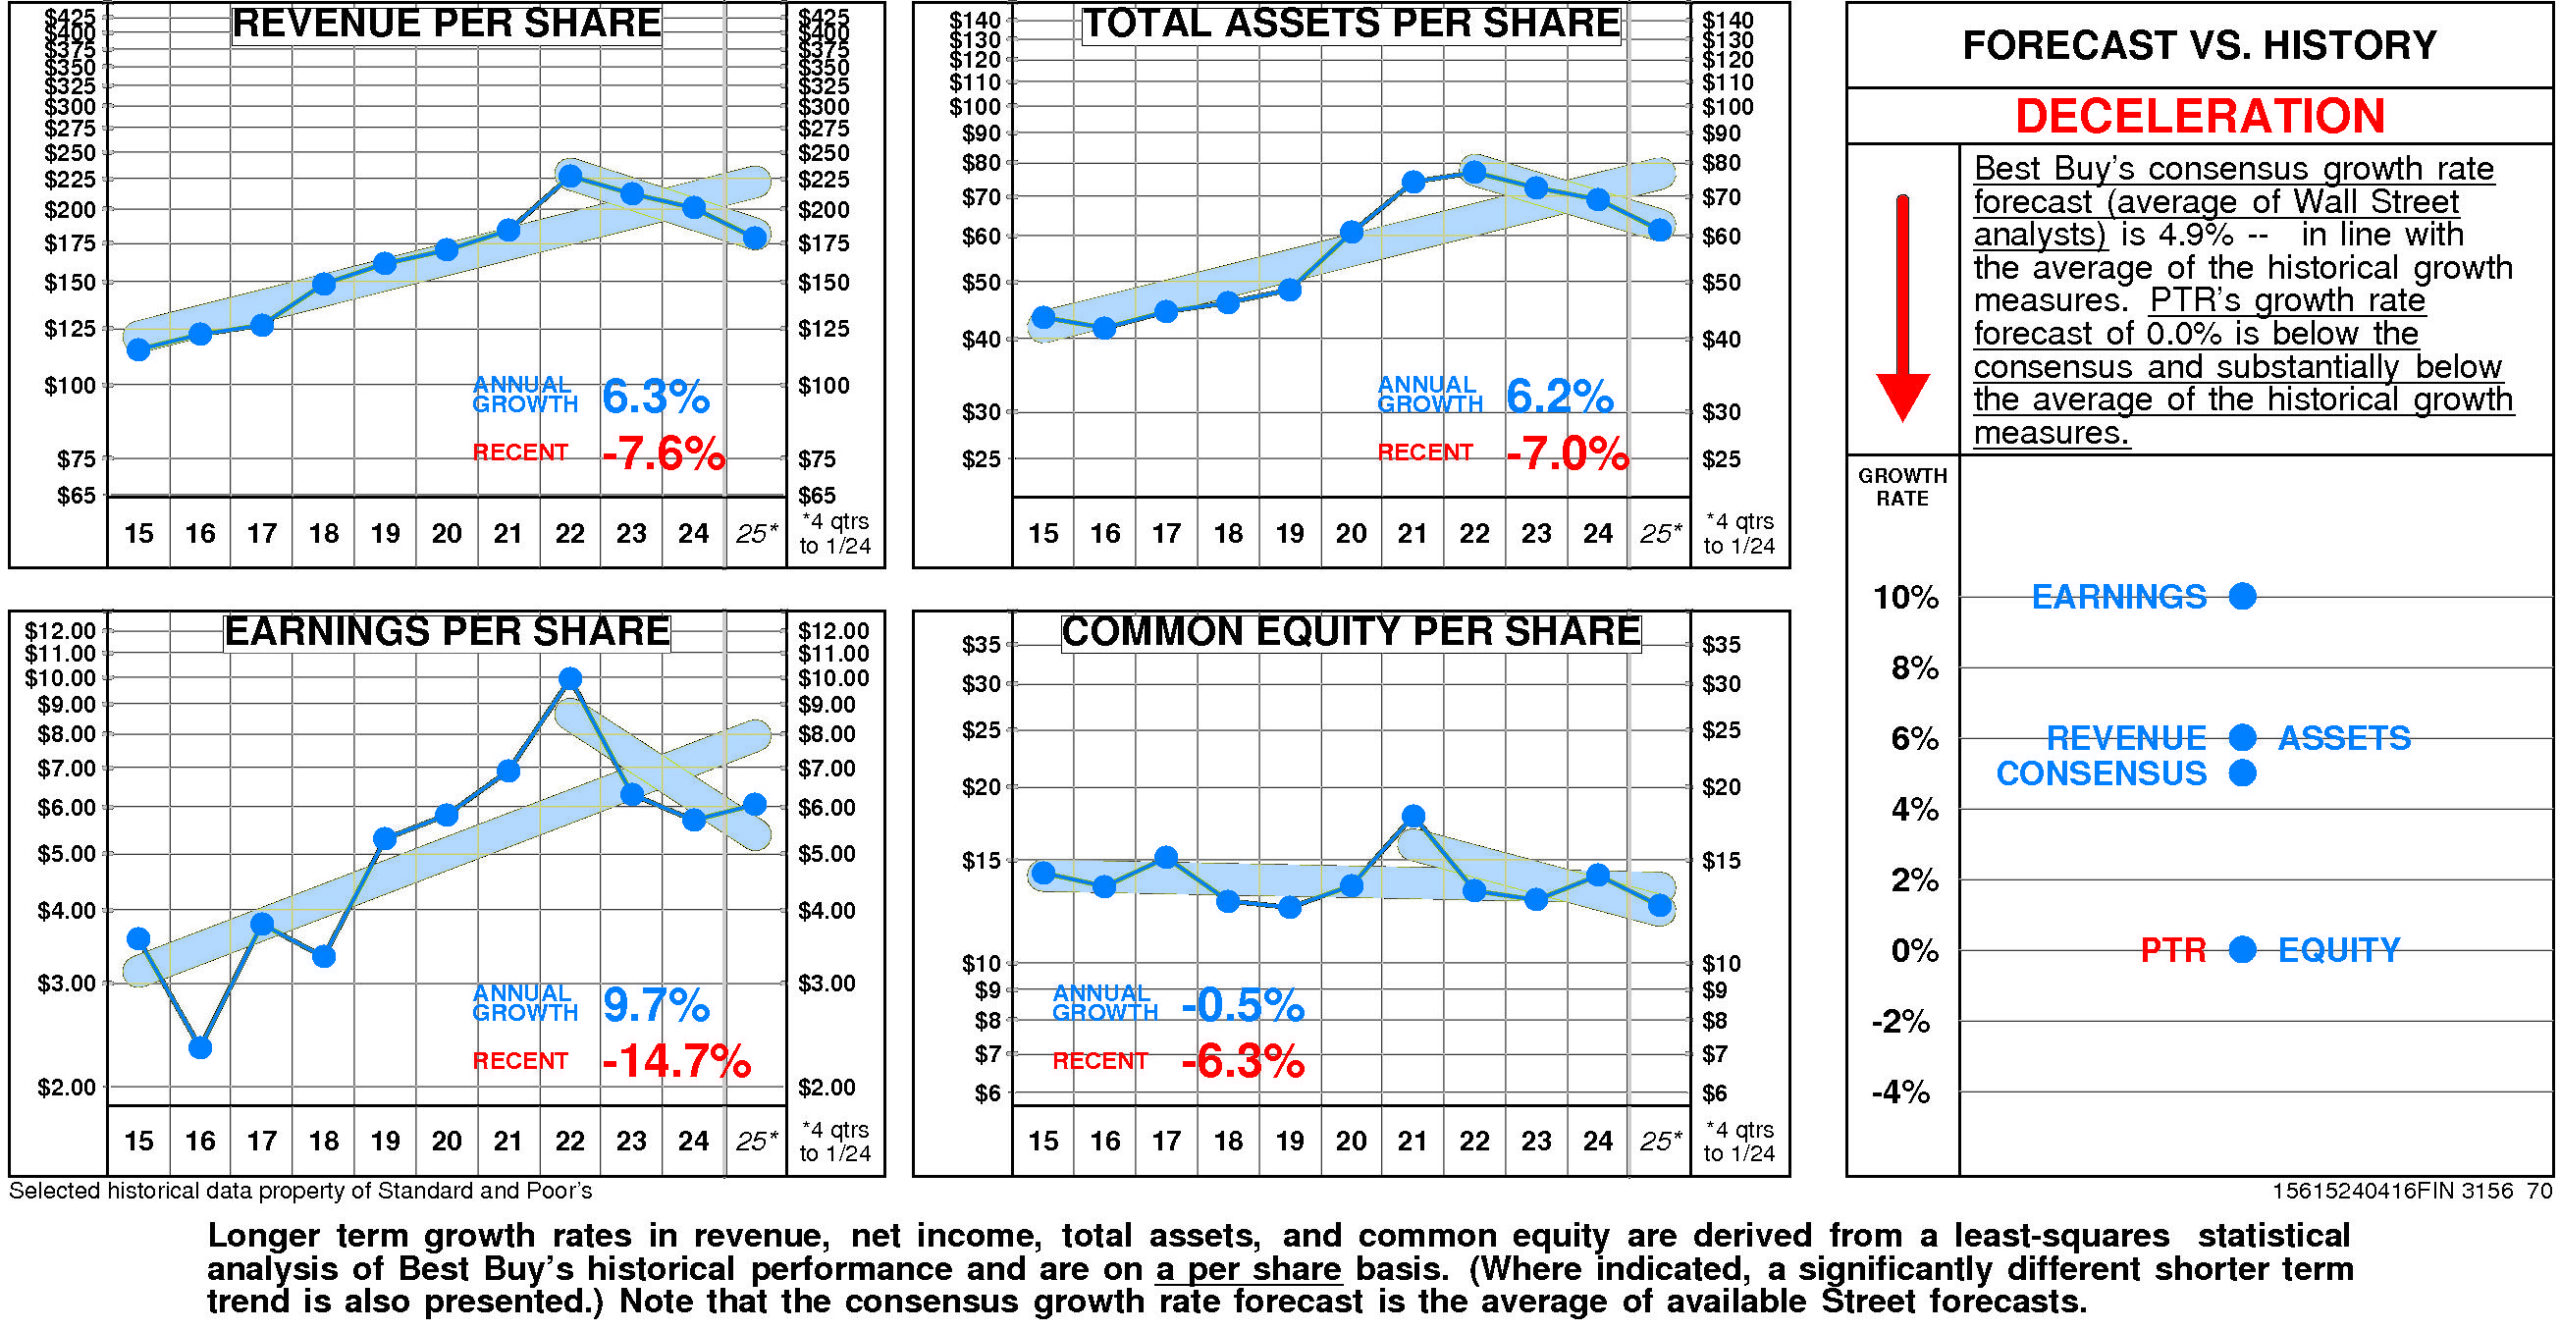
Annual revenue growth has been 6.3% per year. (More recently it has been -7.6%.)
Total asset growth has been 6.2% per year. (More recently it has been -7.0%.)
Annual E.P.S. growth has been 9.7% per year. (More recently it has been -14.7%.)
Equity growth has been -0.5% per year. (More recently it has been -6.3%.)
Best Buy’s consensus growth rate forecast (average of Wall Street analysts) is 4.9% — in line with the average of the historical growth measures.
Relative to the Best Buy Peer Group, Best Buy’s historical growth measures are erratic. Revenue growth (6.3%) has been at median. E.P.S. growth (9.7%) has been at median. Total asset growth (6.2%) has been at the lower quartile. Equity growth (-0.5%) has been lower quartile.
Consensus growth forecast (4.9%) is at the lower quartile.
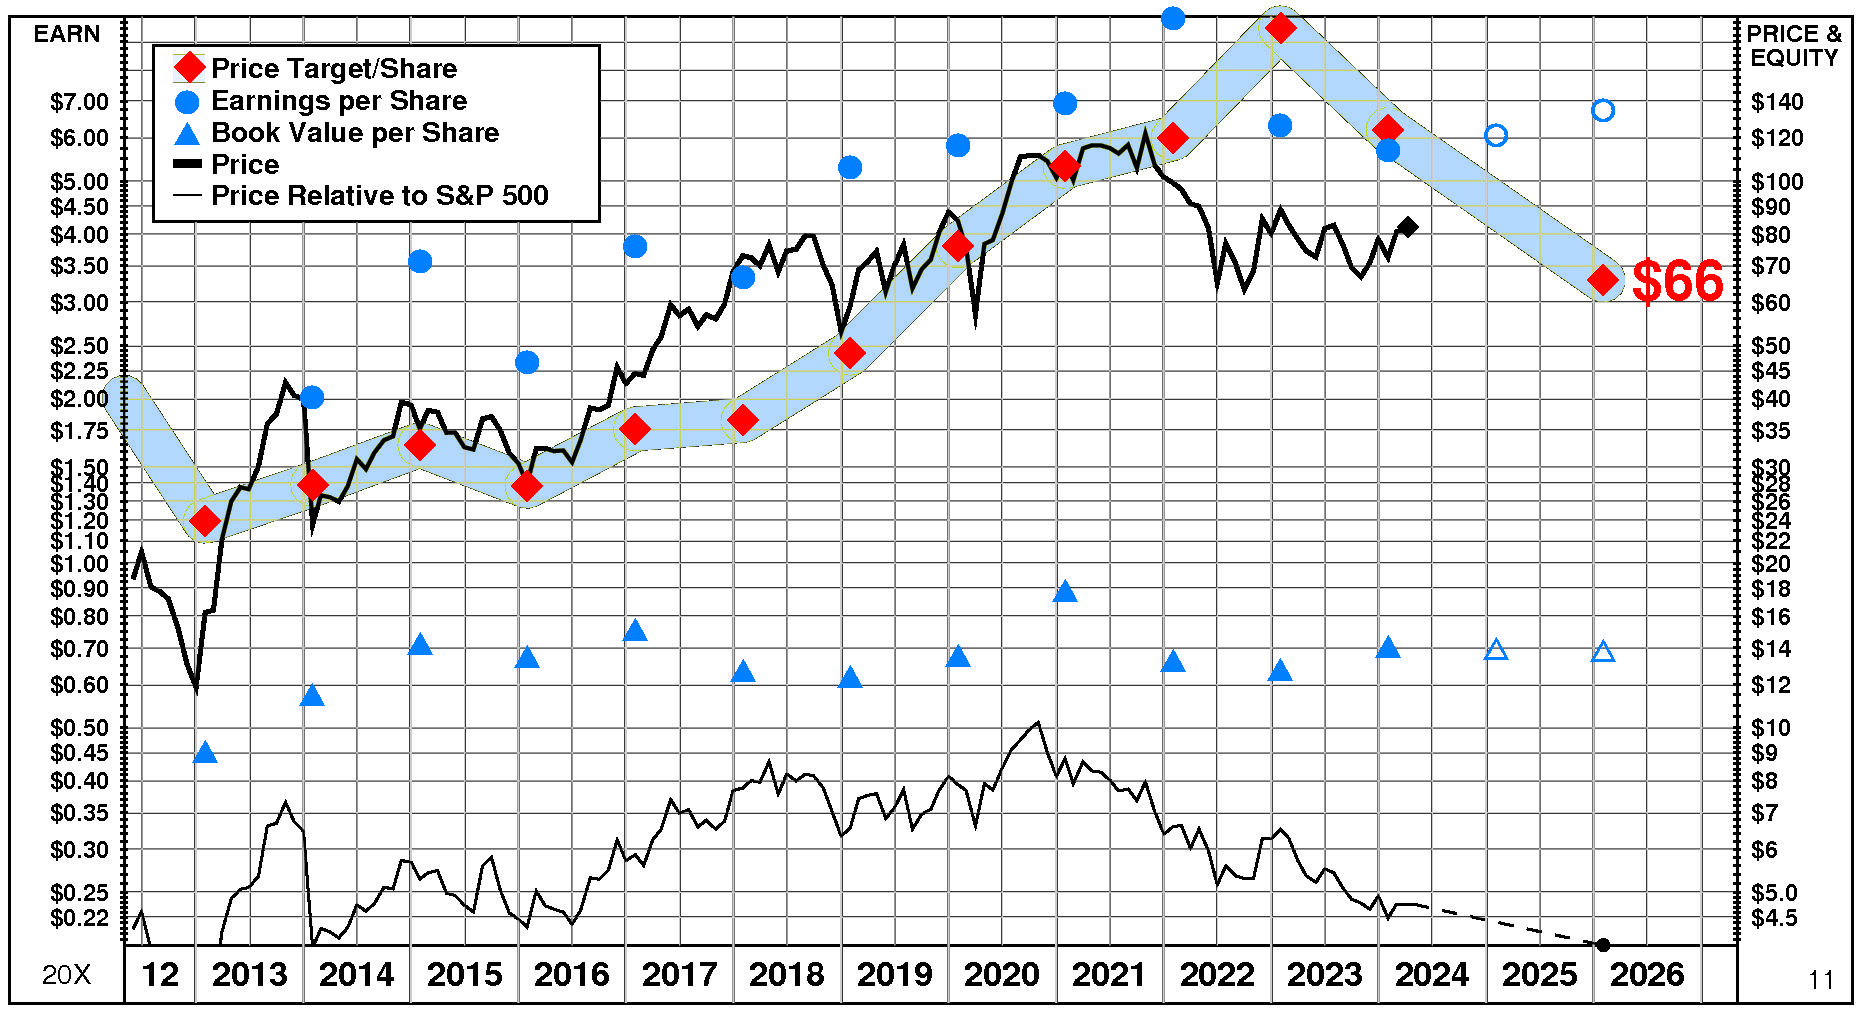
PRICE HISTORY
Over the full time period, Best Buy’s stock price performance has been variable and in line with the market. Between June, 2013 and April, 2024, Best Buy’s stock price rose +202%; relative to the market, this was a -7% loss. Significant price moves during the period: 1) March, 2020 – October, 2021: +114%; and 2) January, 2016 – August, 2018: +185%.

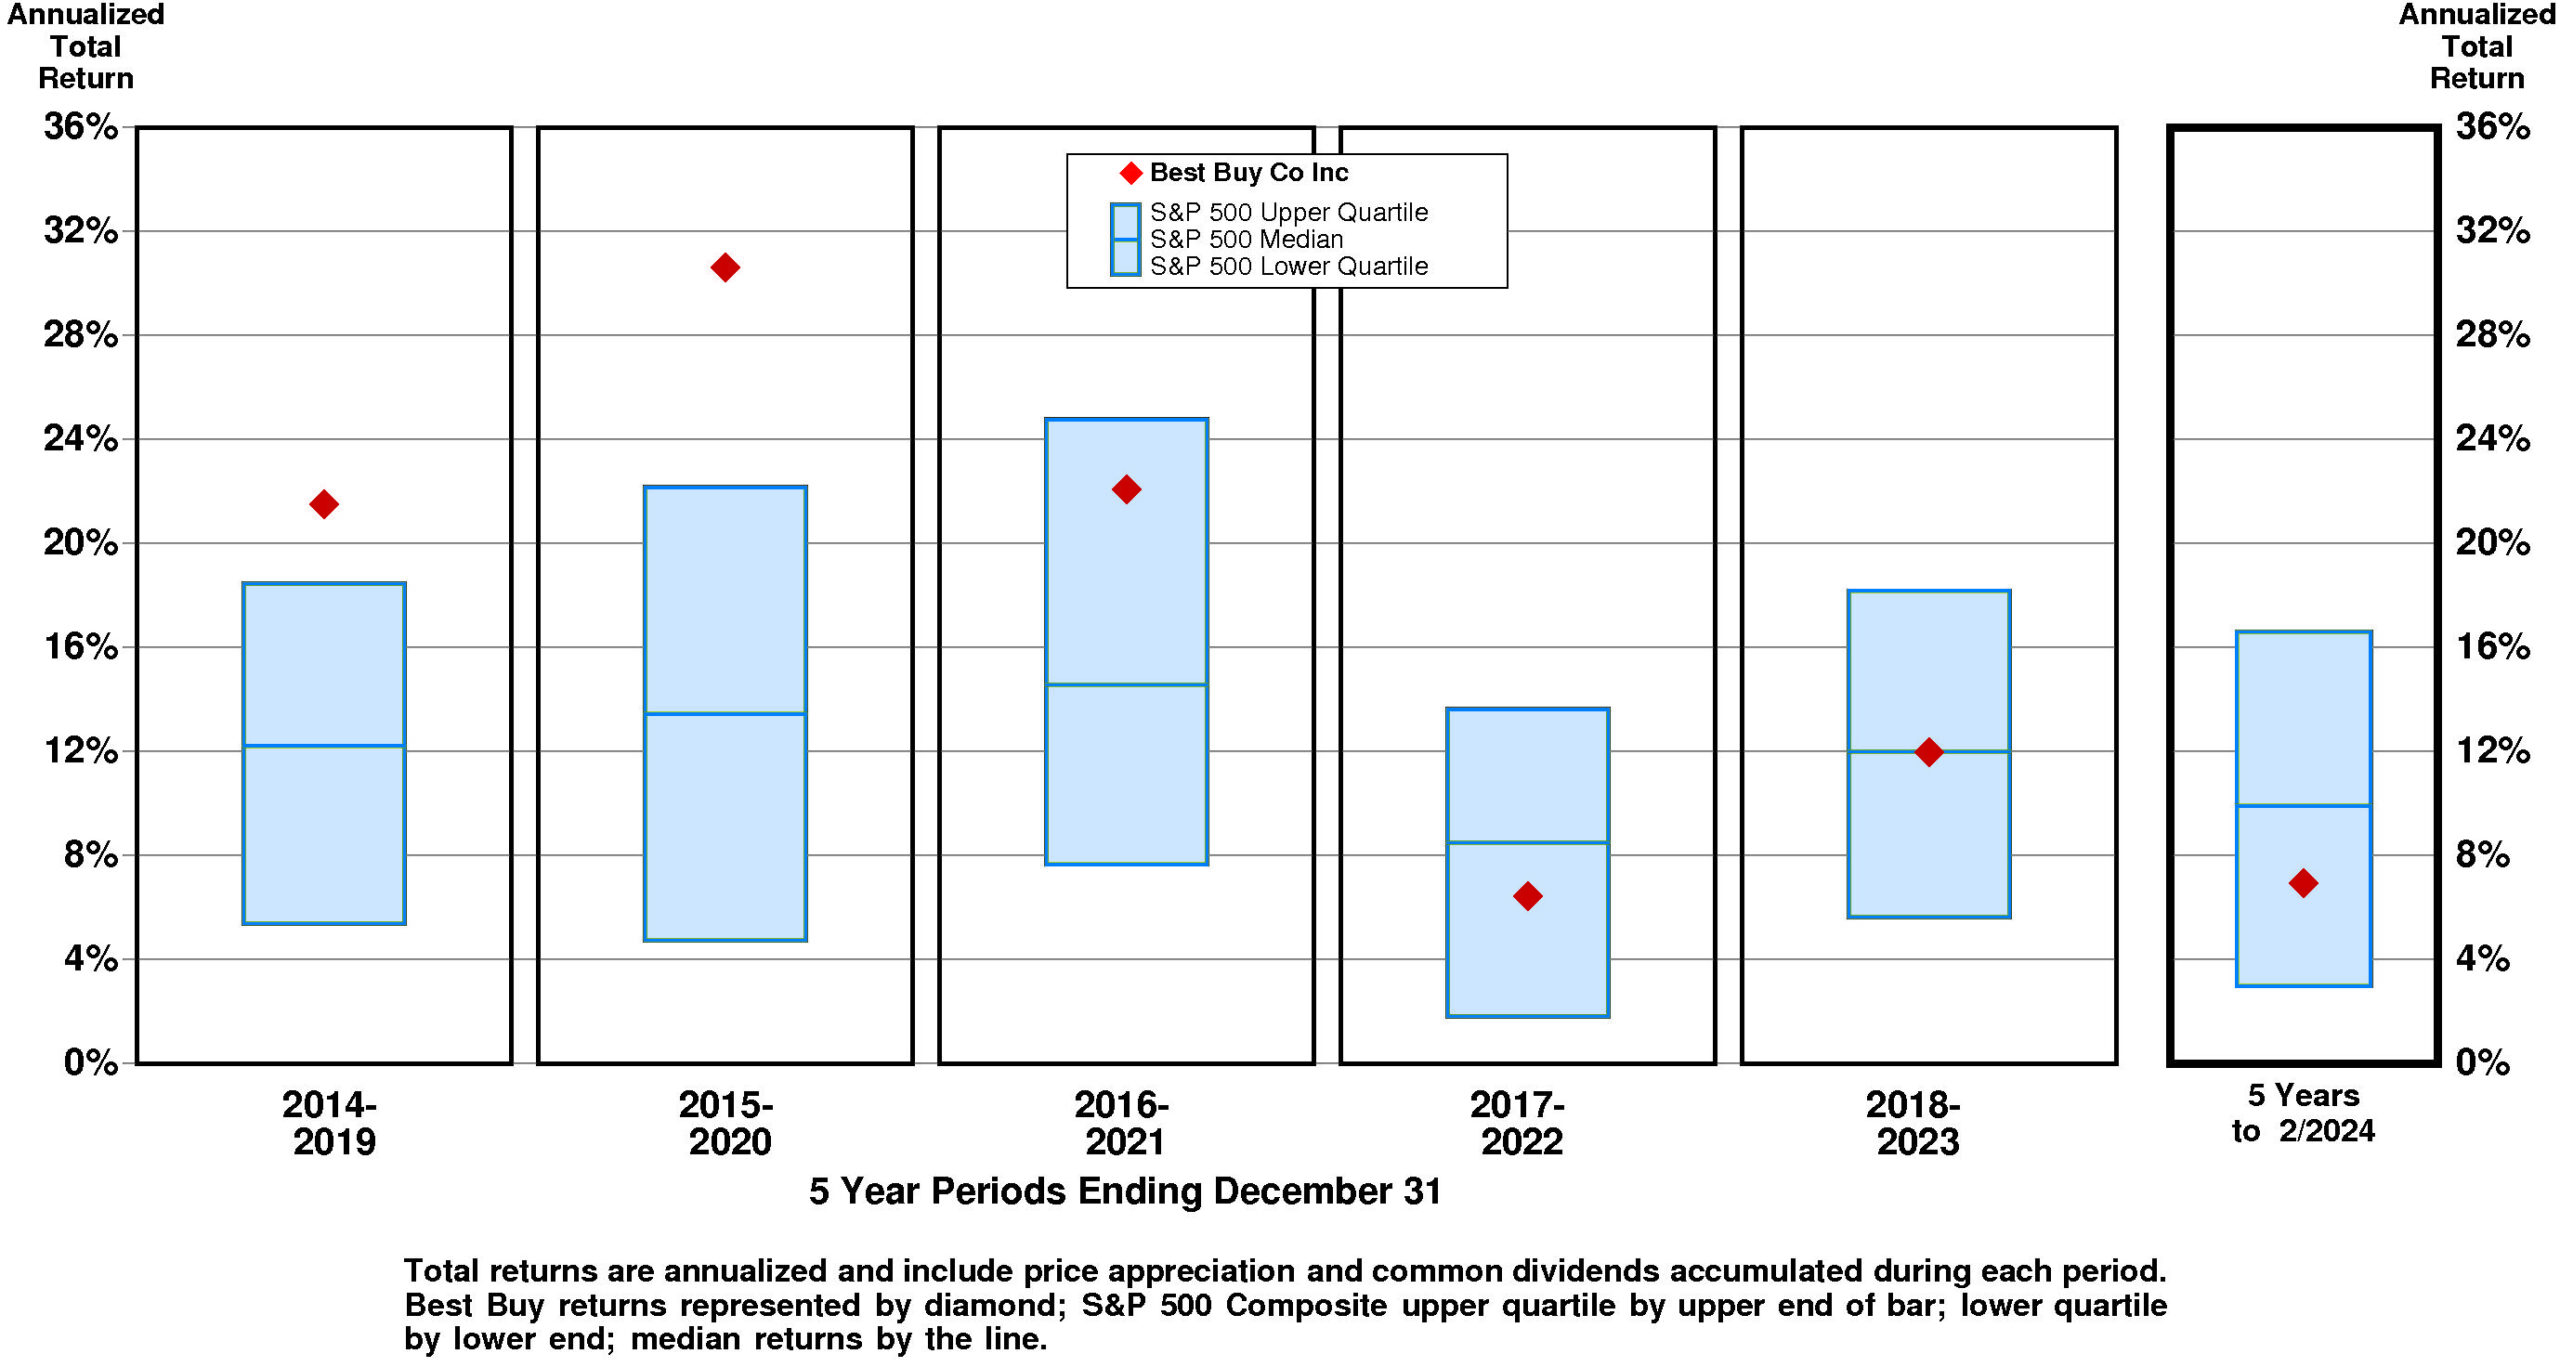
TOTAL INVESTMENT RETURNS
Current annual total return performance of 2.1% is below median relative to the S&P 500 Composite.
In addition to being below median relative to S&P 500 Composite, current annual total return performance through February, 2024 of 2.1% is at median relative to Best Buy Co Inc Peer Group.
Current 5-year total return performance of 6.9% is below median relative to the S&P 500 Composite.
Through February, 2024, with below median current 5-year total return of 6.9% relative to S&P 500 Composite, Best Buy’s total return performance is slightly above median relative to Best Buy Co Inc Peer Group.
VALUATION BENCHMARKS
Relative to S&P 500 Composite, BBY’s overall valuation is quite low. The highest factor, the price/equity ratio, is above median. Ratio of enterprise value/assets is below median. Ratio of enterprise value/earnings before interest and taxes is lower quartile. Price/earnings ratio is lower quartile. The lowest factor, the ratio of enterprise value/revenue, is lower quartile.
Relative to Best Buy Peer Group, BBY’s overall valuation is quite low. The highest factor, the price/equity ratio, is at median. Ratio of enterprise value/earnings before interest and taxes is lower quartile. Ratio of enterprise value/assets is below median. Price/earnings ratio is lower quartile. The lowest factor, the ratio of enterprise value/revenue, is lower quartile.
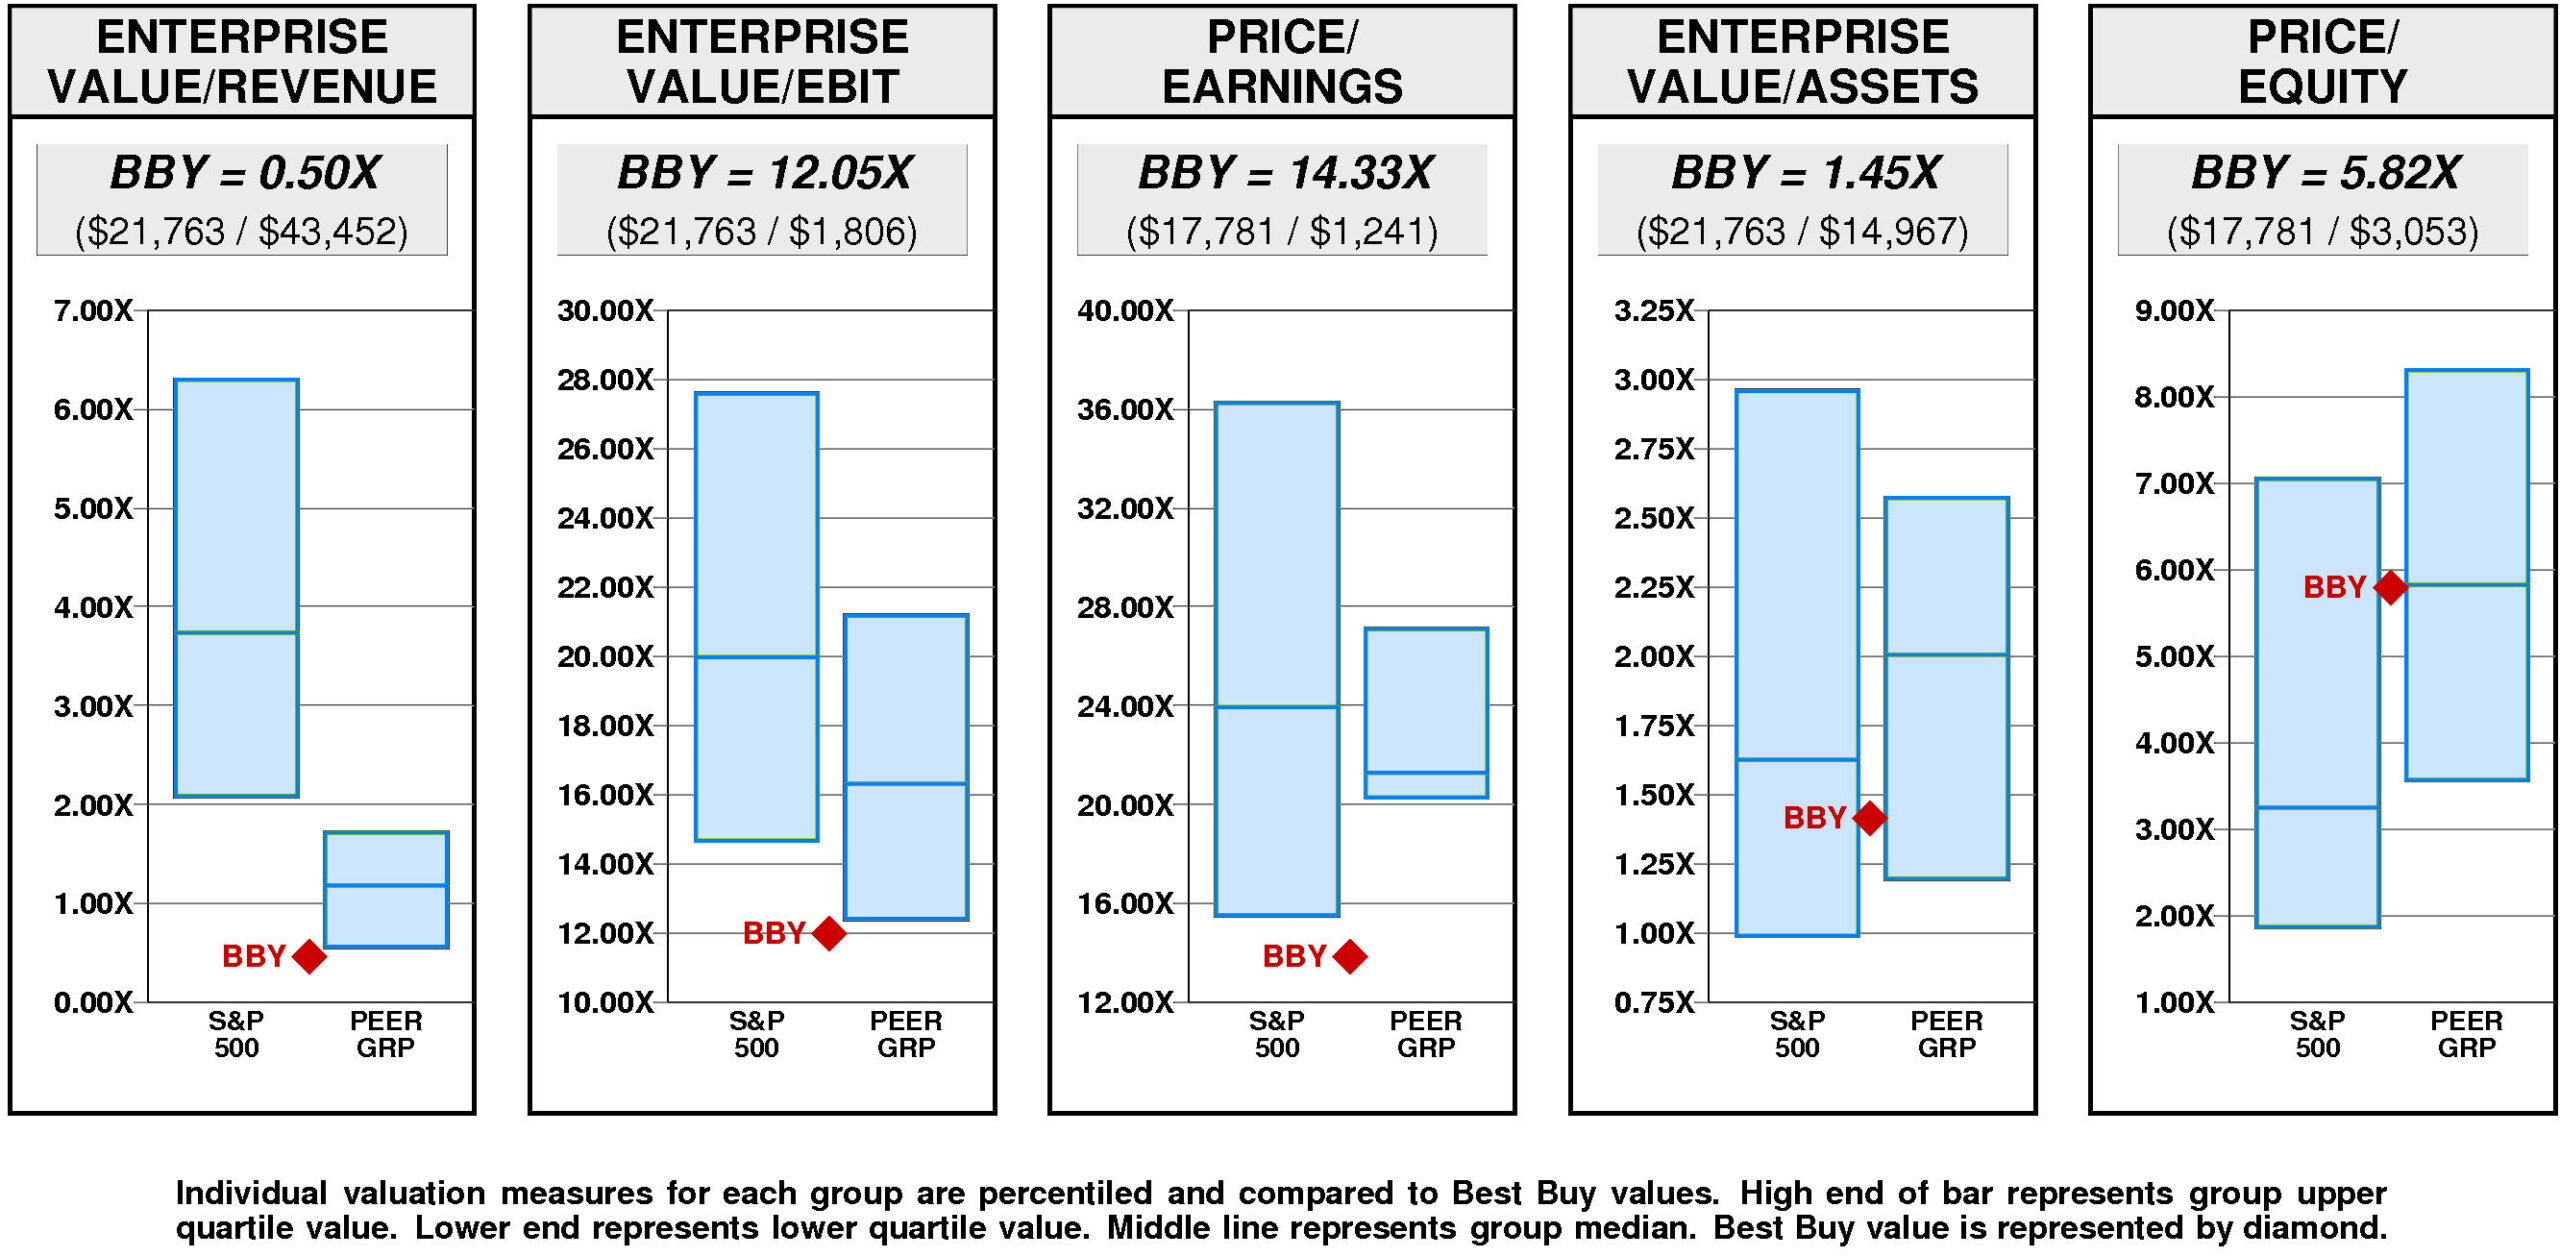
Best Buy has a major value gap compared to the median. For BBY to hit median valuation, its current ratio of enterprise value/revenue would have to rise from the current level of 0.50X to 1.18X. If BBY’s ratio of enterprise value/revenue were to rise to 1.18X, its stock price would be higher by $137 to $220.
For BBY to achieve upper quartile valuation relative to the Best Buy Peer Group, its current ratio of enterprise value/revenue would have to rise from the current level of 0.50X to 1.72X. If BBY’s ratio of enterprise value/revenue were to rise to 1.72X, its stock price would increase by $245 from the current level of $83.
VALUE TARGETS
With future capital returns forecasted to exceed the cost of capital, BBY is expected to continue to be a major Value Builder.
Best Buy’s current Price Target of $66 represents a -20% change from the current price of $82.55.
This low appreciation potential results in an appreciation score of 26 (74% of the universe has greater appreciation potential.)
With this low Appreciation Score of 26, the neutral Power Rating of 46 results in an Value Trend Rating of D.
Best Buy’s current Price Target is $66 (-47% from the 2024 Target of $124 and -20% from the 04/09/24 price of $82.55). This dramatic fall in the Target is the result of a -3% decrease in the equity base and a -45% decrease in the price/equity multiple. The forecasted decline in growth has a very large negative impact on the price/equity multiple and the forecasted decline in return on equity has a slight negative impact as well. Partially offsetting these Drivers, the forecasted decline in cost of equity has a slight positive impact.
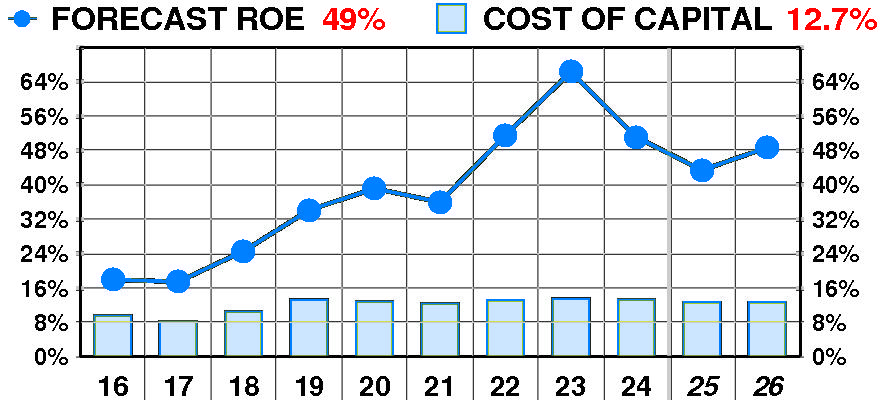
PTR’s return on equity forecast is 48.7% — slightly below our recent forecasts. Forecasted return on equity enjoyed a dramatic, steady increase between 2016 and 2024. The current forecast is significantly above the 2017 low of 17%.
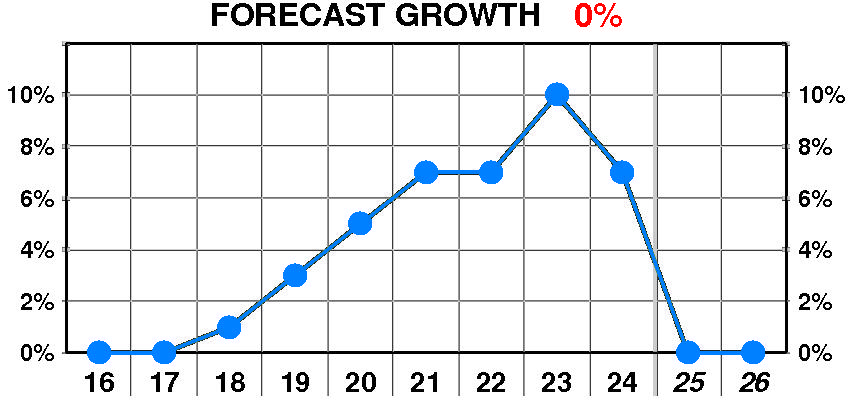
PTR’s growth forecast is 0.0% — below our recent forecasts. Forecasted growth enjoyed a dramatic, variable increase between 2018 and 2024. The current forecast is significantly below the 2023 peak of 10%.
PTR’s cost of equity forecast is 12.7% — in line with recent levels. Forecasted cost of equity suffered a dramatic, variable increase between 2016 and 2024. The current forecast is above the 2017 low of 8.2%.
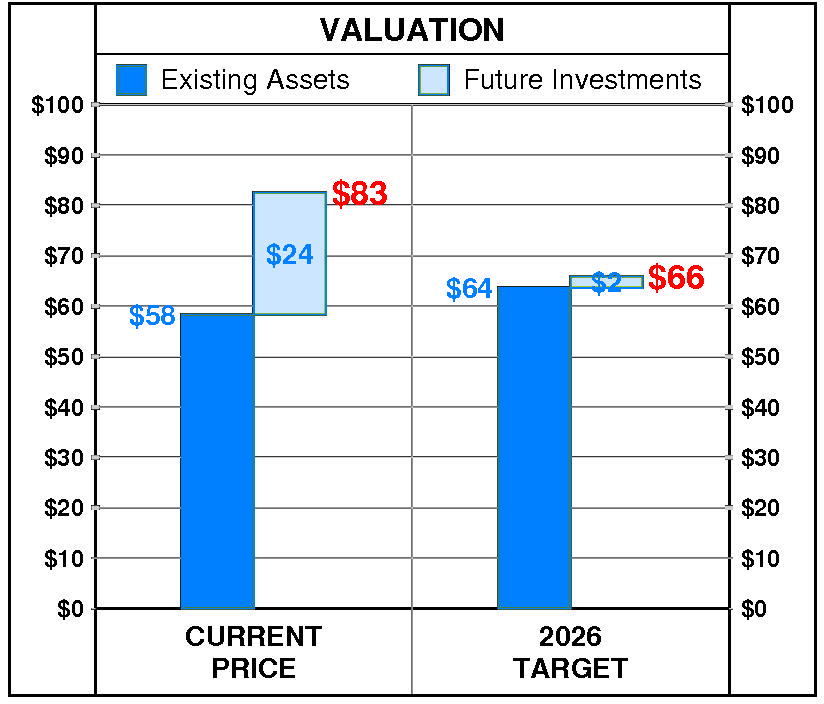
At Best Buy’s current price of $82.55, investors are placing a positive value of $24 on its future investments. This view is consistent with the company’s most recent performance that reflected a growth rate of 7.0% per year, and a return on equity of 51.1% versus a cost of equity of 13.3%.
PTR’s 2026 Price Target of $66 is based on these forecasts and reflects an estimated value of existing assets of $64 and a value of future investments of $2.
Be the first to comment