![]()
BUSINESS
Virco Mfg. Corporation engages in the design, production, and distribution of furniture in the United States. It offers seating products, including 4-leg chairs, cantilever chairs, tablet armchairs with work surfaces and compact footprints, steel-frame and floor rockers, stools, series chairs, stack and folding chairs, hard plastic seating, upholstered stack and ergonomic chairs, and plastic stack chairs. The company also provides folding, activity, office, computer, and mobile tables; and computer furniture, such as keyboard mouse trays, CPU holders, support columns, desks and workstations, specialty tables, instructor media stations and towers, and other products. In addition, it offers chair desks, combo units, and tablet arm and caster units, as well as a returns and credenzas.

INVESTMENT RATING

Reflecting future returns on capital that are forecasted to be above the cost of capital, VIRC is expected to continue to be a major Value Builder.
Virco Mfg has a current Value Trend Rating of A (Highest Rating).
The Value Trend Rating reflects inconsistent signals from PTR’s two proprietary measures of a stock’s attractiveness. Virco Mfg has a neutral Appreciation Score of 45 but a very high Power Rating of 99, producing the Highest Value Trend Rating.
Virco Mfg’s stock is selling well below targeted value. The current stock price of $10.49 compares to targeted value 12 months forward of $14.
This neutral appreciation potential results in an appreciation score of 45 (55% of the universe has greater appreciation potential.)
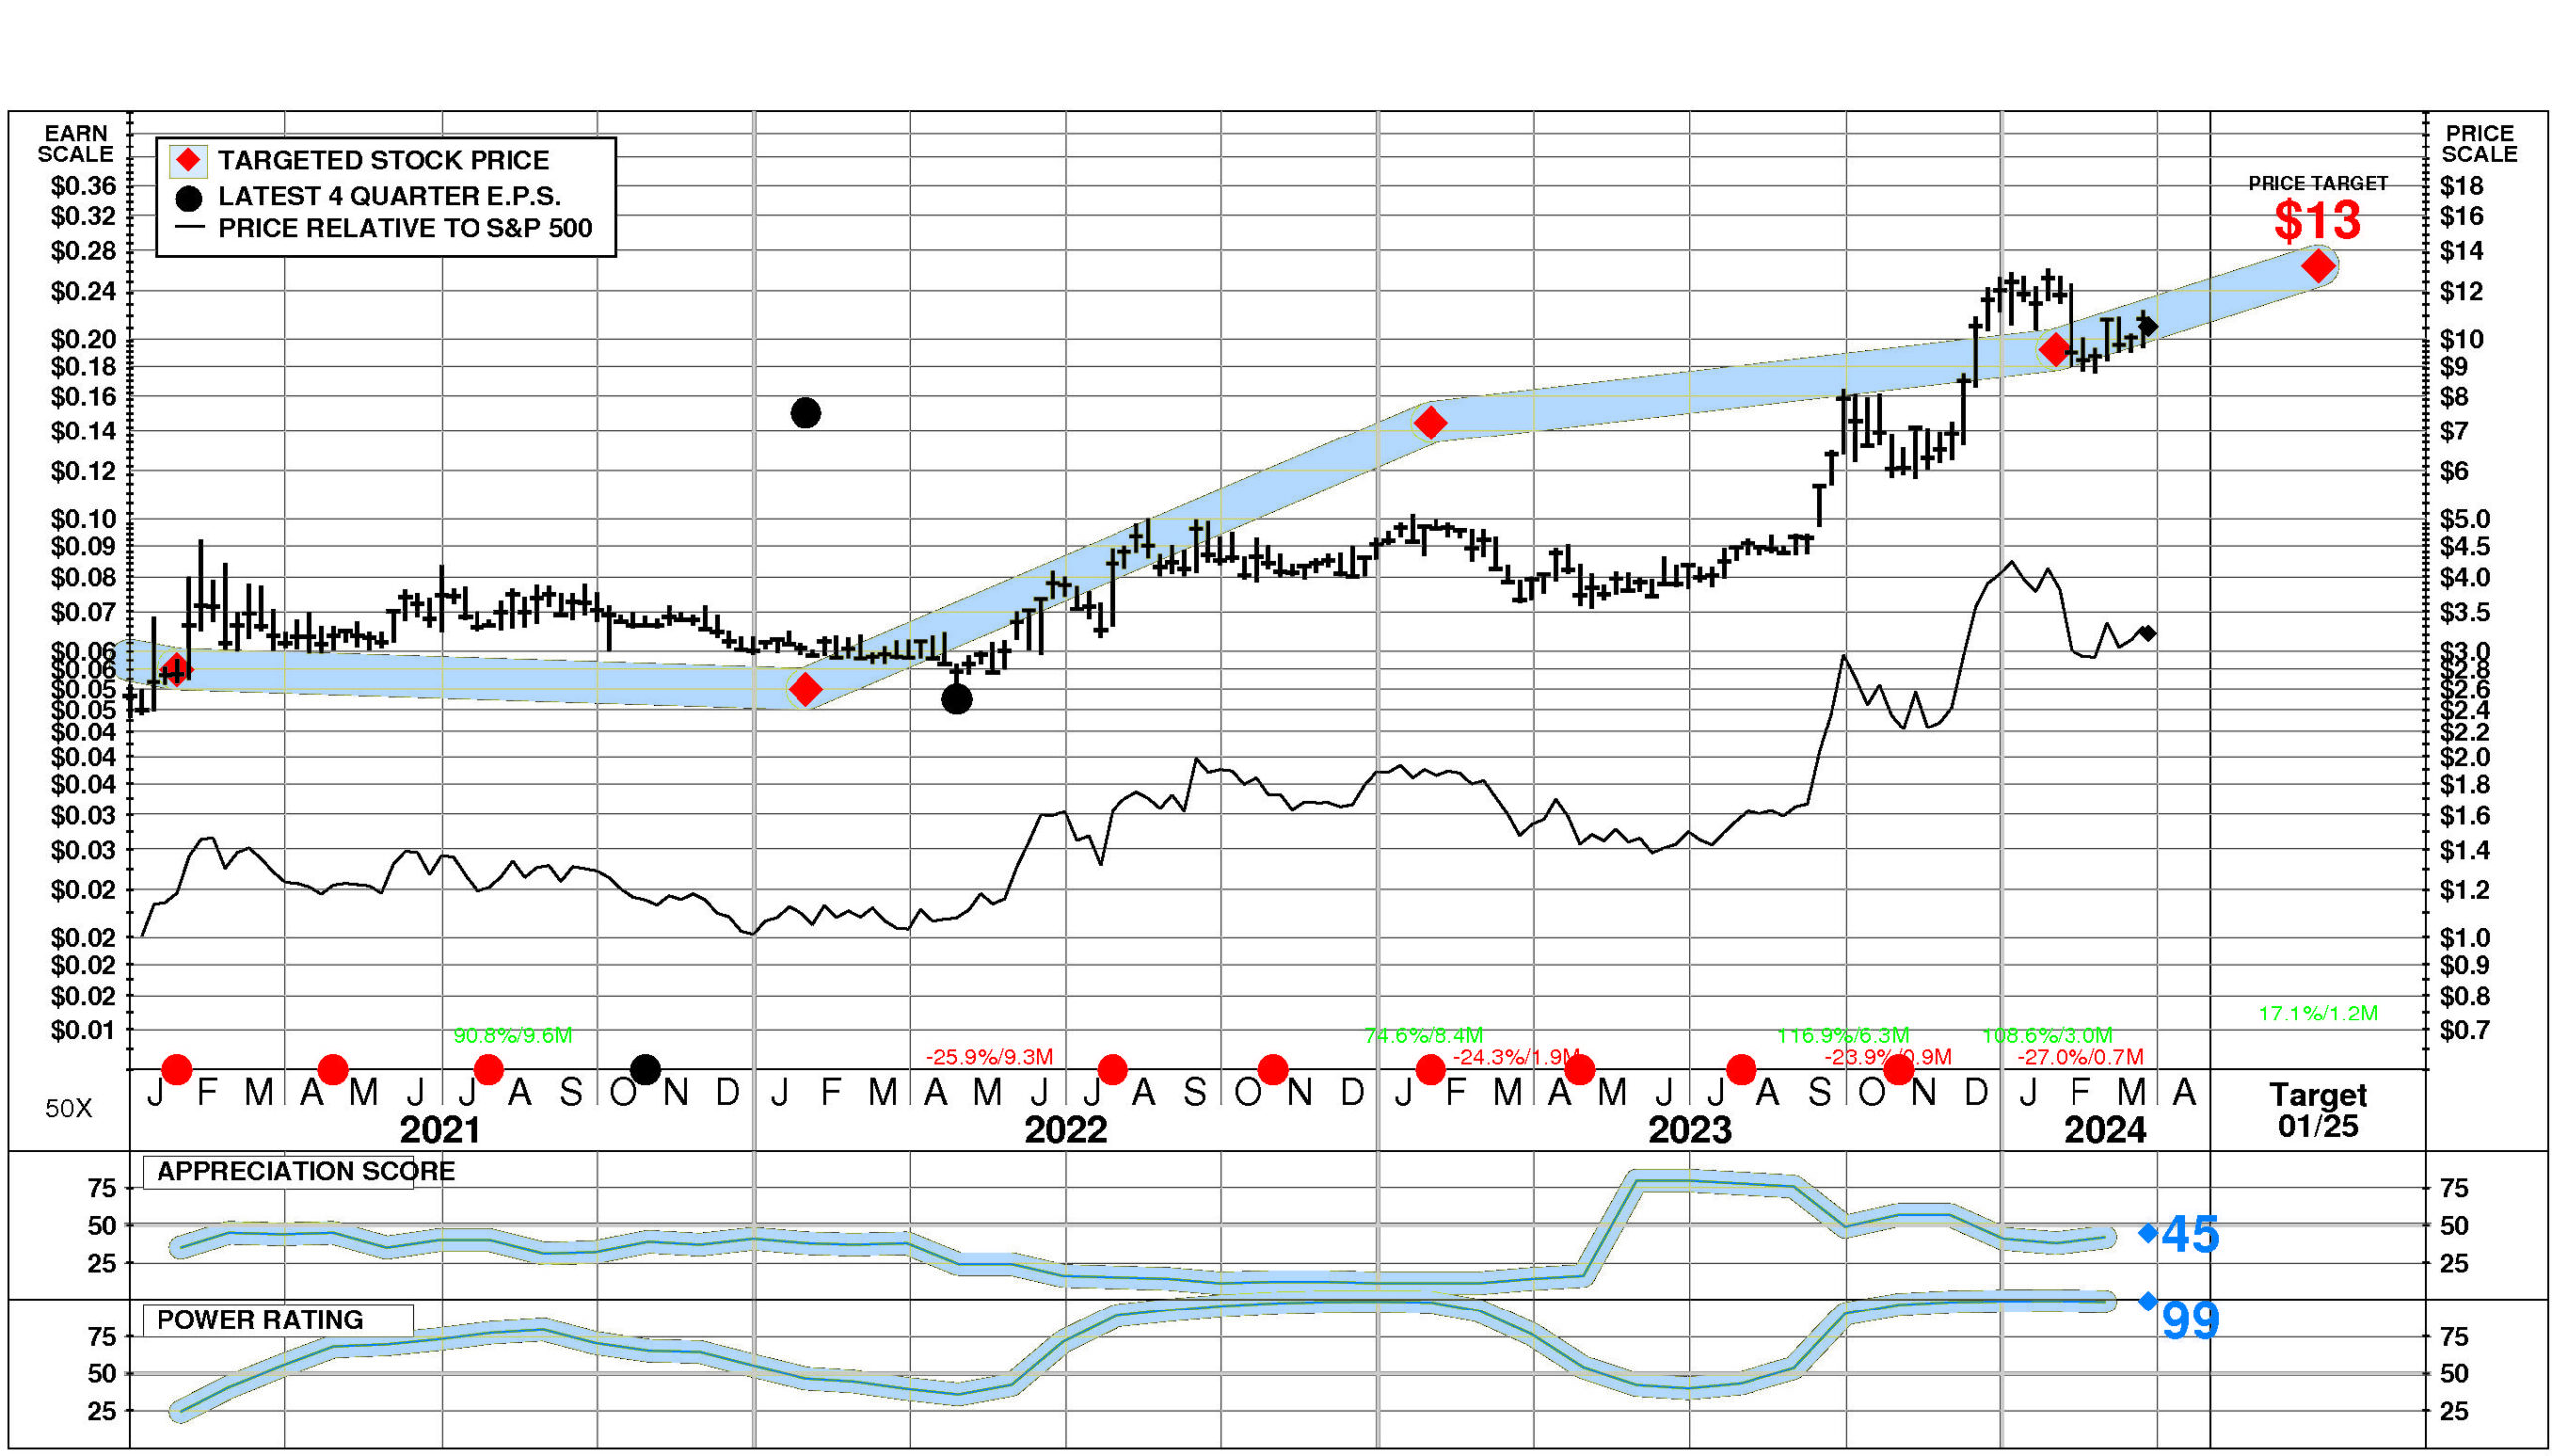
Virco Mfg has a Power Rating of 99. (VIRC’s very high Power Rating indicates that it has a higher likelihood of achieving favorable investment performance over the near to intermediate term than all but 1% of companies in the universe.)
Factors contributing to this very high Power Rating include: recent price action has been extremely favorable; and the Public Building & Related Furniture comparison group is in a strong phase currently.
INVESTMENT PROFILE
Virco Mfg’s financial strength is low. Financial strength rating is 25.
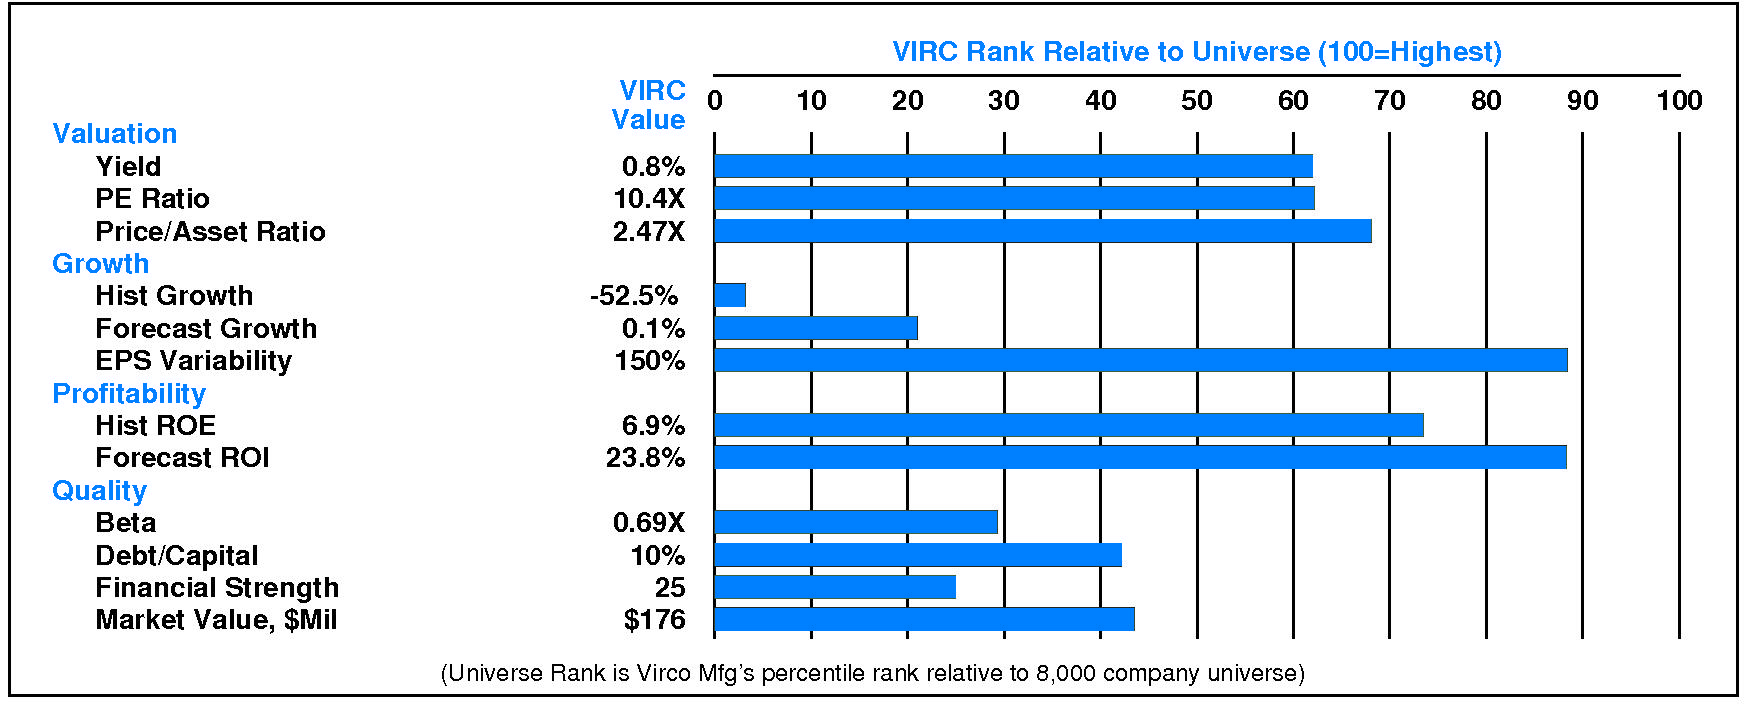
Relative to the S&P 500 Composite, Virco Mfg. Corp has moderate Value characteristics; its appeal is likely to be to investors neutral towards Income; the perception is that VIRC is normal risk. Relative weaknesses include: low historical profitability, low financial strength, low expected growth, low historical growth, and high earnings variability. Virco Mfg’s valuation is moderate: low dividend yield, low P/E ratio, and moderate price/book ratio. VIRC has unusually low market capitalization.
CURRENT SIGNALS
Virco Mfg’s current operations are strong. Return on equity is rising, reflecting: improving asset utilization; widening pretax margins; and rising leverage.
Virco Mfg’s current technical position is mixed. The stock price is in a 0.7 month down move. The stock has declined 21.2% from its prior high. The 200 day moving average is in an uptrend. The stock price is below its 200 day moving average.
ALERTS
Virco Mfg. Corp (NASDAQ: VIRC). Important negative changes in investment behavior have recently occurred: negative upside/downside volume developed.
Meaningful positive changes in Virco Mfg. Corp (NASDAQ: VIRC) fundamentals have recently occurred: significant quarterly earnings acceleration occurred, and significant quarterly sales acceleration occurred.
The stock is currently rated A.
On 3/25/24, Virco Mfg. Corp (NASDAQ: VIRC) stock declined by -2.6%, closing at $10.49. However, this decline was accompanied by unusually low trading volume at 64% of normal. Relative to the market the stock has been exceptionally strong over the last nine months and has risen 4.6% during the last week.
CASH FLOW
In 2023, Virco Mfg experienced a significant decline in cash of -$0.30 million (-22%). Sources of cash were lower than uses. Cash generated from 2023 EBITDA totaled +$15.39 million. Non-operating uses consumed -$0.82 million (-5% of EBITDA). Cash taxes contributed +$8.50 million (+55% of EBITDA). Re-investment in the business amounted to -$28.40 million (-185% of EBITDA). On a net basis, debt investors provided +$0.96 million (+6% of EBITDA) while equity investors provided +$4.07 million (+26% of EBITDA).
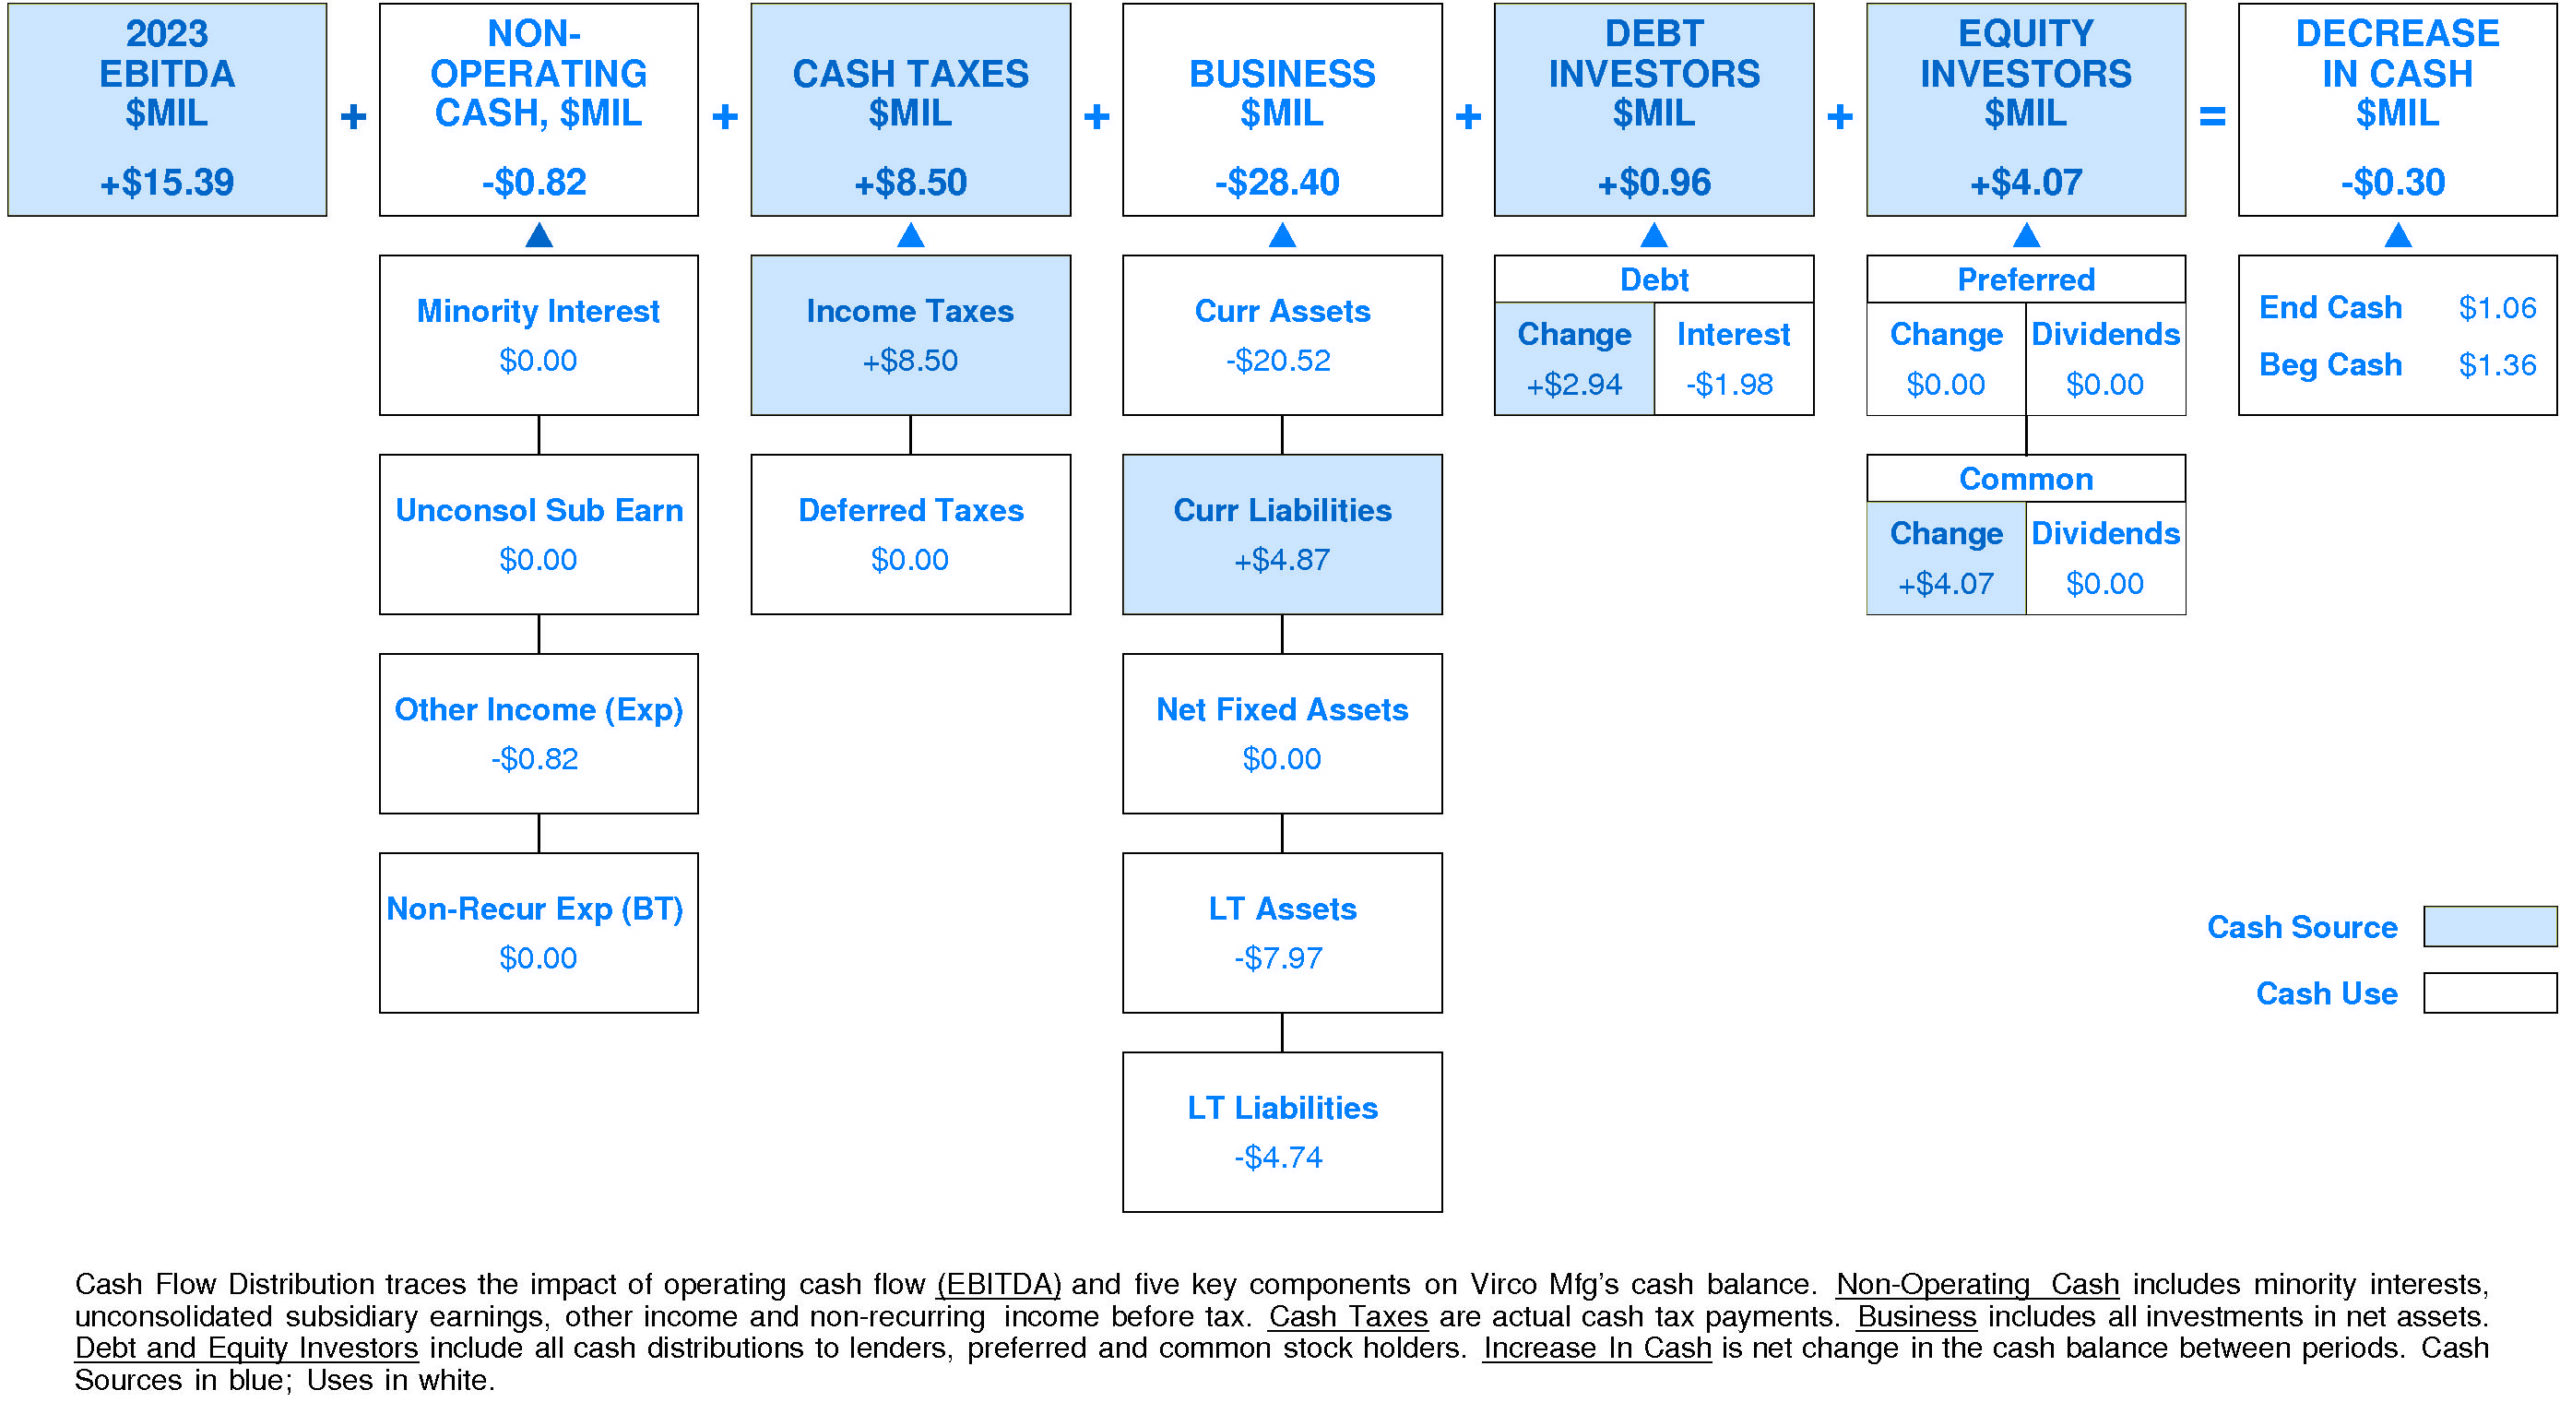
Virco Mfg’s Non-operating Income, %EBITDA has experienced a downtrend over the period. This downtrend was accompanied by an opposite trend for the Virco Mfg Peer Group. In most years, Virco Mfg was in the top quartile and second quartile. Currently, Virco Mfg is slightly above median at -5% of EBITDA (-$0.82 million).
Virco Mfg’s Cash Taxes, %EBITDA experienced a volatile overall downtrend over the period. This downtrend was accompanied by stability for the Virco Mfg Peer Group. In most years, Virco Mfg was in the top quartile and second quartile. Currently, Virco Mfg is upper quartile at +55% of EBITDA (+$8.50 million).
Virco Mfg’s Business Re-investment, %EBITDA has enjoyed a volatile overall uptrend over the period. This improvement was accompanied by an opposite trend for the Virco Mfg Peer Group. (Since 2021 Business Re-investment, %EBITDA has experienced a very sharp decline.) In most years, Virco Mfg was in the lower quartile and top quartile. Currently, Virco Mfg is lower quartile at -185% of EBITDA (-$28.40 million).
Virco Mfg’s Debt Investors, %EBITDA has experienced a volatile overall downtrend over the period. This downtrend was accompanied by a similar trend for the Virco Mfg Peer Group. (Since 2021 Debt Investors, %EBITDA has experienced a very sharp recovery.) In most years, Virco Mfg was in the second quartile and lower quartile. Currently, Virco Mfg is above median at +6% of EBITDA (+$0.96 million).
Virco Mfg’s Equity Investors, %EBITDA has enjoyed a volatile overall uptrend over the period. This improvement was accompanied by a similar trend for the Virco Mfg Peer Group. In most years, Virco Mfg was in the top quartile and second quartile. Currently, Virco Mfg is at the upper quartile at +26% of EBITDA (+$4.07 million).
Virco Mfg’s Change in Cash, %EBITDA has exhibited a volatile overall uptrend over the period. This improvement was accompanied by a similar trend for the Virco Mfg Peer Group. In most years, Virco Mfg was in the second quartile and third quartile. Currently, Virco Mfg is below median at -2% of EBITDA (-$0.30 million).
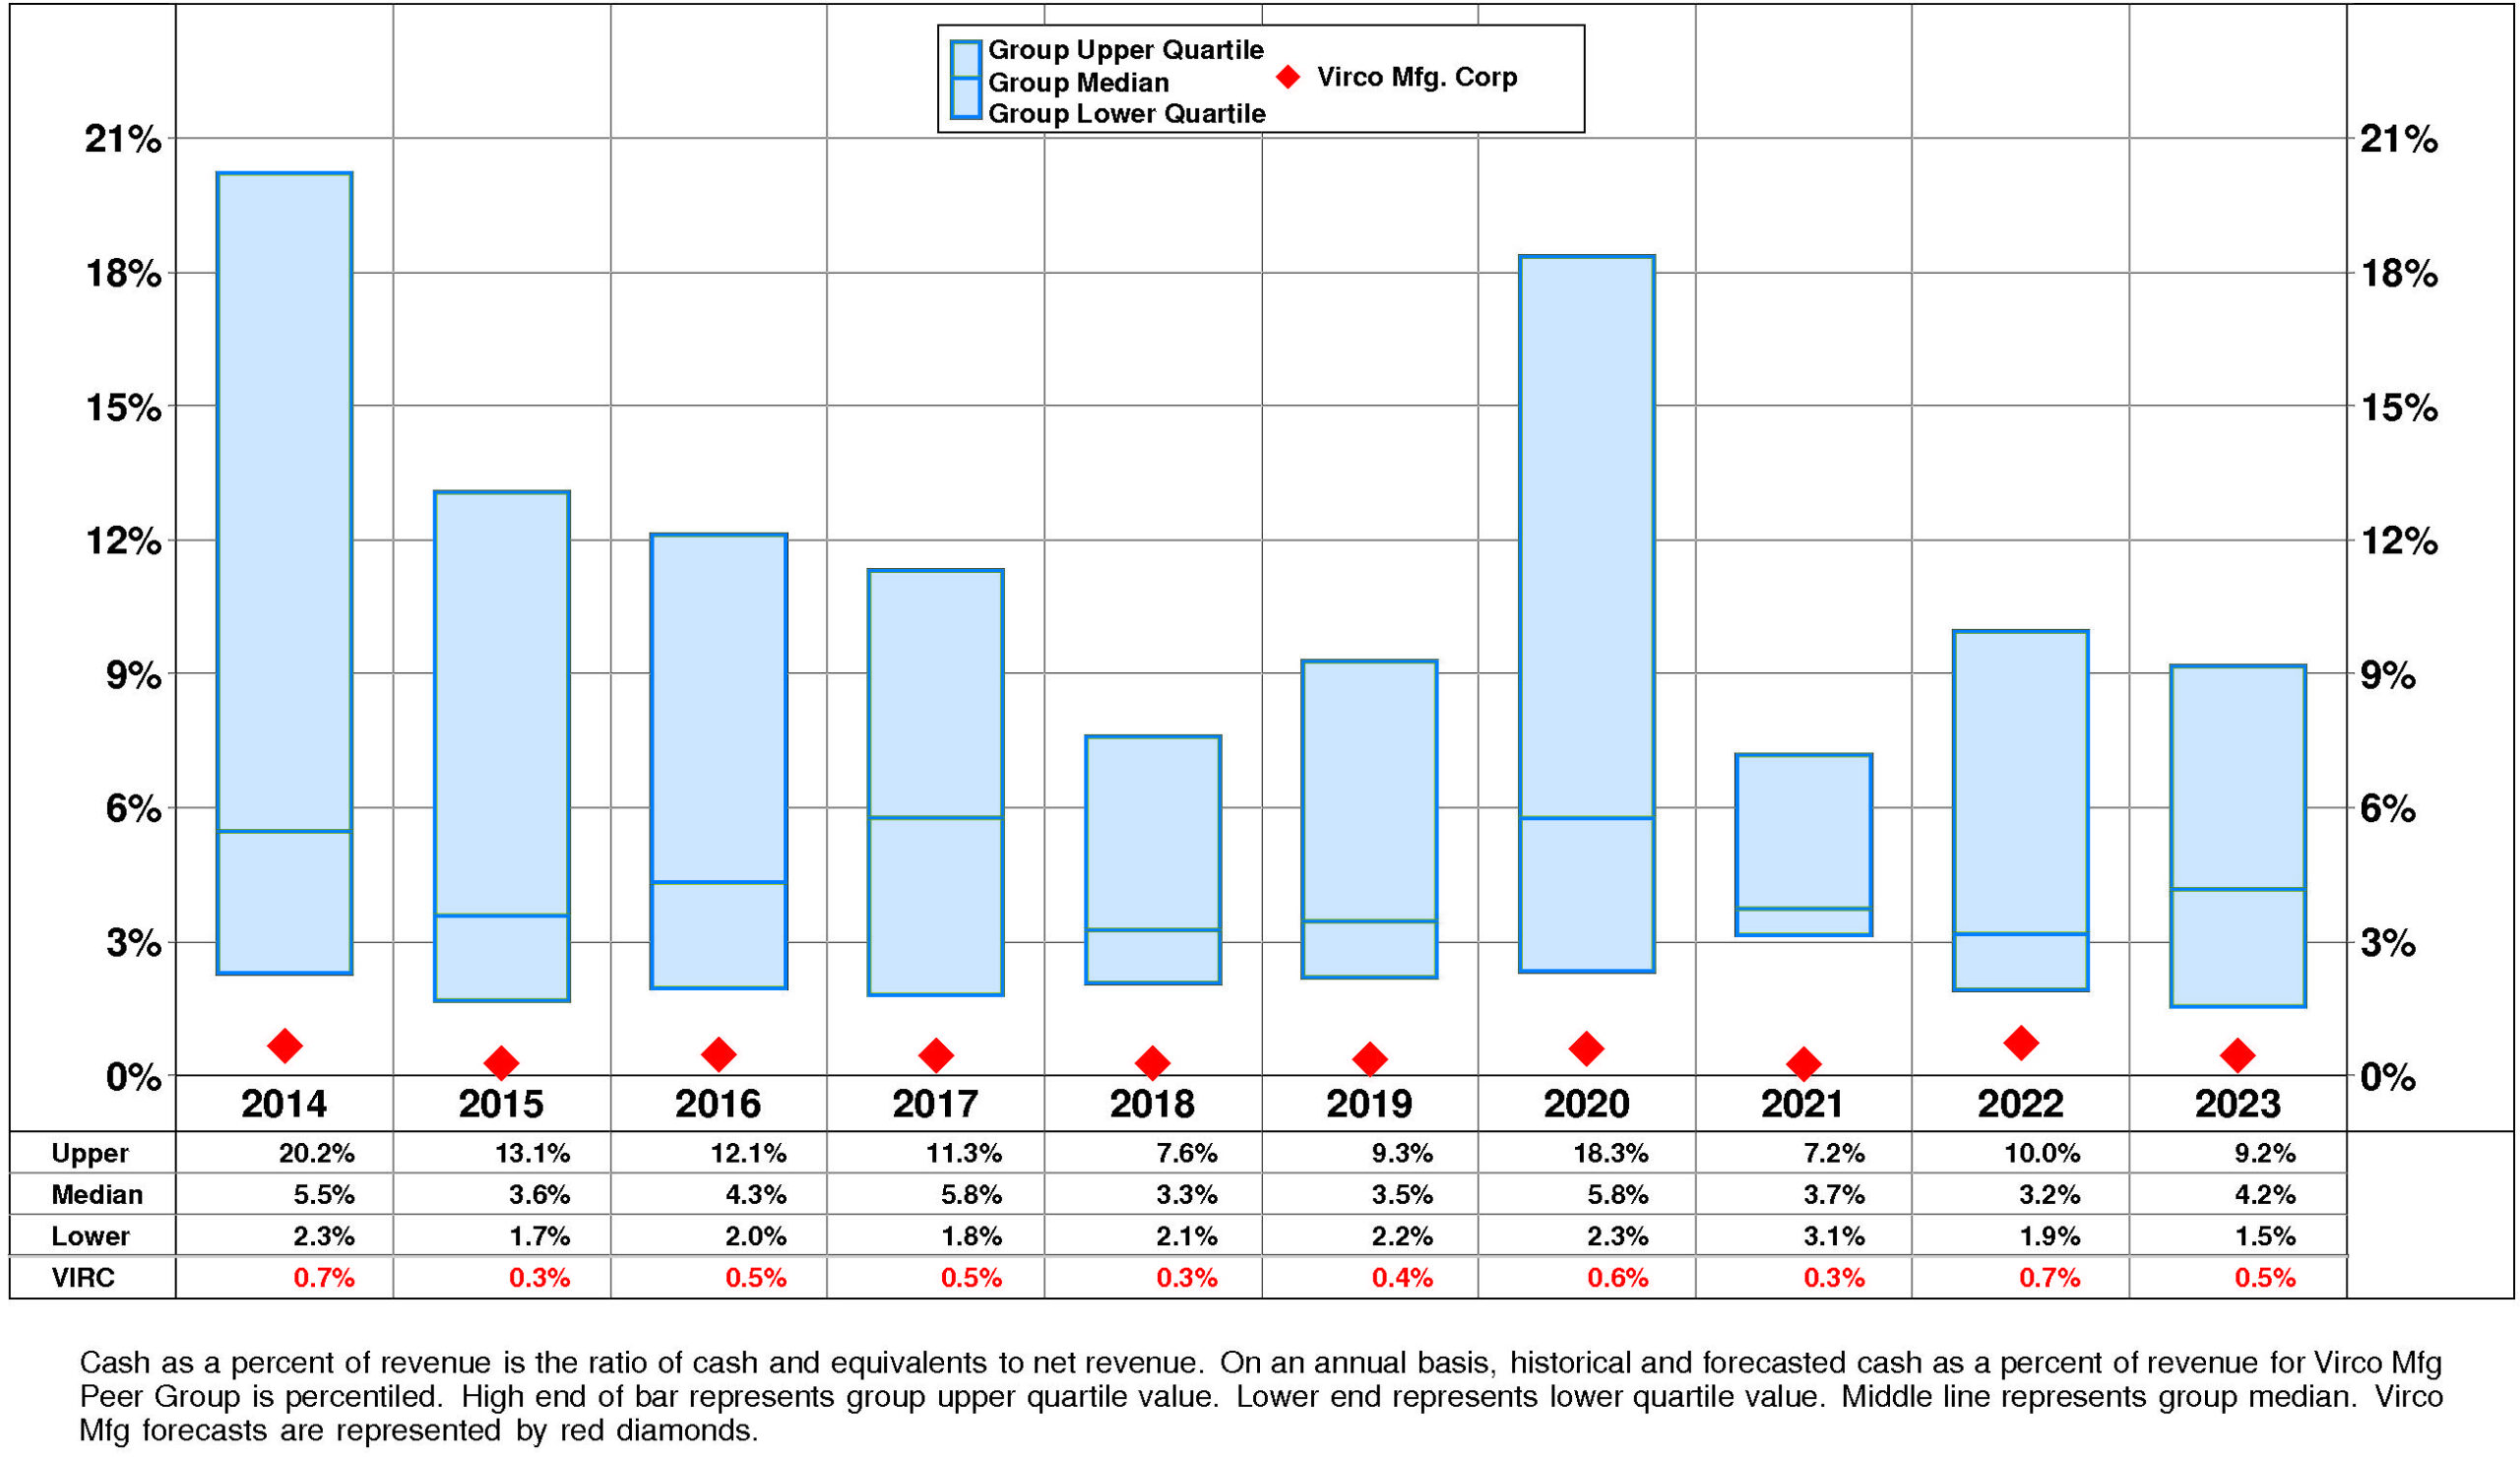
Virco Mfg’s Cash, %Revenue has exhibited little to no overall change over the period. This stability was accompanied by stability for the Virco Mfg Peer Group as well. In most years, Virco Mfg was in the lower quartile. Currently, Virco Mfg is lower quartile at +0%.
PROFITABILITY
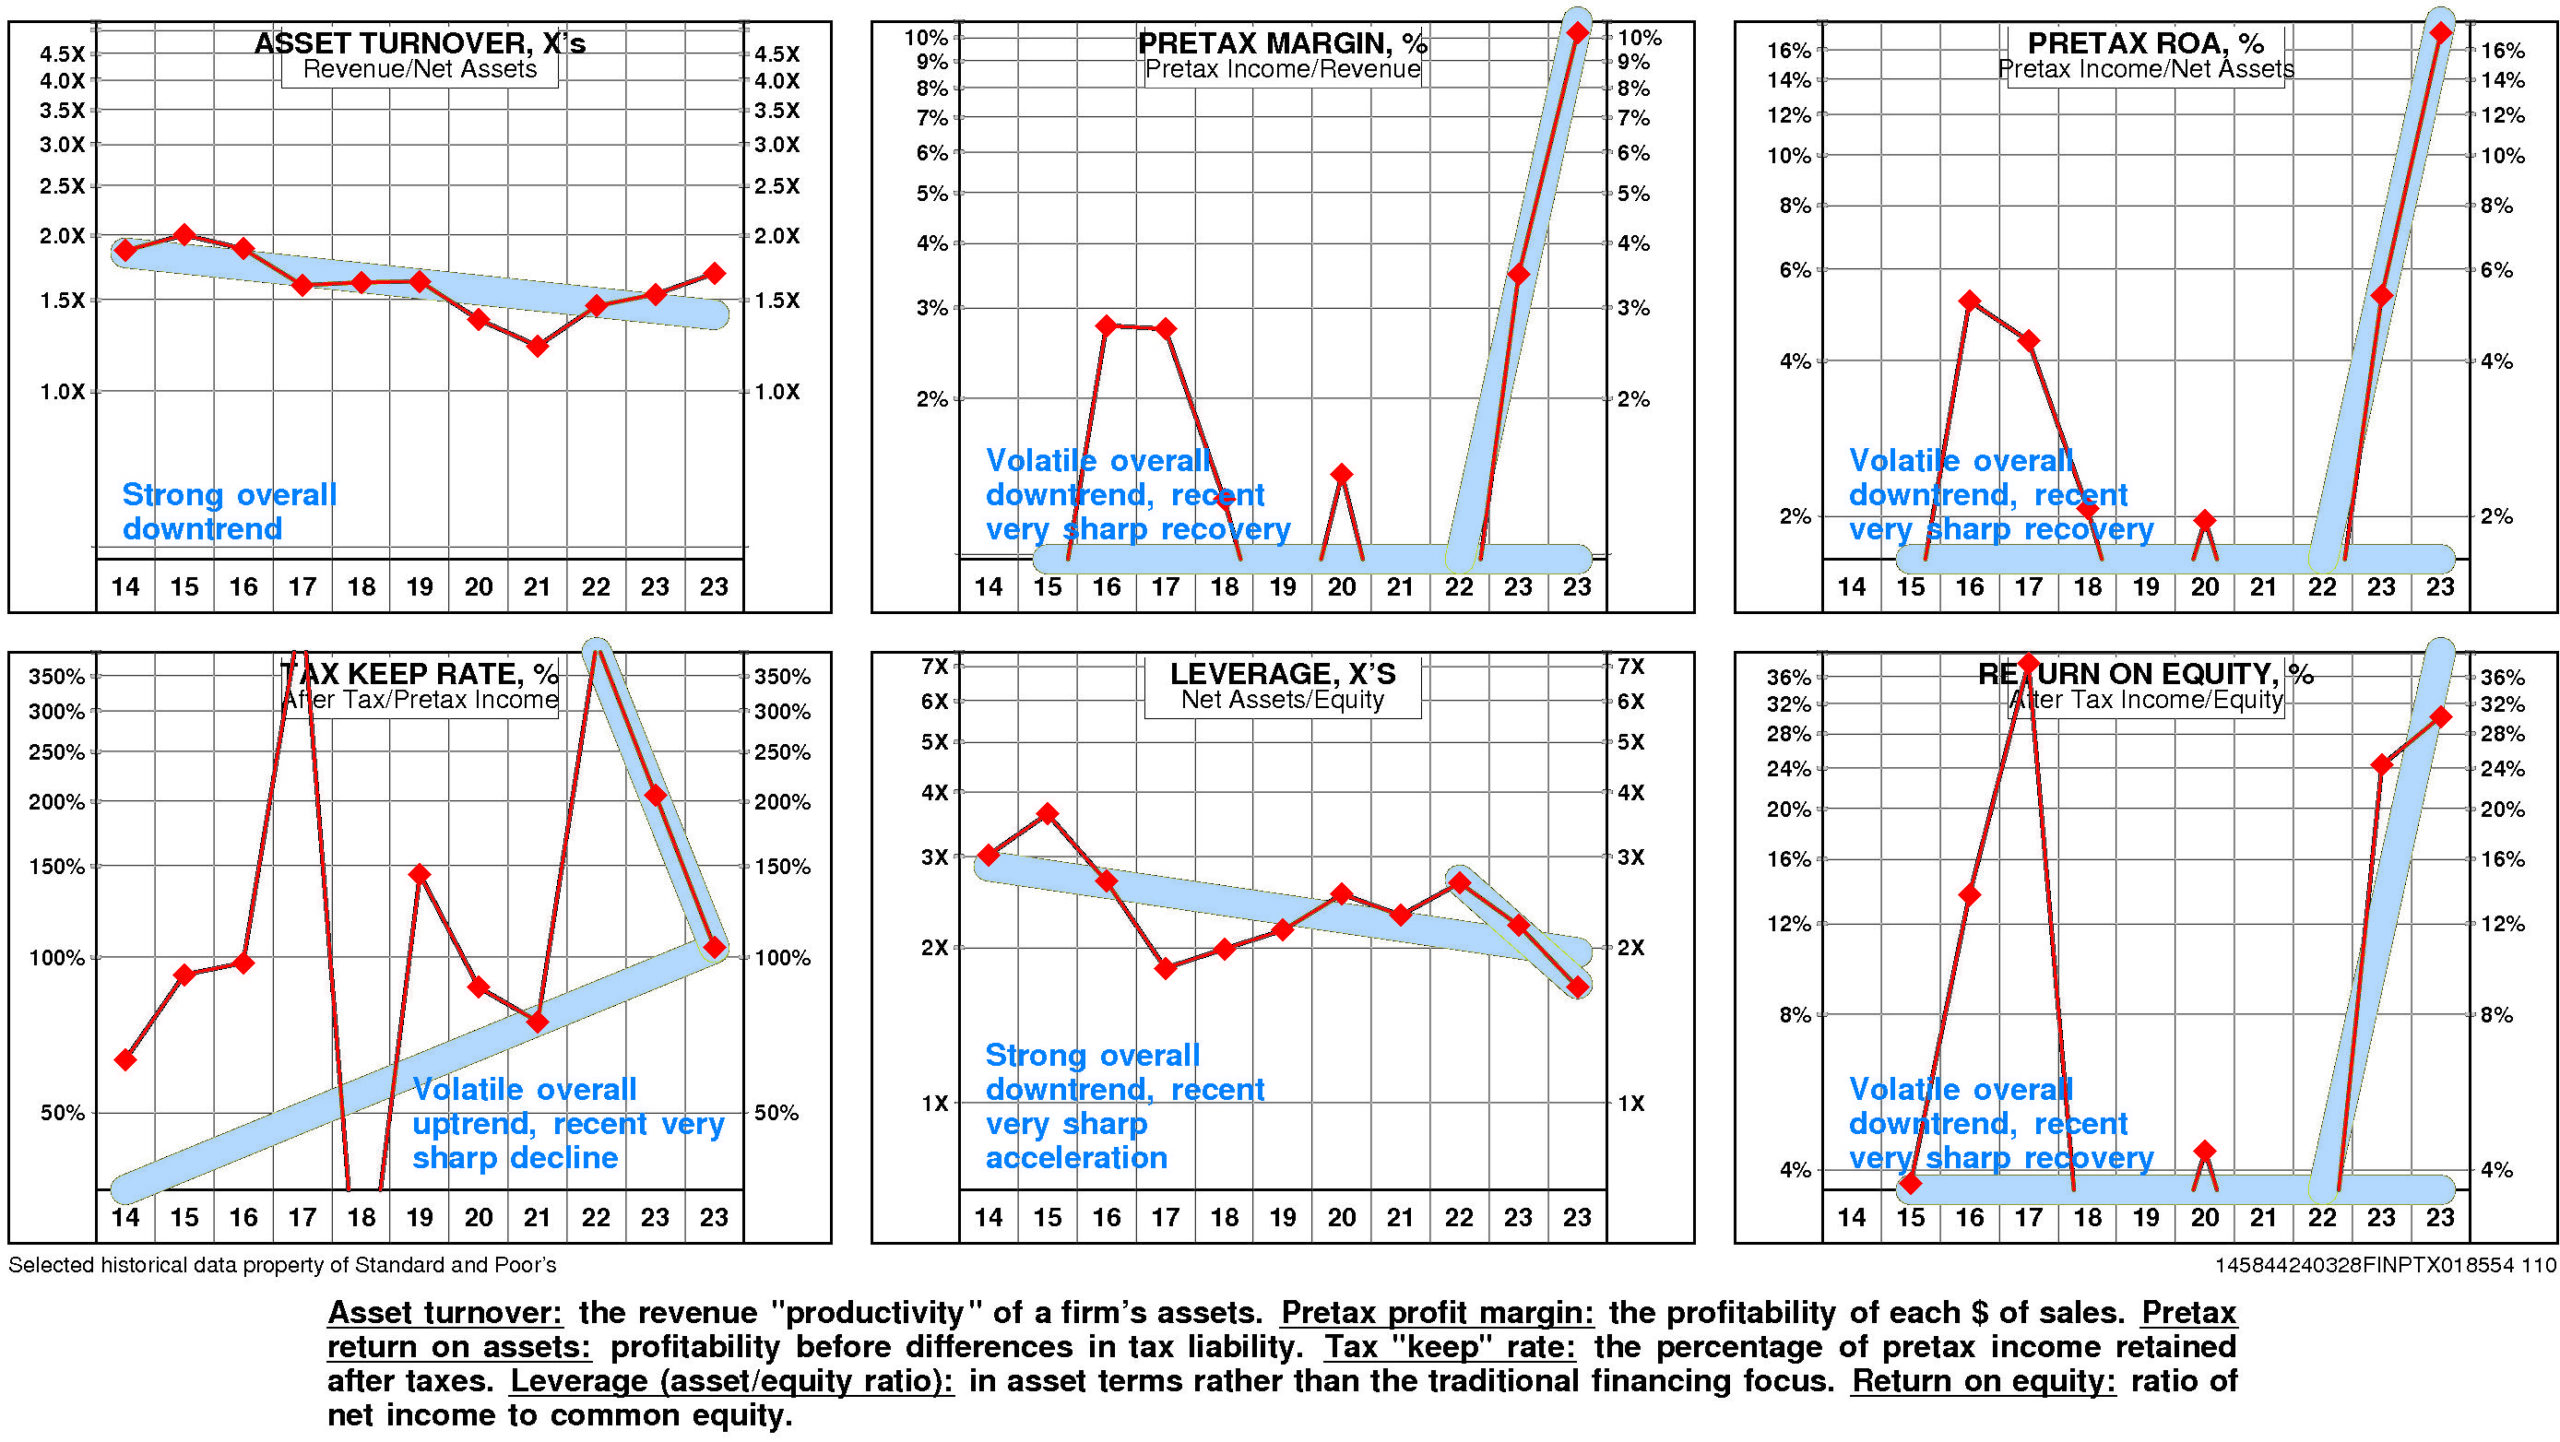
Virco Mfg’s return on equity has eroded very significantly since 2015. The current level is 30.2% versus the high of 3.8% and the low of -31.9%.
Virco Mfg’s very strong negative trend in pretax operating return significantly offset by a very strong positive trend in non-operating factors is a significant analytical factor.
The productivity of Virco Mfg’s assets declined over the full period 2014-2023: asset turnover has suffered a strong overall downtrend.
Reinforcing this trend, pretax margin experienced a strong overall downtrend although it experienced a very sharp recovery after the 2022 low.
Non-operating factors (income taxes and financial leverage) had a very significant positive influence on return on equity.
Virco Mfg’s return on equity is upper quartile (30.2%) for the four quarters ended October, 2023.
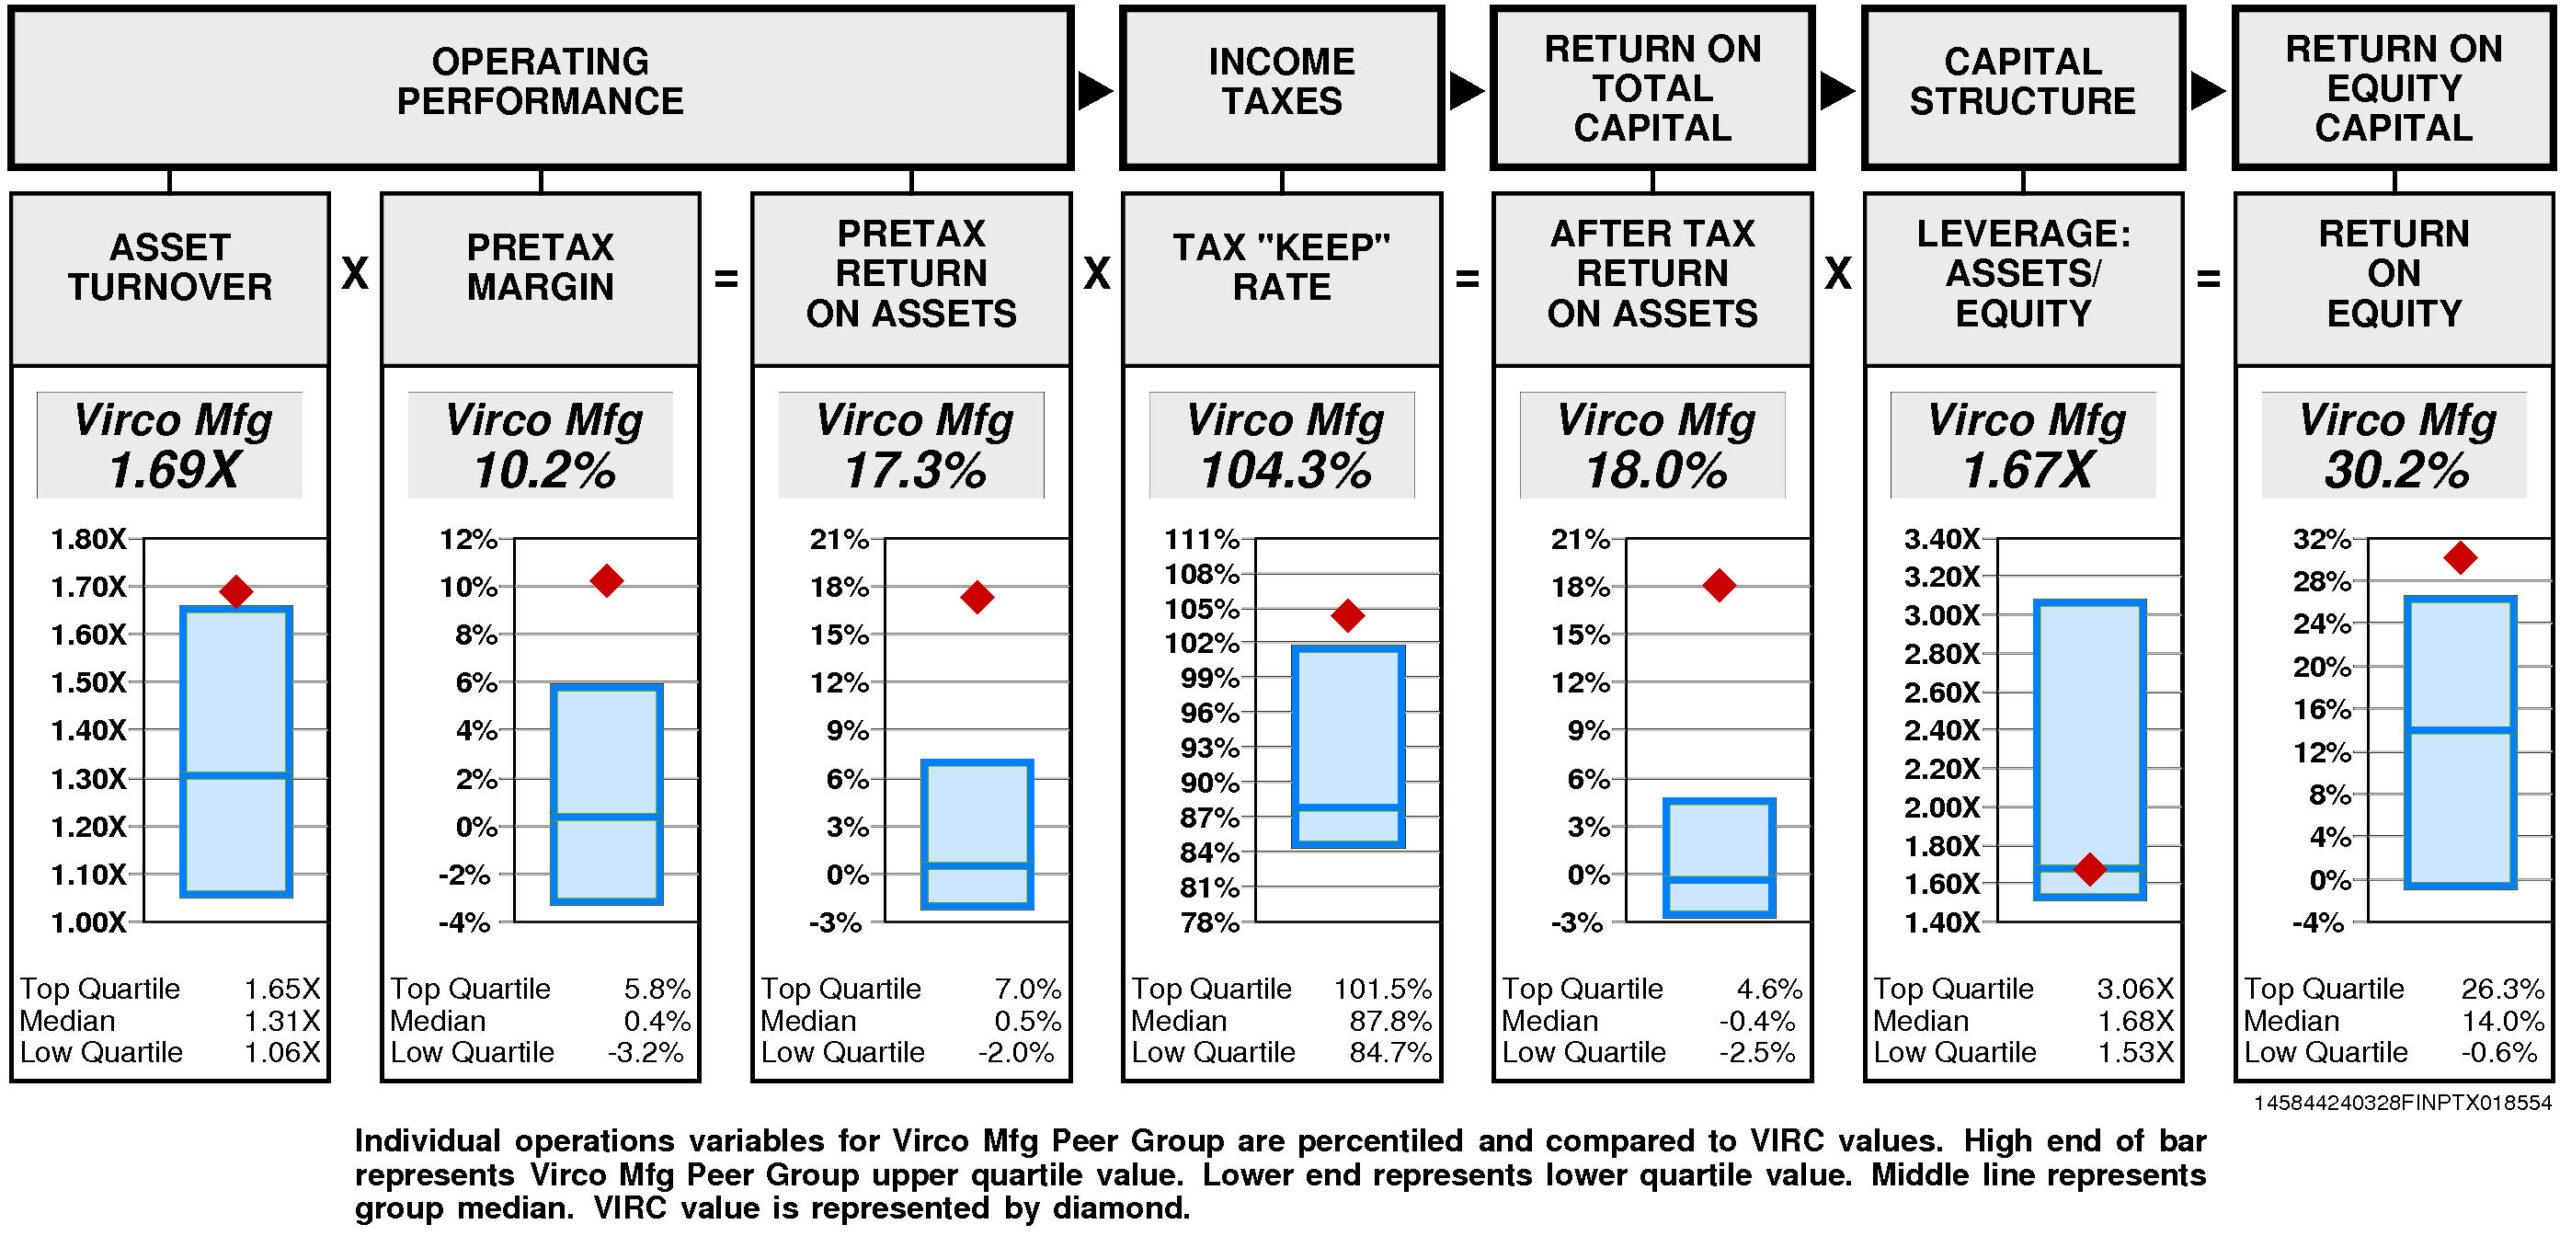
Operating performance (pretax return on assets) is upper quartile (17.3%) reflecting asset turnover that is upper quartile (1.69X) and upper quartile pretax margin (10.2%).
Tax “keep” rate (income tax management) is upper quartile (104.3%) resulting in after tax return on assets that is upper quartile.
Financial leverage (leverage) is at median (1.67X).
GROWTH RATES
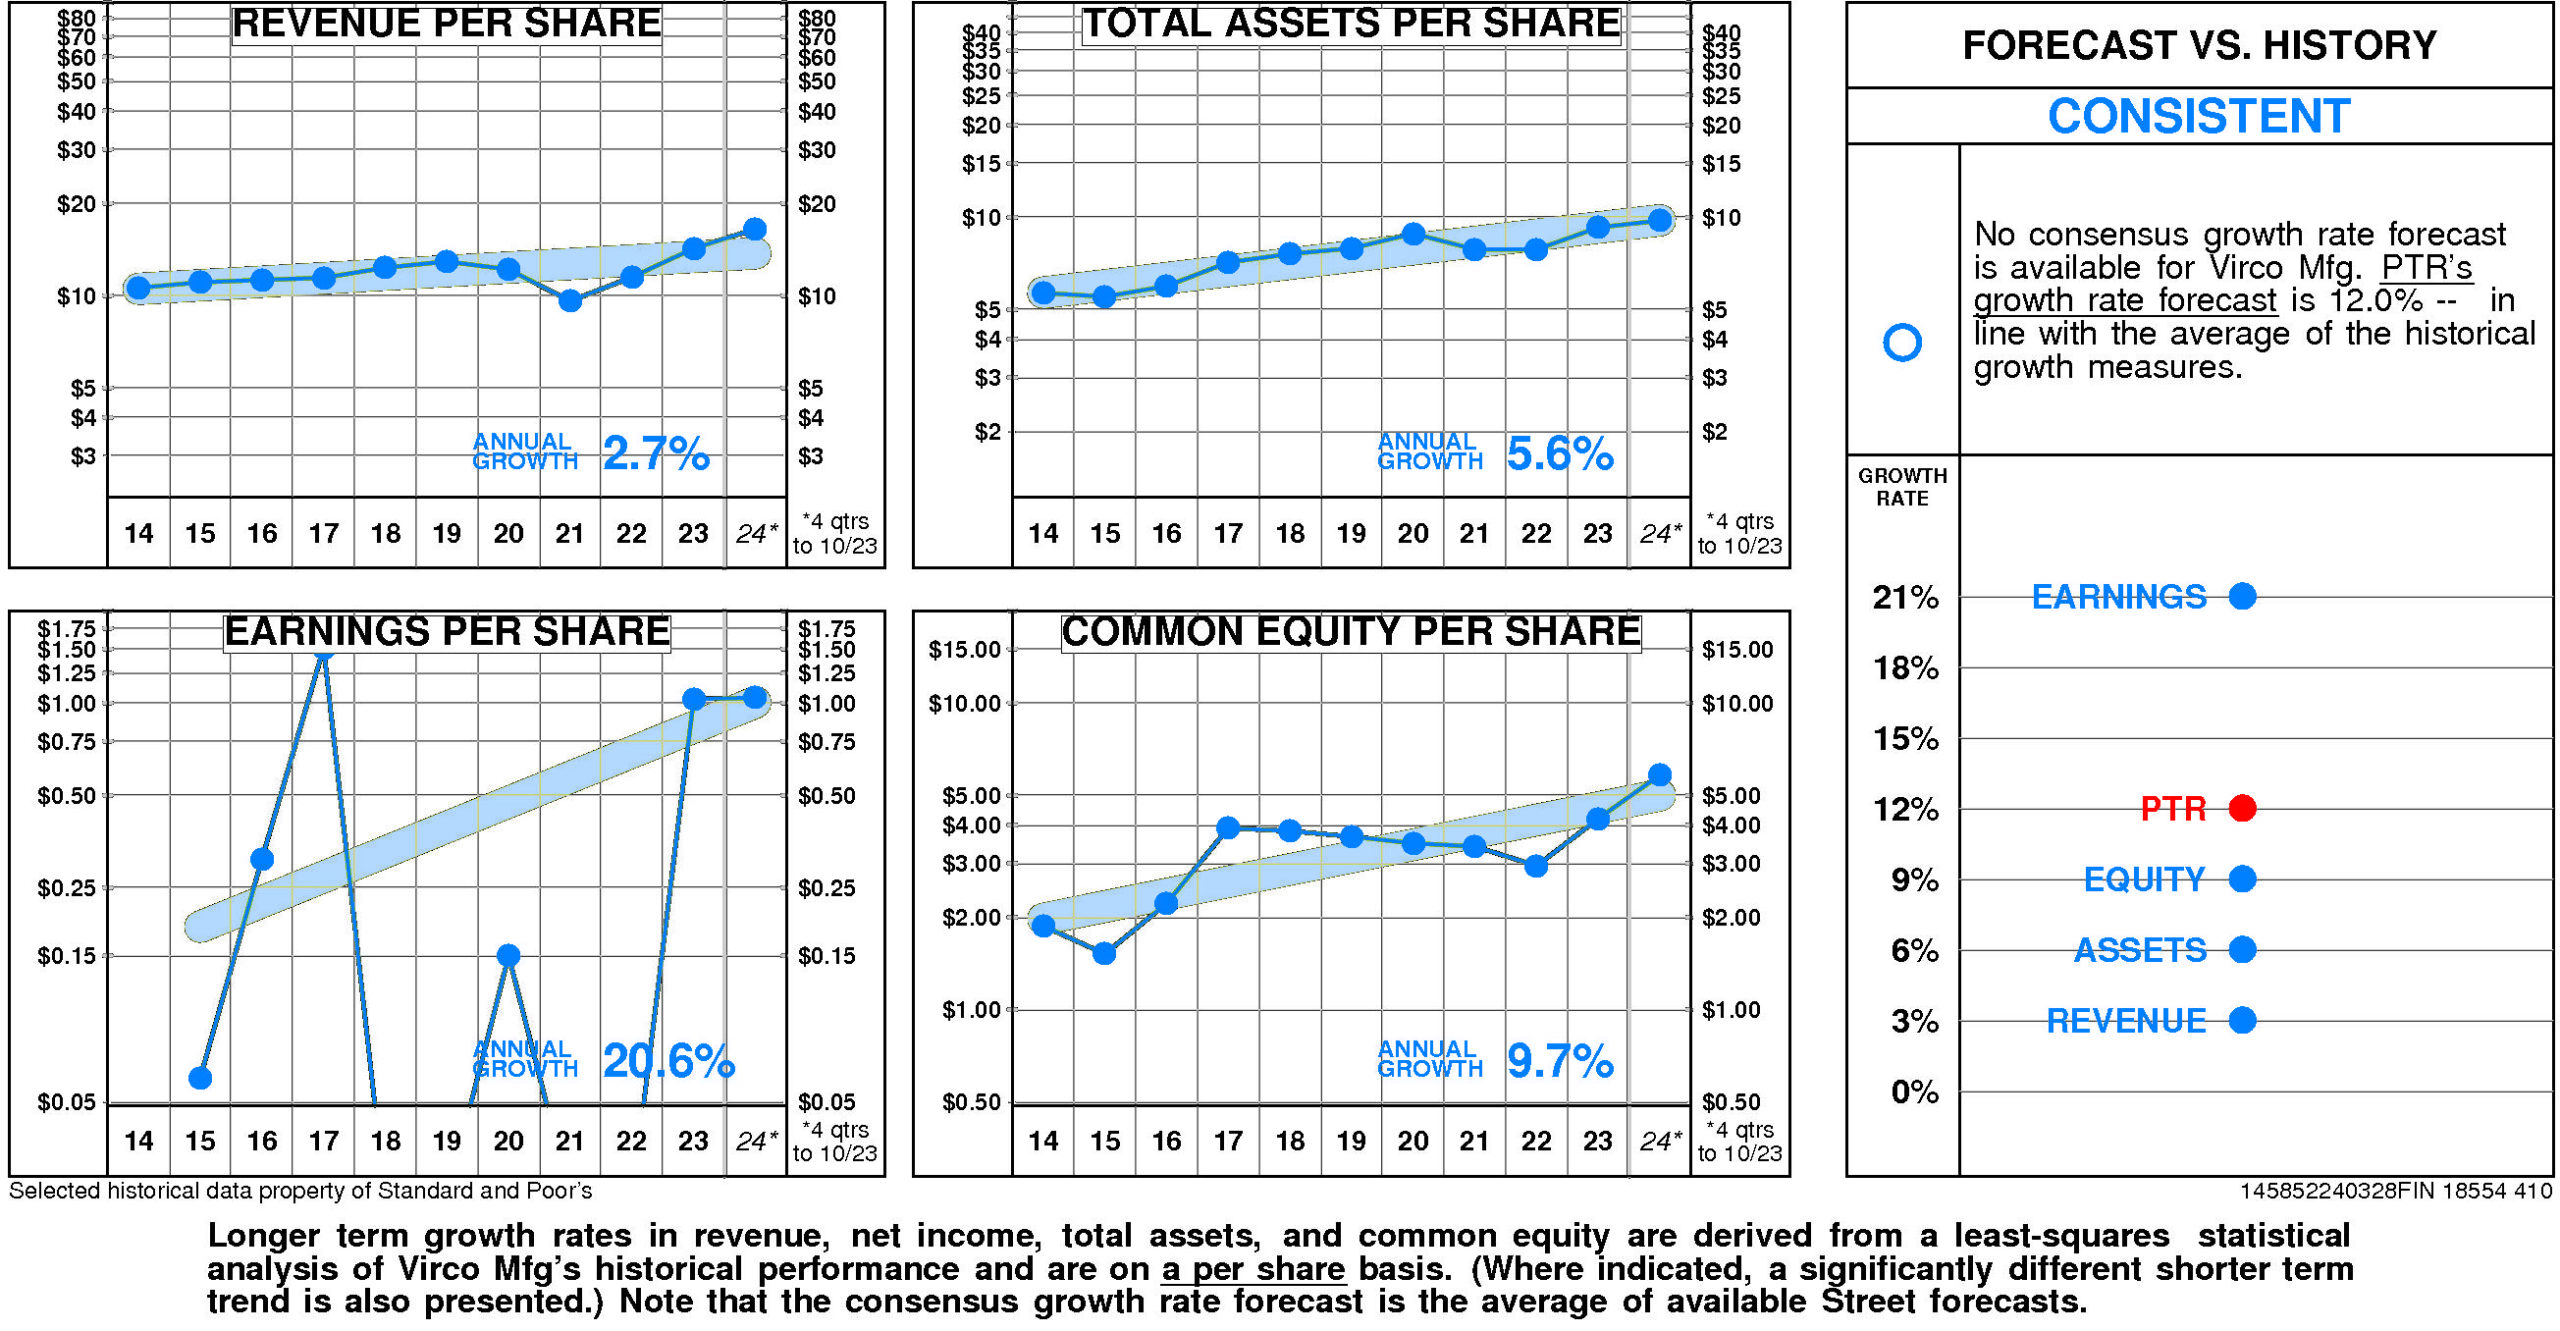
There are no significant differences between Virco Mfg’s longer term growth and growth in recent years.
Virco Mfg’s historical income statement growth and balance sheet growth have diverged. Revenue growth has paralleled asset growth; earnings growth has exceeded equity growth.
Annual revenue growth has been 2.7% per year.
Total asset growth has been 5.6% per year.
Annual E.P.S. growth has been 20.6% per year.
Equity growth has been 9.7% per year.
No consensus growth rate forecast is available for Virco Mfg.
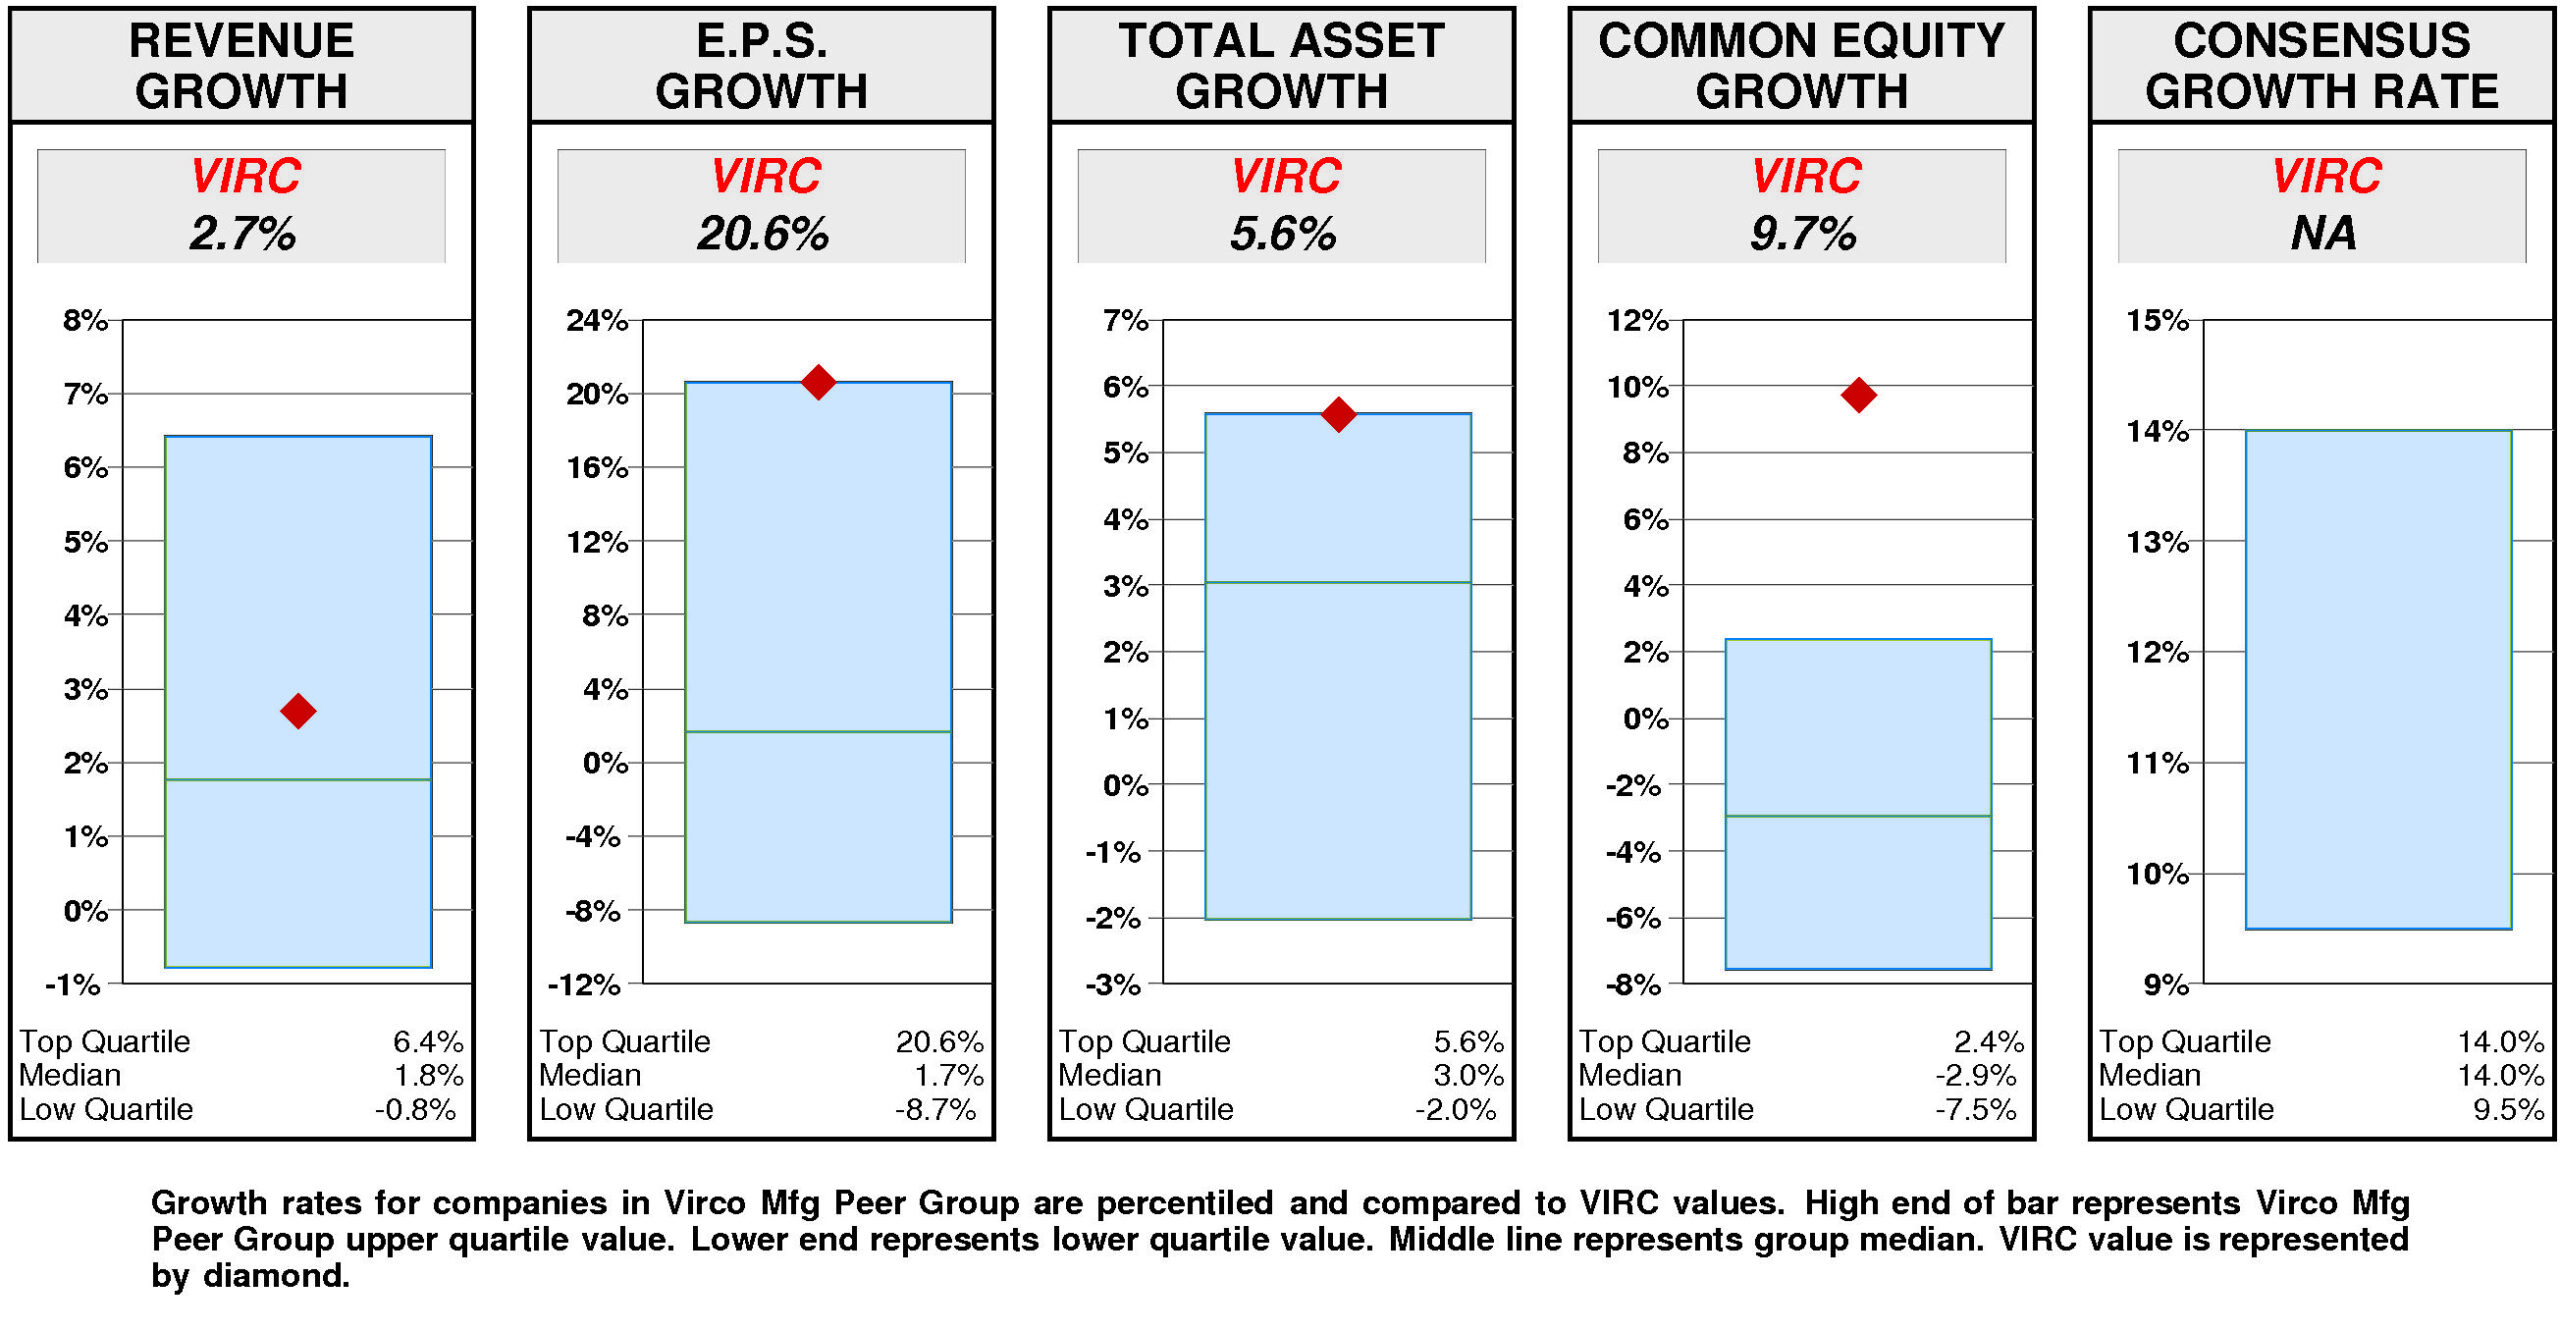
Relative to the Virco Mfg Peer Group, Virco Mfg’s historical growth measures are generally top quartile. Equity growth (9.7%) has been upper quartile. Total asset growth (5.6%) has been at the upper quartile. E.P.S. growth (20.6%) has been at the upper quartile. Revenue growth (2.7%) has been slightly above median.
Consensus growth forecast is unavailable.
PRICE HISTORY
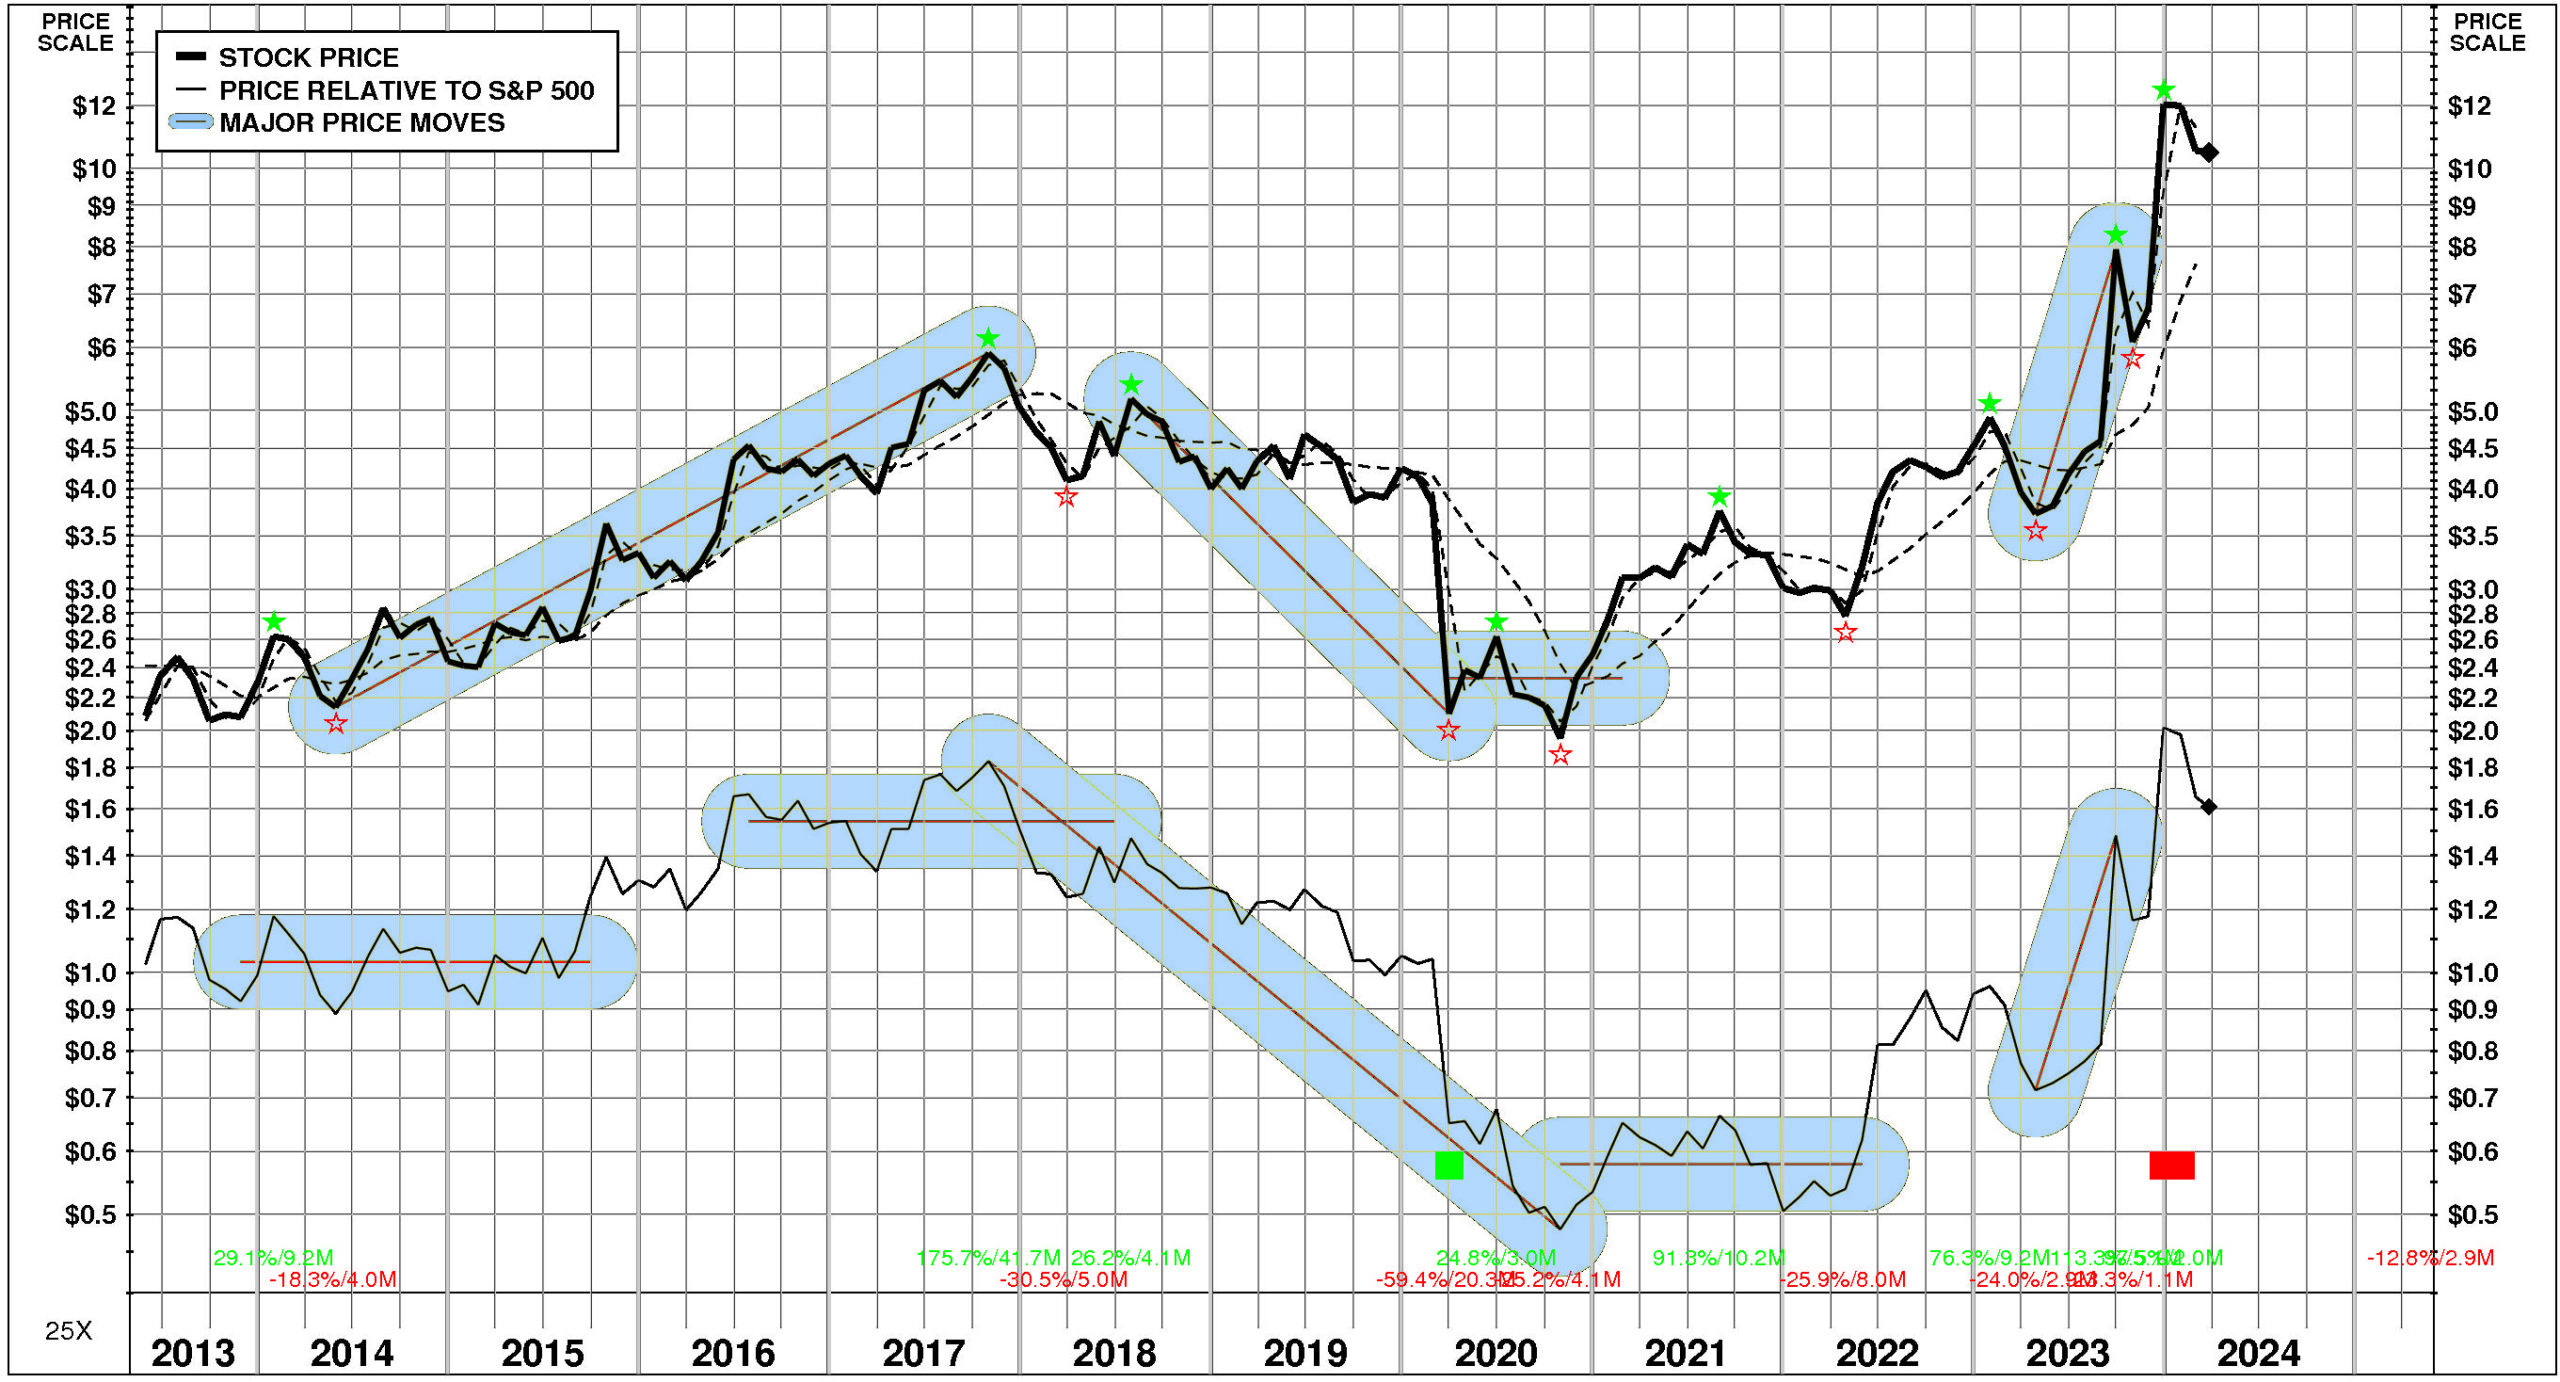
Over the full time period, Virco Mfg’s stock price performance has been variable and superior. Between May, 2013 and March, 2024, Virco Mfg’s stock price rose +402%; relative to the market, this was a +57% gain. Significant price moves during the period: 1) April, 2023 – September, 2023: +113%; 2) July, 2018 – March, 2020: -59%; and 3) May, 2014 – October, 2017: +176%.
TOTAL INVESTMENT RETURNS
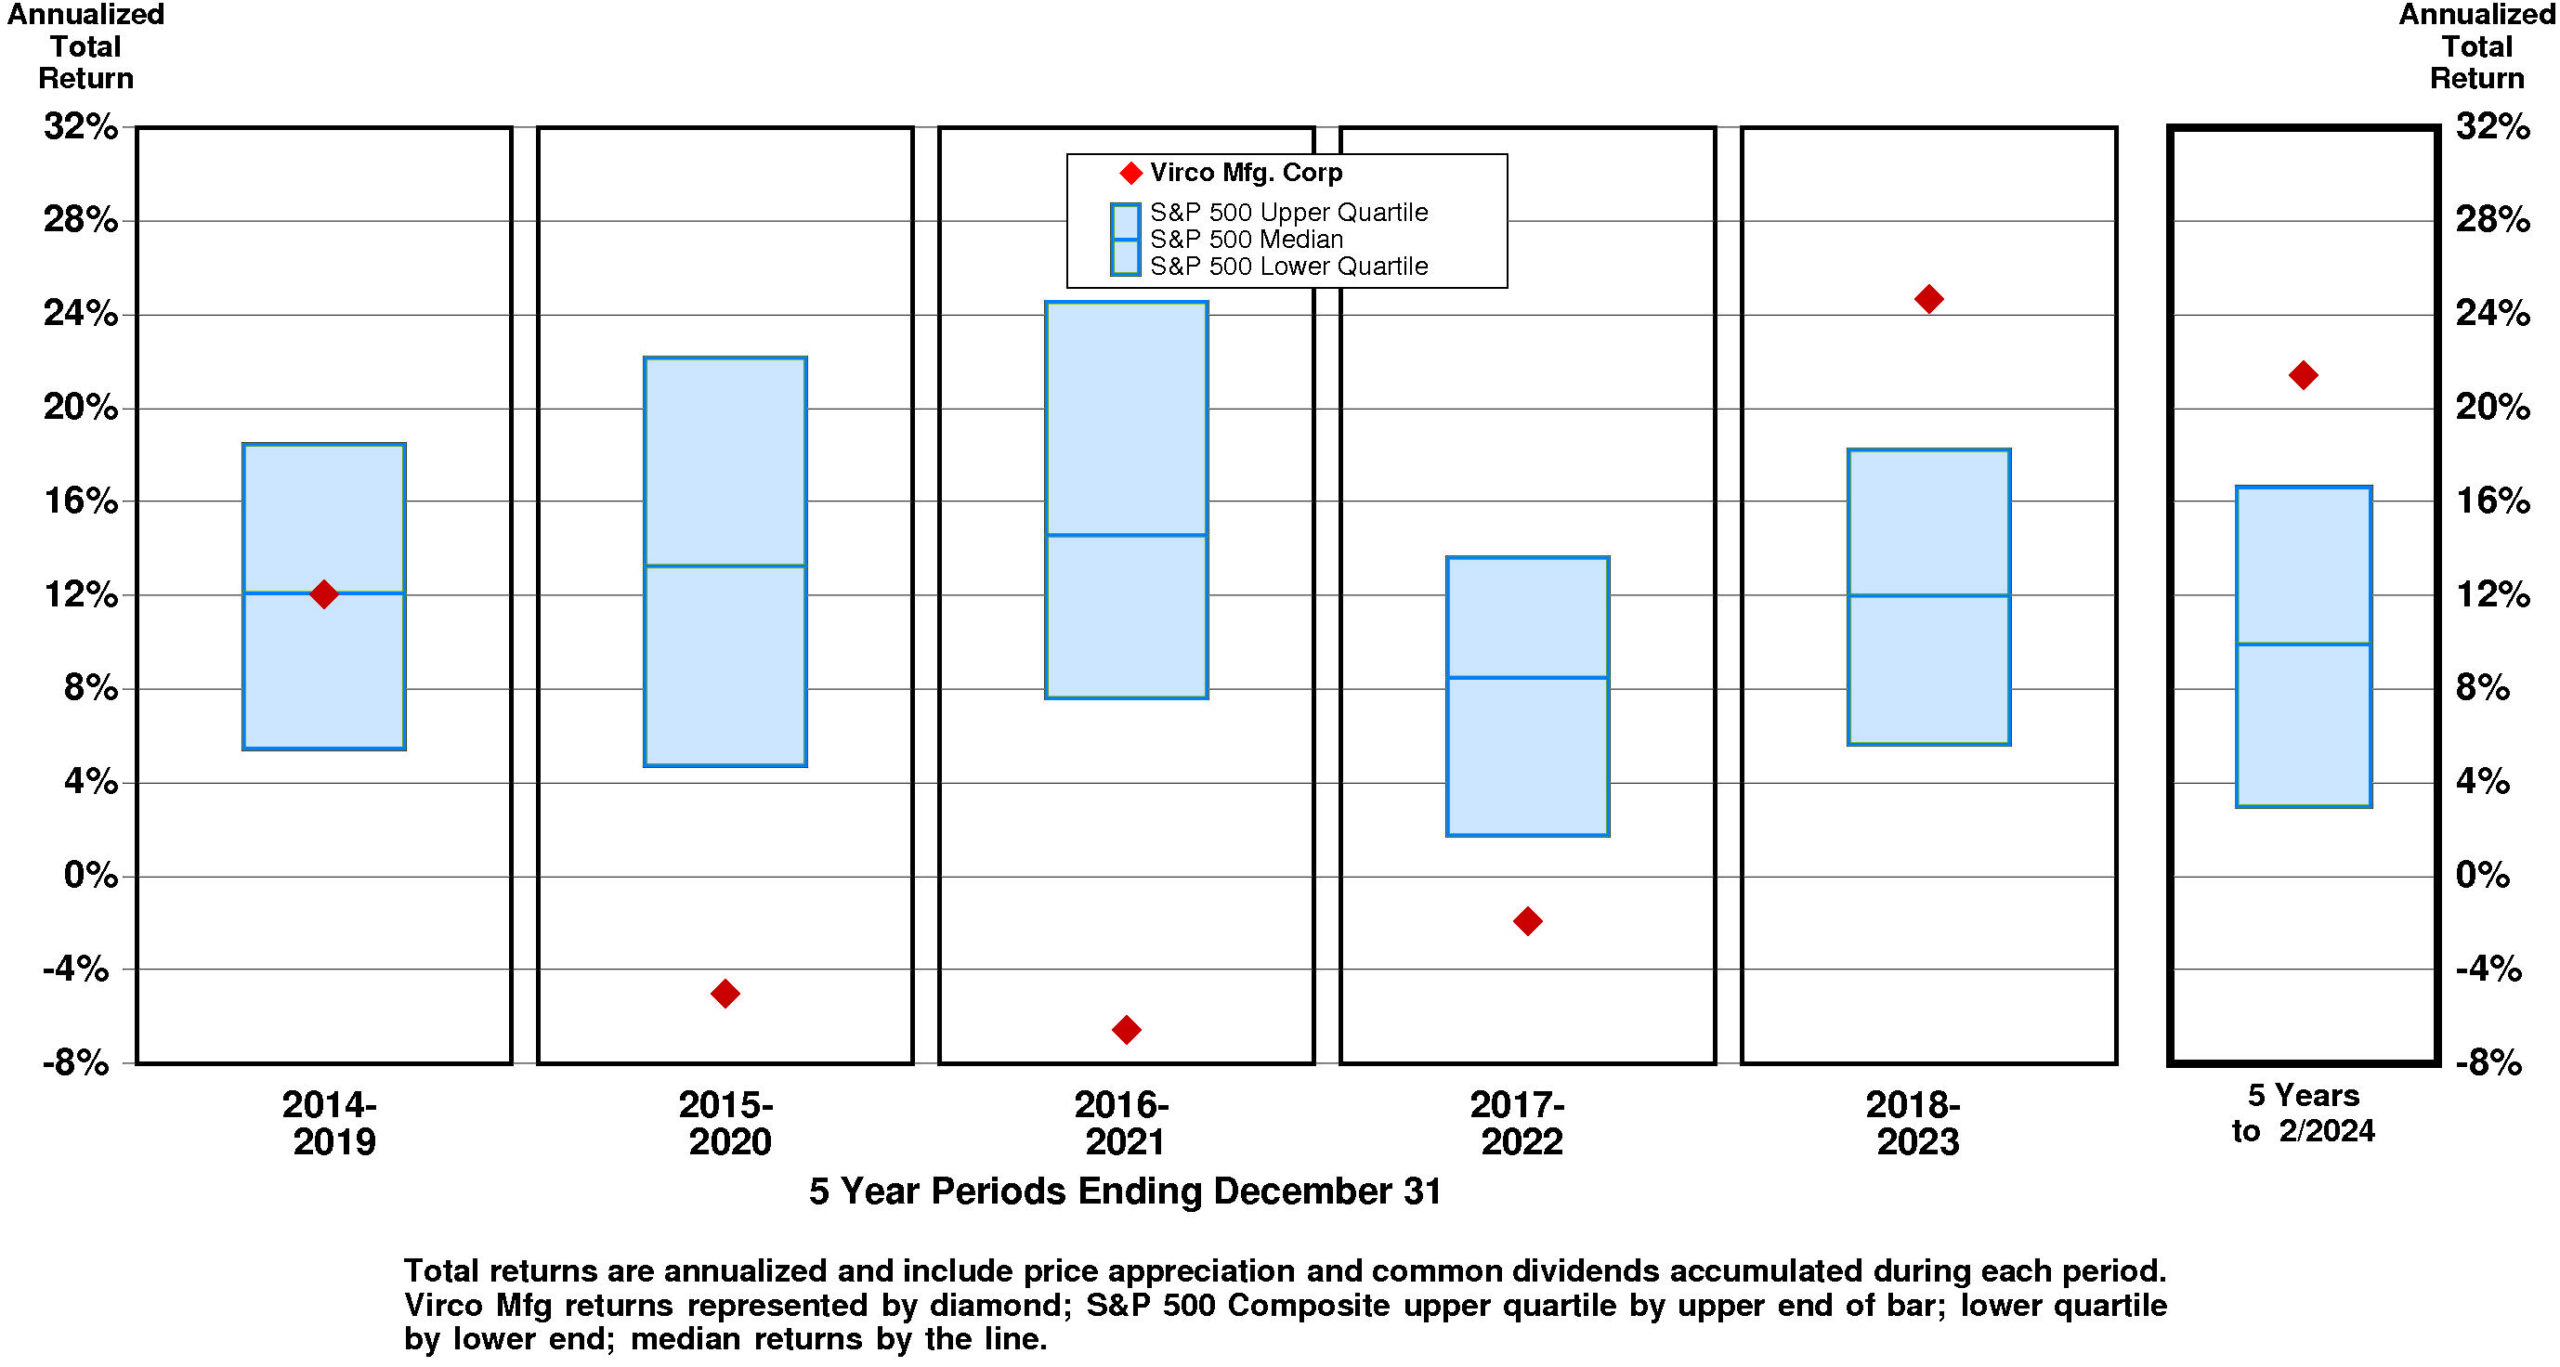
Current annual total return performance of 133.6% is upper quartile relative to the S&P 500 Composite.
In addition to being upper quartile relative to S&P 500 Composite, current annual total return performance through February, 2024 of 133.6% is upper quartile relative to Virco Mfg. Corp Peer Group.
Current 5-year total return performance of 21.4% is upper quartile relative to the S&P 500 Composite.
Through February, 2024, with upper quartile current 5-year total return of 21.4% relative to S&P 500 Composite, Virco Mfg’s total return performance is upper quartile relative to Virco Mfg. Corp Peer Group.
VALUATION BENCHMARKS
Relative to S&P 500 Composite, VIRC’s overall valuation is quite low. The highest factor, the ratio of enterprise value/assets, is below median. Price/equity ratio is at the lower quartile. Ratio of enterprise value/earnings before interest and taxes is lower quartile. Price/earnings ratio is lower quartile. The lowest factor, the ratio of enterprise value/revenue, is lower quartile.
Relative to Virco Mfg Peer Group, VIRC’s overall valuation is low. The highest factor, the ratio of enterprise value/assets, is at the upper quartile. Price/equity ratio is at median. Ratio of enterprise value/revenue is below median. Ratio of enterprise value/earnings before interest and taxes is lower quartile. The lowest factor, the price/earnings ratio, is lower quartile.
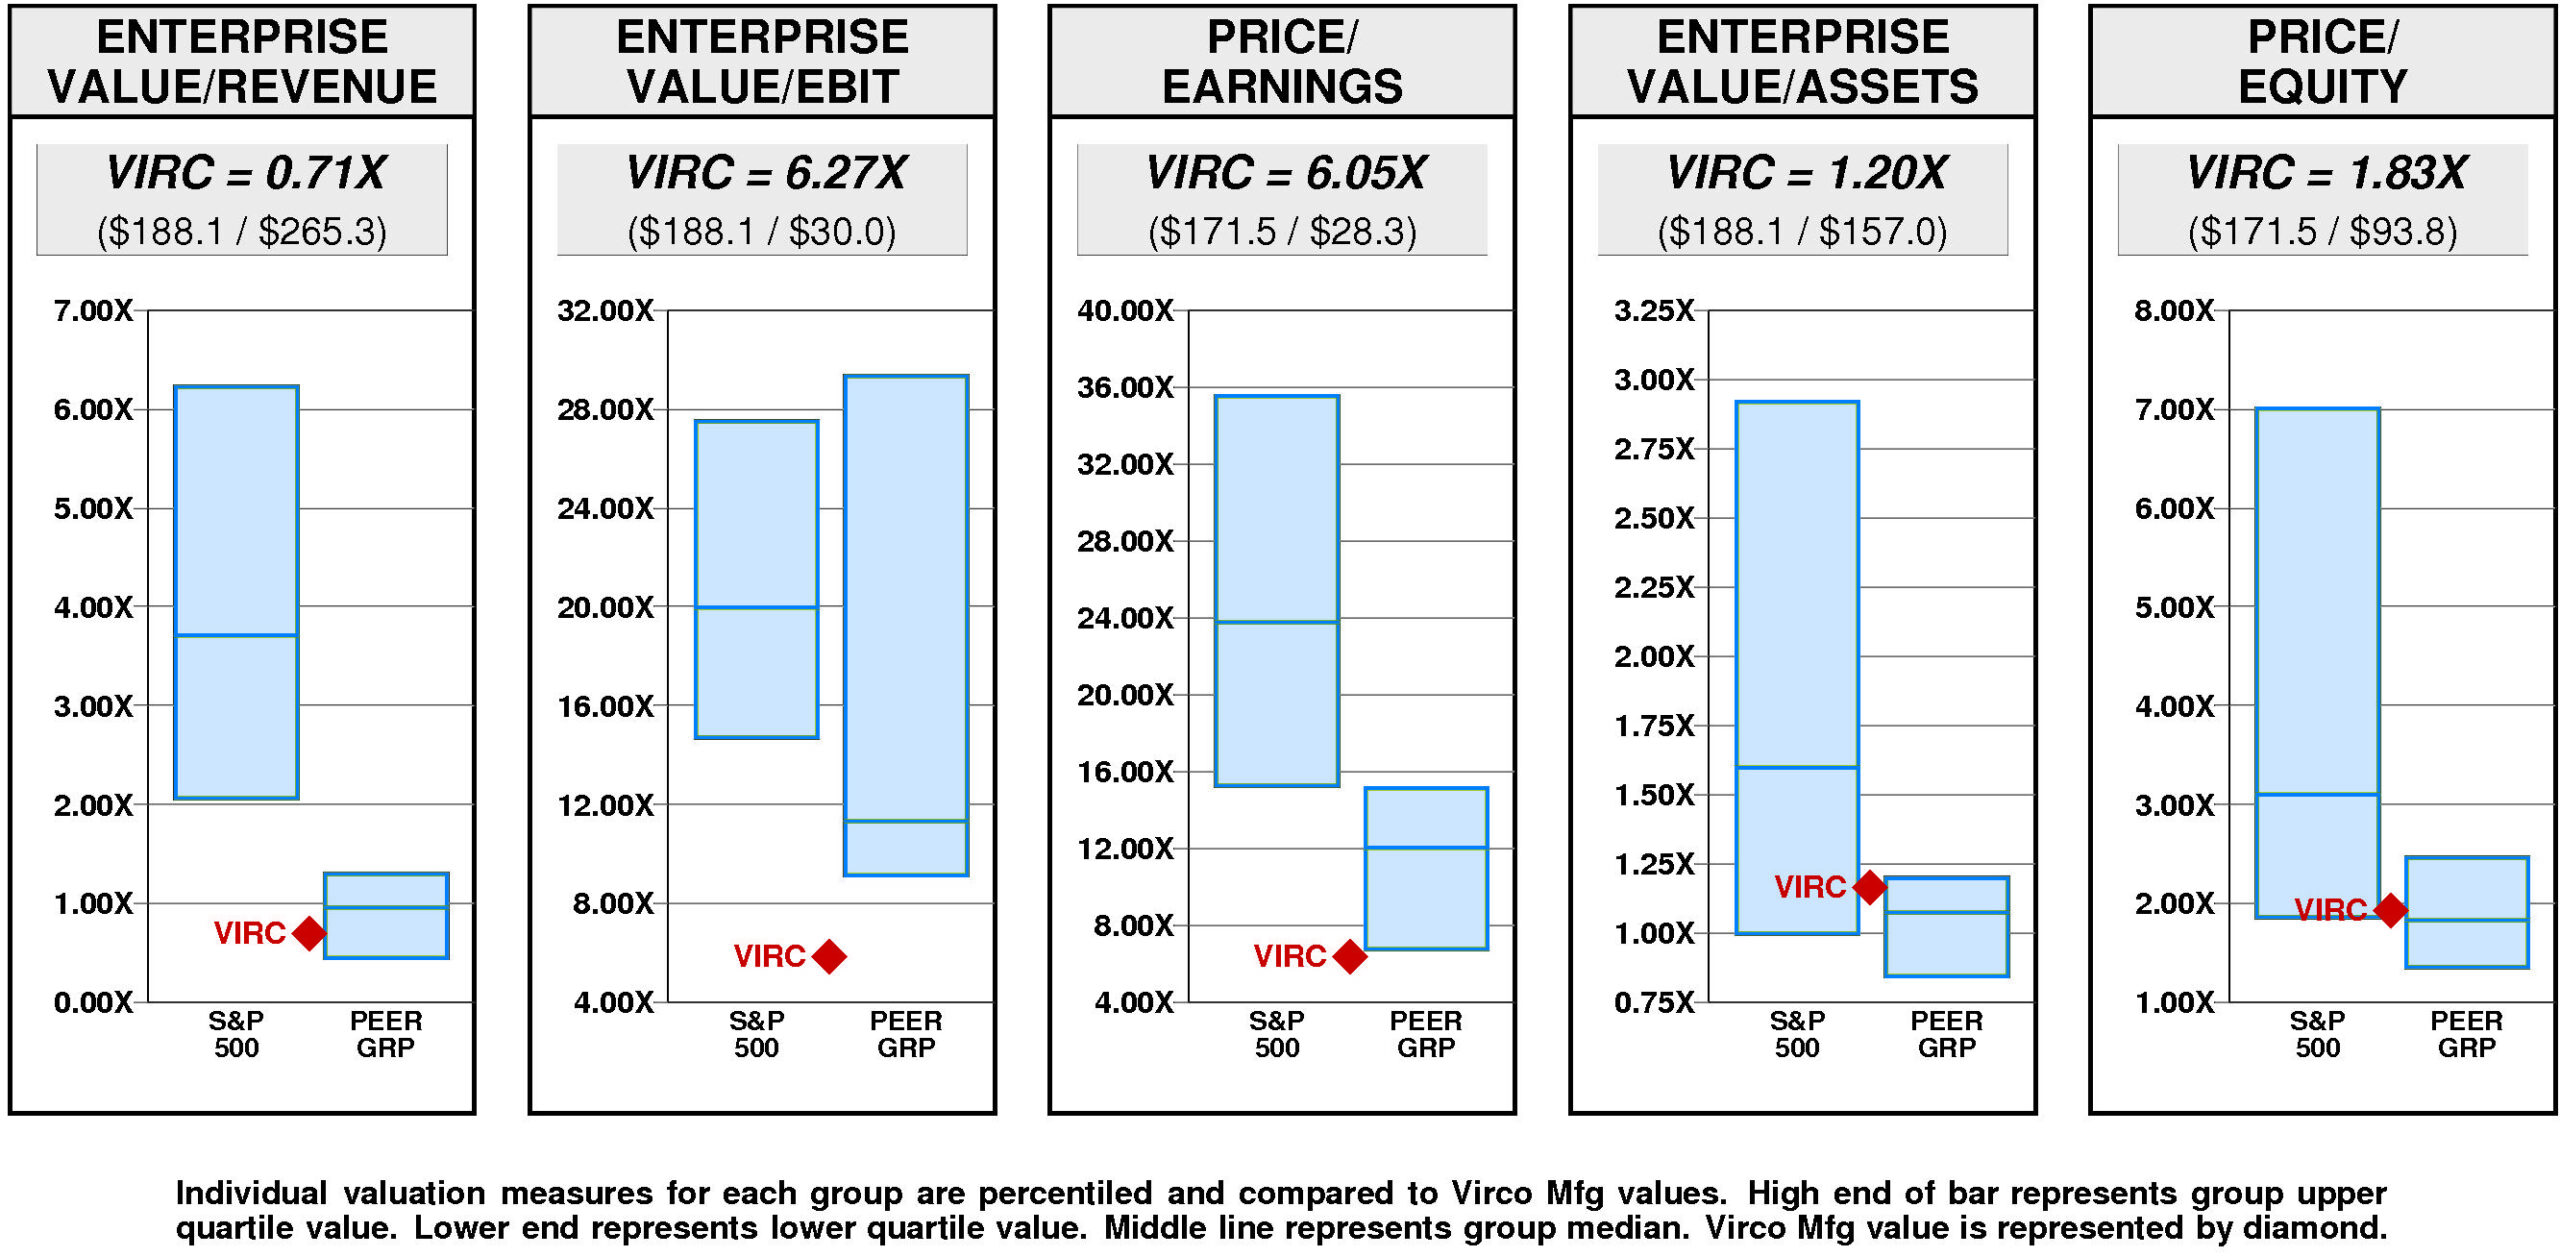
Virco Mfg has a major value gap compared to the median valuation. For VIRC to rise to median valuation, its current ratio of enterprise value/revenue would have to rise from the current level of 0.71X to 0.96X. If VIRC’s ratio of enterprise value/revenue were to rise to 0.96X, its stock price would be lower by $4 to $14.
For VIRC to hit lower quartile valuation relative to the Virco Mfg Peer Group, its current ratio of enterprise value/revenue would have to fall from the current level of 0.71X to 0.45X. If VIRC’s ratio of enterprise value/revenue were to fall to 0.45X, its stock price would decline by $-4 from the current level of $10.
VALUE TARGETS
Reflecting future returns on capital that are forecasted to be above the cost of capital, VIRC is expected to continue to be a major Value Builder.
Virco Mfg’s current Price Target of $13 represents a +26% change from the current price of $10.49.
This neutral appreciation potential results in an appreciation score of 45 (55% of the universe has greater appreciation potential.)
With this neutral Appreciation Score of 45, the high Power Rating of 99 results in an Value Trend Rating of A.
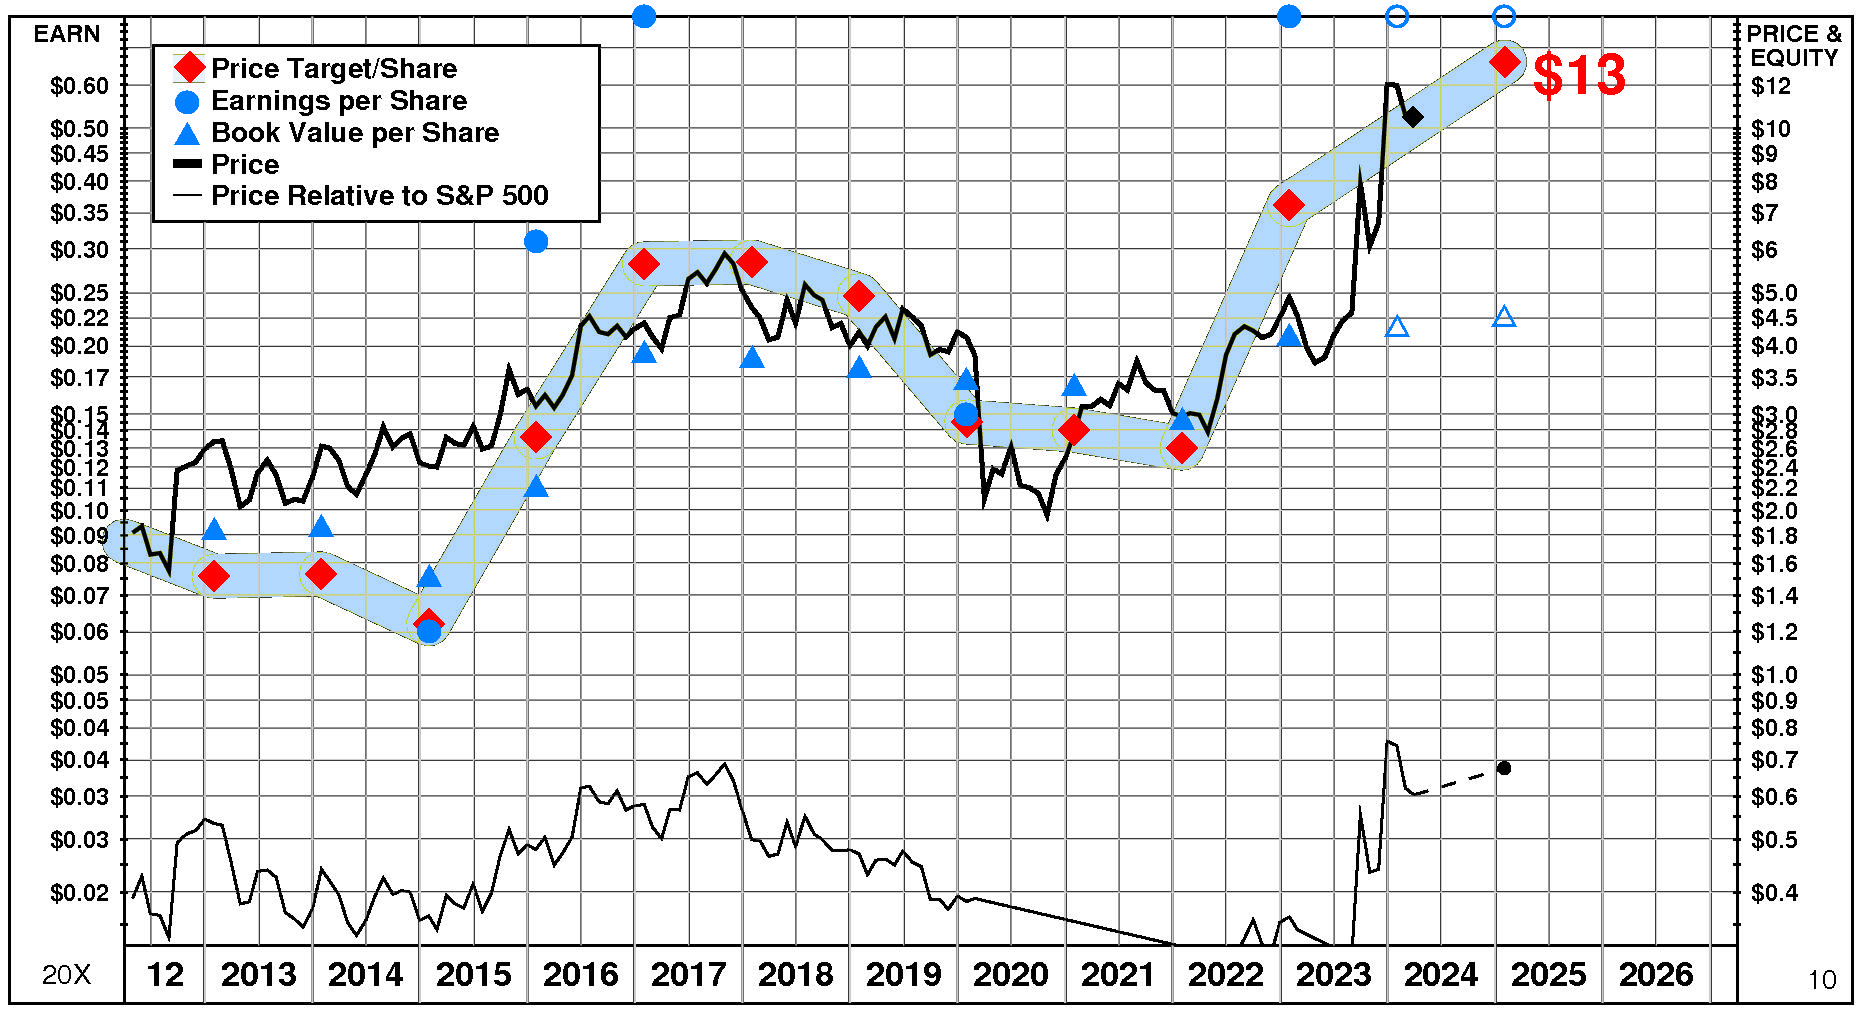
Virco Mfg’s current Price Target is $13 (+83% from the 2023 Target of $7 and +26% from the 03/25/24 price of $10.49). This dramatic rise in the Target is the result of a +9% increase in the equity base and a +67% increase in the price/equity multiple. The forecasted increase in growth has a very large positive impact on the price/equity multiple and the forecasted increase in return on equity has a slight positive impact as well. Partially offsetting these Drivers, the forecasted increase in cost of equity has a slight negative impact.
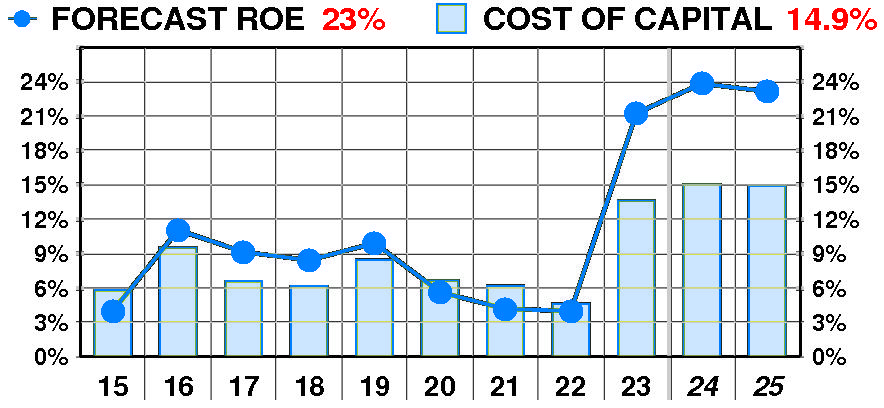
PTR’s return on equity forecast is 23.1% — in line with our recent forecasts. Forecasted return on equity enjoyed a dramatic, erratic increase between 2015 and 2023. The current forecast is significantly above the 2022 low of 4%.
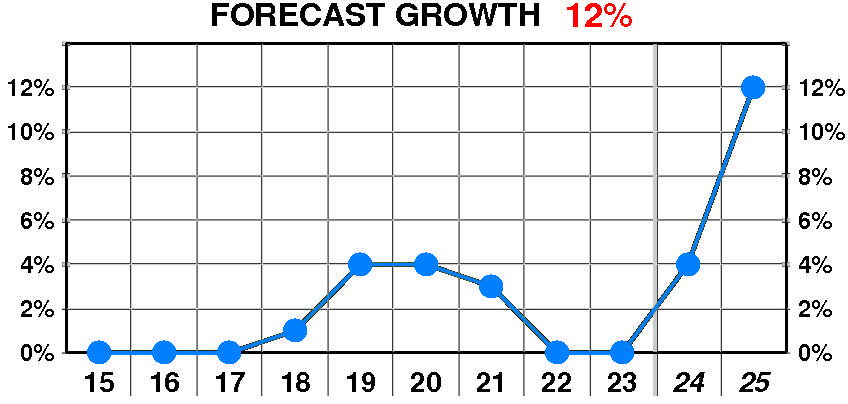
PTR’s growth forecast is 12.0% — substantially above our recent forecasts. Forecasted growth enjoyed a dramatic, erratic increase between 2018 and 2023. The current forecast is significantly above the 2018 low of 1%.
PTR’s cost of equity forecast is 14.9% — in line with recent levels. Forecasted cost of equity suffered a dramatic, erratic increase between 2015 and 2023. The current forecast is significantly above the 2022 low of 4.6%.
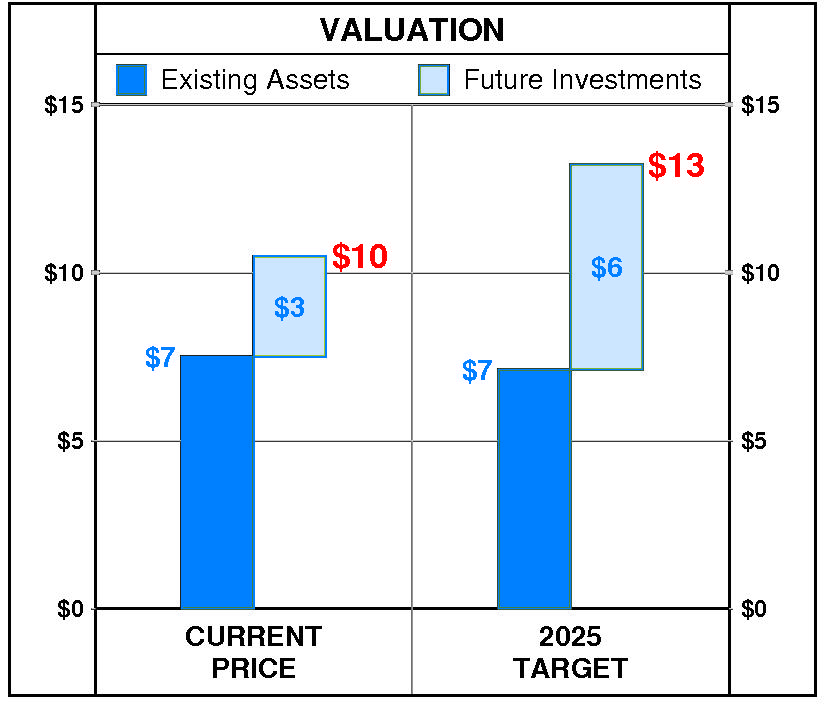
At Virco Mfg’s current price of $10.49, investors are placing a positive value of $3 on its future investments. This view is consistent with the company’s most recent performance that reflected a growth rate of 0.0% per year, and a return on equity of 21.2% versus a cost of equity of 13.6%.
PTR’s 2025 Price Target of $13 is based on these forecasts and reflects an estimated value of existing assets of $7 and a value of future investments of $6.
Be the first to comment