![]()
BUSINESS
MGE Energy, Inc., through its subsidiaries, operates as a public utility holding company primarily in Wisconsin. It operates through Regulated Electric Utility Operations; Regulated Gas Utility Operations; Nonregulated Energy Operations; Transmission Investments; and All Other. The company generates, purchases, and distributes electricity; owns or leases electric generation facilities located in Wisconsin and Iowa; and plans, constructs, operates, maintains, and expands transmission facilities to provide transmission services. It also generates electricity from coal-fired, gas-fired, and renewable energy sources, as well as purchases power under short and long-term commitments.
INVESTMENT RATING
MGEE is expected to continue to be a Value Builder reflecting capital returns that are forecasted to be above the cost of capital.
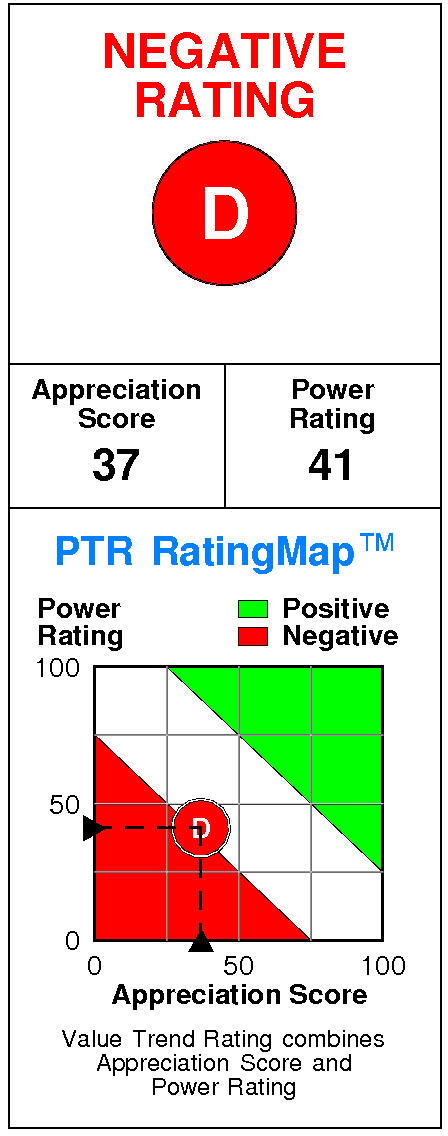
MGE Energy has a current Value Trend Rating of D (Negative).
This rating combines highly consistent signals from two proprietary PTR measures of a stock’s attractiveness. MGE Energy has a neutral Power Rating of 41 and a slightly negative Appreciation Score of 37, with the Negative Value Trend Rating the result.
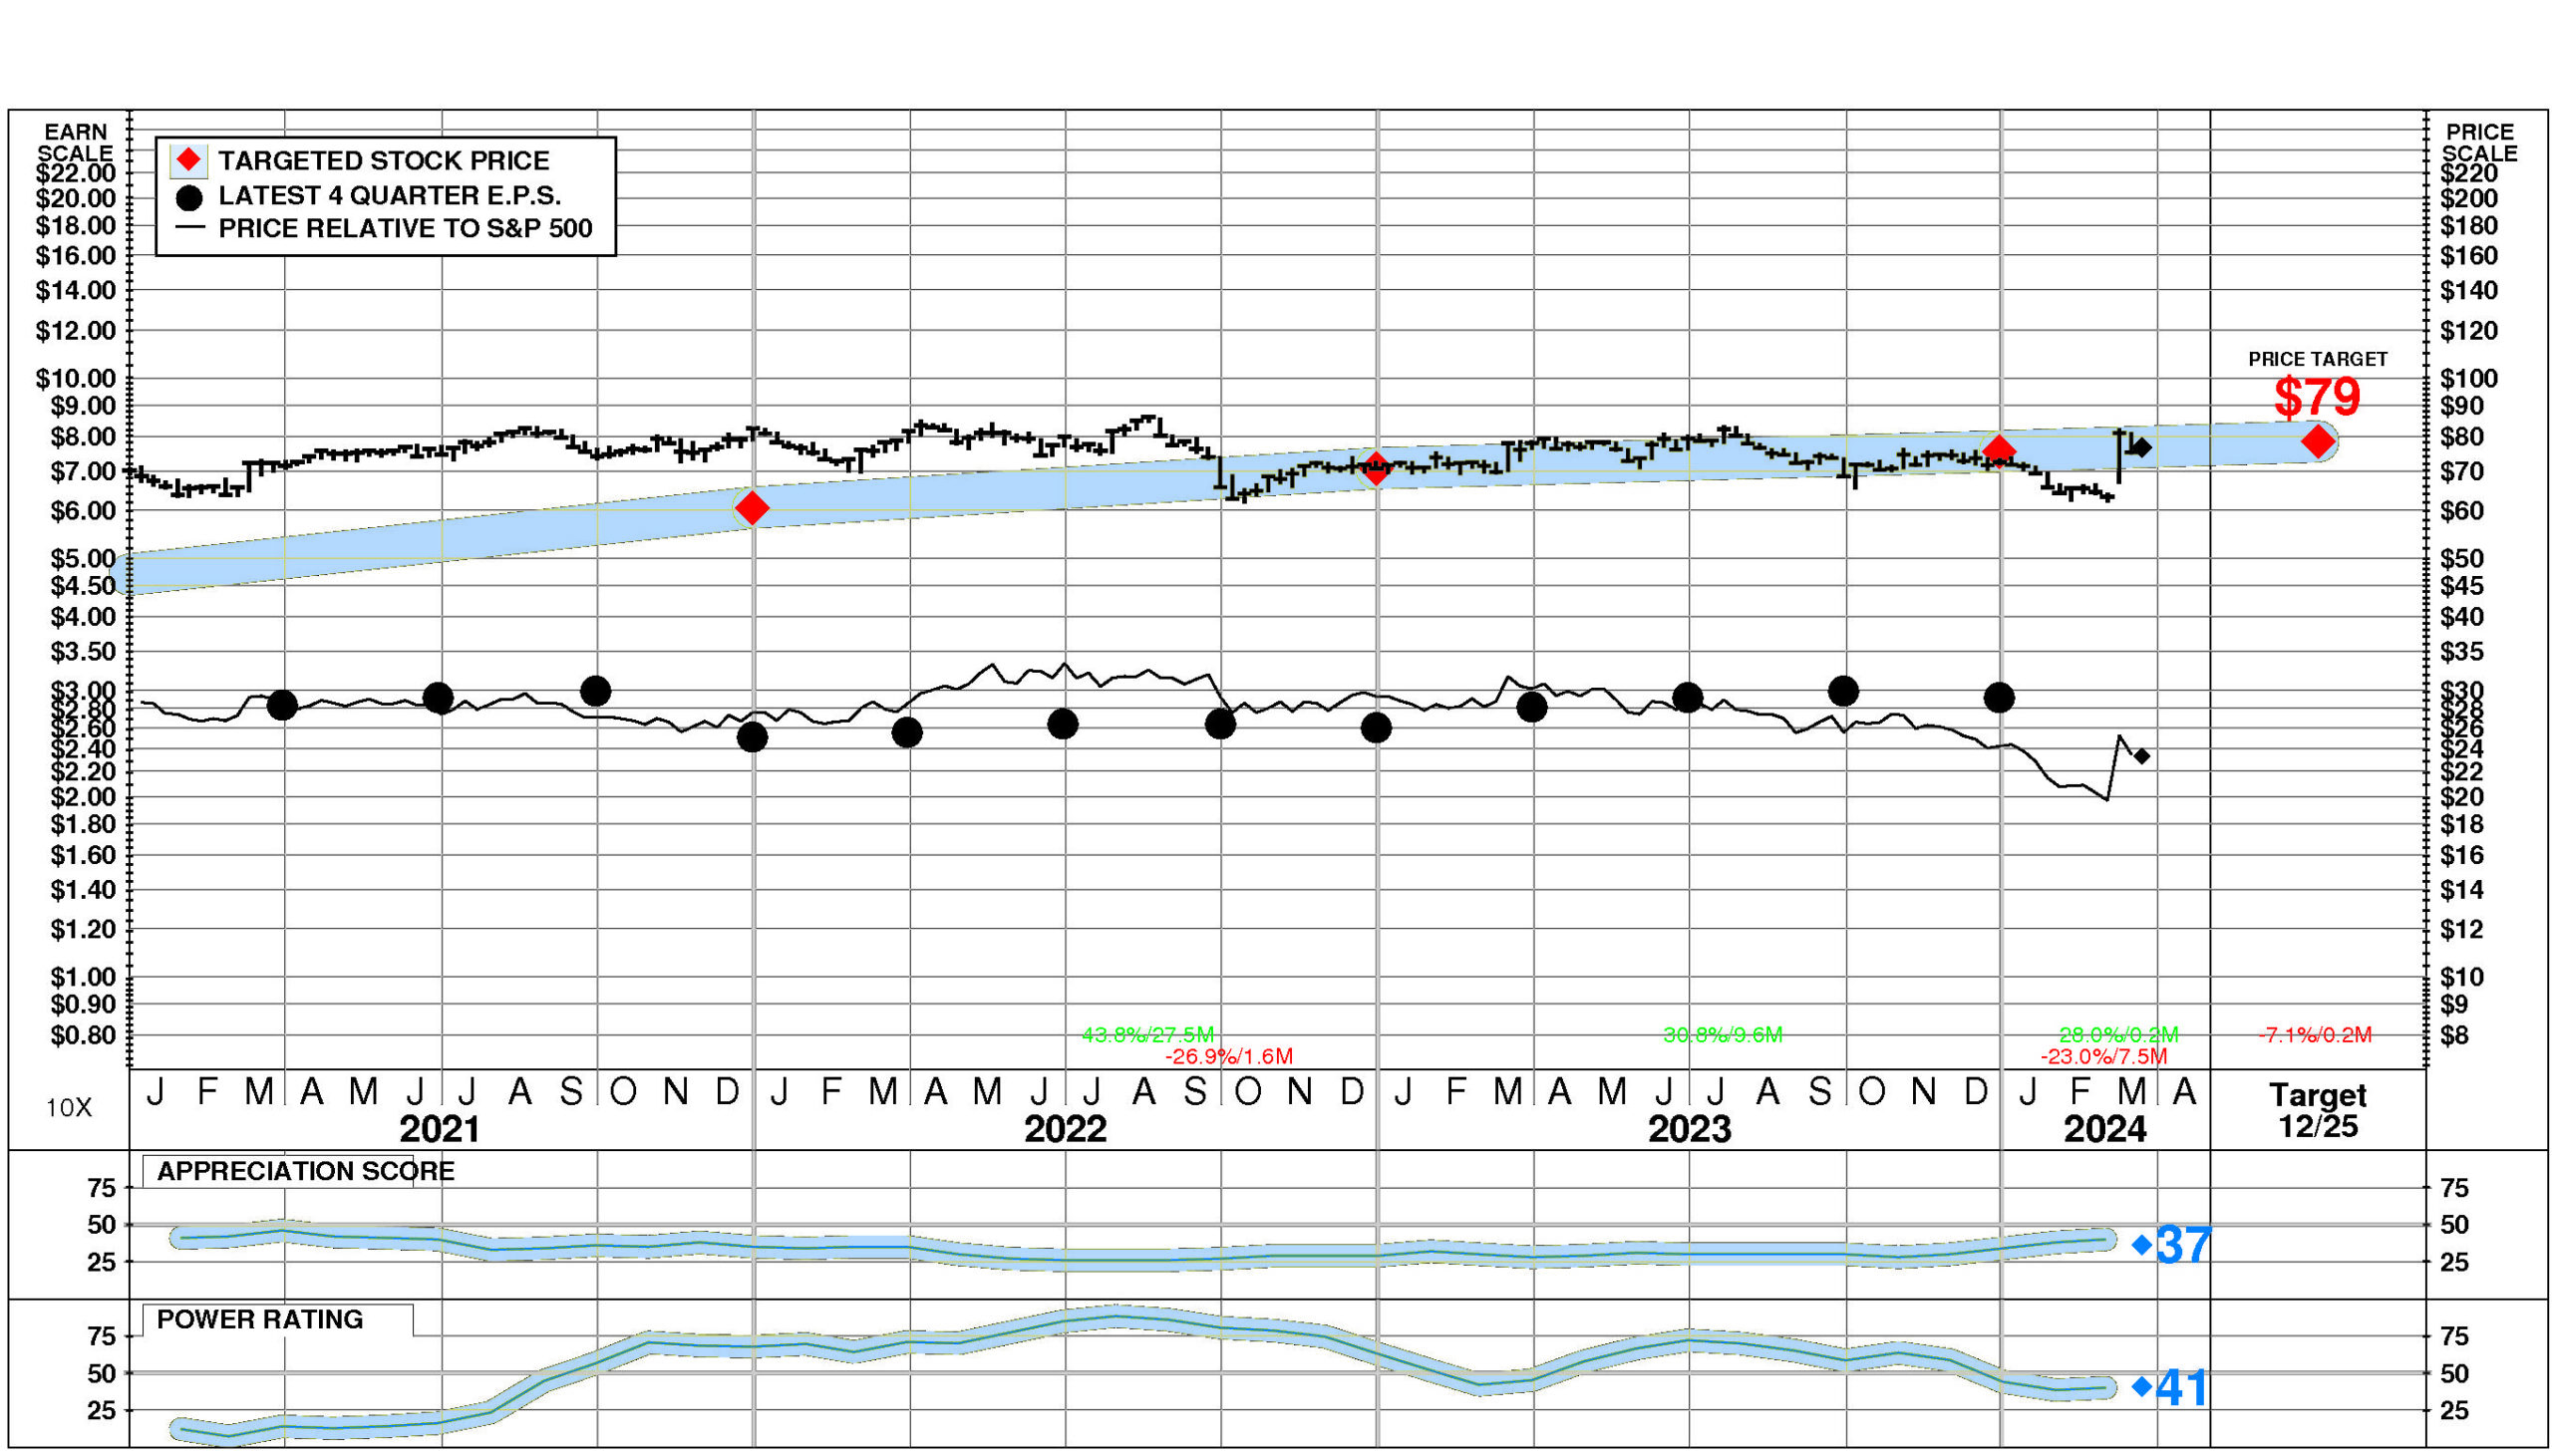
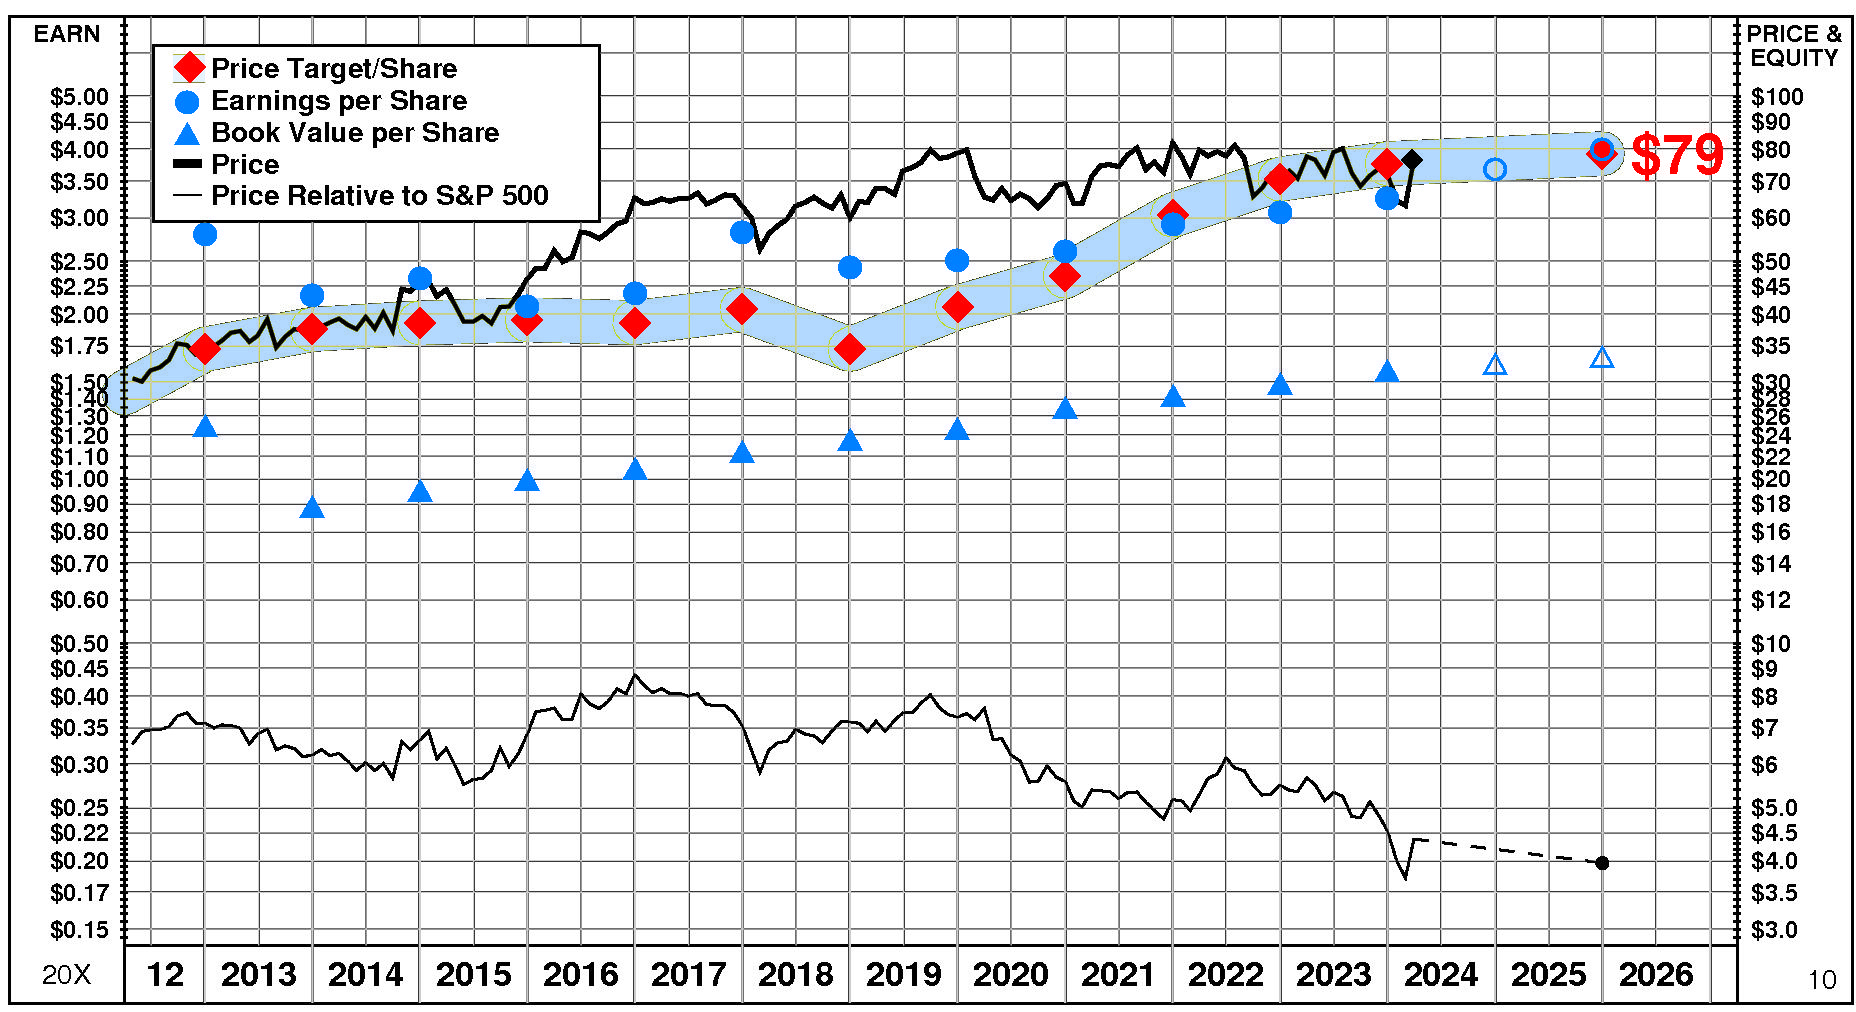
MGE Energy’s stock is selling at targeted value. The current stock price of $76.55 compares to targeted value 12 months forward of $78.
This moderately low appreciation potential results in an appreciation score of 37 (63% of the universe has greater appreciation potential.)
MGE Energy has a Power Rating of 41. (This neutral Power Rating indicates that MGEE’s chances of enjoying favorable investment performance over the near to intermediate term are only average.)
Factors contributing to this neutral Power Rating include: recent price action has been slightly unfavorable; and the Electric & Other Services Combined comparison group is in a slightly weakened position currently. An offsetting factor is earnings estimate behavior for MGEE has been slightly favorable recently.
INVESTMENT PROFILE
MGE Energy’s financial strength is average. Financial strength rating is 51.
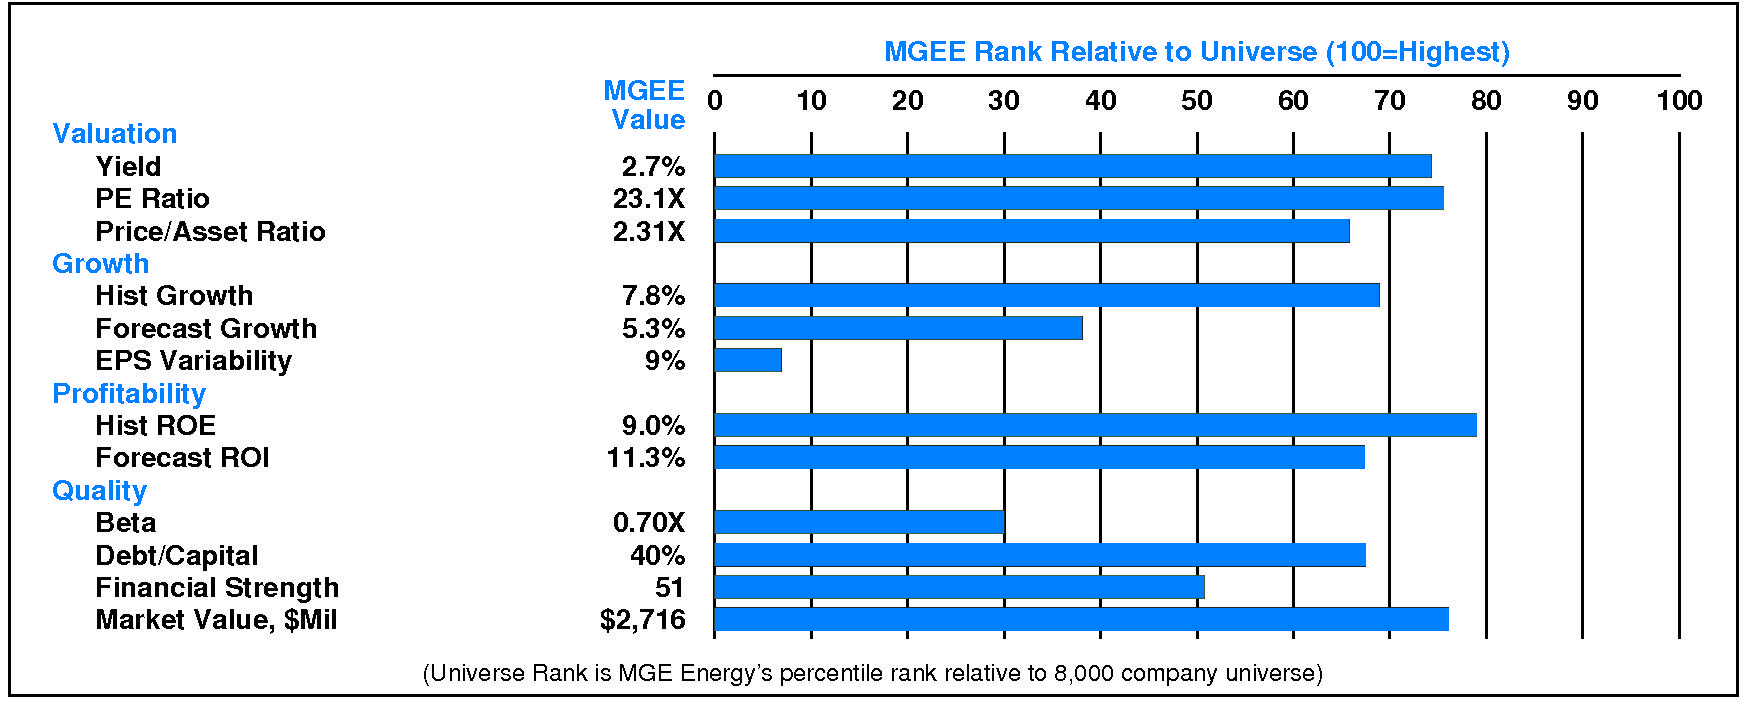
Relative to the S&P 500 Composite, MGE Energy Inc has moderate Value characteristics; its appeal is likely to be to Income-oriented investors; the perception is that MGEE is lower risk. Relative weaknesses include: low forecasted profitability, low financial strength, and low expected growth. MGE Energy’s valuation is moderate: moderate dividend yield, moderate P/E ratio, and moderate price/book ratio. MGEE has unusually low market capitalization.
CURRENT SIGNALS
MGE Energy’s current operations are stable. Return on equity is rising, reflecting: improving asset utilization; widening pretax margins; and rising leverage.
MGE Energy’s current technical position is mixed. The stock price is in a 0.2 month up move. The stock has appreciated 28.0% from its prior low. The 200 day moving average is in a downtrend. The stock price is above its 200 day moving average. The 200 day moving average has just turned down.
ALERTS
Significant negative changes in investment behavior have recently occurred for MGE Energy Inc (NASDAQ: MGEE): its longer term price trend turned down.
The stock is currently rated D.
MGE Energy Inc (NASDAQ: MGEE) stock increased 1.7% on 3/21/24. The shares closed at $76.55. NORMAL trading volume accompanied the advance. The stock is unchanged during the last week but has been weak relative to the market over the last nine months.
CASH FLOW
In 2023, MGE Energy experienced a decrease in cash of -$0.5 million (-4%). Sources of cash were very modestly less than uses. Cash generated from 2023 EBITDA totaled +$246.7 million. Non-operating sources contributed +$32.3 million (+13% of EBITDA). Cash taxes consumed -$2.8 million (-1% of EBITDA). Re-investment in the business amounted to -$237.1 million (-96% of EBITDA). On a net basis, debt investors supplied +$19.6 million (+8% of EBITDA) while equity investors pulled out -$59.3 million (-24% of EBITDA).
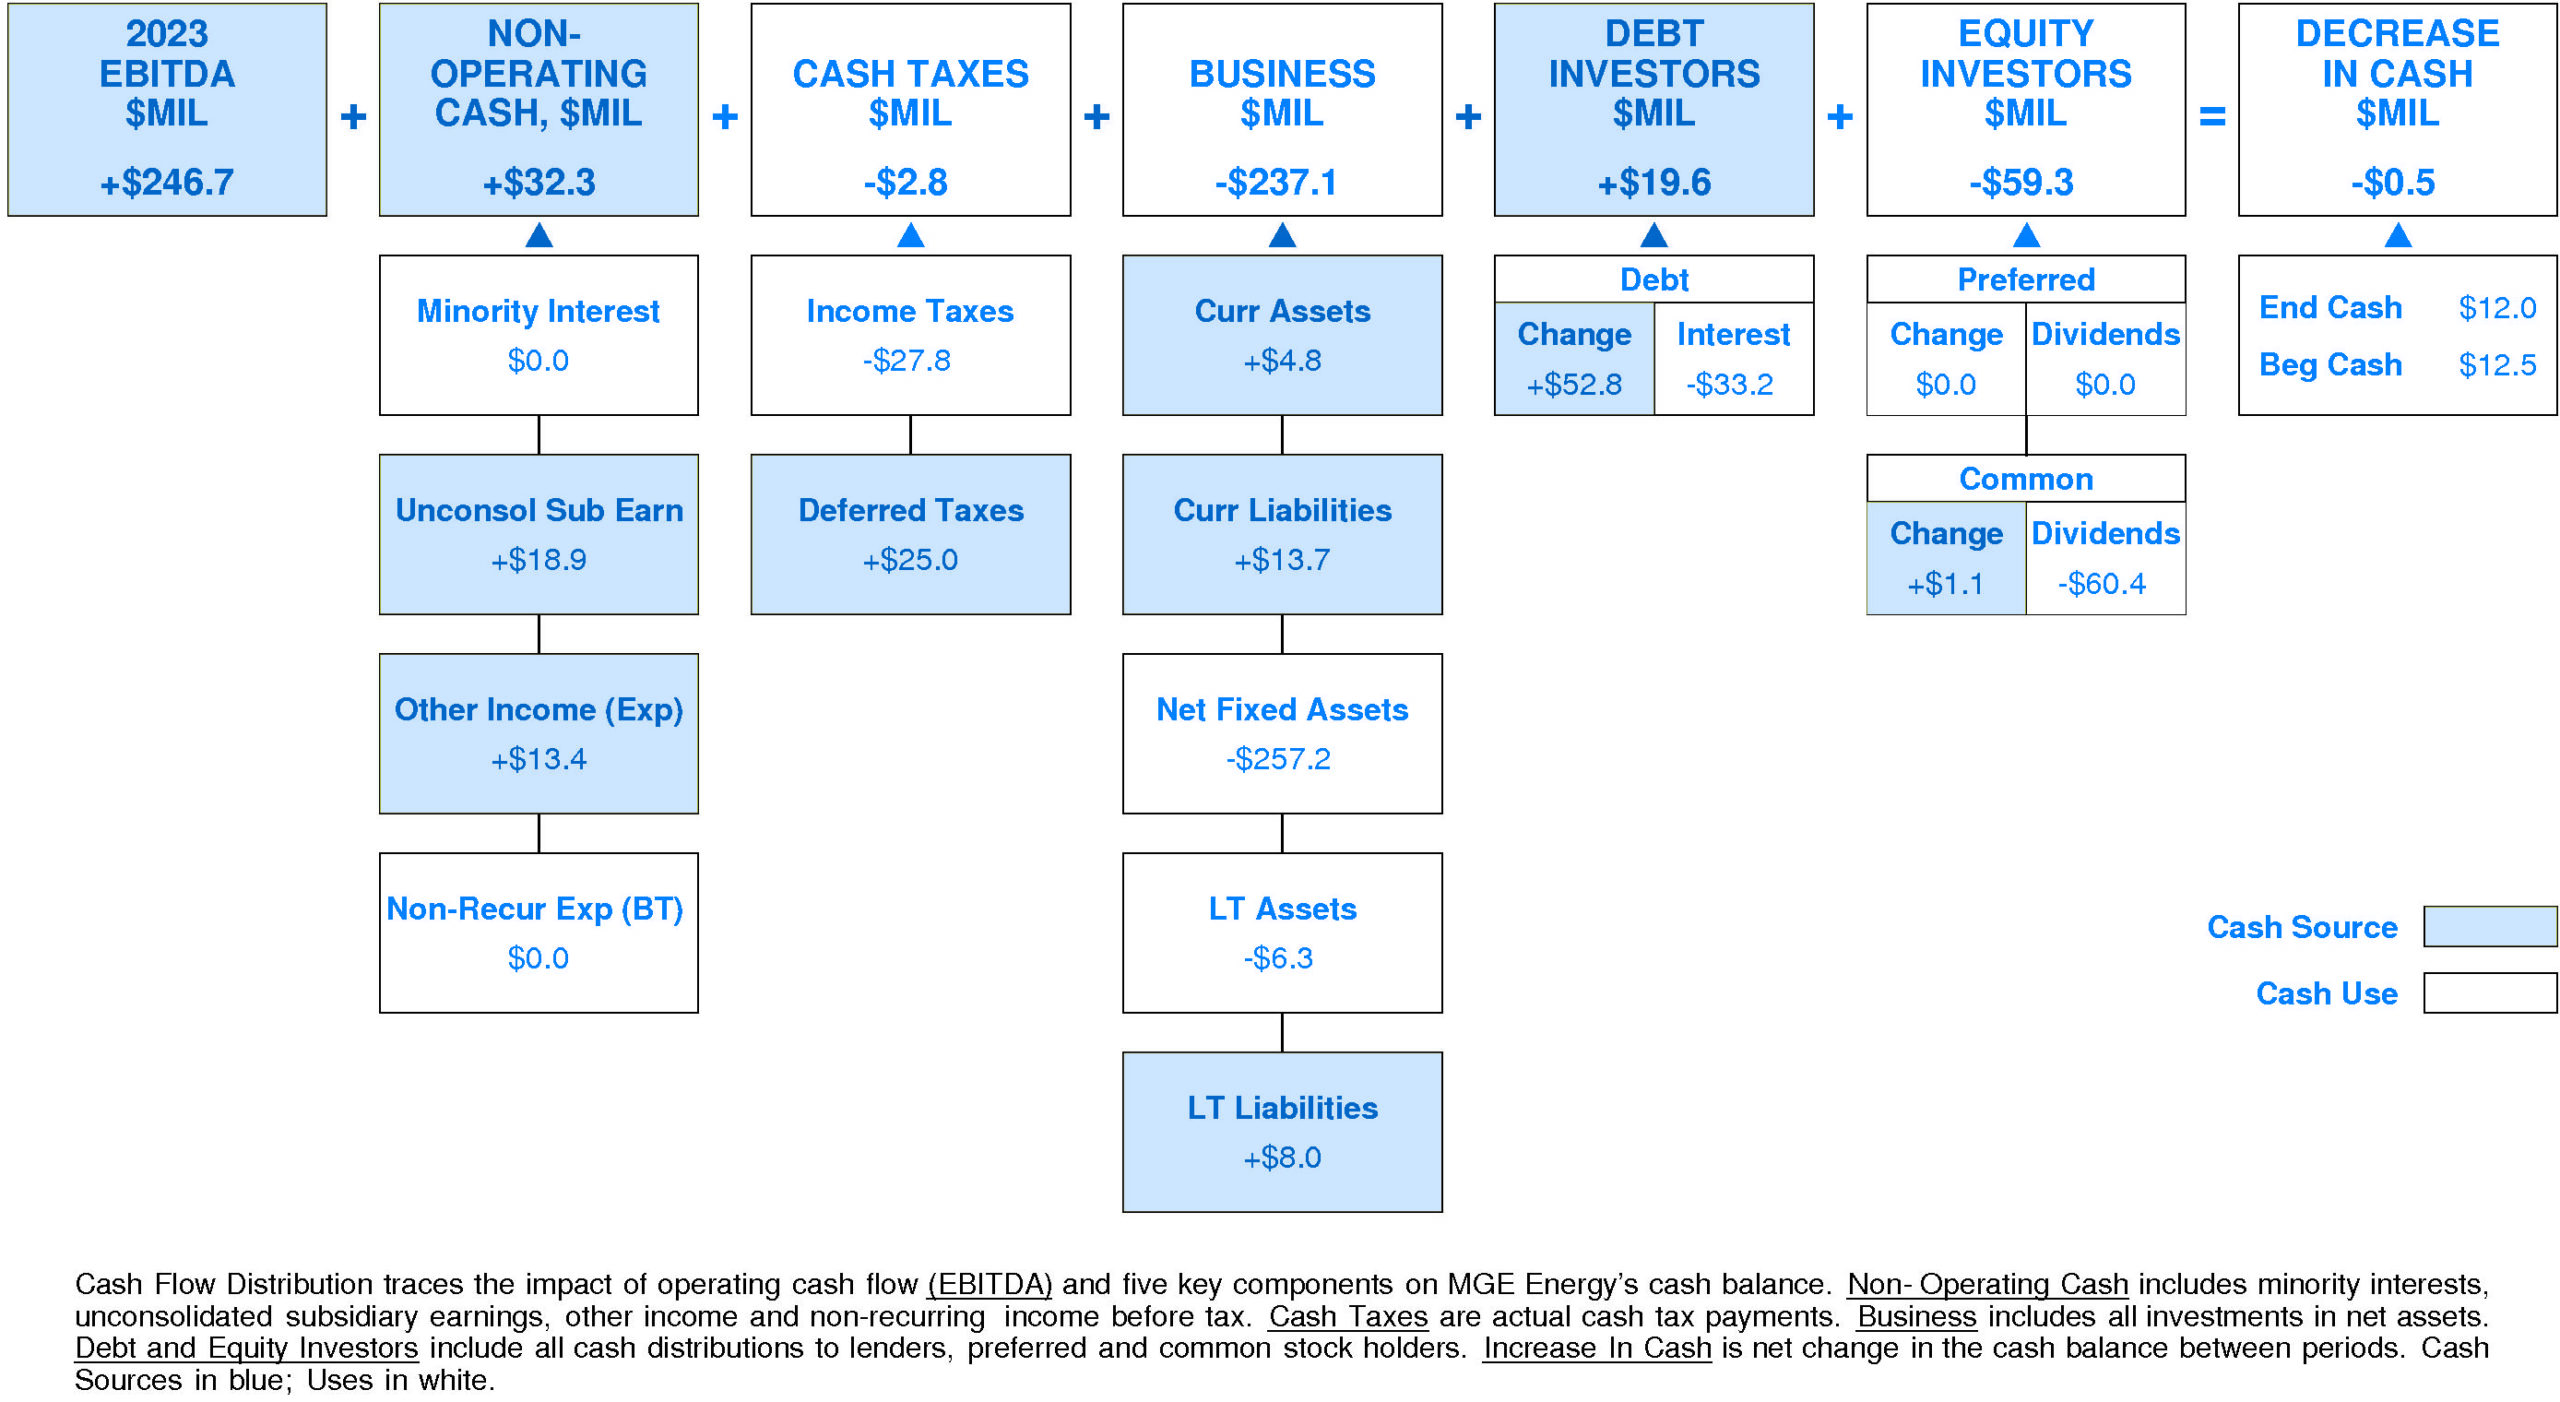
MGE Energy’s Non-operating Income, %EBITDA has exhibited a very small overall uptrend over the period. This improvement was accompanied by a similar trend for the Mge Energy Peer Group. In most years, MGE Energy was in the top quartile. Currently, MGE Energy is upper quartile at +13% of EBITDA (+$32.3 million).
MGE Energy’s Cash Taxes, %EBITDA enjoyed a volatile overall uptrend over the period. This improvement was accompanied by a similar trend for the Mge Energy Peer Group. (Since 2021 Cash Taxes, %EBITDA has experienced a very sharp decline.) In most years, MGE Energy was in the third quartile and second quartile. Currently, MGE Energy is below median at -1% of EBITDA (-$2.8 million).
MGE Energy’s Business Re-investment, %EBITDA has suffered a very strong overall downtrend over the period. This downtrend was accompanied by a similar trend for the Mge Energy Peer Group. (Since 2019 Business Re-investment, %EBITDA has experienced a very sharp recovery.) In most years, MGE Energy was in the second quartile and top quartile. Currently, MGE Energy is substantially above median at -96% of EBITDA (-$237.1 million).
MGE Energy’s Debt Investors, %EBITDA has experienced a strong overall uptrend over the period. This improvement was accompanied by a similar trend for the Mge Energy Peer Group. In most years, MGE Energy was in the third quartile and second quartile. Currently, MGE Energy is substantially below median at +8% of EBITDA (+$19.6 million).
MGE Energy’s Equity Investors, %EBITDA has exhibited little to no overall change over the period. This stability was accompanied by stability for the Mge Energy Peer Group as well. In most years, MGE Energy was in the lower quartile and third quartile. Currently, MGE Energy is substantially below median at -24% of EBITDA (-$59.3 million).
MGE Energy’s Change in Cash, %EBITDA has experienced a downtrend over the period. This downtrend was accompanied by stability for the Mge Energy Peer Group. (Since 2021 Change in Cash, %EBITDA has experienced a very sharp recovery.) In most years, MGE Energy was in the top quartile and lower quartile. Currently, MGE Energy is below median at -0% of EBITDA (-$0.5 million).
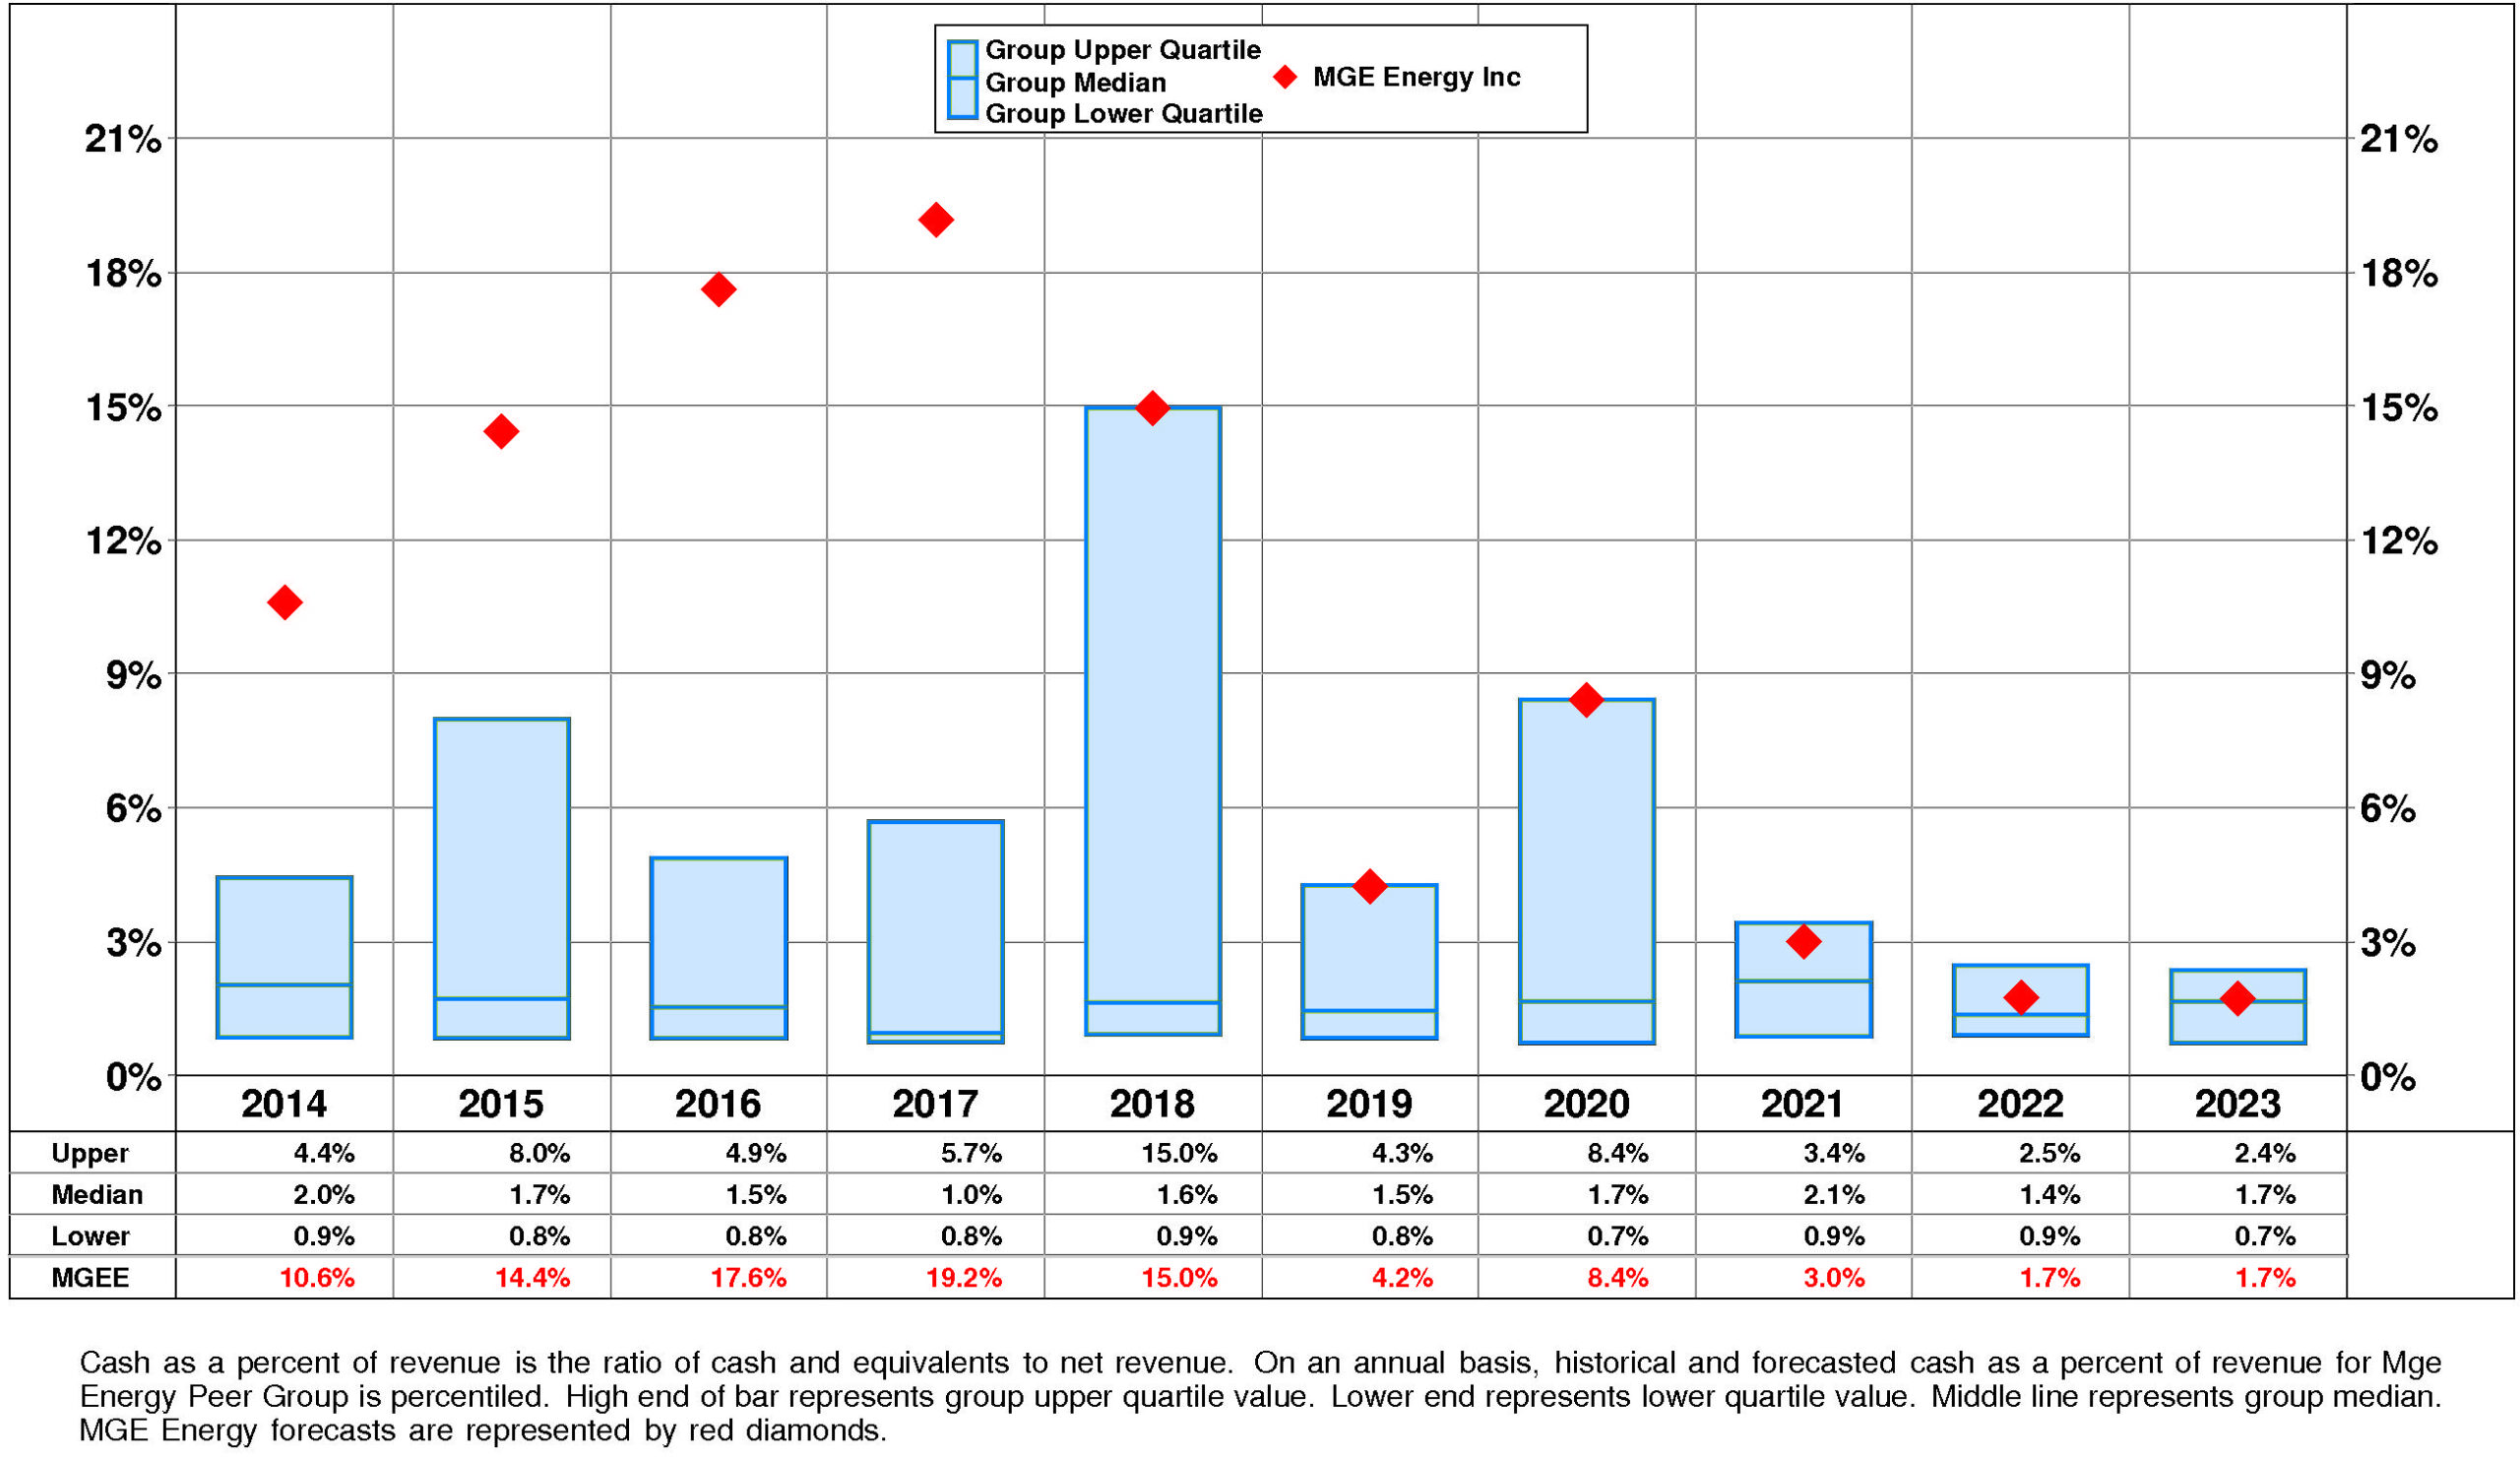
MGE Energy’s Cash, %Revenue has experienced a minor downtrend over the period. This downtrend was accompanied by stability for the Mge Energy Peer Group. In most years, MGE Energy was in the top quartile and second quartile. Currently, MGE Energy is slightly above median at +2%.
PROFITABILITY
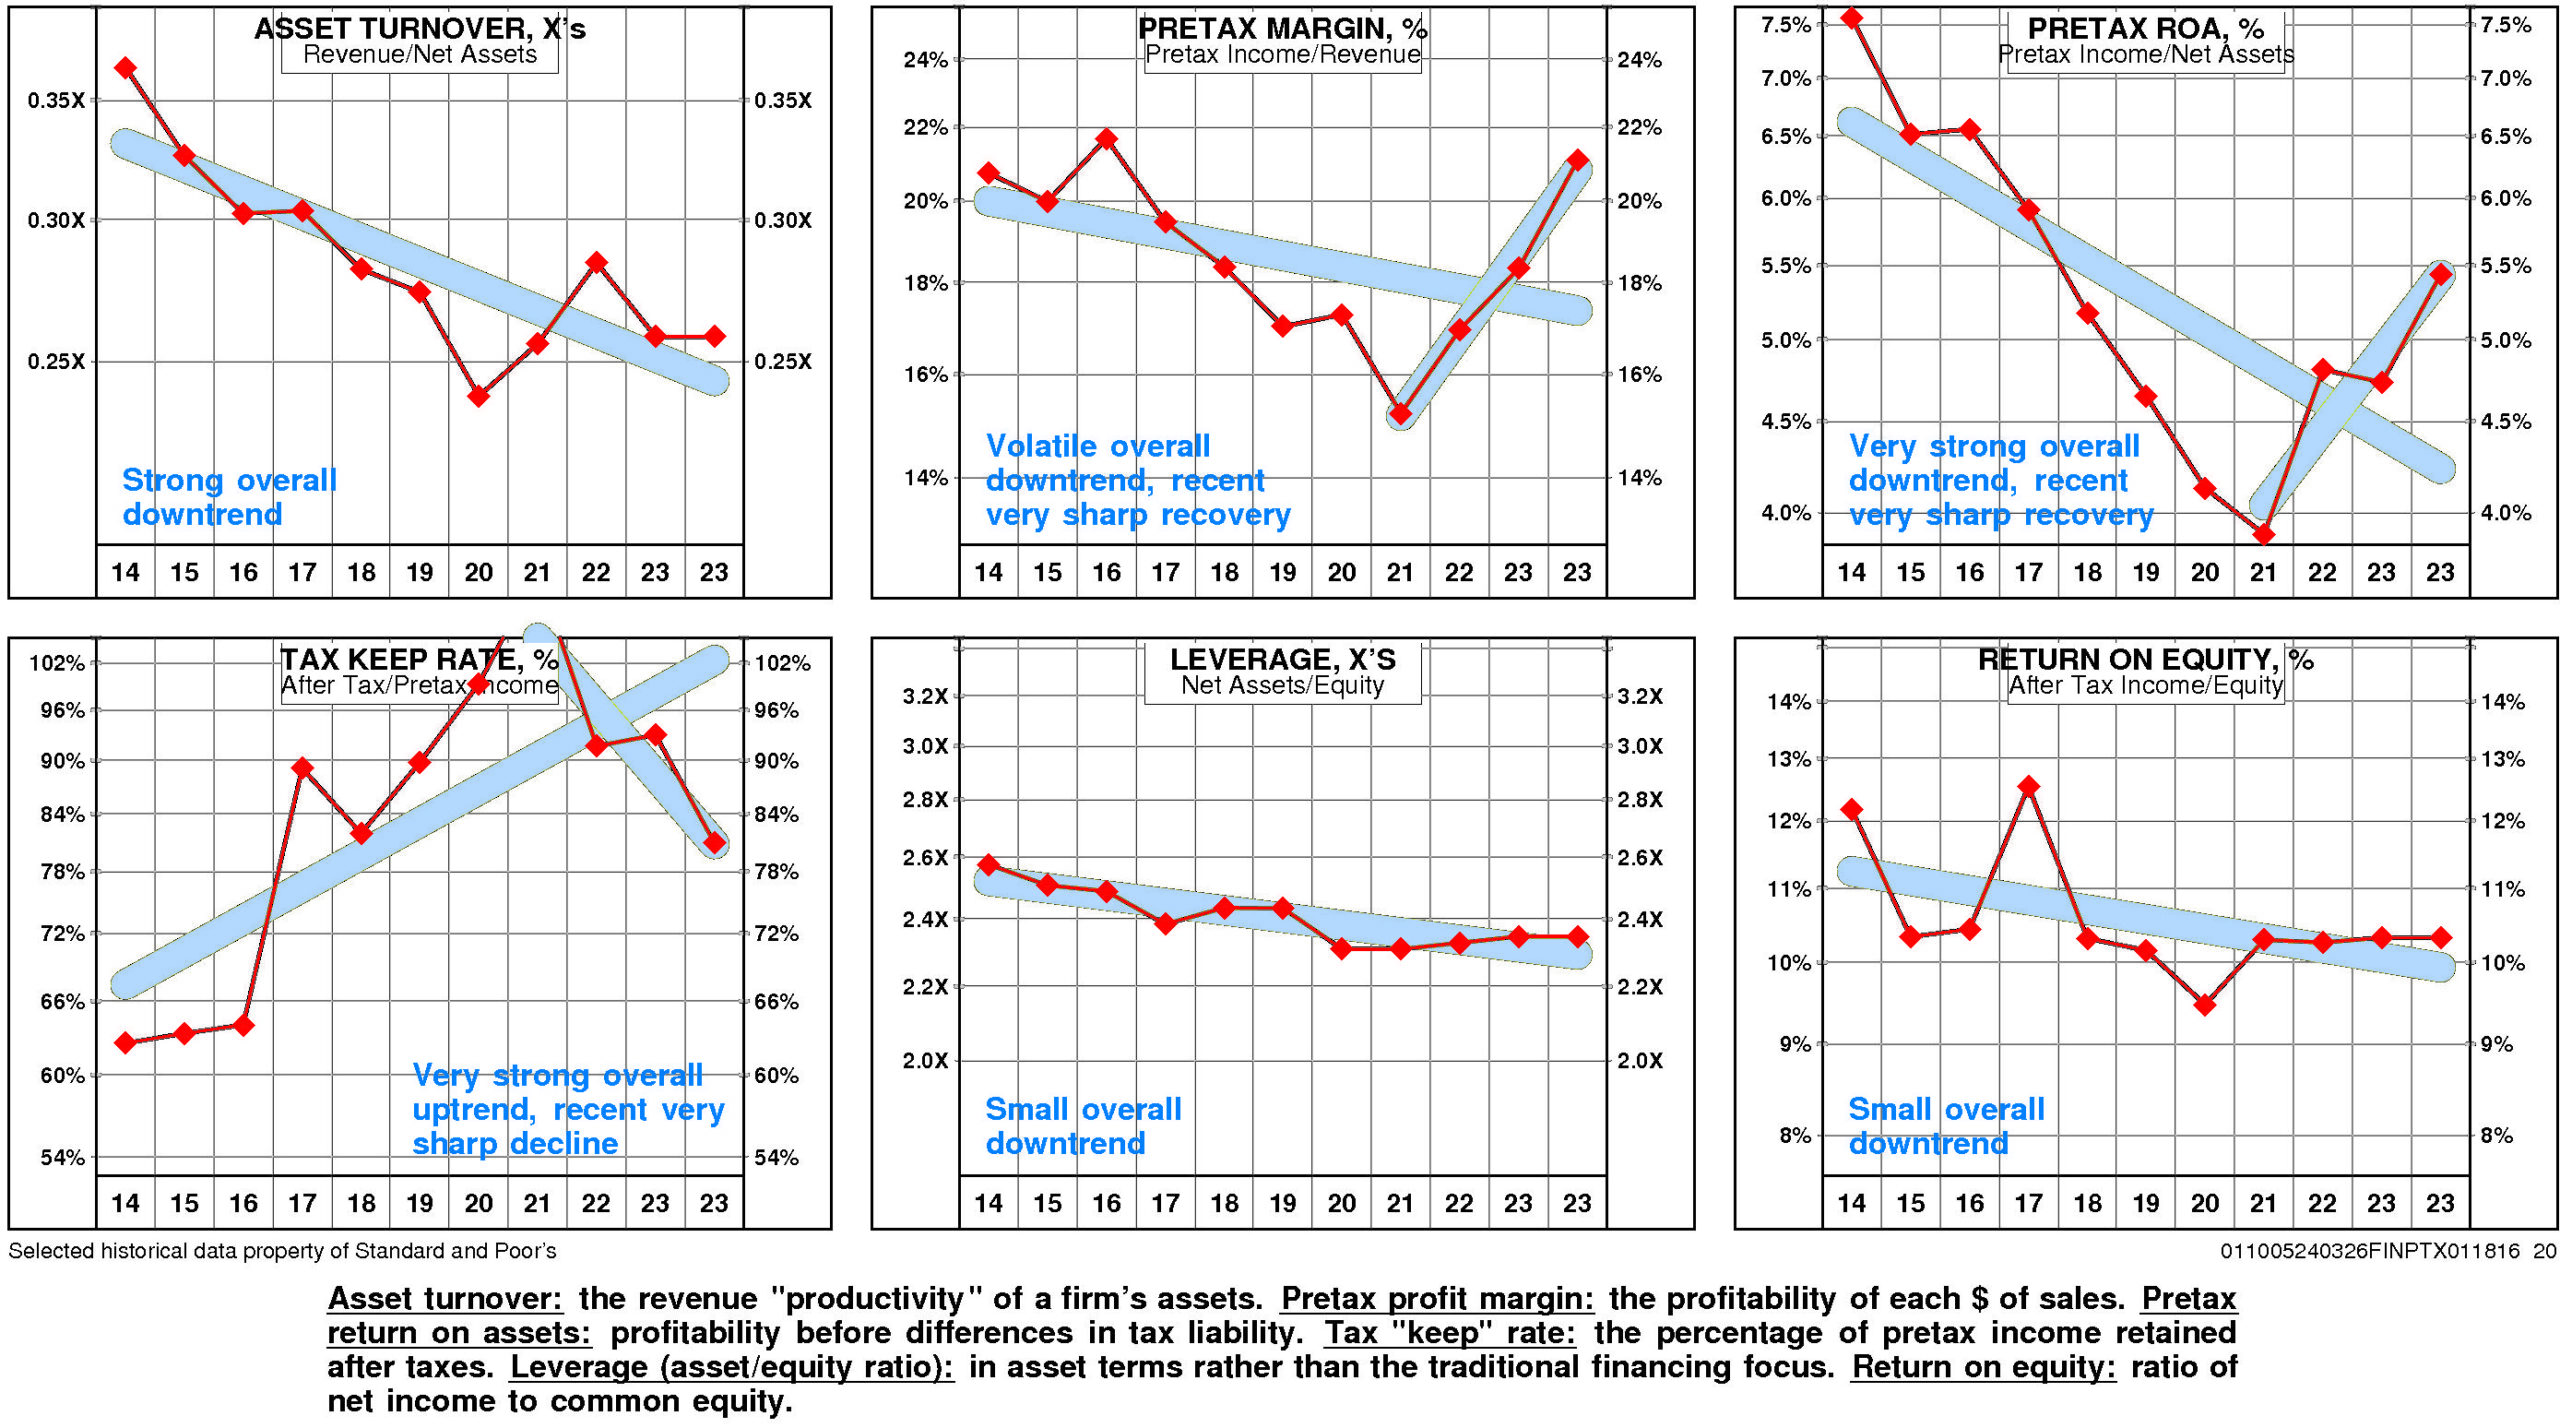
MGE Energy’s return on equity has eroded slightly since 2014. The current level of 10.3% is 1.09X the low for the period and is -15.2% from the high.
This slight erosion was due to very strong negative trend in pretax operating return offset by strong positive trend in non-operating factors.
The productivity of MGE Energy’s assets declined over the full period 2014-2023: asset turnover has suffered a strong overall downtrend.
Reinforcing this trend, pretax margin has experienced a downtrend but it experienced a very sharp recovery after the 2021 low.
Non-operating factors (income taxes and financial leverage) had a significant positive influence on return on equity.
MGE Energy’s return on equity is above median (10.3%) for the four quarters ended December, 2023.
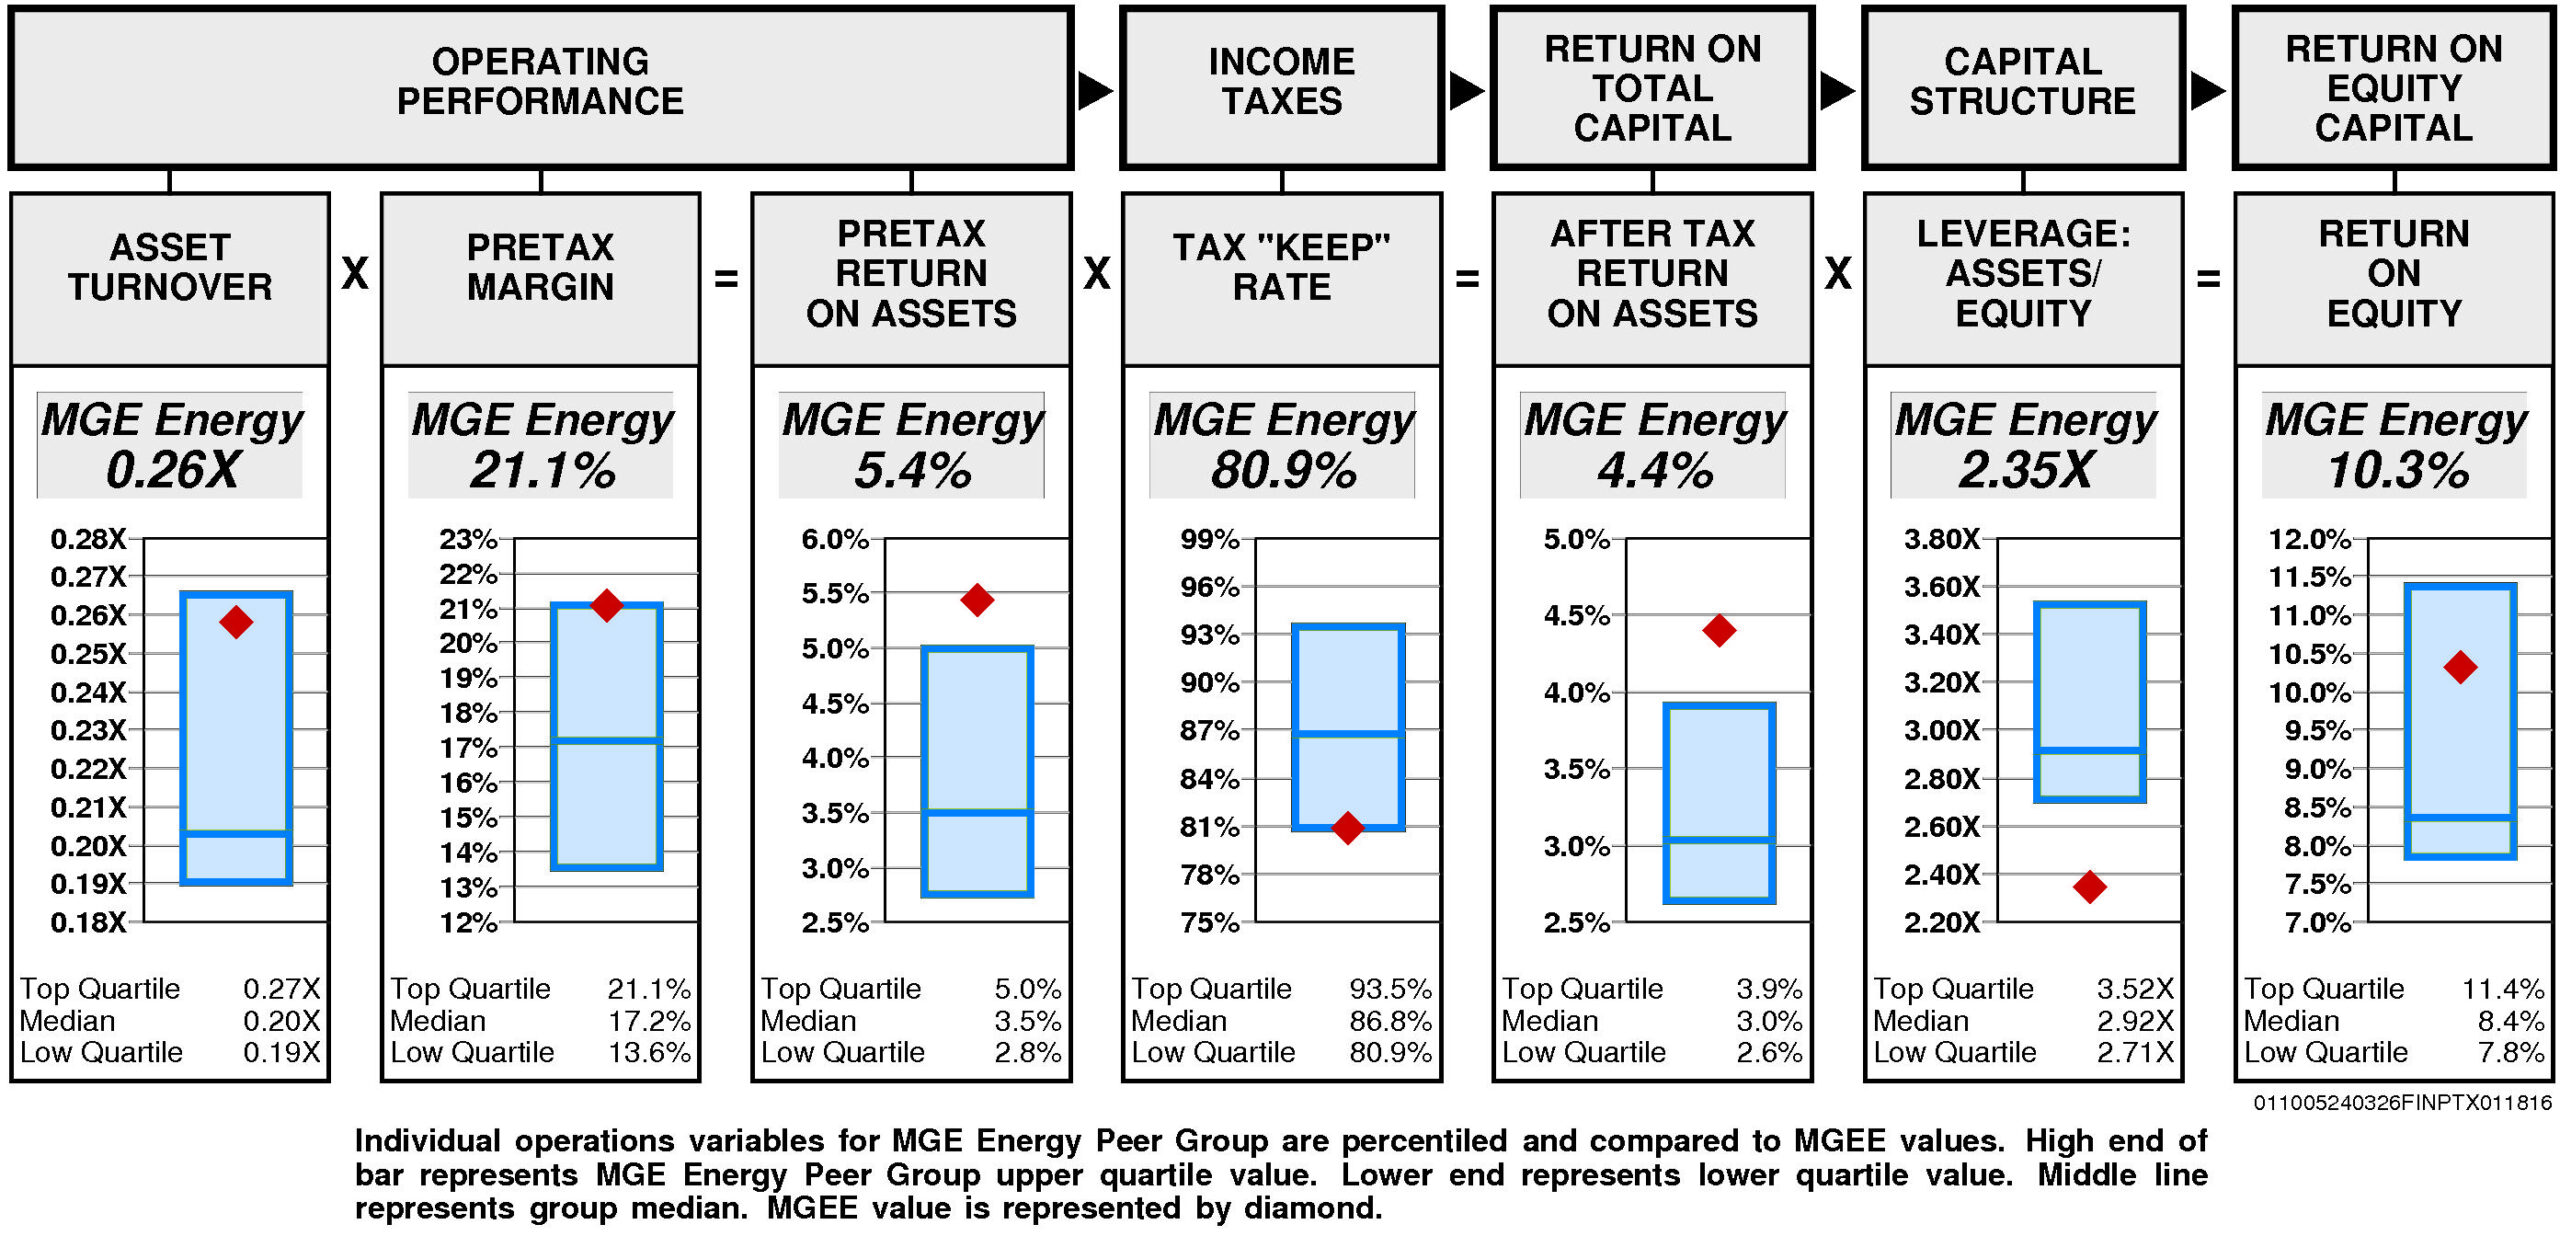
Operating performance (pretax return on assets) is upper quartile (5.4%) reflecting asset turnover that is substantially above median (0.26X) and pretax margin at the upper quartile (21.1%).
Tax “keep” rate (income tax management) is at the lower quartile (80.9%) resulting in after tax return on assets that is upper quartile.
Financial leverage (leverage) is lower quartile (2.35X).
GROWTH RATES
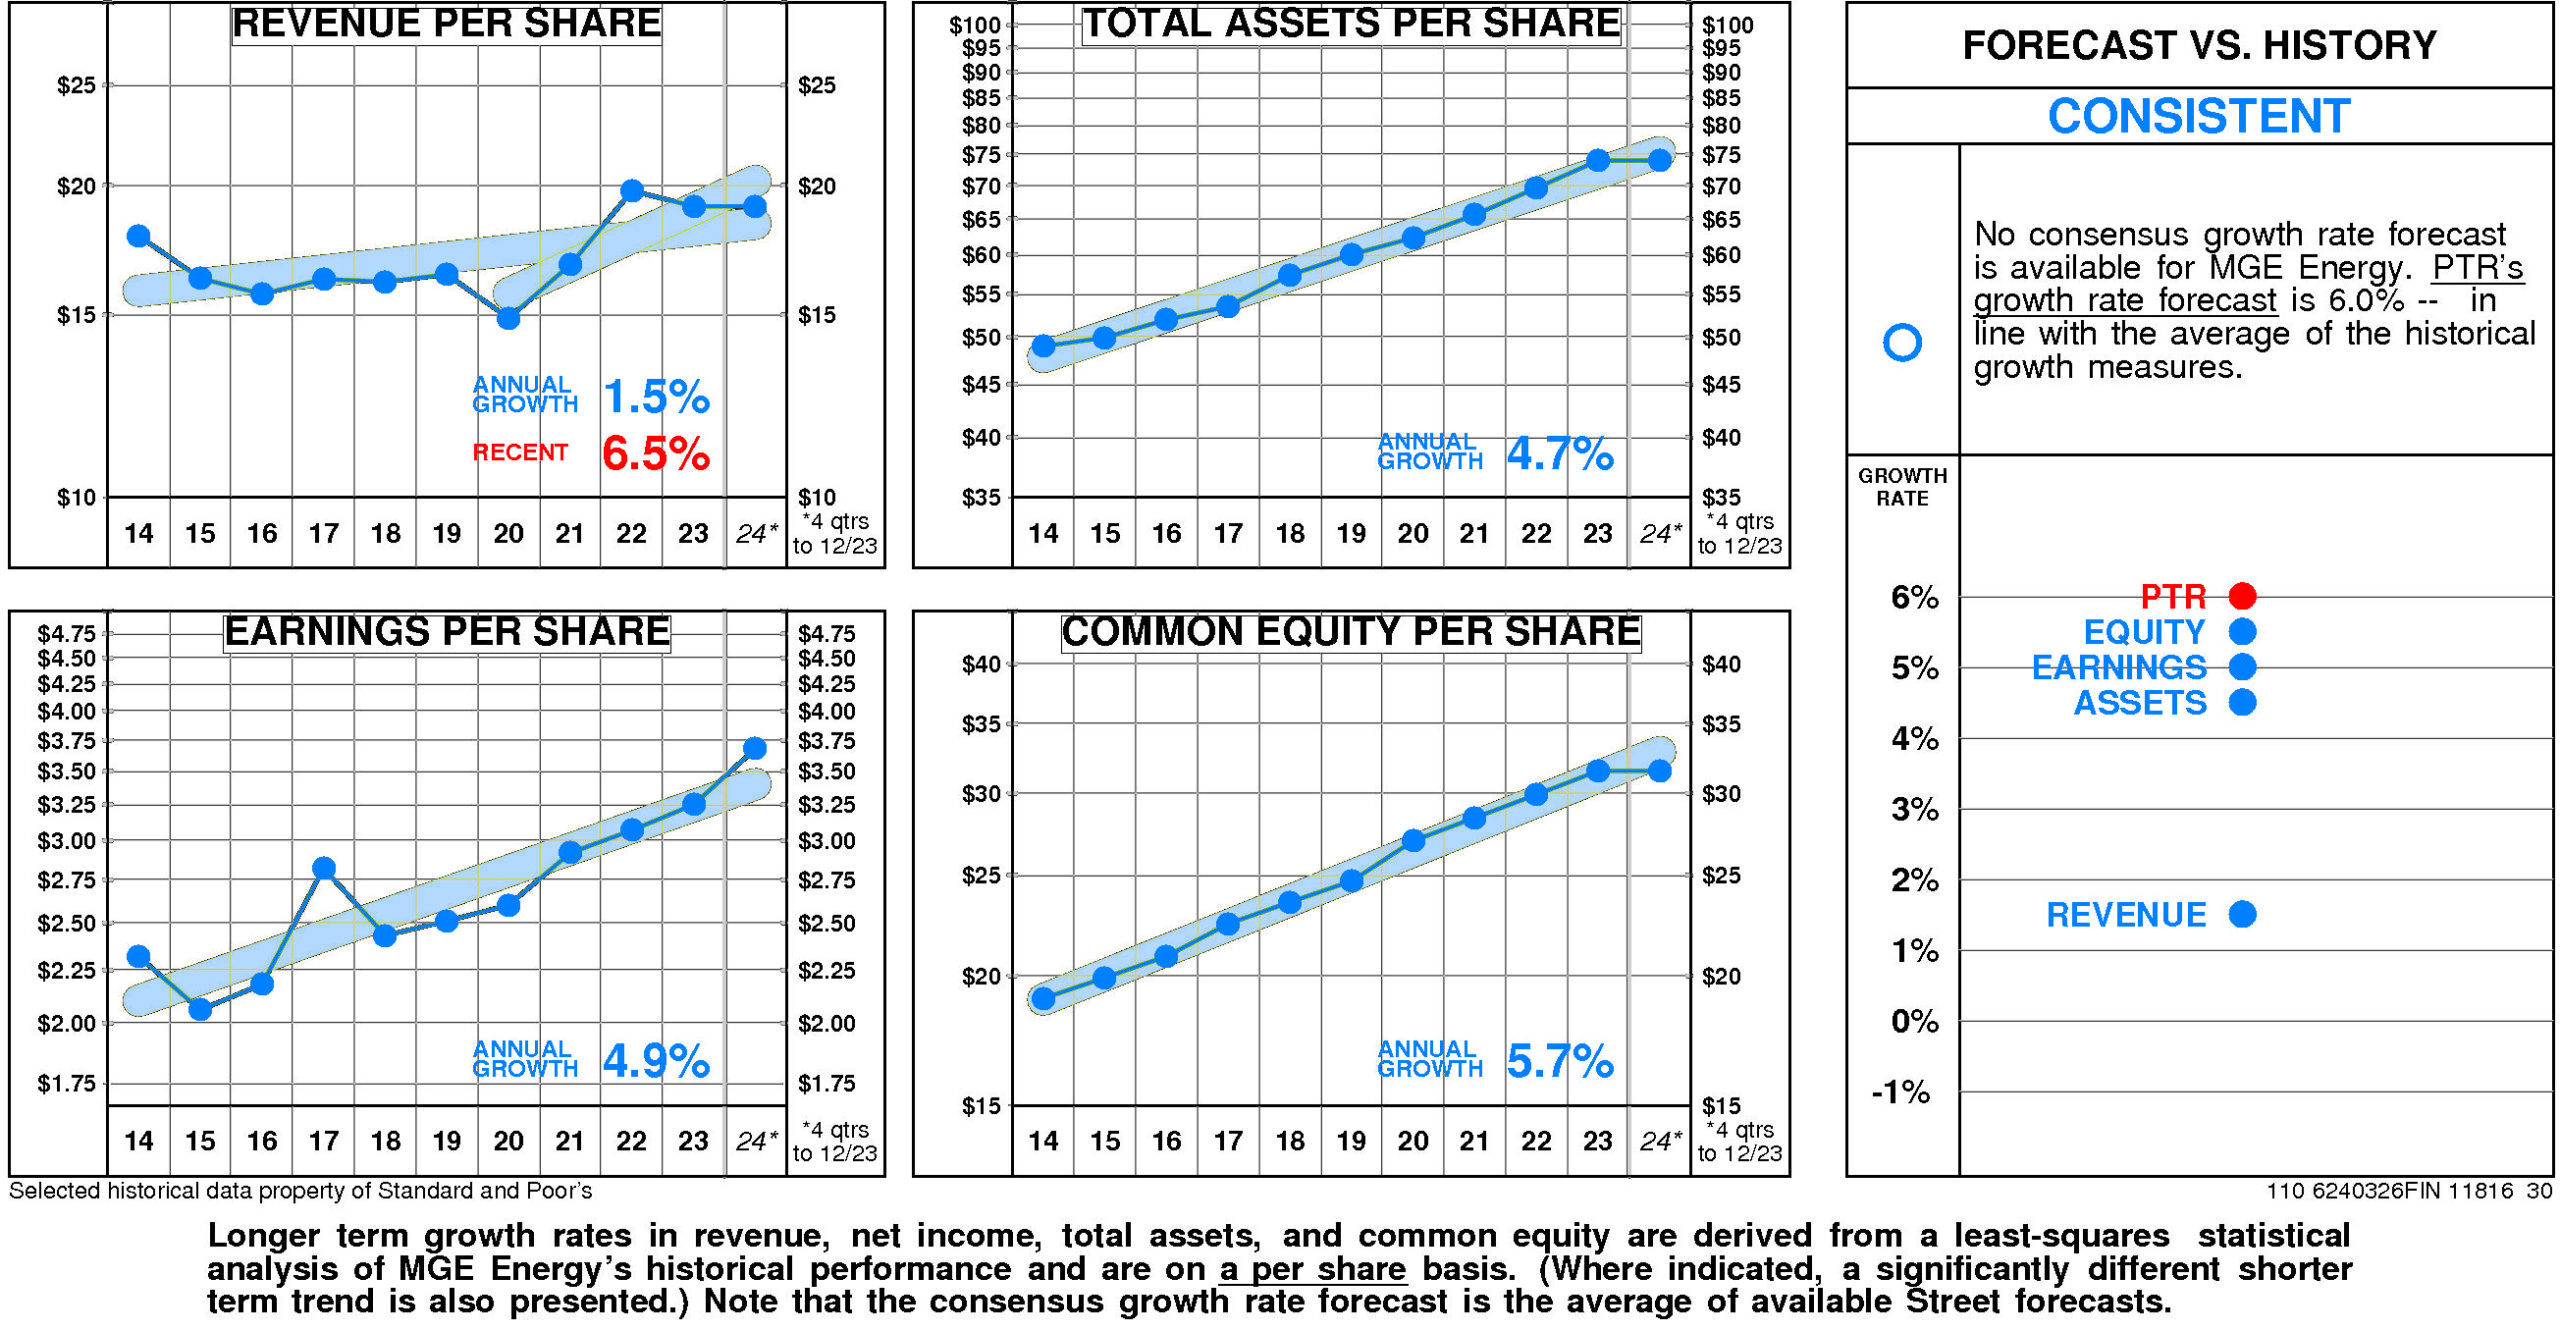
There are no significant differences between MGE Energy’s longer term growth and growth in recent years.
MGE Energy’s historical income statement growth has been in line with balance sheet growth. Revenue growth has paralleled asset growth; earnings growth has paralleled equity growth.
Annual revenue growth has been 1.5% per year. (More recently it has been 6.5%.)
Total asset growth has been 4.7% per year.
Annual E.P.S. growth has been 4.9% per year.
Equity growth has been 5.7% per year.
No consensus growth rate forecast is available for MGE Energy.
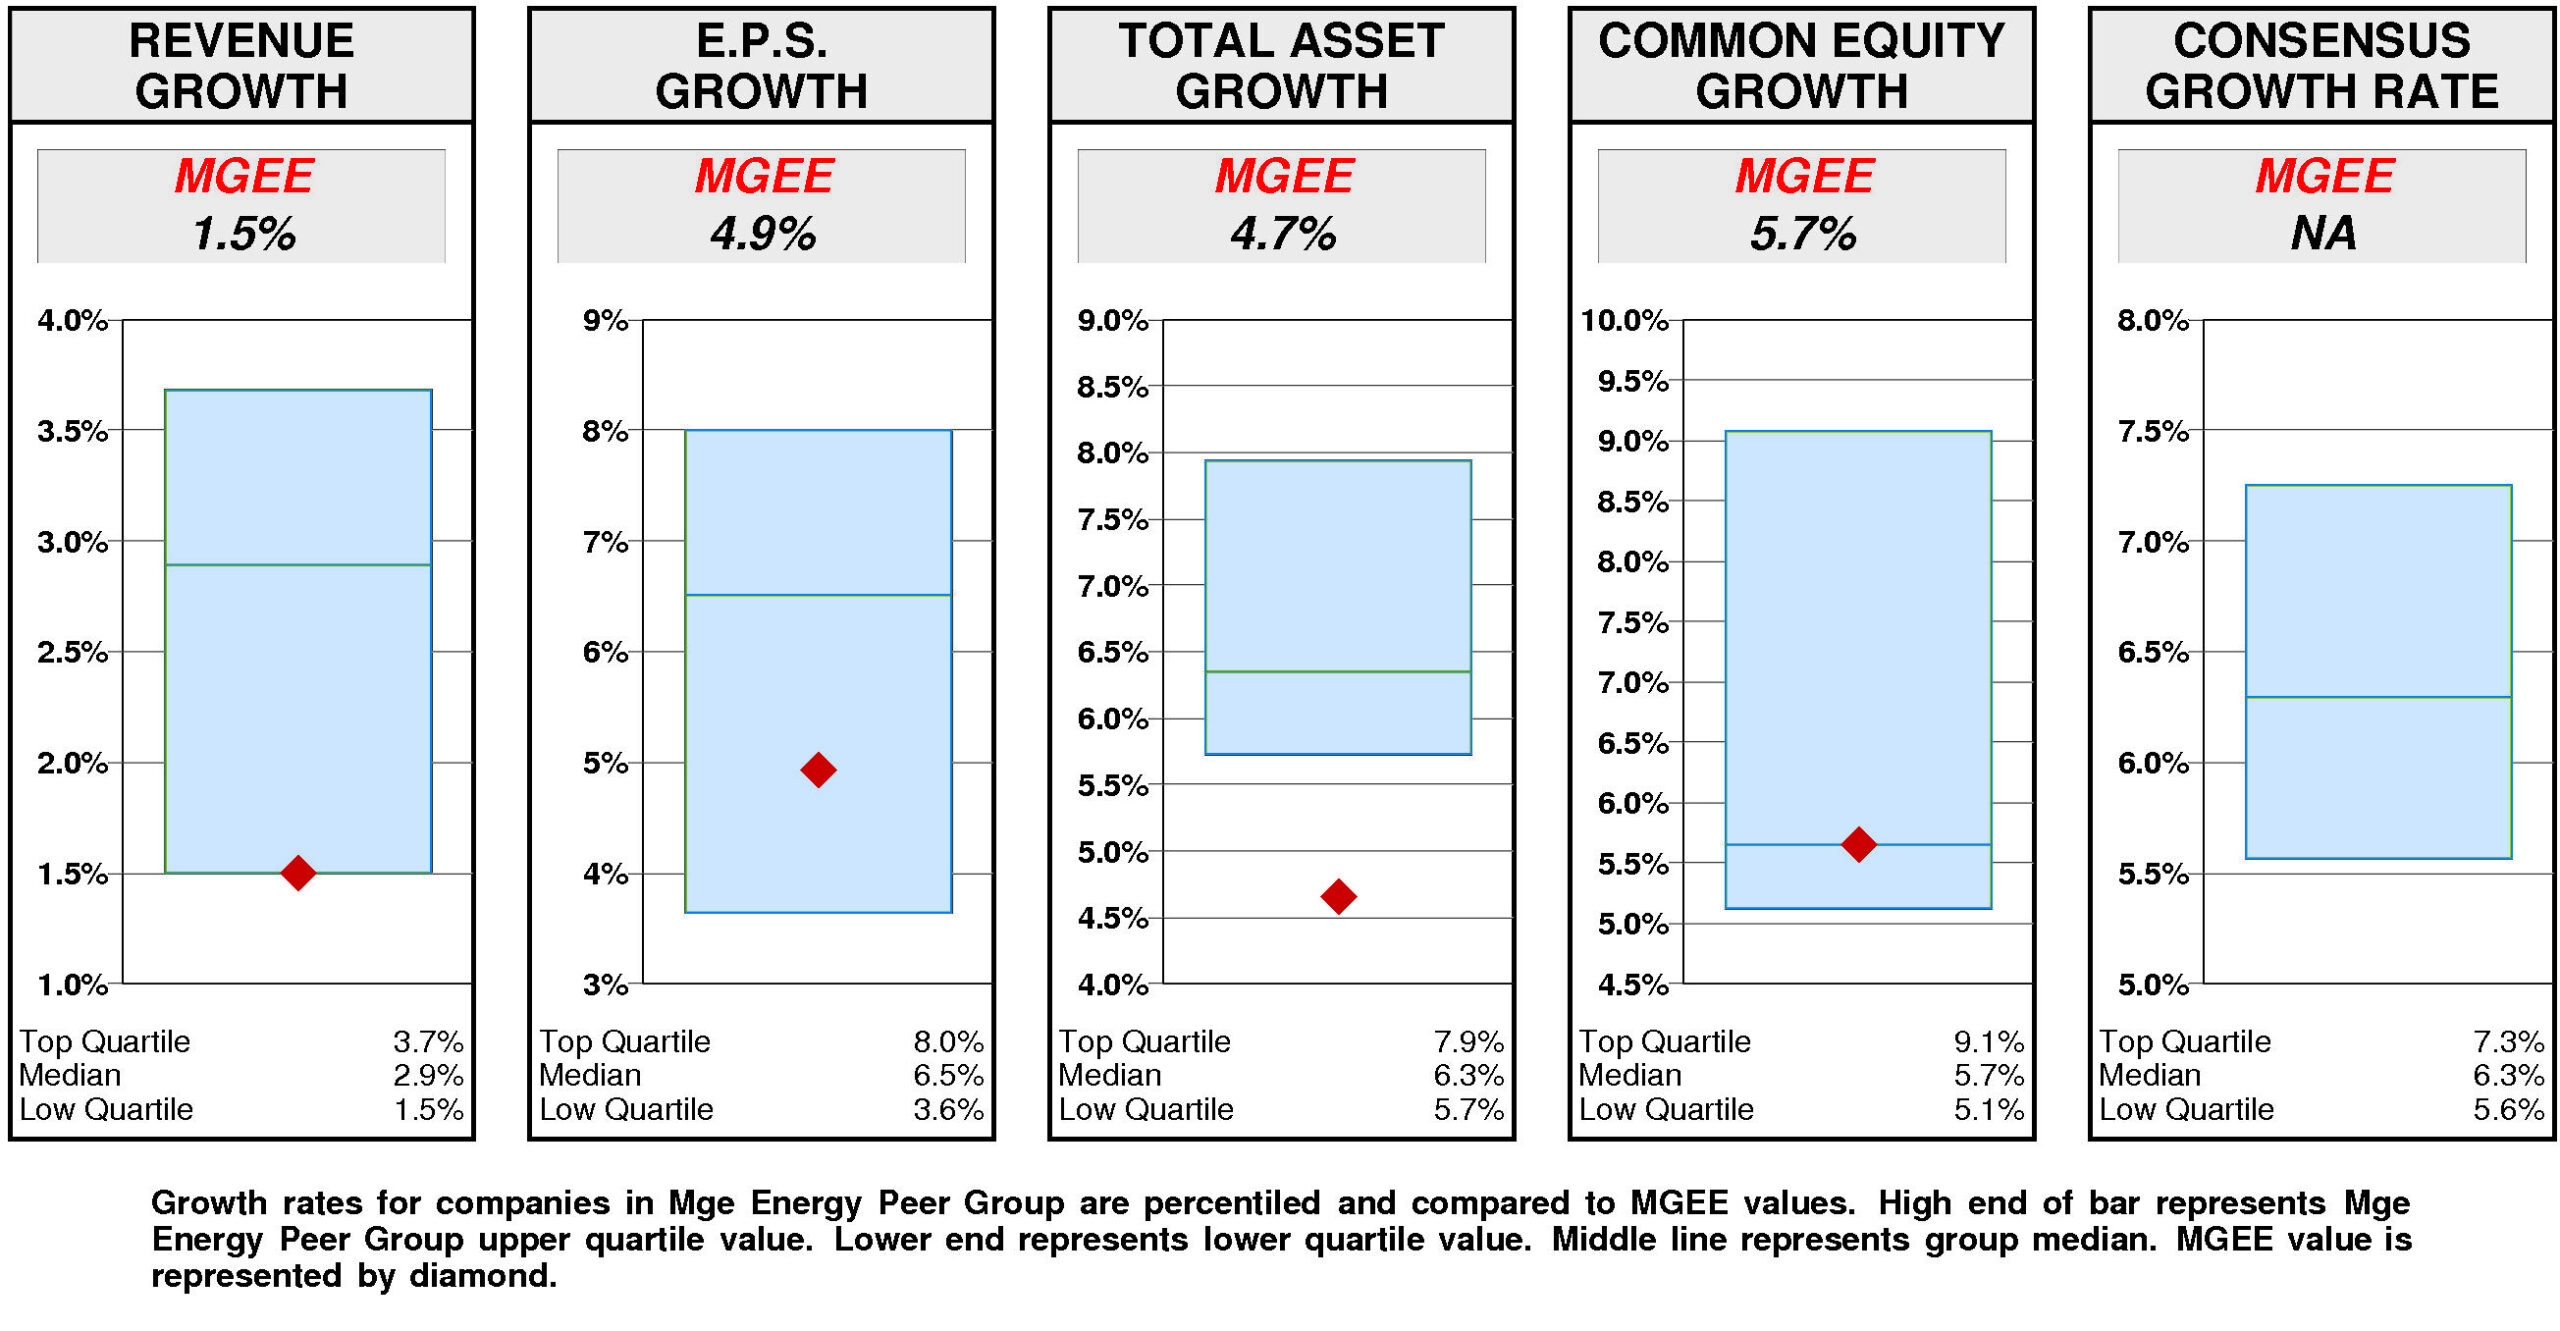
Relative to the Mge Energy Peer Group, MGE Energy’s historical growth measures are erratic. Equity growth (5.7%) has been at median. E.P.S. growth (4.9%) has been below median. Revenue growth (1.5%) has been at the lower quartile. Total asset growth (4.7%) has been lower quartile.
Consensus growth forecast is unavailable.
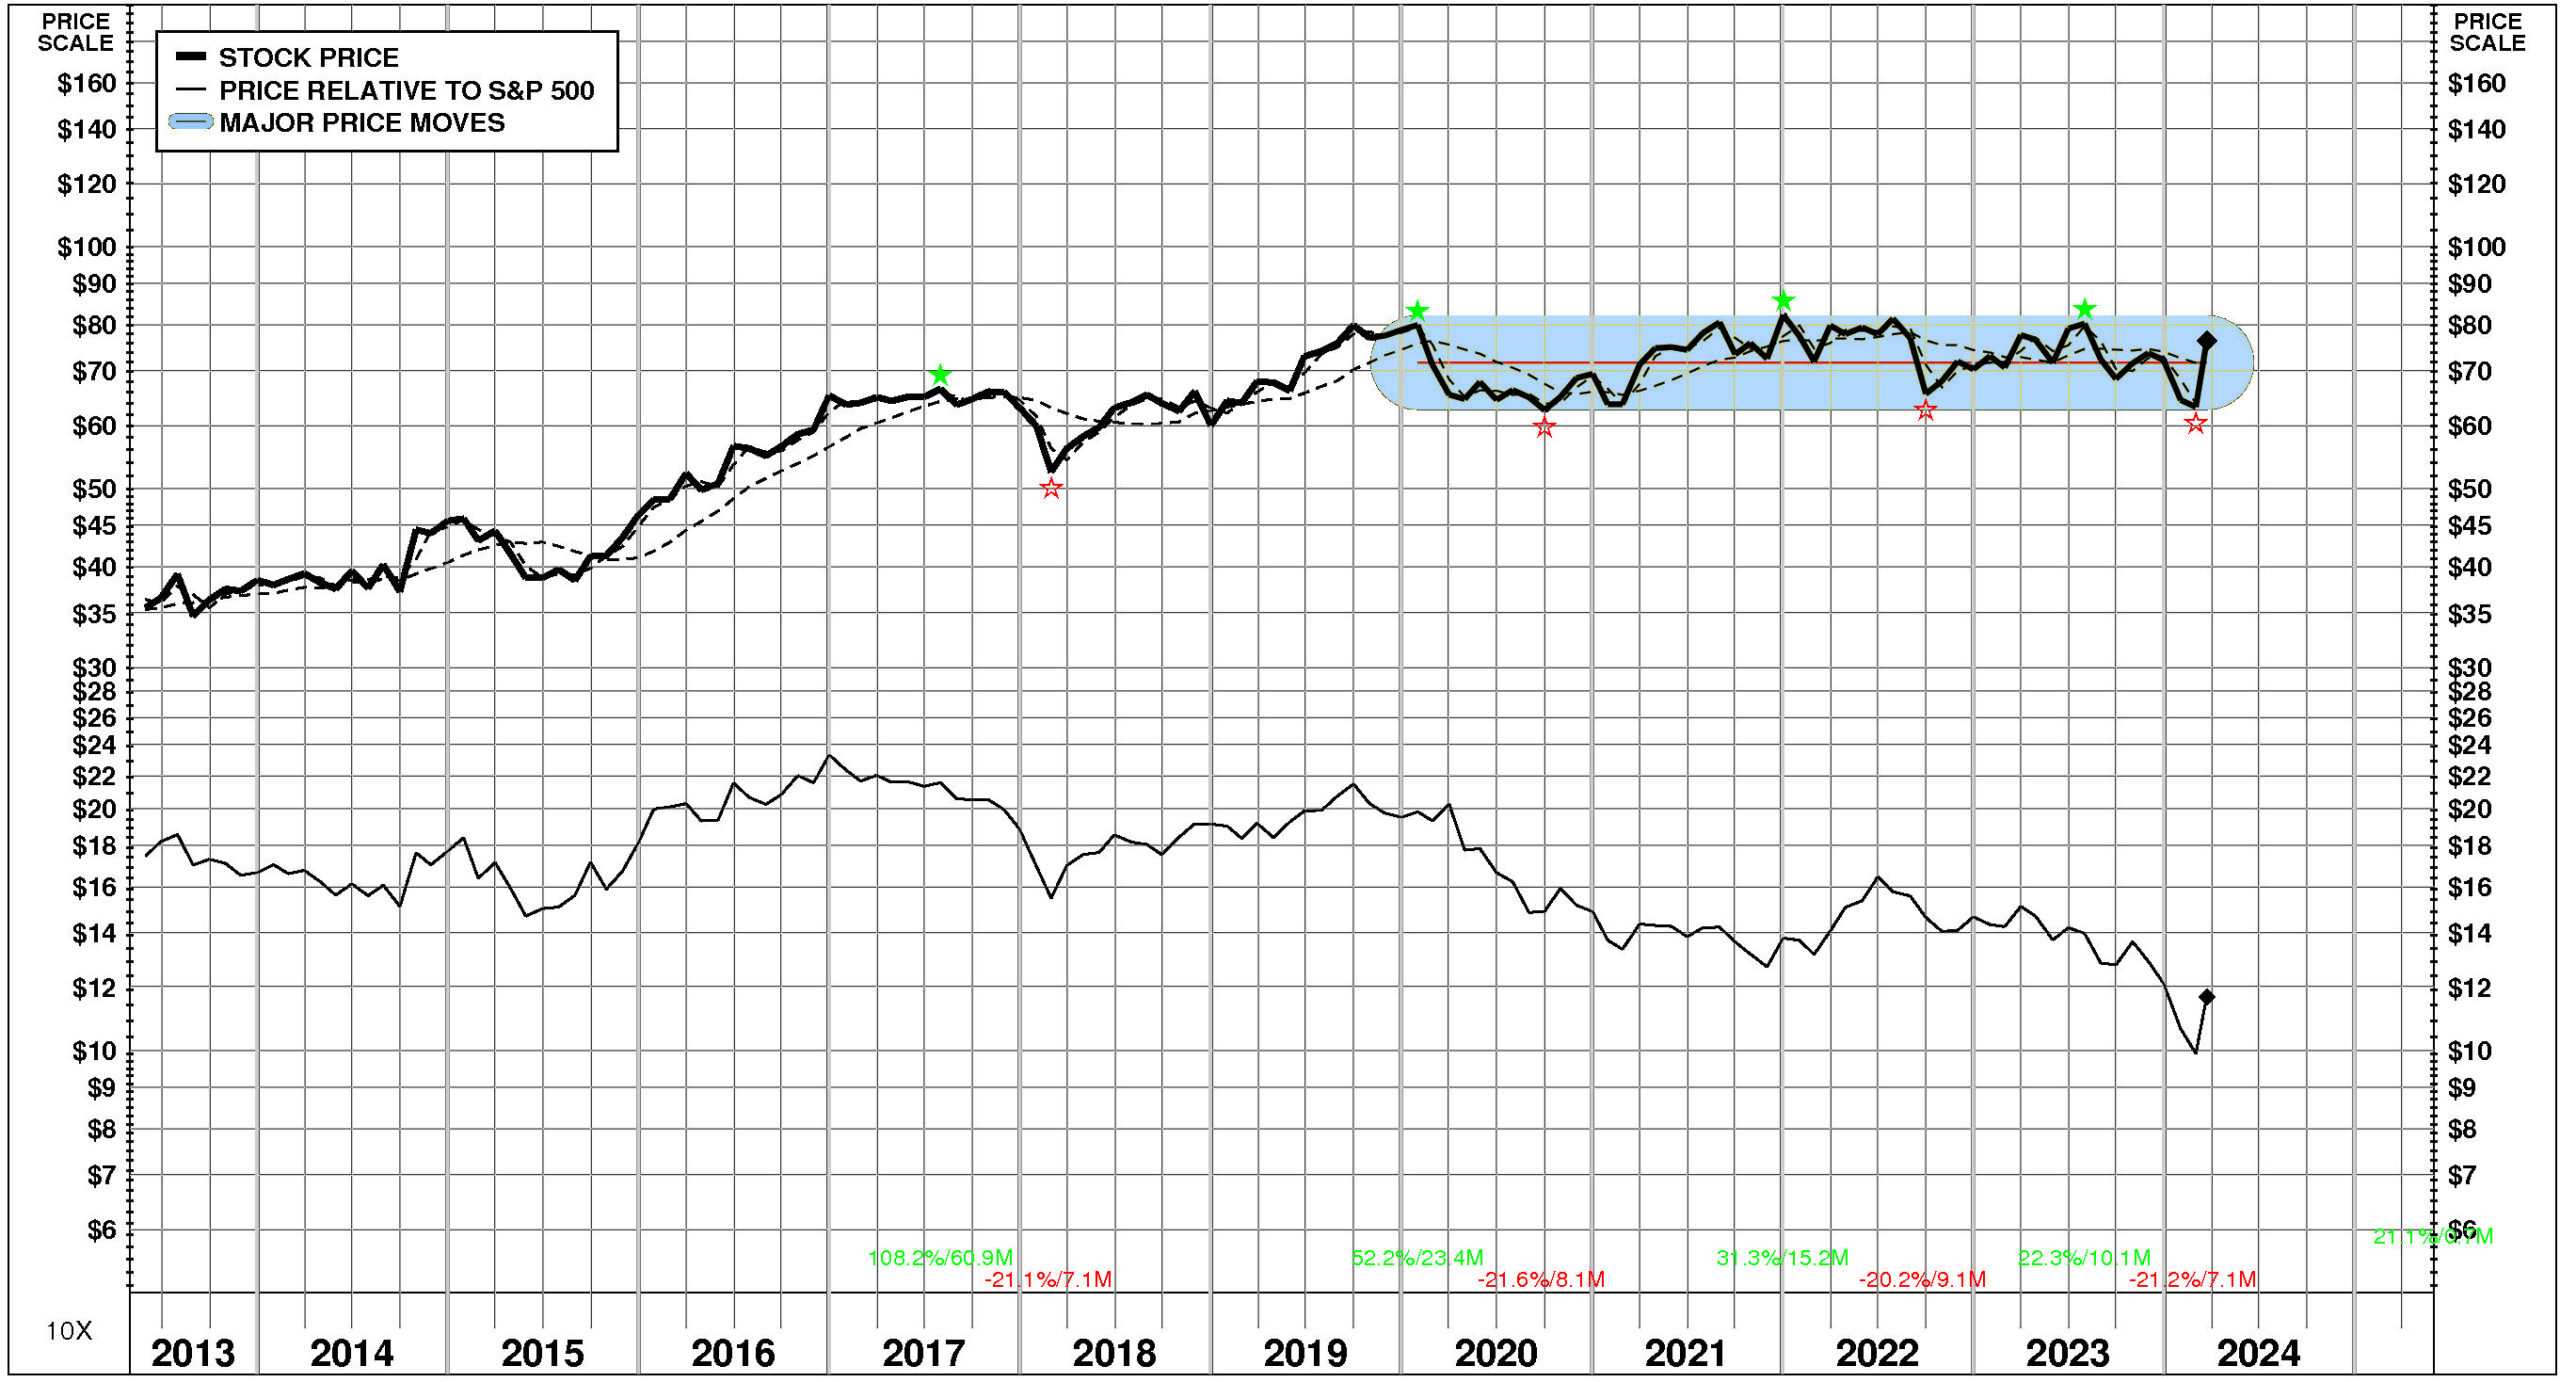
PRICE HISTORY
Over the full time period, MGE Energy’s stock price performance has been below market. Between May, 2013 and March, 2024, MGE Energy’s stock price rose +115%; relative to the market, this was a -33% loss.
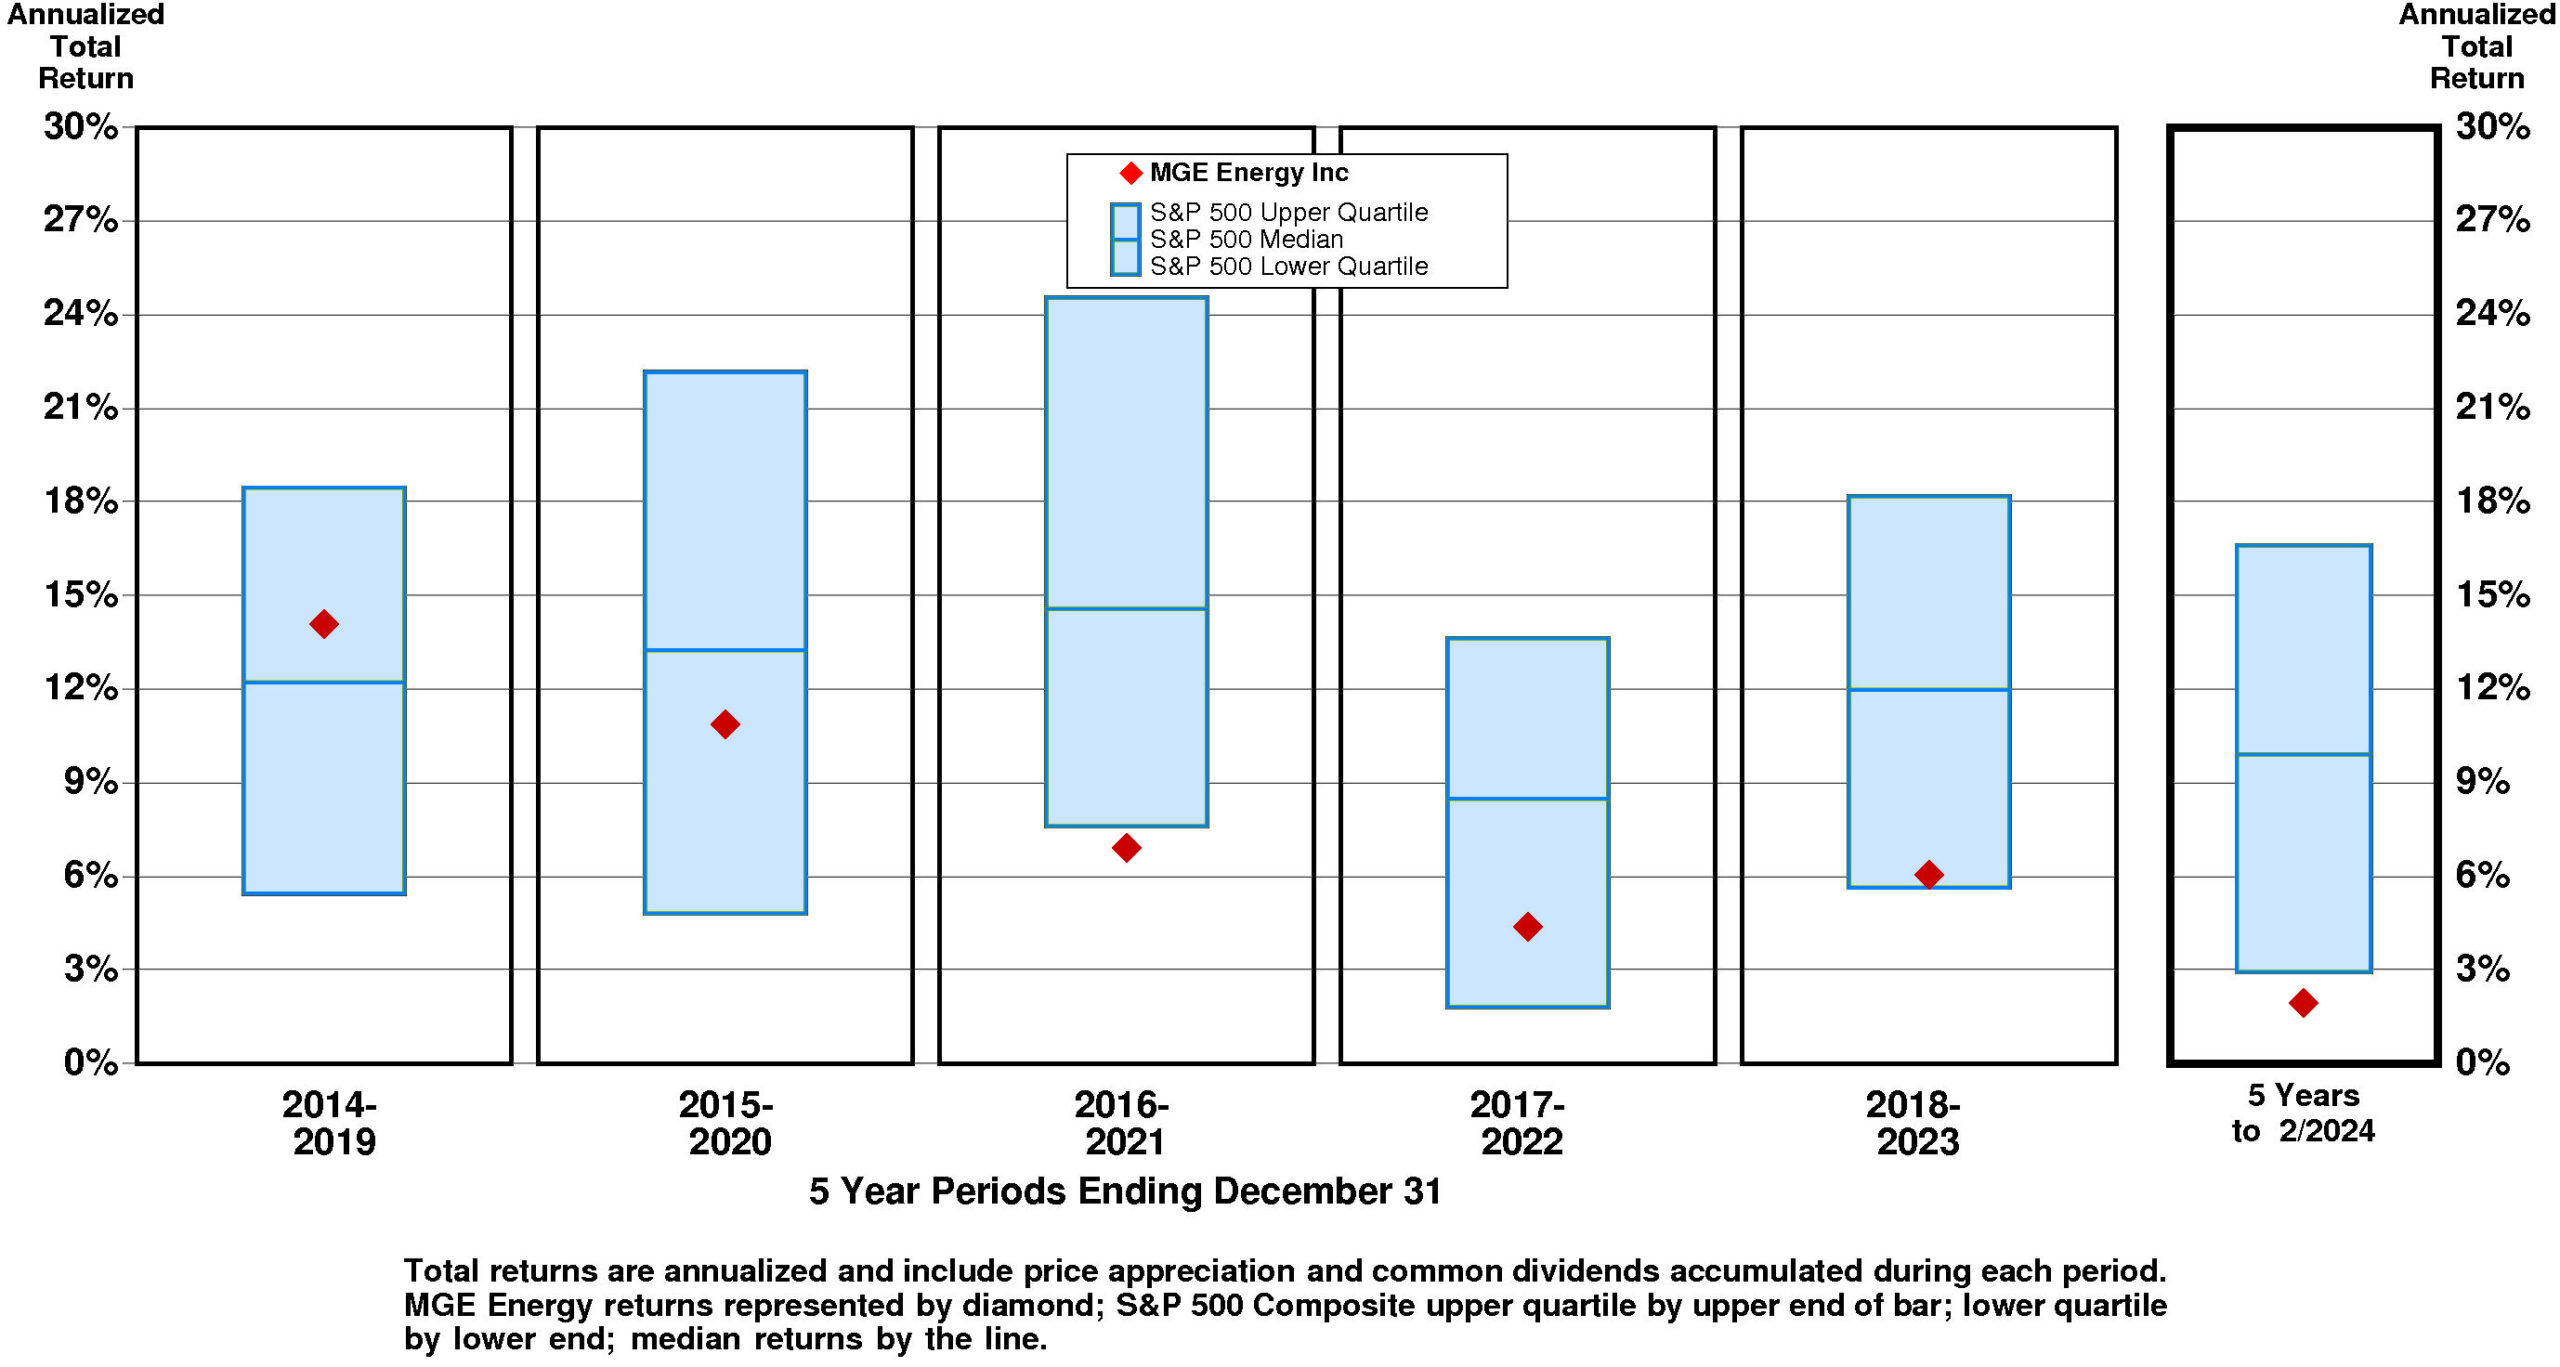
TOTAL INVESTMENT RETURNS
Current annual total return performance of -8.6% is lower quartile relative to the S&P 500 Composite.
In addition to being lower quartile relative to S&P 500 Composite, current annual total return performance through February, 2024 of -8.6% is substantially above median relative to MGE Energy Inc Peer Group.
Current 5-year total return performance of 1.9% is lower quartile relative to the S&P 500 Composite.
Through February, 2024, with lower quartile current 5-year total return of 1.9% relative to S&P 500 Composite, MGE Energy’s total return performance is above median relative to MGE Energy Inc Peer Group.
VALUATION BENCHMARKS
Relative to S&P 500 Composite, MGEE’s overall valuation is normal. The highest factor, the ratio of enterprise value/revenue, is above median. Ratio of enterprise value/earnings before interest and taxes is at median. Price/earnings ratio is slightly below median. Ratio of enterprise value/assets is below median. The lowest factor, the price/equity ratio, is below median.
Relative to MGE Energy Peer Group, MGEE’s overall valuation is high. The highest factor, the price/equity ratio, is at the upper quartile. Ratio of enterprise value/assets is upper quartile. Price/earnings ratio is above median. Ratio of enterprise value/earnings before interest and taxes is at median. The lowest factor, the ratio of enterprise value/revenue, is at median.
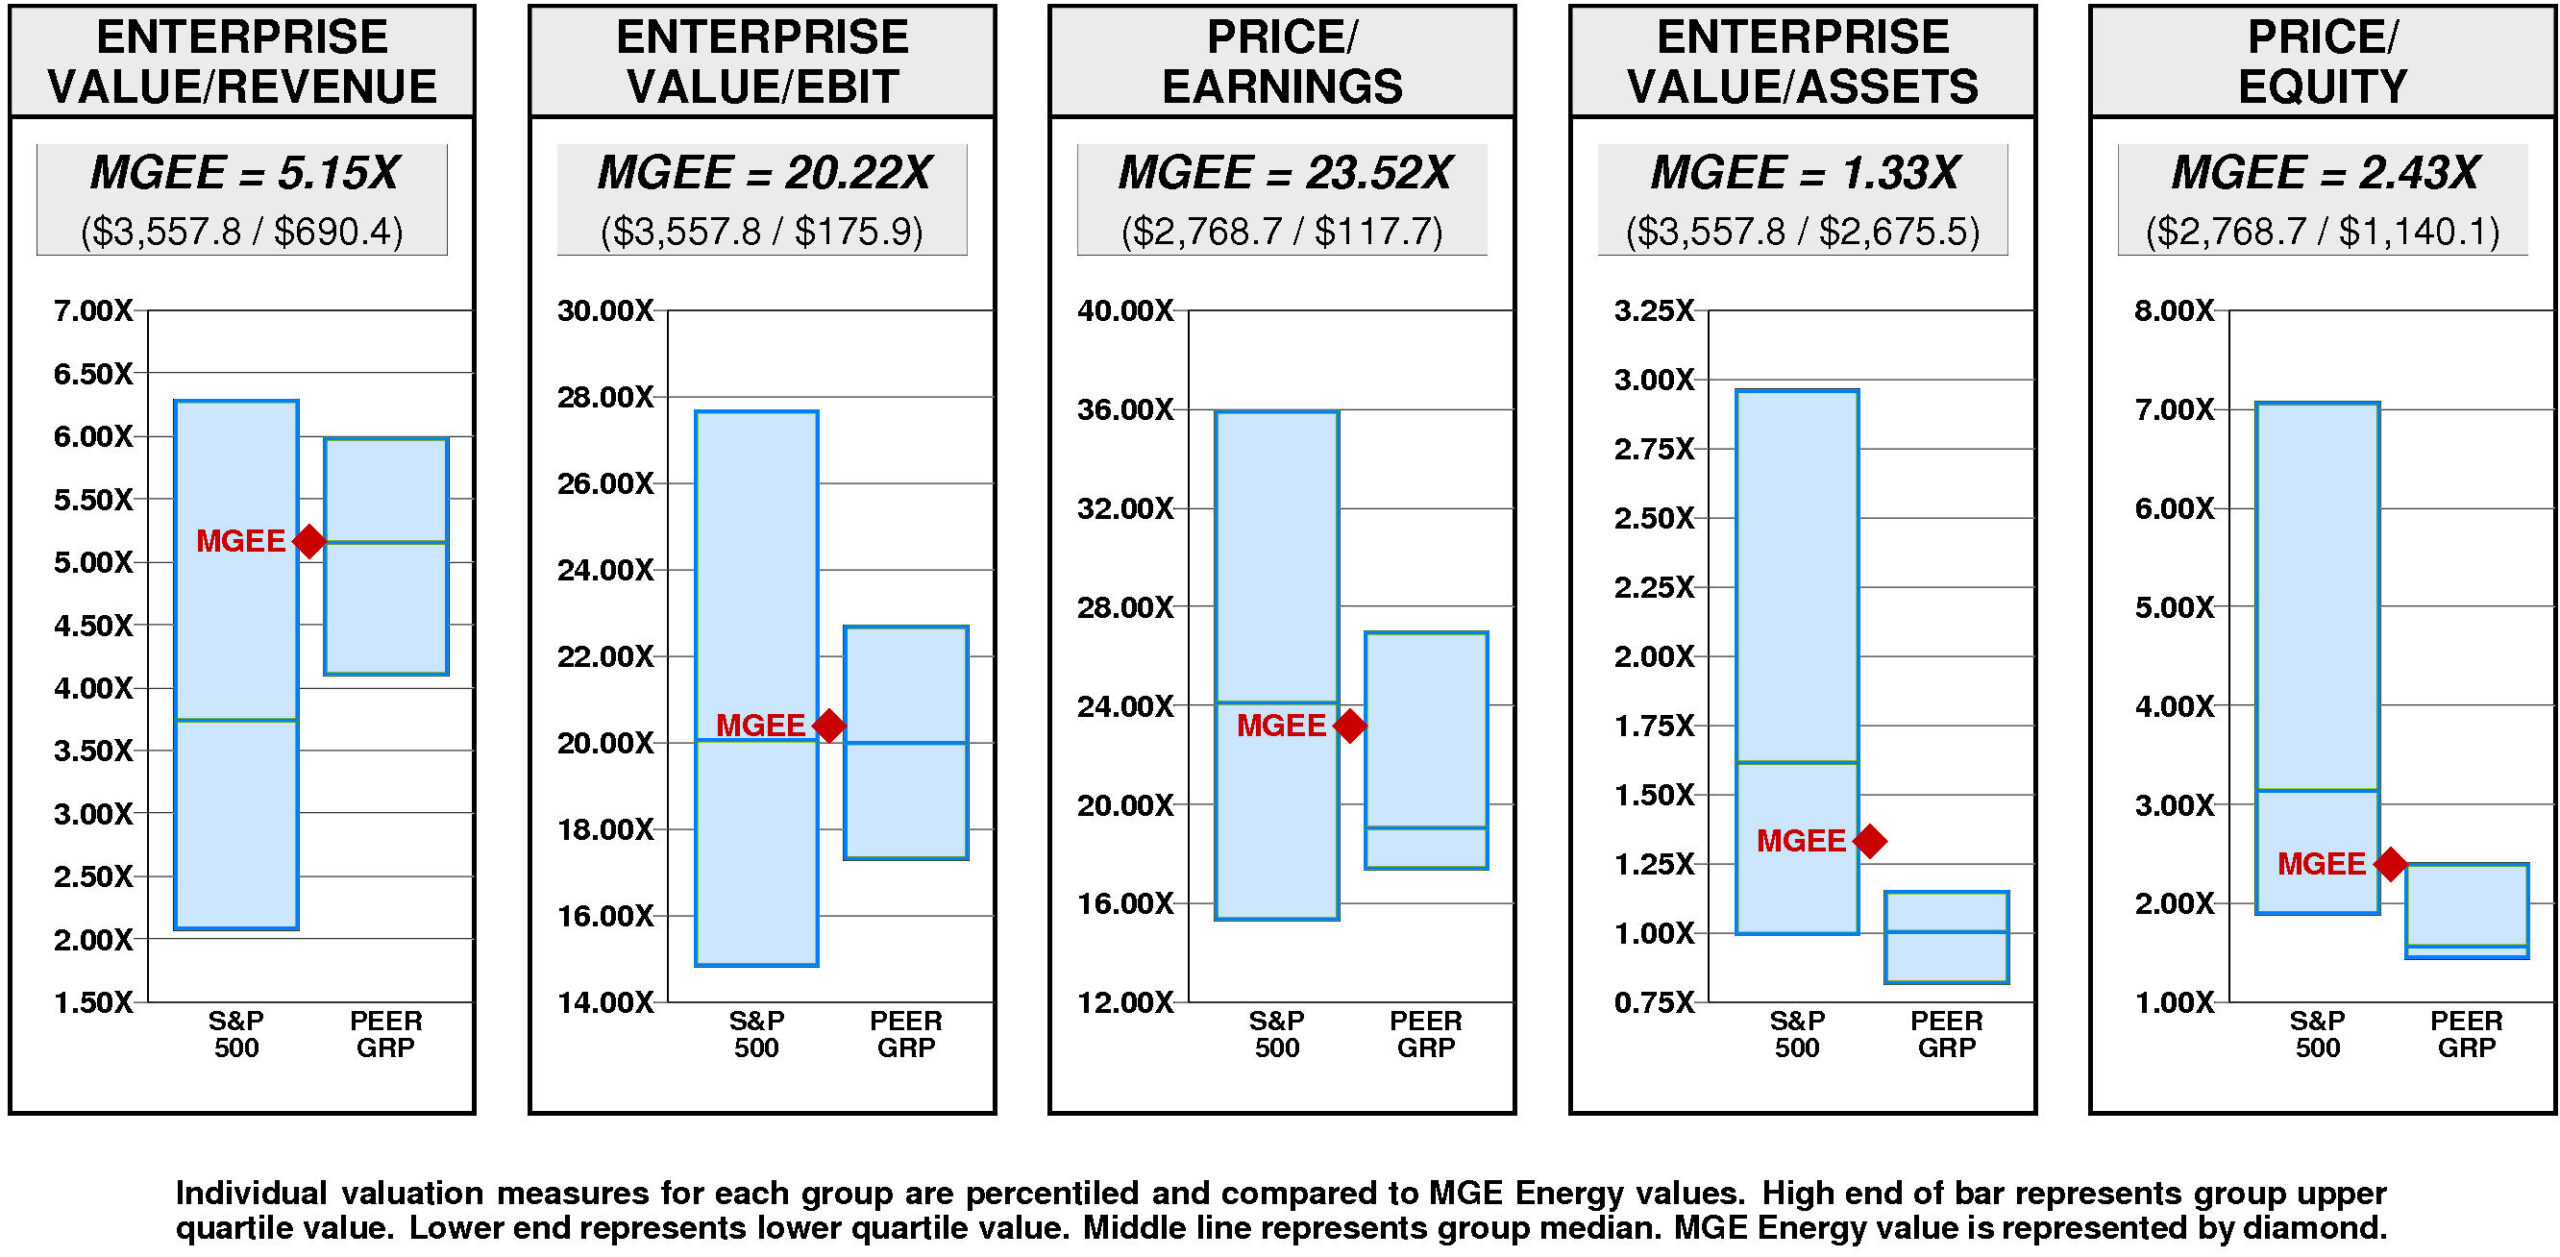
MGE Energy has a very large value gap compared to median valuation. For MGEE to fall to lower quartile valuation, its current ratio of enterprise value/revenue would have to decline from the current level of 5.15X to 4.11X. If MGEE’s ratio of enterprise value/revenue were to decline to 4.11X, its stock price would be lower by $-20 to $57.
For MGEE to achieve upper quartile valuation relative to the MGE Energy Peer Group, its current ratio of enterprise value/revenue would have to rise from the current level of 5.15X to 5.98X. If MGEE’s ratio of enterprise value/revenue were to rise to 5.98X, its stock price would increase by $16 from the current level of $77.
VALUE TARGETS
MGEE is expected to continue to be a Value Builder reflecting capital returns that are forecasted to be above the cost of capital.
MGE Energy’s current Price Target of $79 is little changed from the current price of $76.55.
This moderately low appreciation potential results in an appreciation score of 37 (63% of the universe has greater appreciation potential.)
Reinforcing this moderately low Appreciation Score of 37, the neutral Power Rating of 41 contributes to an Value Trend Rating of D.
MGE Energy’s current Price Target is $79 (+4% from the 2023 Target of $75 and +3% from the 03/21/24 price of $76.55). This plateau in the Target is the result of a +2% increase in the equity base and a +2% increase in the price/equity multiple. The forecasted increase in cost of equity has a very large negative impact on the price/equity multiple and the forecasted decline in growth has a large negative impact as well. More than offsetting these Drivers, the forecasted increase in return on equity has a very large positive impact.
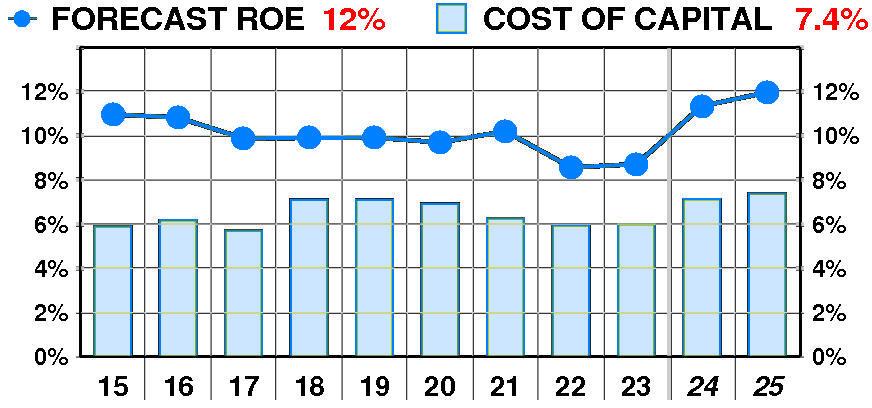
PTR’s return on equity forecast is 12.0% — slightly above our recent forecasts. Forecasted return on equity suffered a dramatic, variable decline between 2015 and 2023. The current forecast is steady at the 2015 peak of 11%.
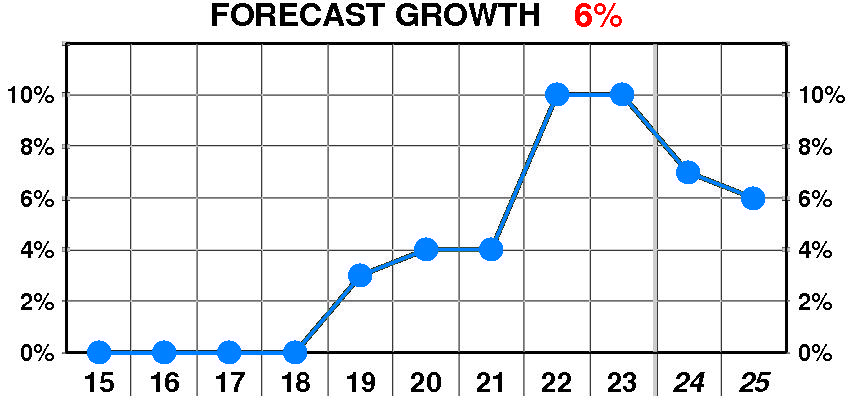
PTR’s growth forecast is 6.0% — slightly below our recent forecasts. Forecasted growth enjoyed a dramatic, steady increase between 2019 and 2023. The current forecast is above the 2019 low of 3%.
PTR’s cost of equity forecast is 7.4% — in line with recent levels. Forecasted cost of equity erratic but little changed between 2015 and 2023. The current forecast is steady at the 2017 low of 5.7%.
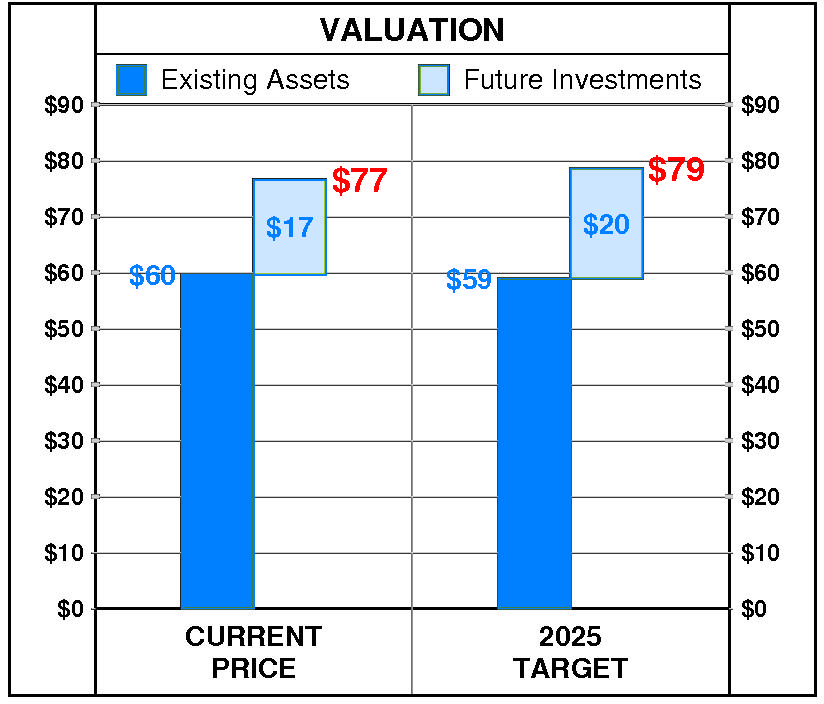
At MGE Energy’s current price of $76.55, investors are placing a positive value of $17 on its future investments. This view is consistent with the company’s most recent performance that reflected a growth rate of 10.0% per year, and a return on equity of 8.7% versus a cost of equity of 6.0%.
PTR’s 2025 Price Target of $79 is based on these forecasts and reflects an estimated value of existing assets of $59 and a value of future investments of $20.
Be the first to comment