![]()
BUSINESS
Catalyst Pharmaceuticals, Inc., a commercial-stage biopharmaceutical company, focuses on developing and commercializing therapies for people with rare debilitating, chronic neuromuscular, and neurological diseases in the United States. It offers Firdapse, an amifampridine phosphate tablets for the treatment of patients with lambert-eaton myasthenic syndrome (LEMS); and Ruzurgi for the treatment of pediatric LEMS patients. The company also develops Firdapse for the treatment of MuSK antibody positive myasthenia gravis, and spinal muscular atrophy type 3, as well as to treat hereditary neuropathy with liability to pressure palsies. It has license agreements with BioMarin Pharmaceutical Inc.; and collaboration and license agreement with Endo Ventures Limited for the development and commercialization of generic Sabril tablets.
INVESTMENT RATING
Reflecting future returns on capital that are forecasted to be above the cost of capital, CPRX is expected to continue to be a major Value Builder.
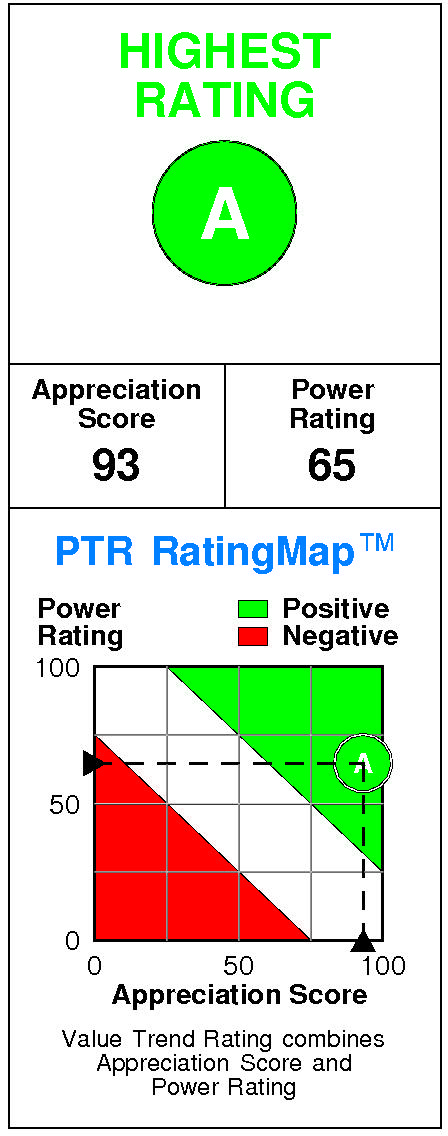
Catalyst Pharmaceutical has a current Value Trend Rating of A (Highest Rating).
With this rating, PTR’s two proprietary measures of a stock’s current attractiveness are providing complementary signals. Catalyst Pharmaceutical has a slightly positive Power Rating of 65 and a very high Appreciation Score of 93, and the Highest Value Trend Rating results.
Catalyst Pharmaceutical’s stock is selling well below targeted value. The current stock price of $16.91 compares to targeted value 12 months forward of $69.
Catalyst Pharmaceutical’s very high appreciation potential results in an appreciation score of 93 (only 7% of the universe has greater appreciation potential.)
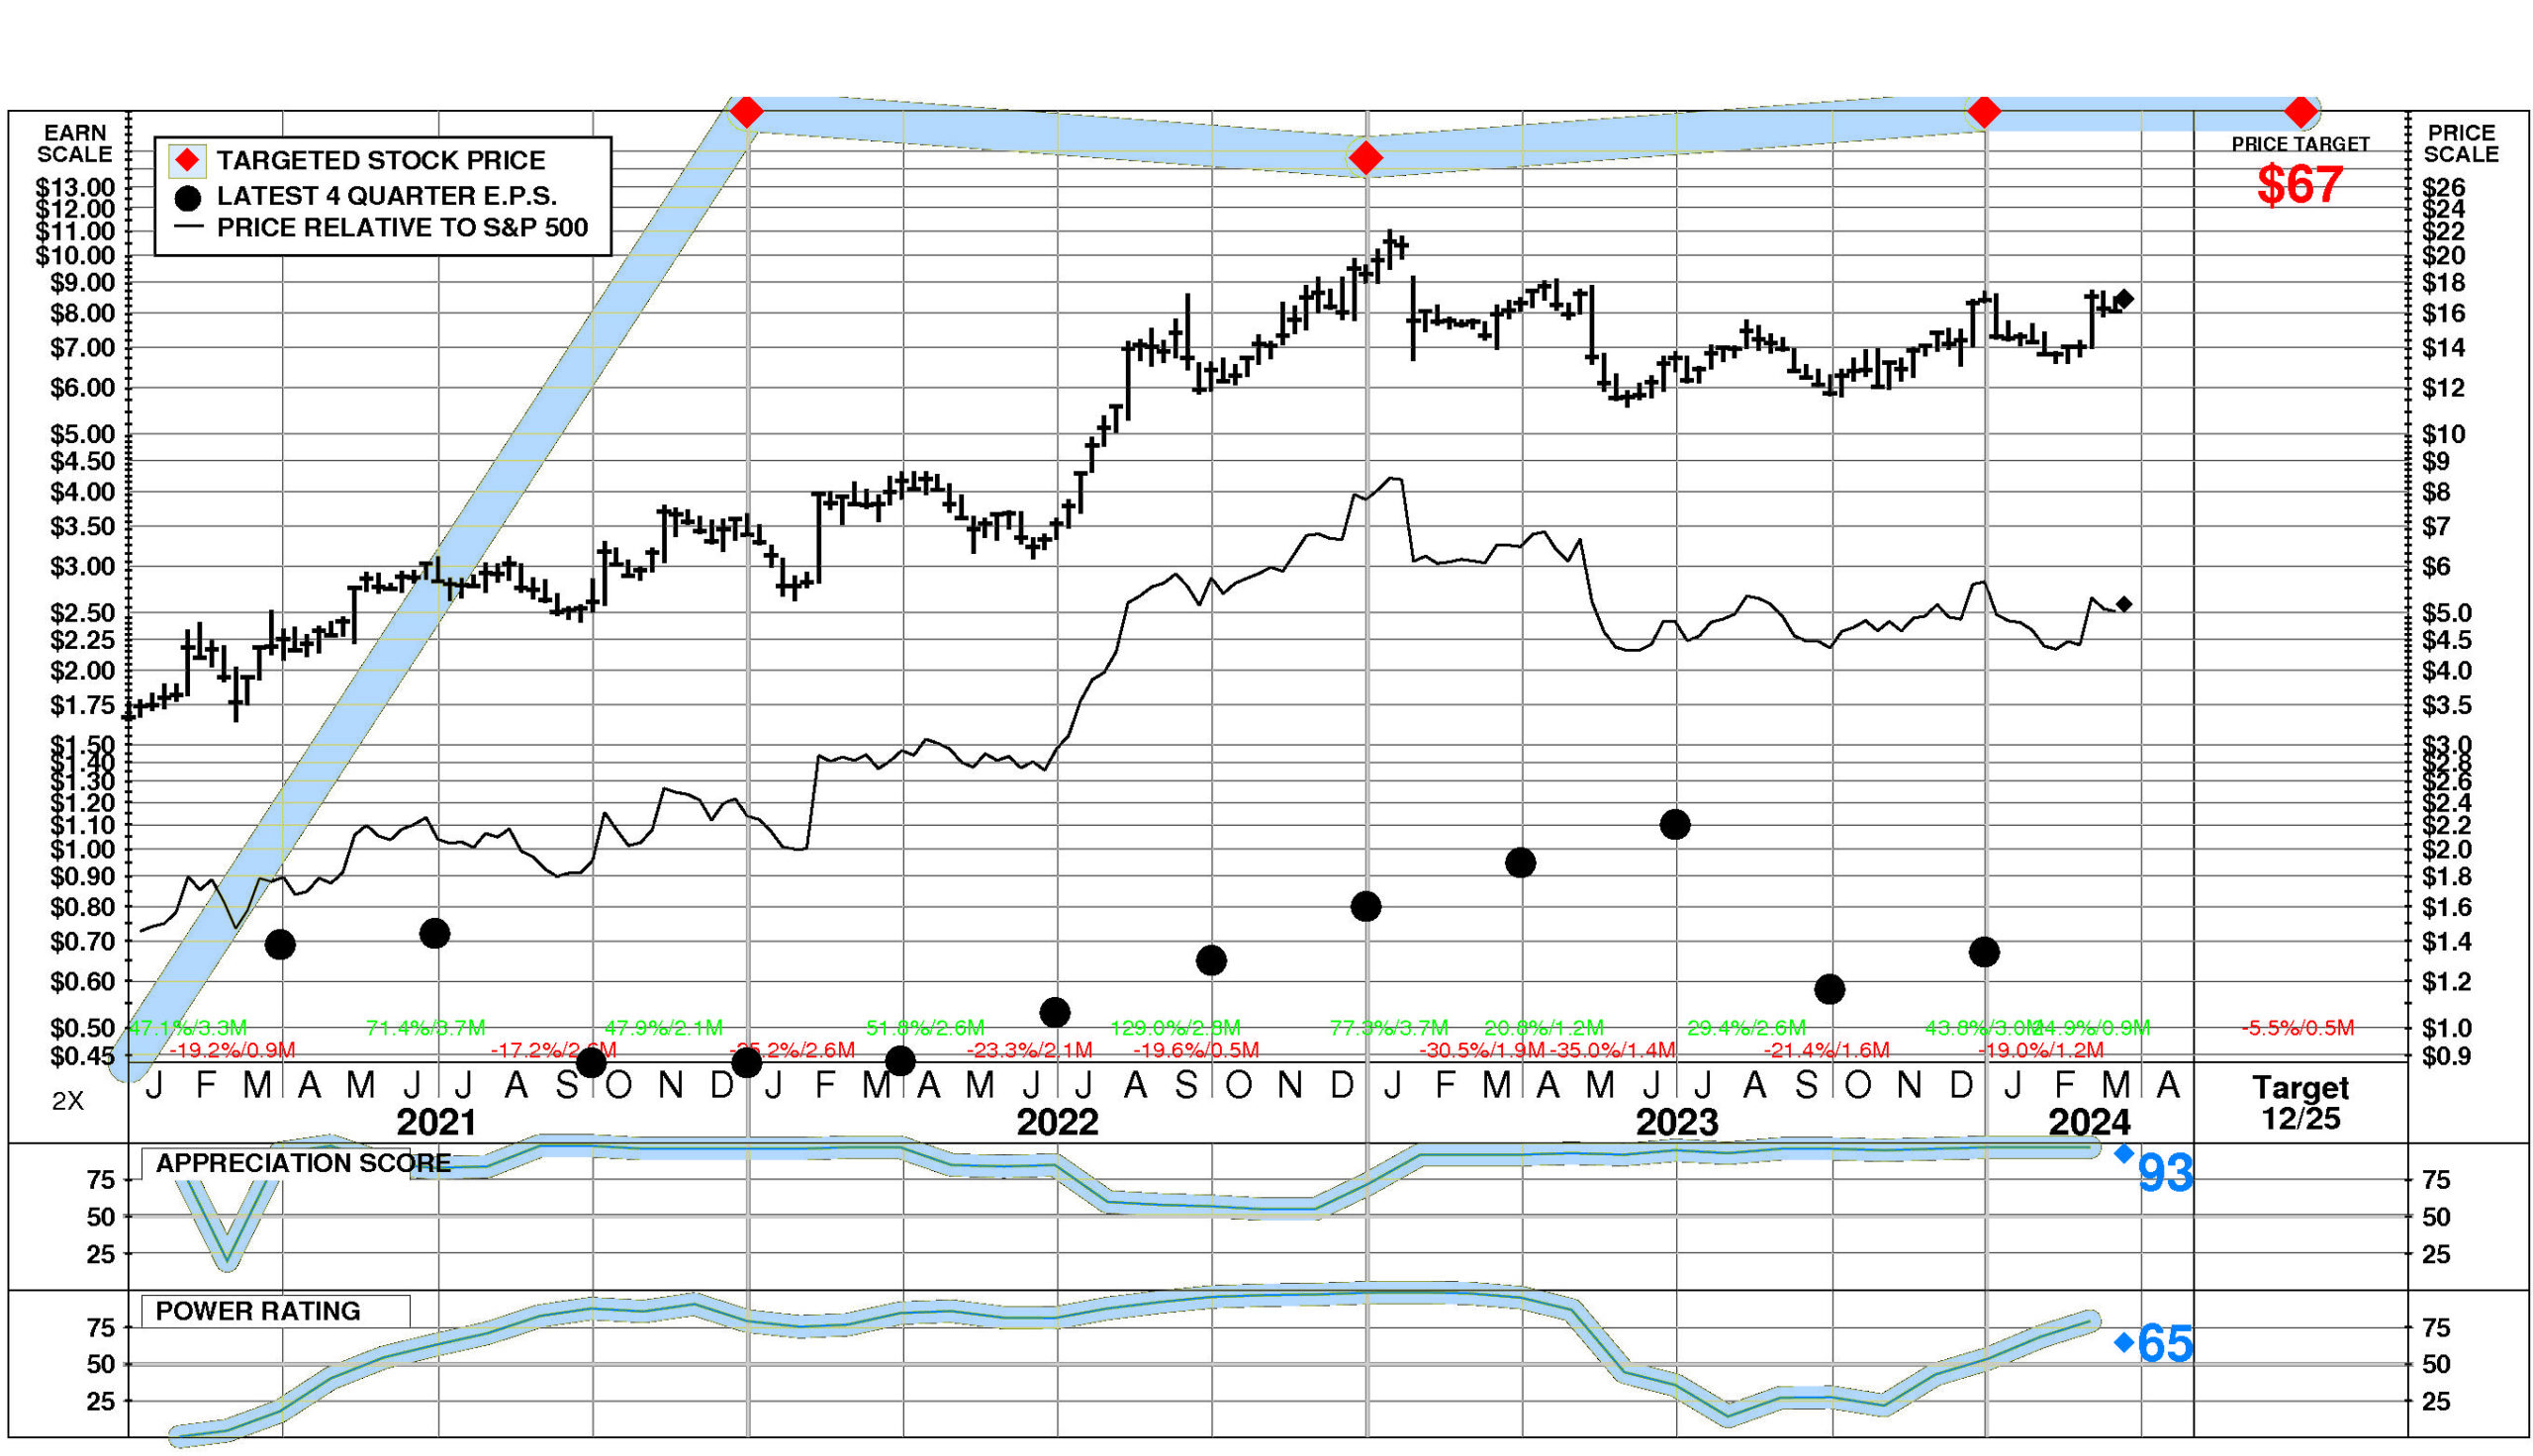
Catalyst Pharmaceutical has a Power Rating of 65. (This slightly positive Power Rating indicates that CPRX’s chances of achieving favorable investment performance over the near to intermediate term are only average.)
Contributing to this slightly positive Power Rating: recent price action has been favorable. Offsetting factors are the Pharmaceutical Preparations comparison group is in a slightly weakened position currently; and the trend in CPRX’s earnings estimates has been unfavorable in recent months.
INVESTMENT PROFILE
CPRX’s financial strength is exceptional. Financial strength rating is 92.
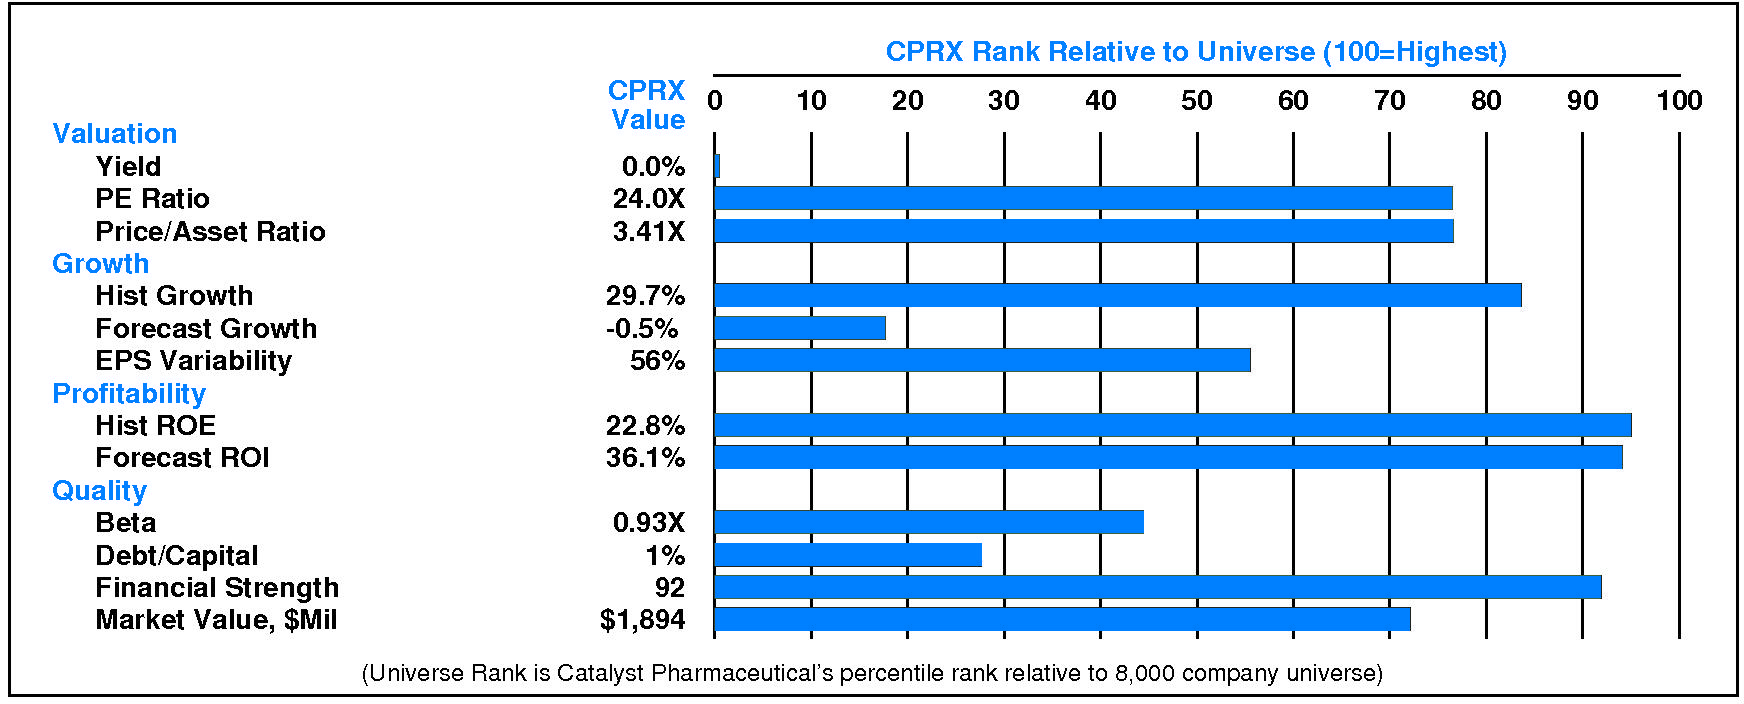
Relative to the S&P 500 Composite, Catalyst Pharmaceutical Inc has both Growth and Value characteristics; its appeal is likely to be to Capital Gain-oriented investors; the perception is that CPRX is lower risk. Low expected growth is a relative weakness for CPRX. CPRX’s valuation is moderate: low dividend yield, low P/E ratio, and moderate price/book ratio. CPRX has unusually low market capitalization.
CURRENT SIGNALS
Catalyst Pharmaceutical’s current operations are stable. Return on equity is falling, reflecting: declining pretax margin; and falling leverage.
Catalyst Pharmaceutical’s current technical position is very strong. The stock price is in a 0.9 month up move. The stock has appreciated 24.9% from its prior low. The stock price is above its 200 day moving average which is in an uptrend.
ALERTS
Recent meaningful positive changes in investment behavior have benefitted Catalyst Pharmaceutical Inc (NASDAQ: CPRX): its shorter term price trend turned up.
Recent significant negative changes in fundamentals have impacted Catalyst Pharmaceutical Inc (NASDAQ: CPRX): the consensus estimate for December, 2024 decreased significantly, significant quarterly earnings deceleration occurred, and the consensus estimate for December, 2025 decreased significantly.
The stock is currently rated A.
Catalyst Pharmaceutical Inc (NASDAQ: CPRX) stock enjoyed a large increase of 3.2% on 3/20/24. The stock closed at $16.91. However, trading volume in this advance was unusually low at 66% of normal. The stock has risen 4.4% during the last week and has been strong relative to the market over the last nine months.
CASH FLOW
In 2023, Catalyst Pharmaceutical experienced a very significant reduction in cash of -$160.8 million (-54%). Sources of cash were much lower than uses. Cash generated from 2023 EBITDA totaled +$201.2 million. Non-operating uses consumed -$73.8 million (-37% of EBITDA). Cash taxes consumed -$23.1 million (-11% of EBITDA). Re-investment in the business amounted to -$280.8 million (-140% of EBITDA). On a net basis, debt investors received -$0.3 million (-0% of EBITDA) while equity investors supplied +$16.1 million (+8% of EBITDA).
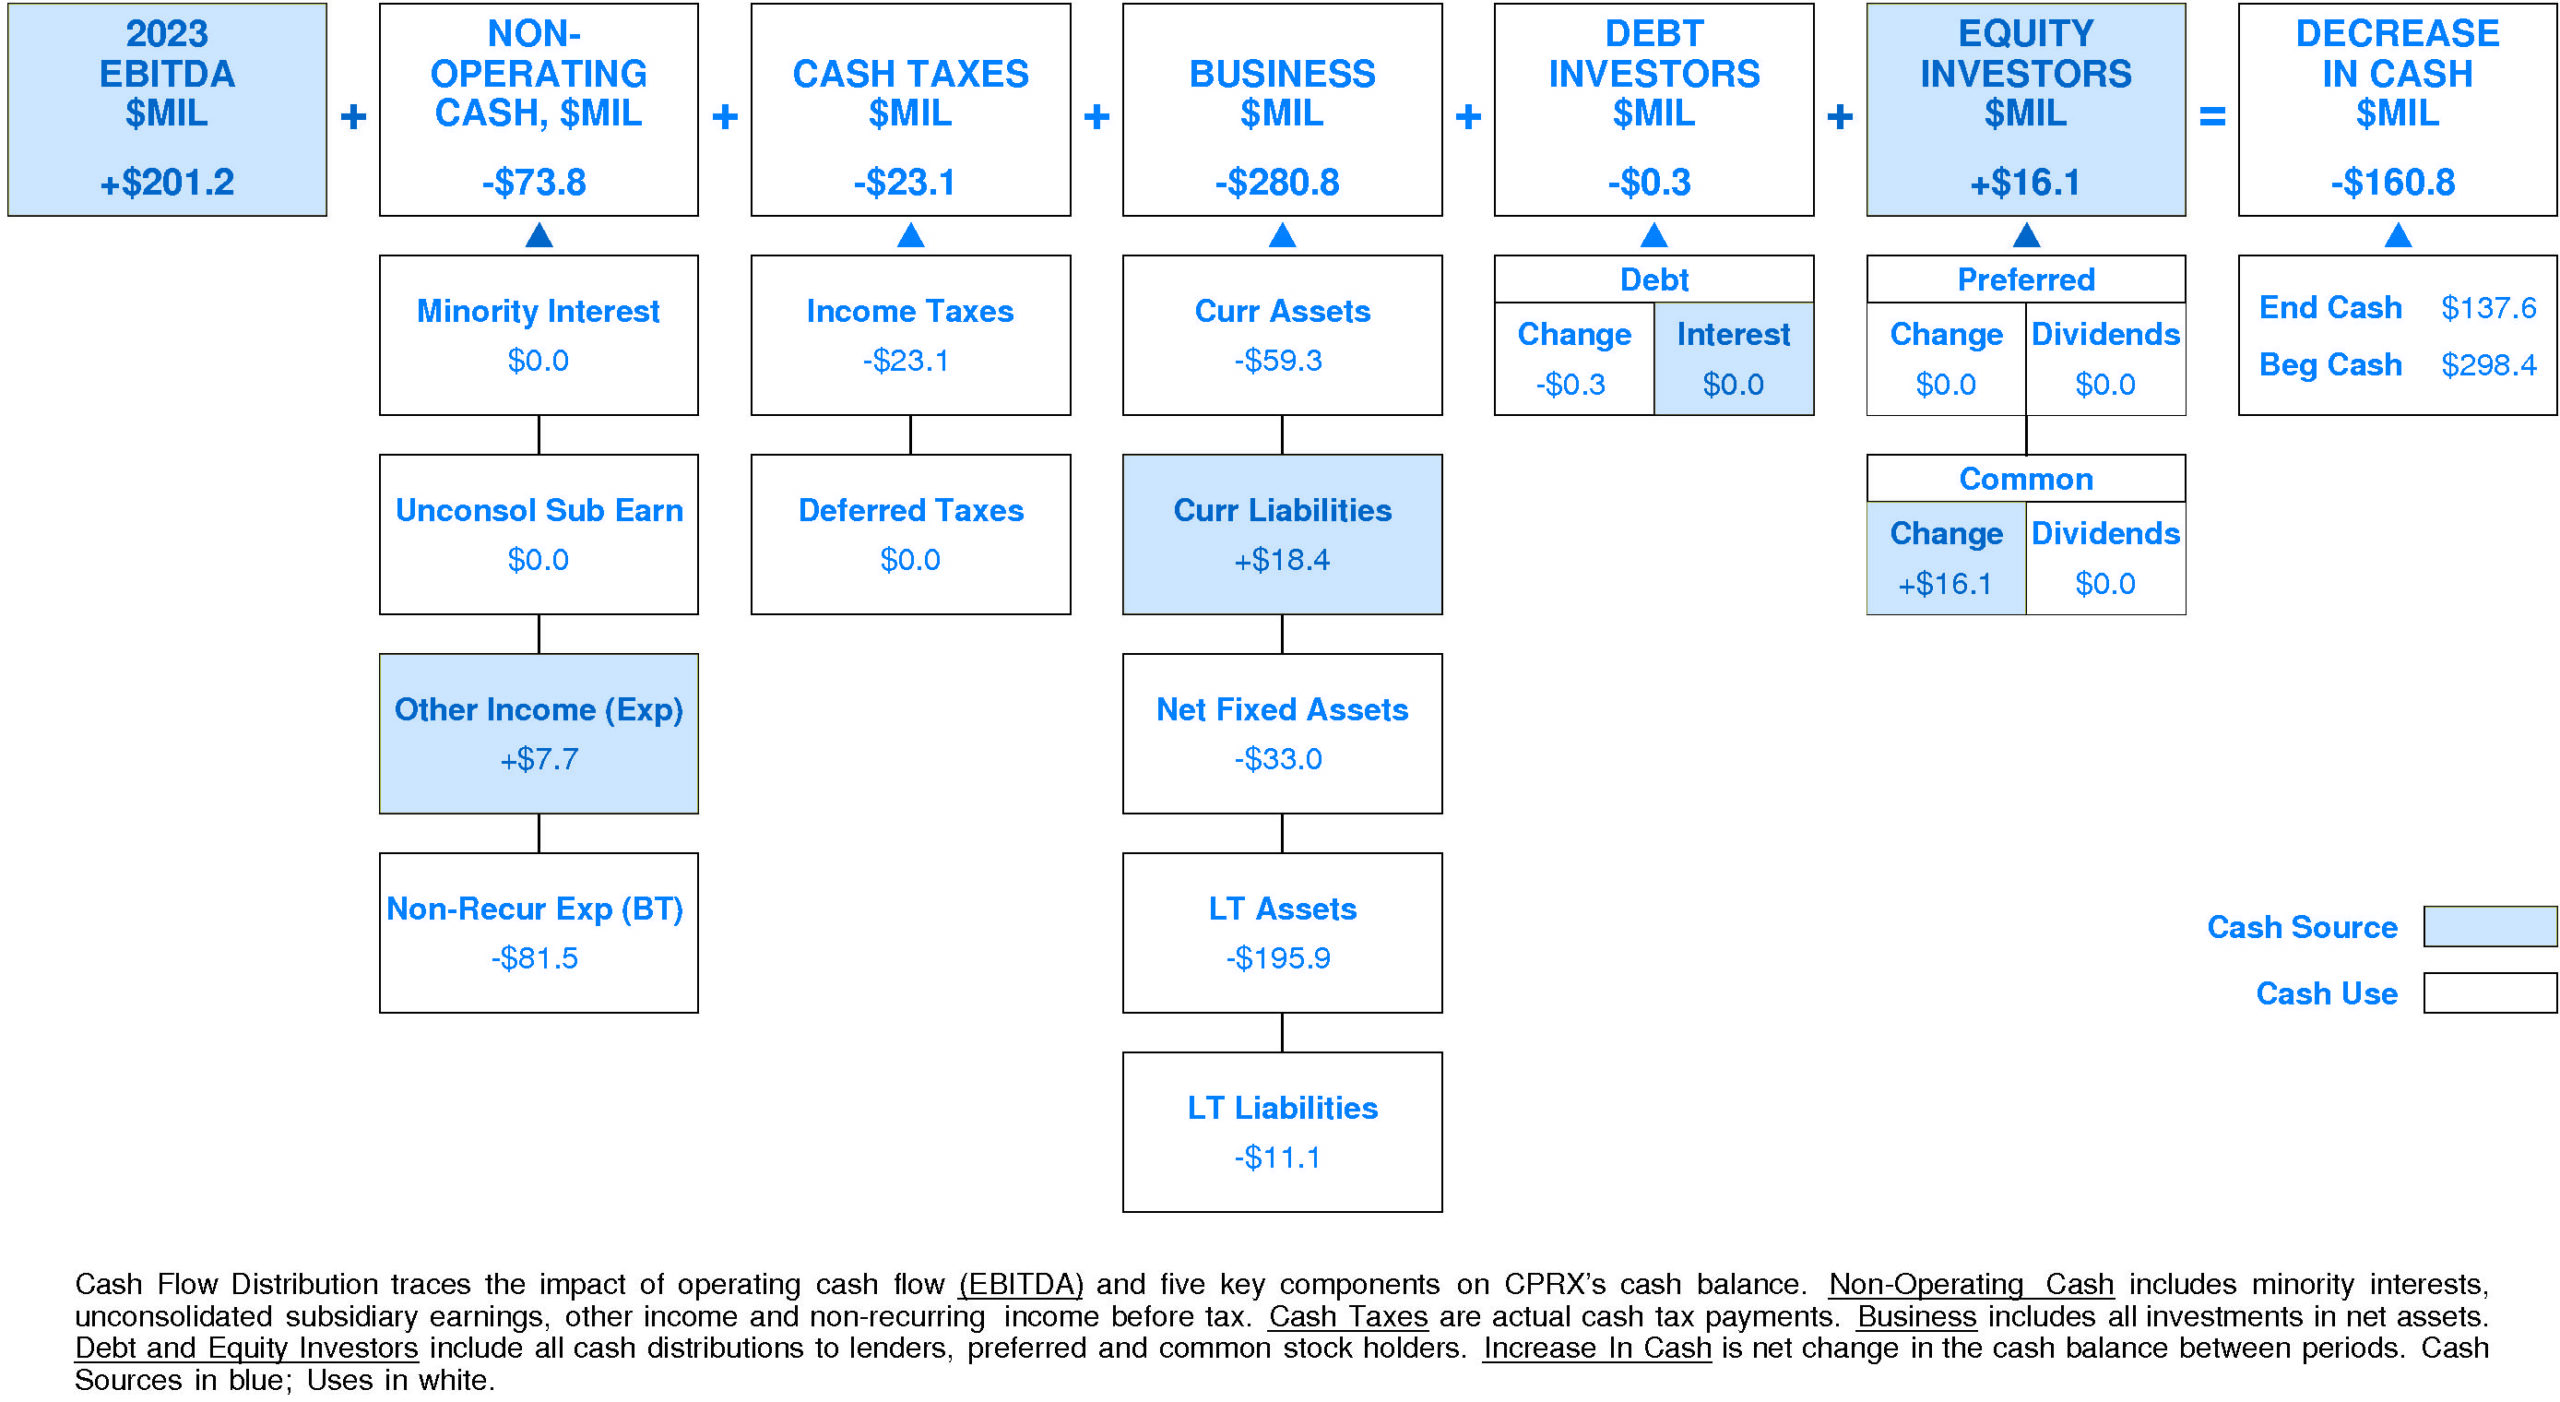
CPRX’s Non-operating Income, %EBITDA has experienced a downtrend over the period. This downtrend was accompanied by a similar trend for the Catalyst Pharmaceutical Peer Group. In most years, Catalyst Pharmaceutical was in the top quartile and second quartile. Currently, Catalyst Pharmaceutical is lower quartile at -37% of EBITDA (-$73.8 million).
CPRX’s Cash Taxes, %EBITDA has experienced a downtrend over the period. This downtrend was accompanied by stability for the Catalyst Pharmaceutical Peer Group. (Since 2021 Cash Taxes, %EBITDA has experienced a very sharp recovery.) In most years, Catalyst Pharmaceutical was in the top quartile and second quartile. Currently, Catalyst Pharmaceutical is above median at -11% of EBITDA (-$23.1 million).
CPRX’s Business Re-investment, %EBITDA has suffered a volatile overall downtrend over the period. This downtrend was accompanied by a similar trend for the Catalyst Pharmaceutical Peer Group. (Since 2021 Business Re-investment, %EBITDA has accelerated very sharply.) In most years, Catalyst Pharmaceutical was in the top quartile and lower quartile. Currently, Catalyst Pharmaceutical is lower quartile at -140% of EBITDA (-$280.8 million).
CPRX’s Debt Investors, %EBITDA has exhibited little to no overall change over the period. This stability was accompanied by stability for the Catalyst Pharmaceutical Peer Group as well. In most years, Catalyst Pharmaceutical was in the second quartile and lower quartile. Currently, Catalyst Pharmaceutical is above median at -0% of EBITDA (-$0.3 million).
CPRX’s Equity Investors, %EBITDA has enjoyed a very strong overall uptrend over the period. This improvement was accompanied by a similar trend for the Catalyst Pharmaceutical Peer Group. In most years, Catalyst Pharmaceutical was in the top quartile and lower quartile. Currently, Catalyst Pharmaceutical is upper quartile at +8% of EBITDA (+$16.1 million).
CPRX’s Change in Cash, %EBITDA has experienced a volatile overall uptrend over the period. This improvement was accompanied by stability for the Catalyst Pharmaceutical Peer Group. (Since 2019 Change in Cash, %EBITDA has experienced a very sharp decline.) In most years, Catalyst Pharmaceutical was in the top quartile and lower quartile. Currently, Catalyst Pharmaceutical is lower quartile at -80% of EBITDA (-$160.8 million).
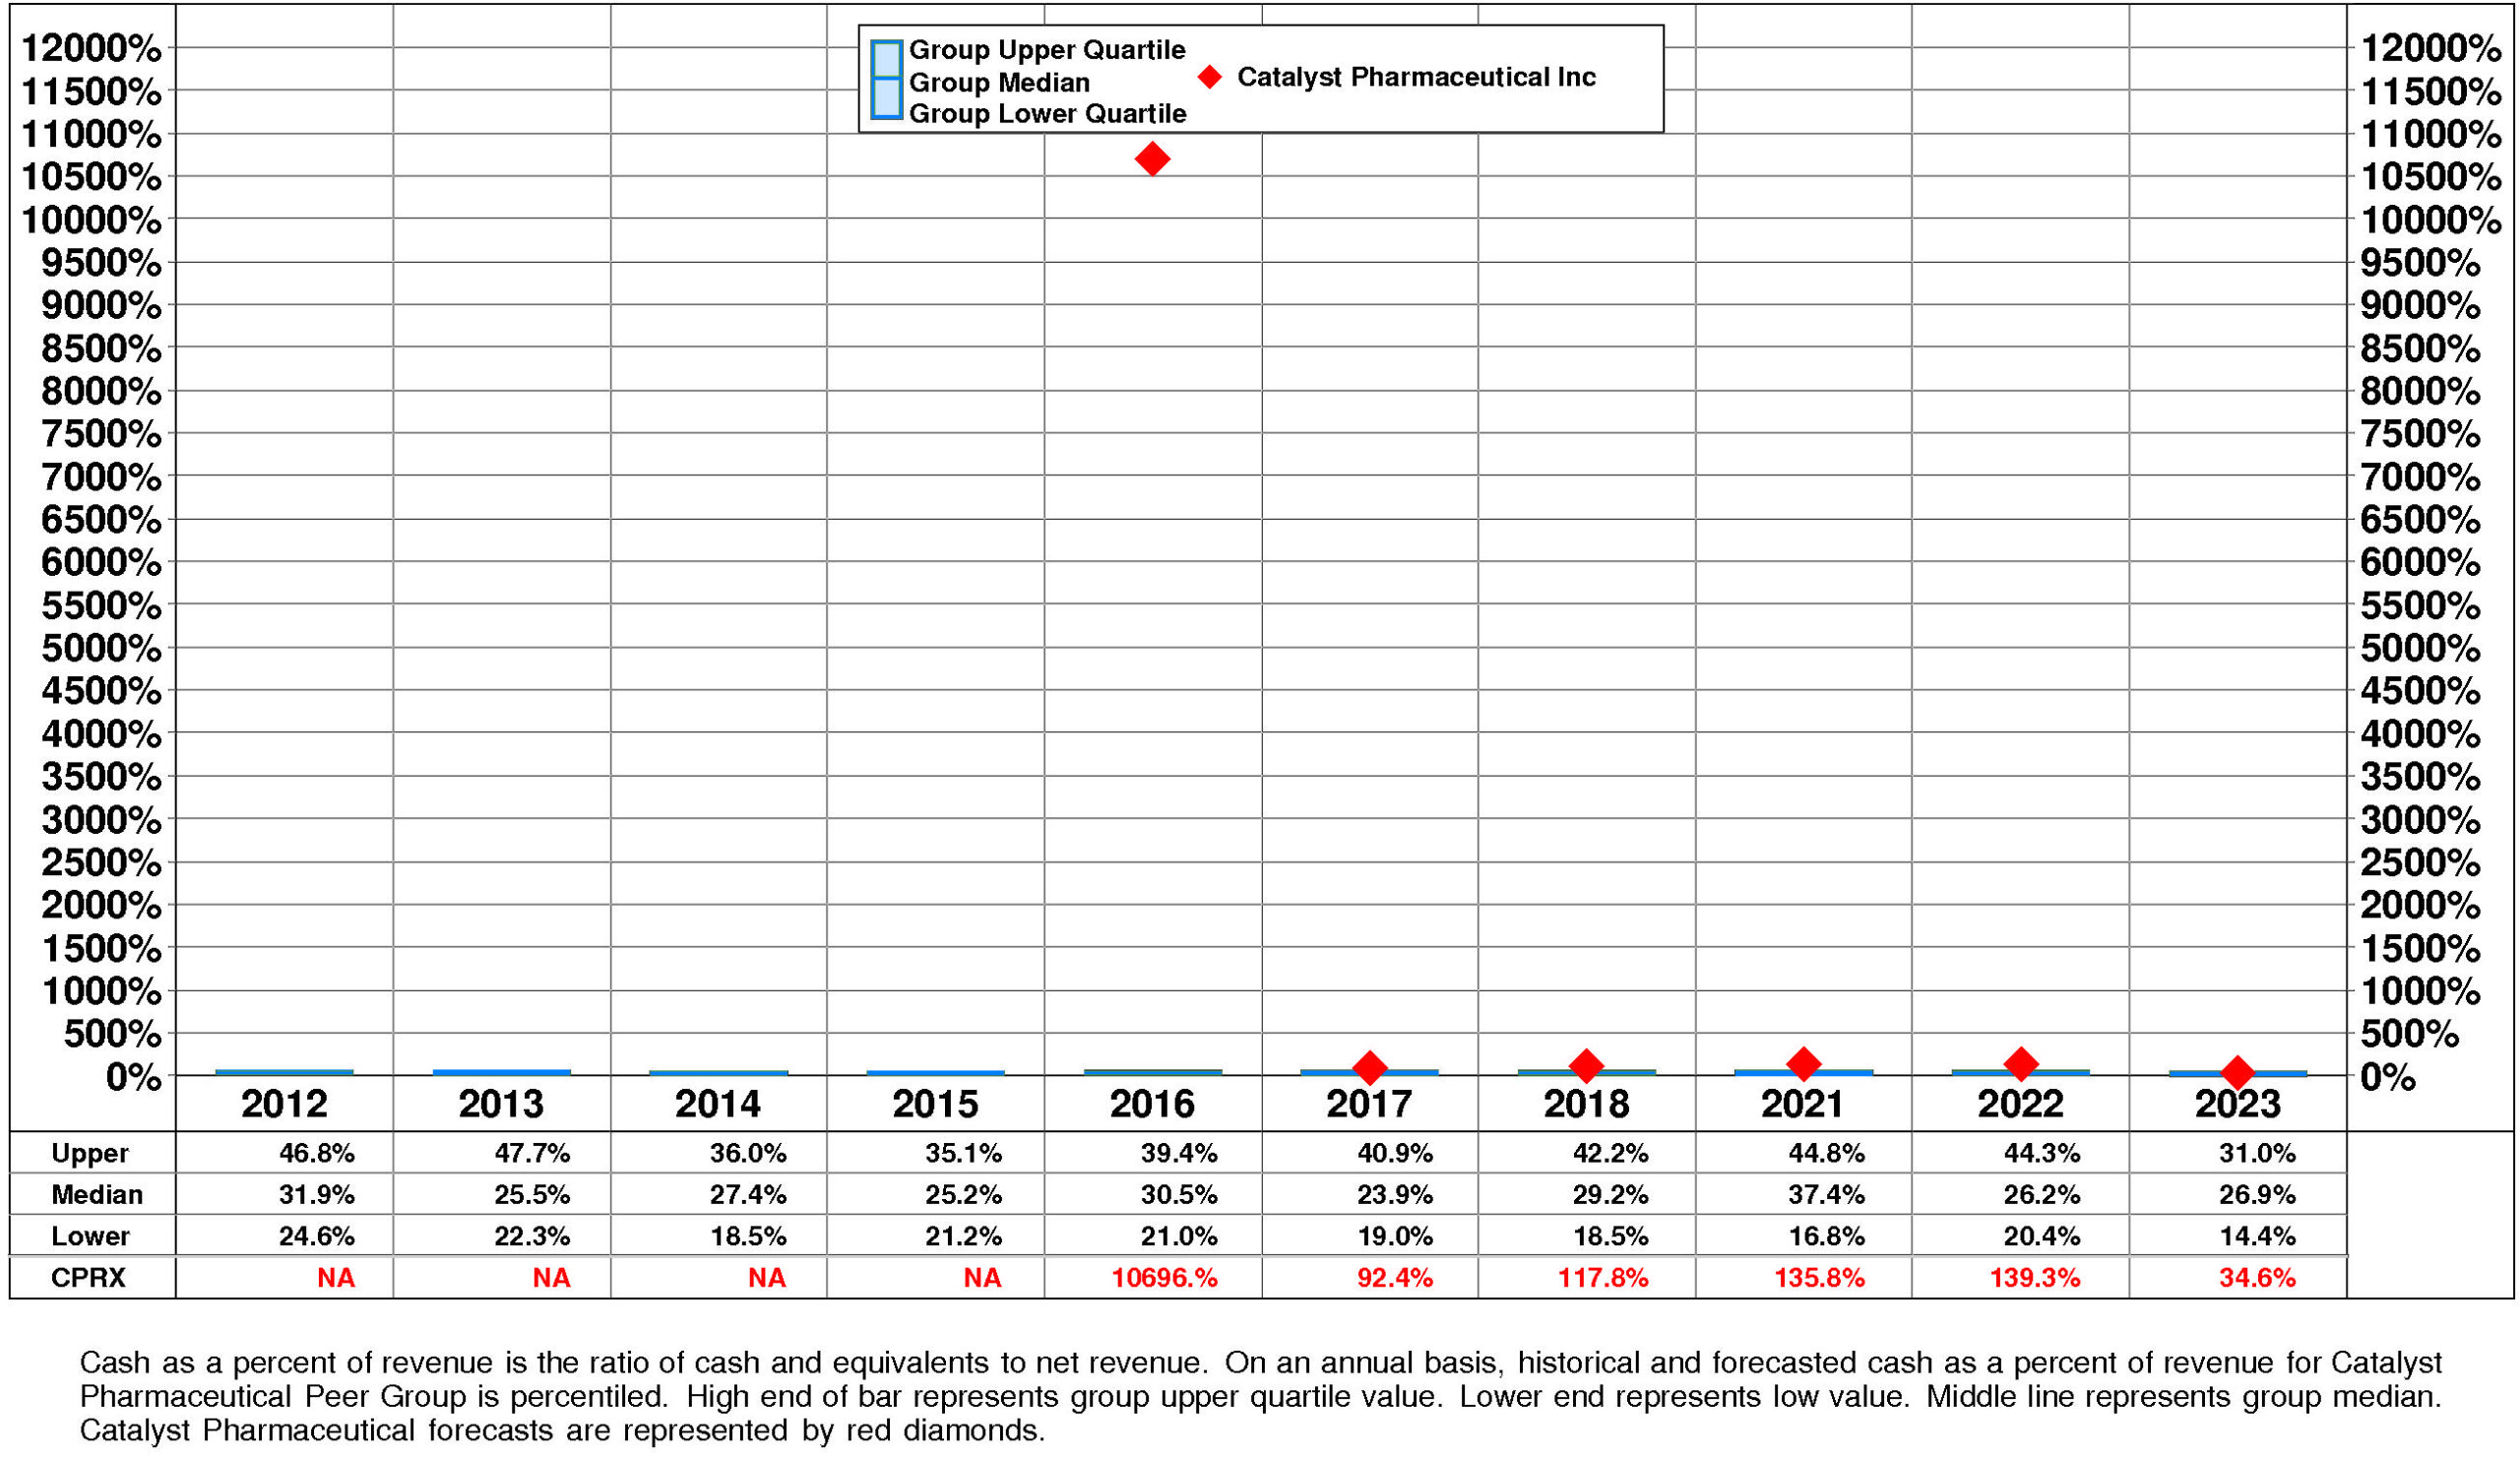
CPRX’s Cash, %Revenue has suffered a very strong overall downtrend over the period. This downtrend was accompanied by stability for the Catalyst Pharmaceutical Peer Group. In most years, Catalyst Pharmaceutical was in the top quartile. Currently, Catalyst Pharmaceutical is upper quartile at +35%.
PROFITABILITY
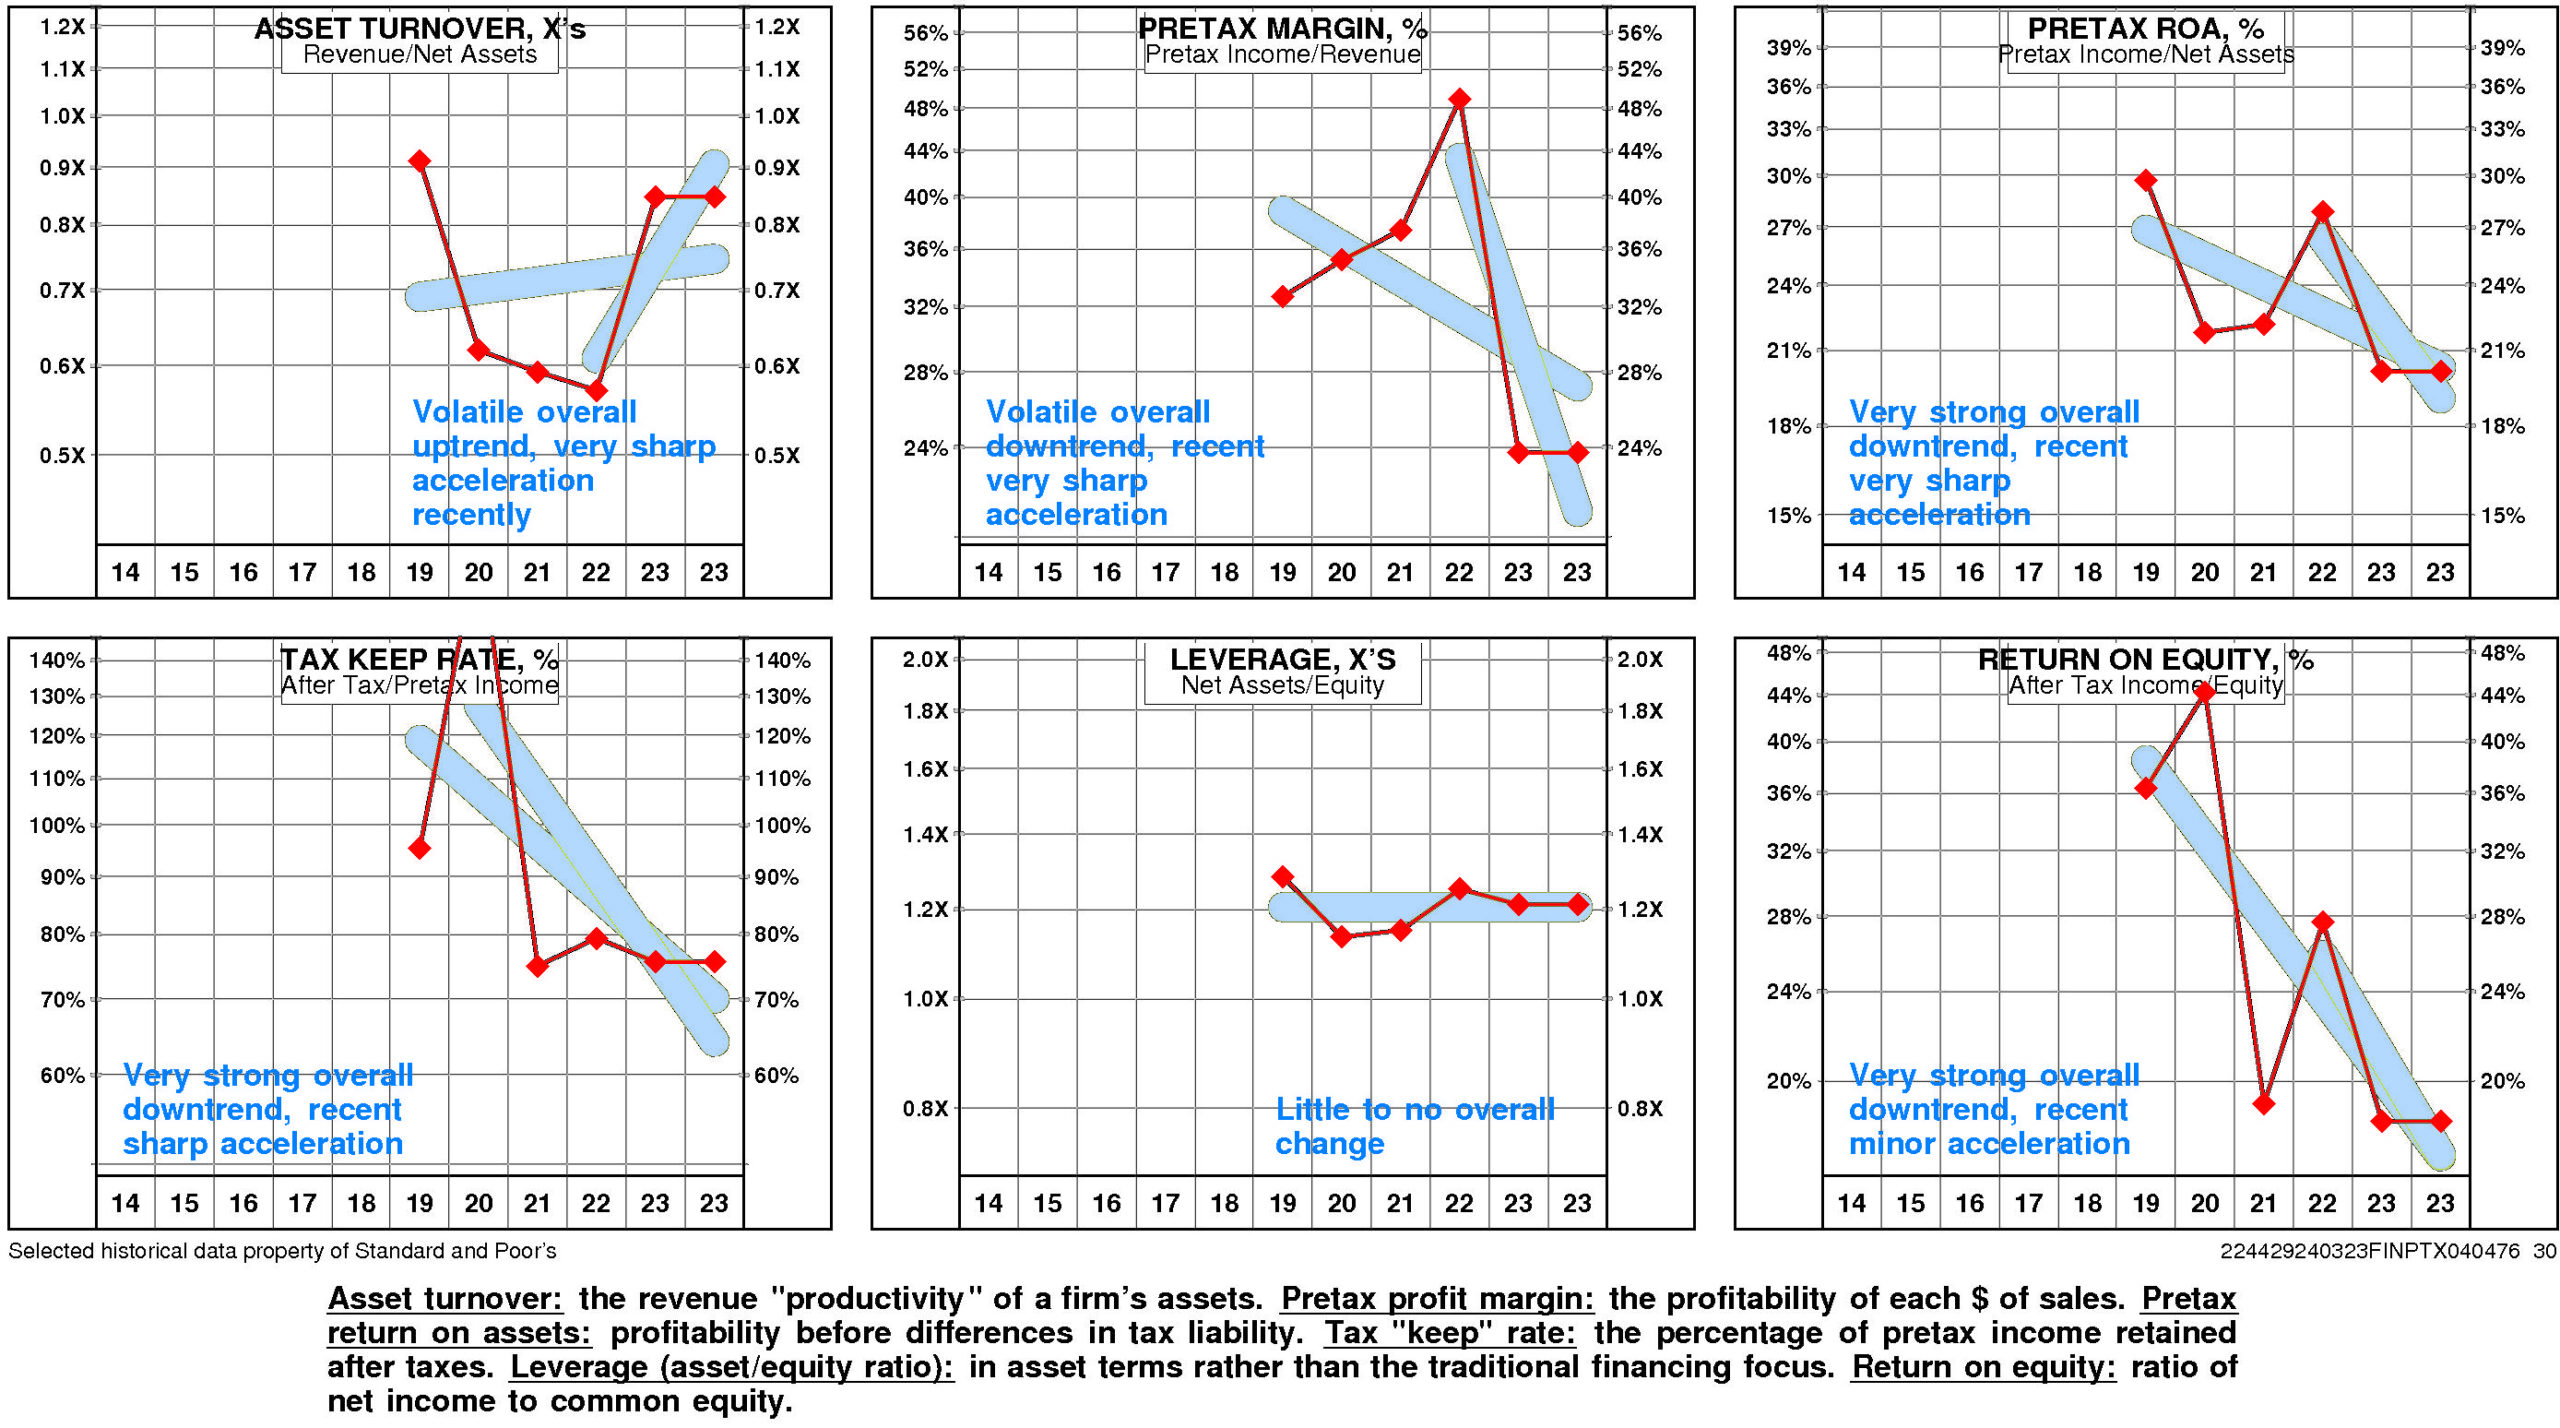
CPRX’s return on equity has eroded very significantly since 2019. The current level of 18.4% is at the low for the period and is -49.4% from the high.
A major analytical focus for CPRX is a very strong negative trend in pretax operating return significantly augmented by a very strong negative trend in non-operating factors.
The productivity of CPRX’s assets rose over the full period 2014-2023: asset turnover has exhibited a volatile overall uptrend that accelerated very sharply after the 2022 level.
More than offsetting this trend, however, pretax margin experienced a strong overall downtrend that accelerated very sharply from the 2022 level.
Non-operating factors (income taxes and financial leverage) had a significant negative influence on return on equity.
CPRX’s return on equity is slightly below median (18.4%) for the four quarters ended December, 2023.
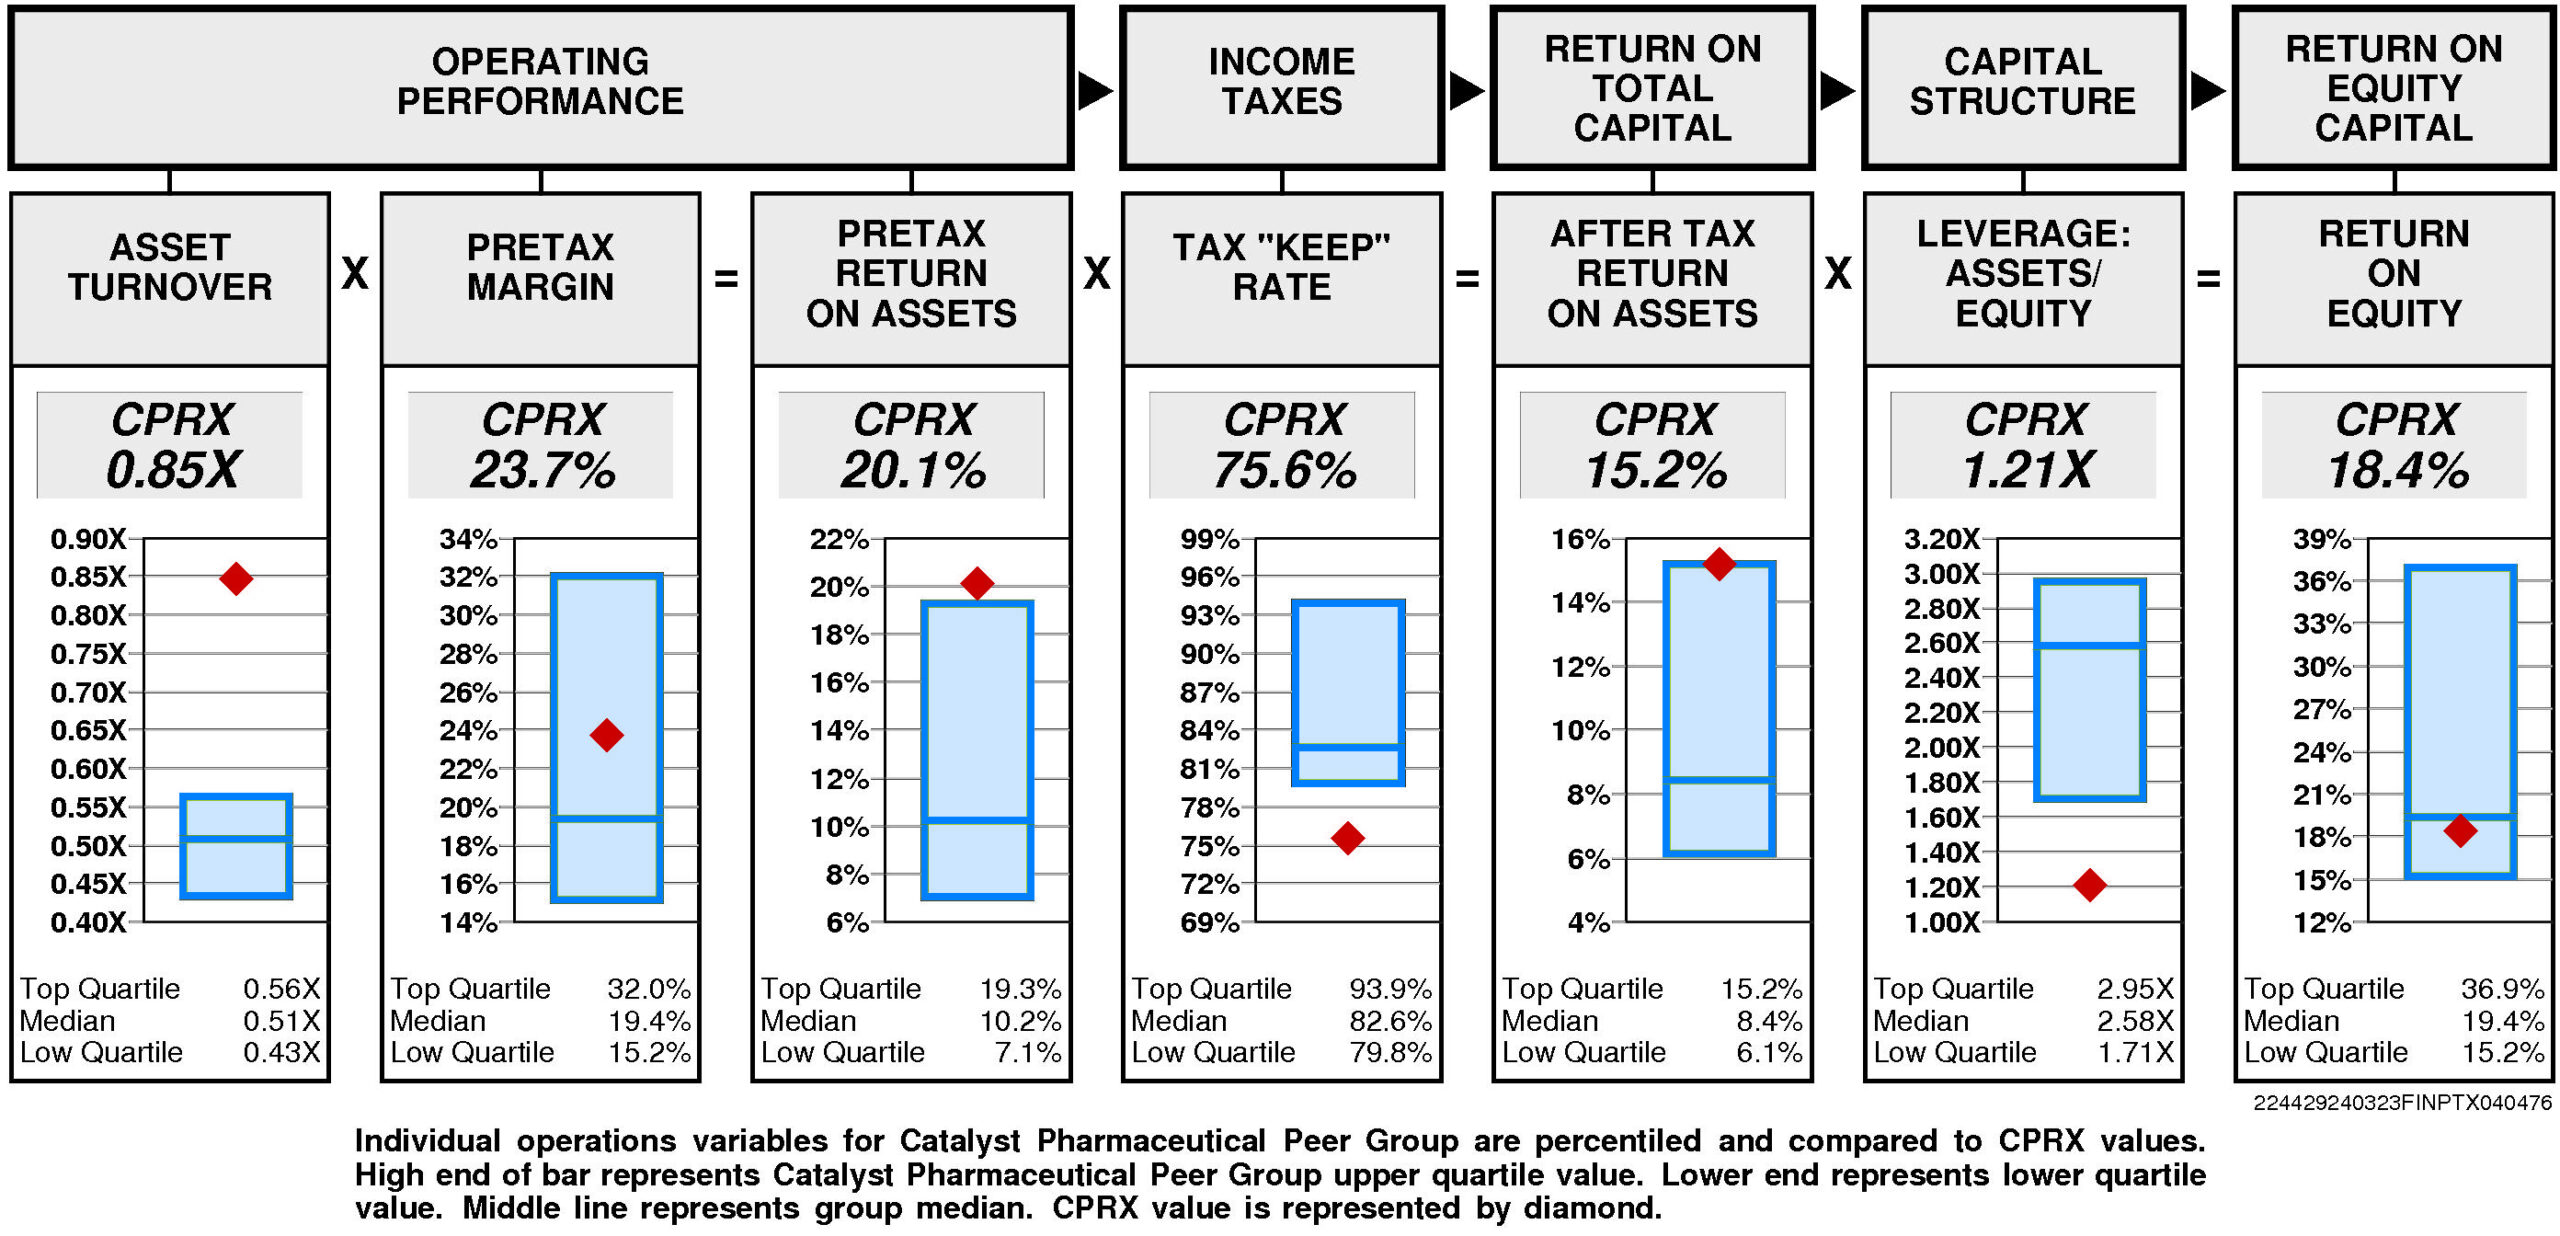
Operating performance (pretax return on assets) is upper quartile (20.1%) reflecting asset turnover that is upper quartile (0.85X) and above median pretax margin (23.7%).
Tax “keep” rate (income tax management) is lower quartile (75.6%) resulting in after tax return on assets that is at the upper quartile.
Financial leverage (leverage) is lower quartile (1.21X).
GROWTH RATES
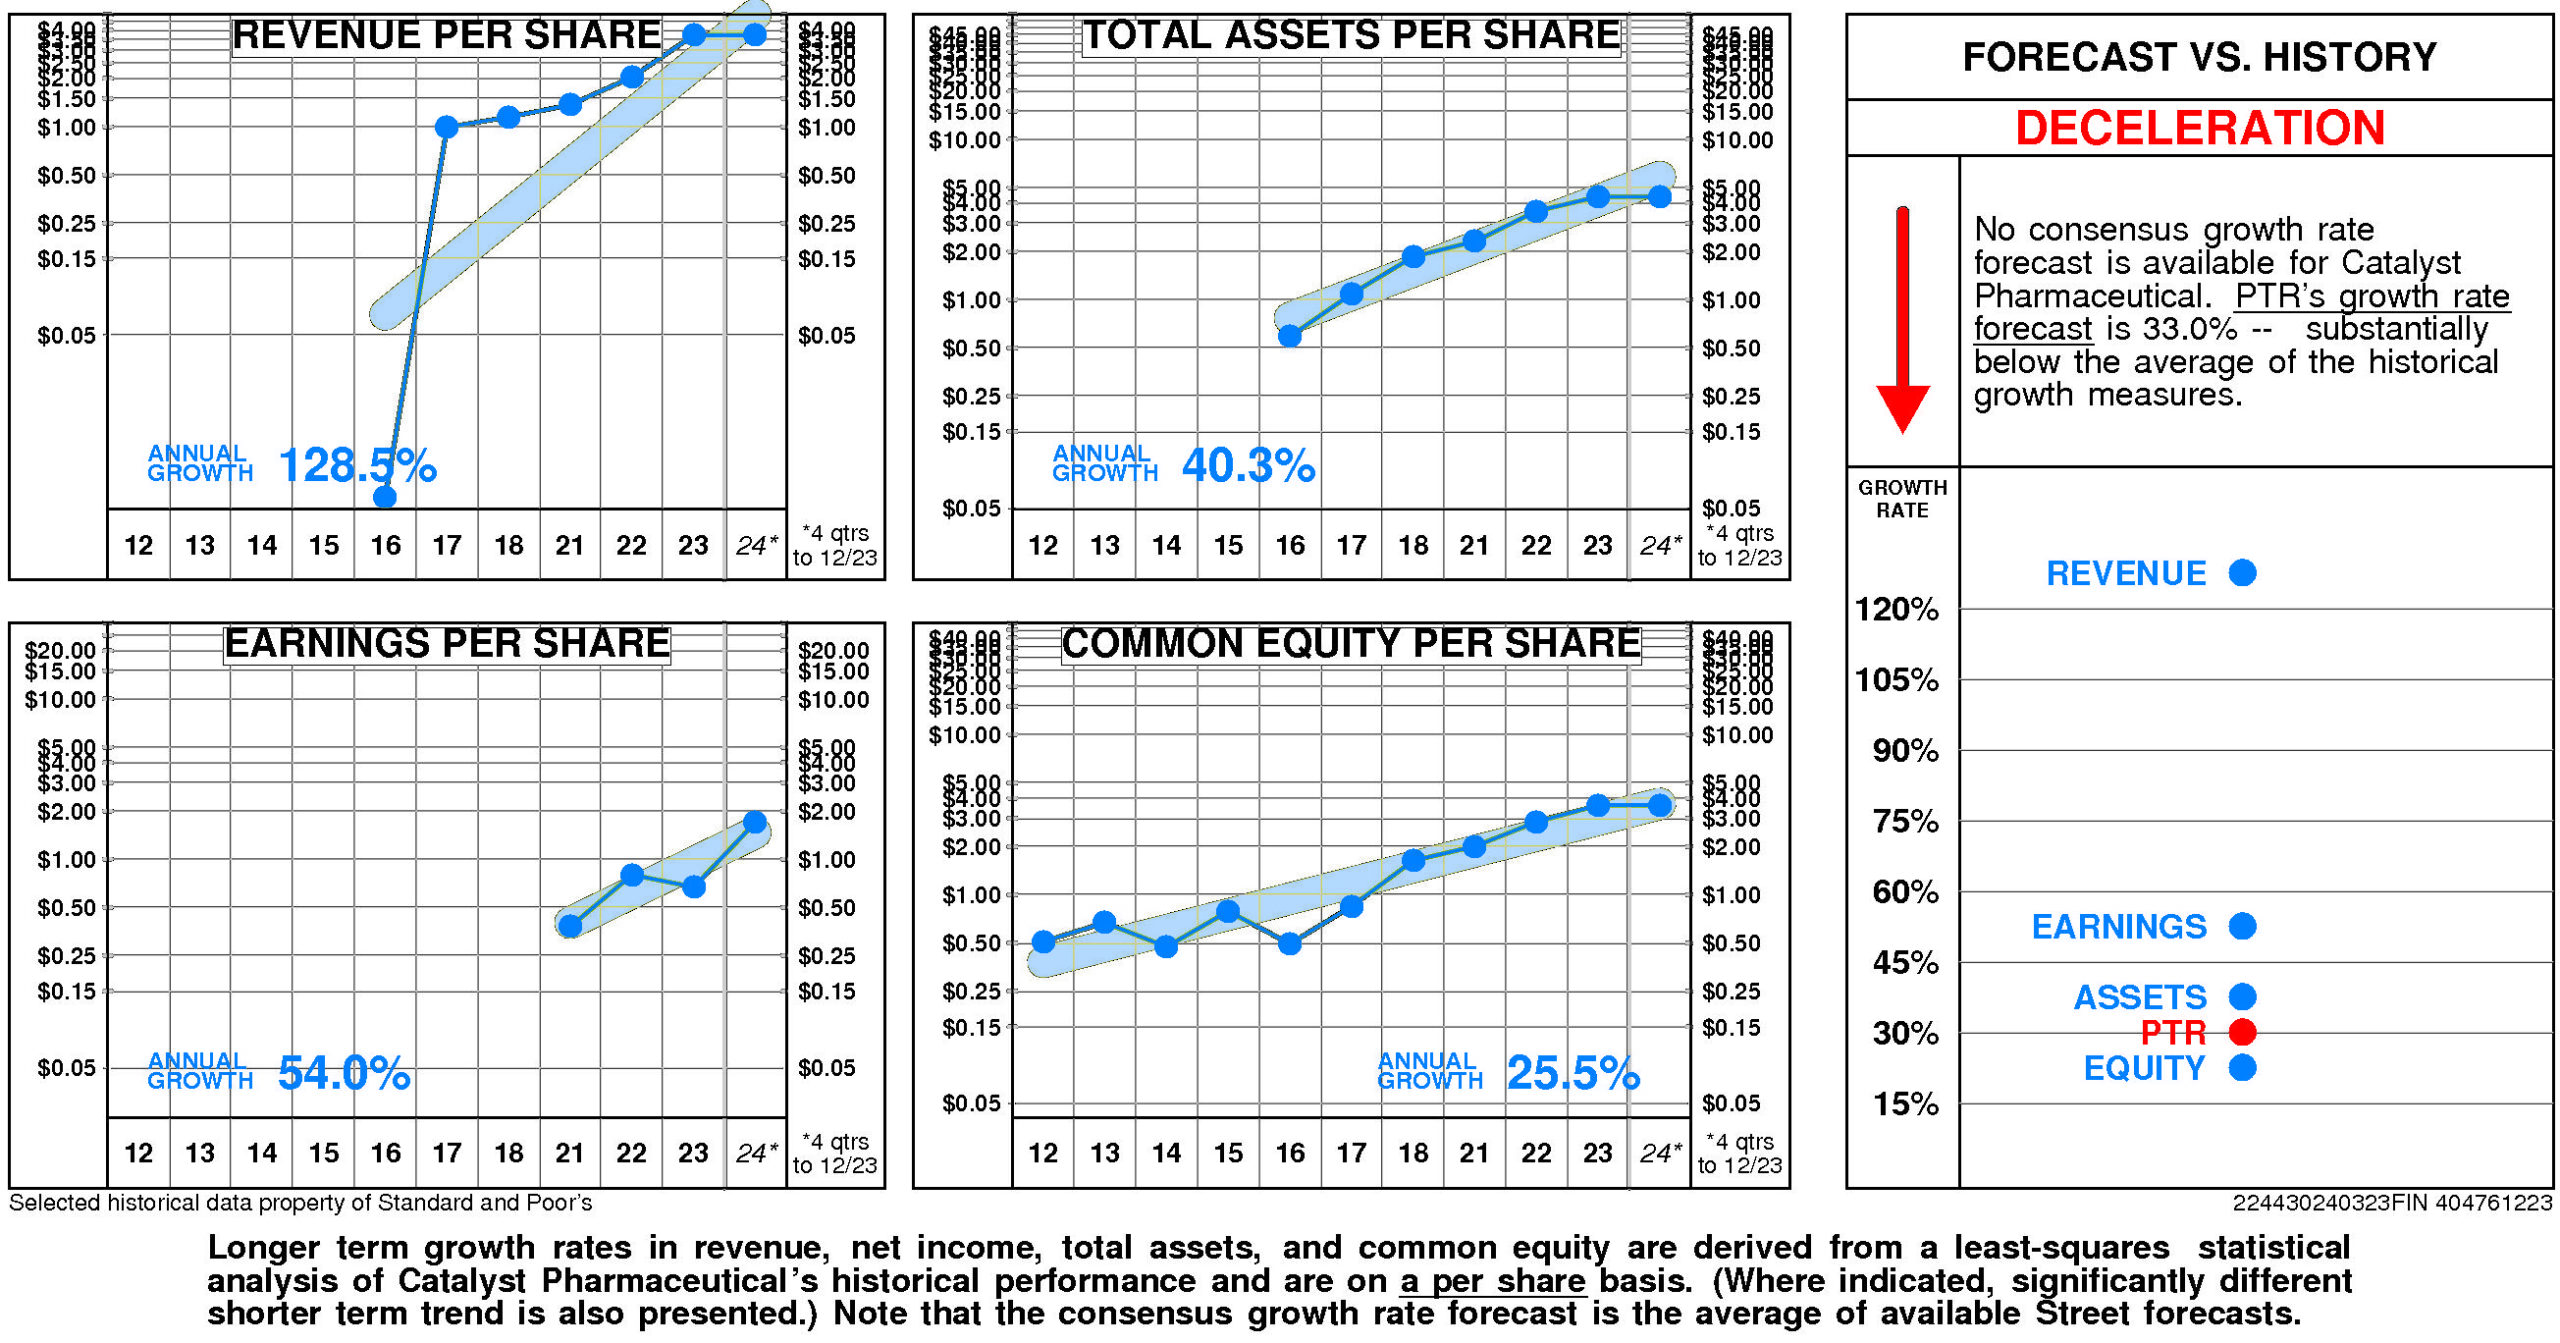
There are no significant differences between Catalyst Pharmaceutical’s longer term growth and growth in recent years.
Catalyst Pharmaceutical’s historical income statement growth has been higher than growth in the balance sheet. Revenue growth has exceeded asset growth; earnings growth has exceeded equity growth.
Annual revenue growth has been 128.5% per year.
Total asset growth has been 40.3% per year.
Annual E.P.S. growth has been 54.0% per year.
Equity growth has been 25.5% per year.
No consensus growth rate forecast is available for Catalyst Pharmaceutical.
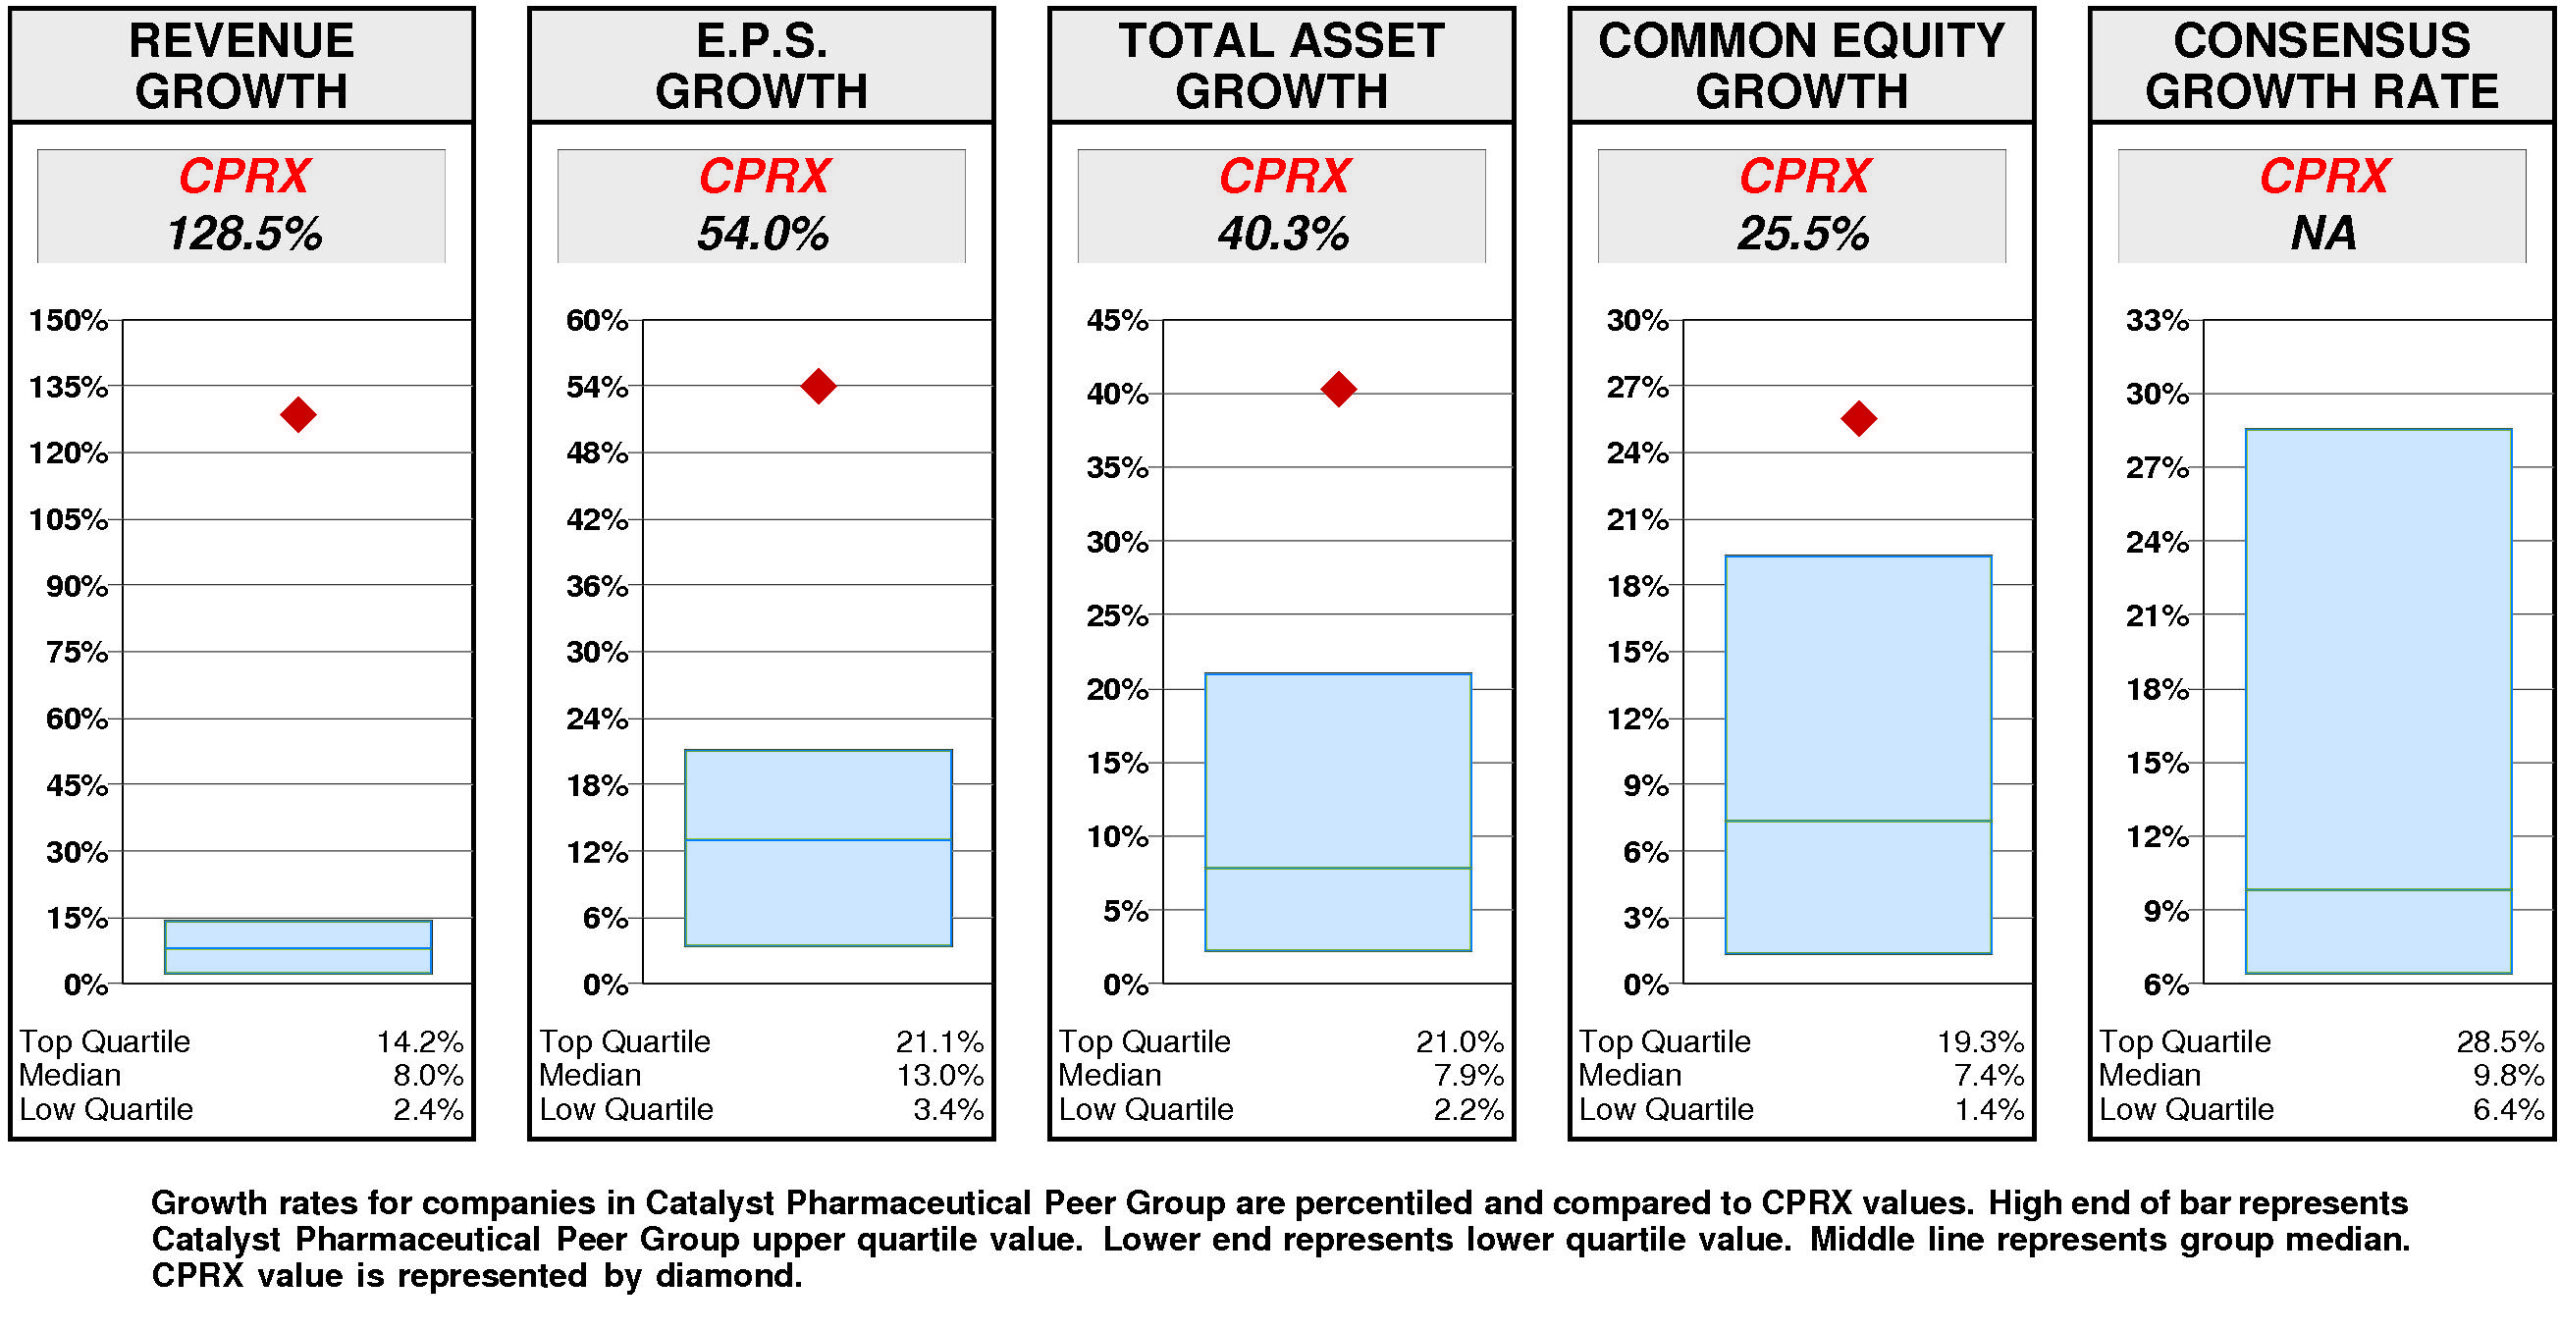
Relative to the Catalyst Pharmaceutical Peer Group, Catalyst Pharmaceutical’s historical growth measures are consistently top quartile. Revenue growth (128.5%) has been upper quartile. Total asset growth (40.3%) has been upper quartile. E.P.S. growth (54.0%) has been upper quartile. Equity growth (25.5%) has been upper quartile.
Consensus growth forecast is unavailable.
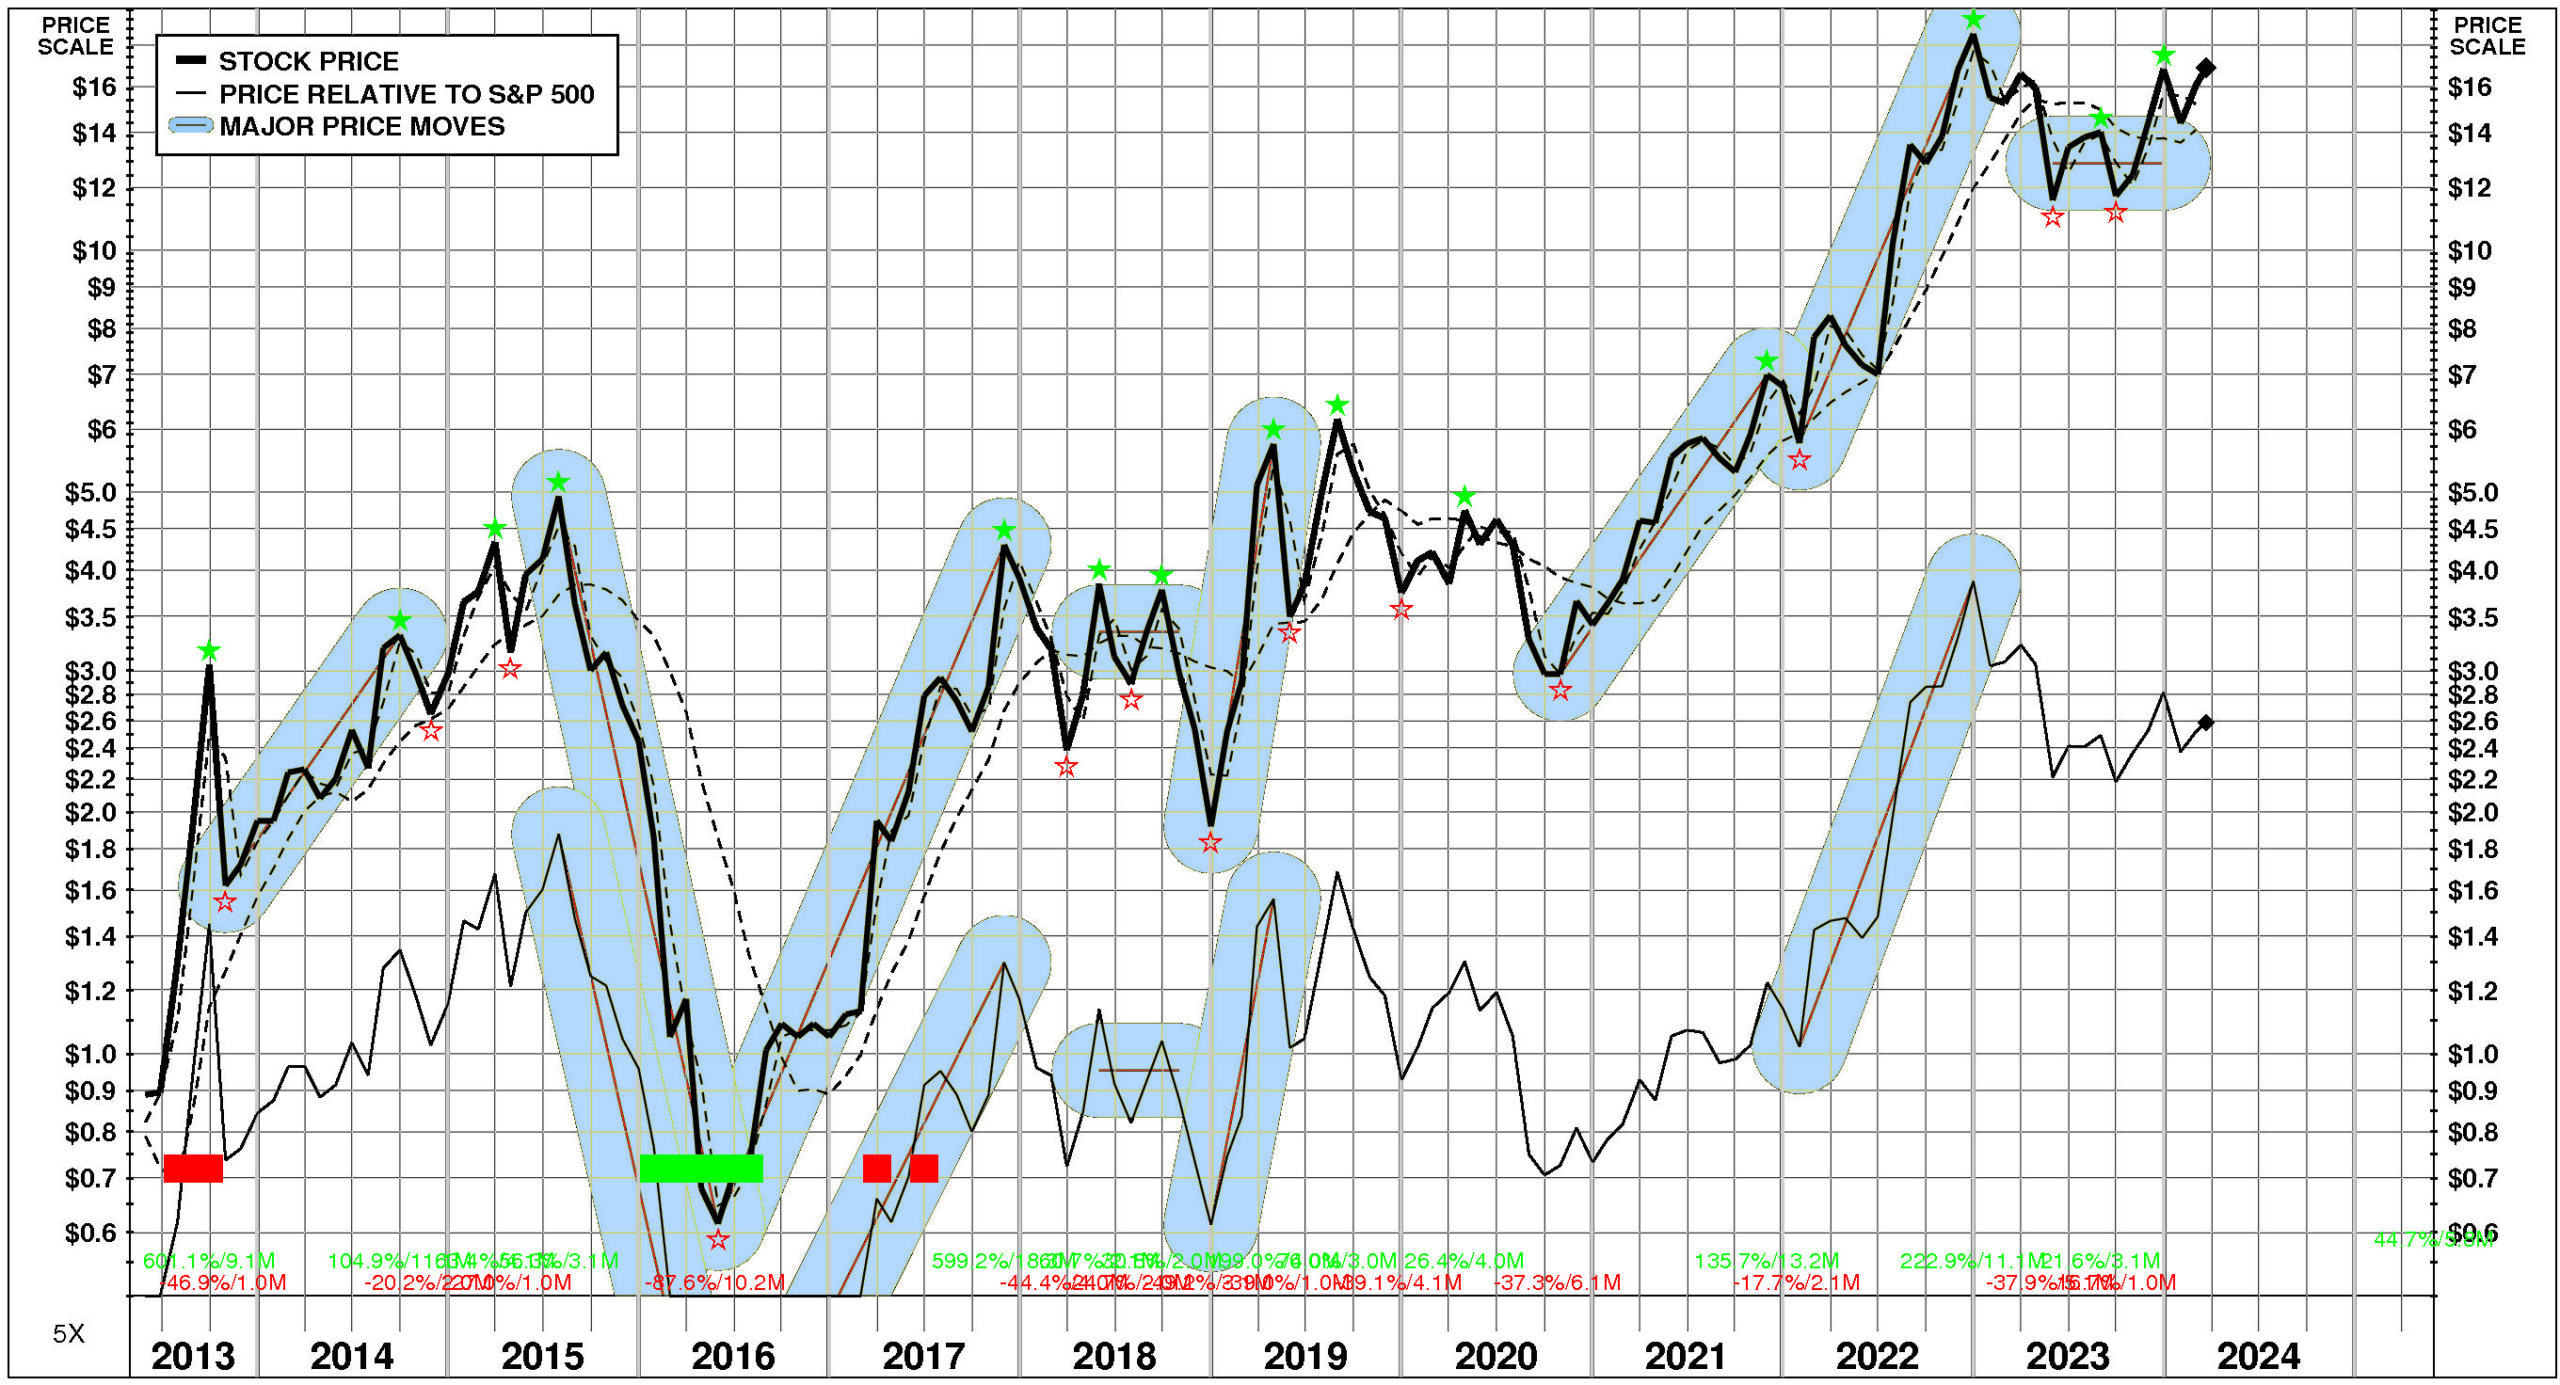
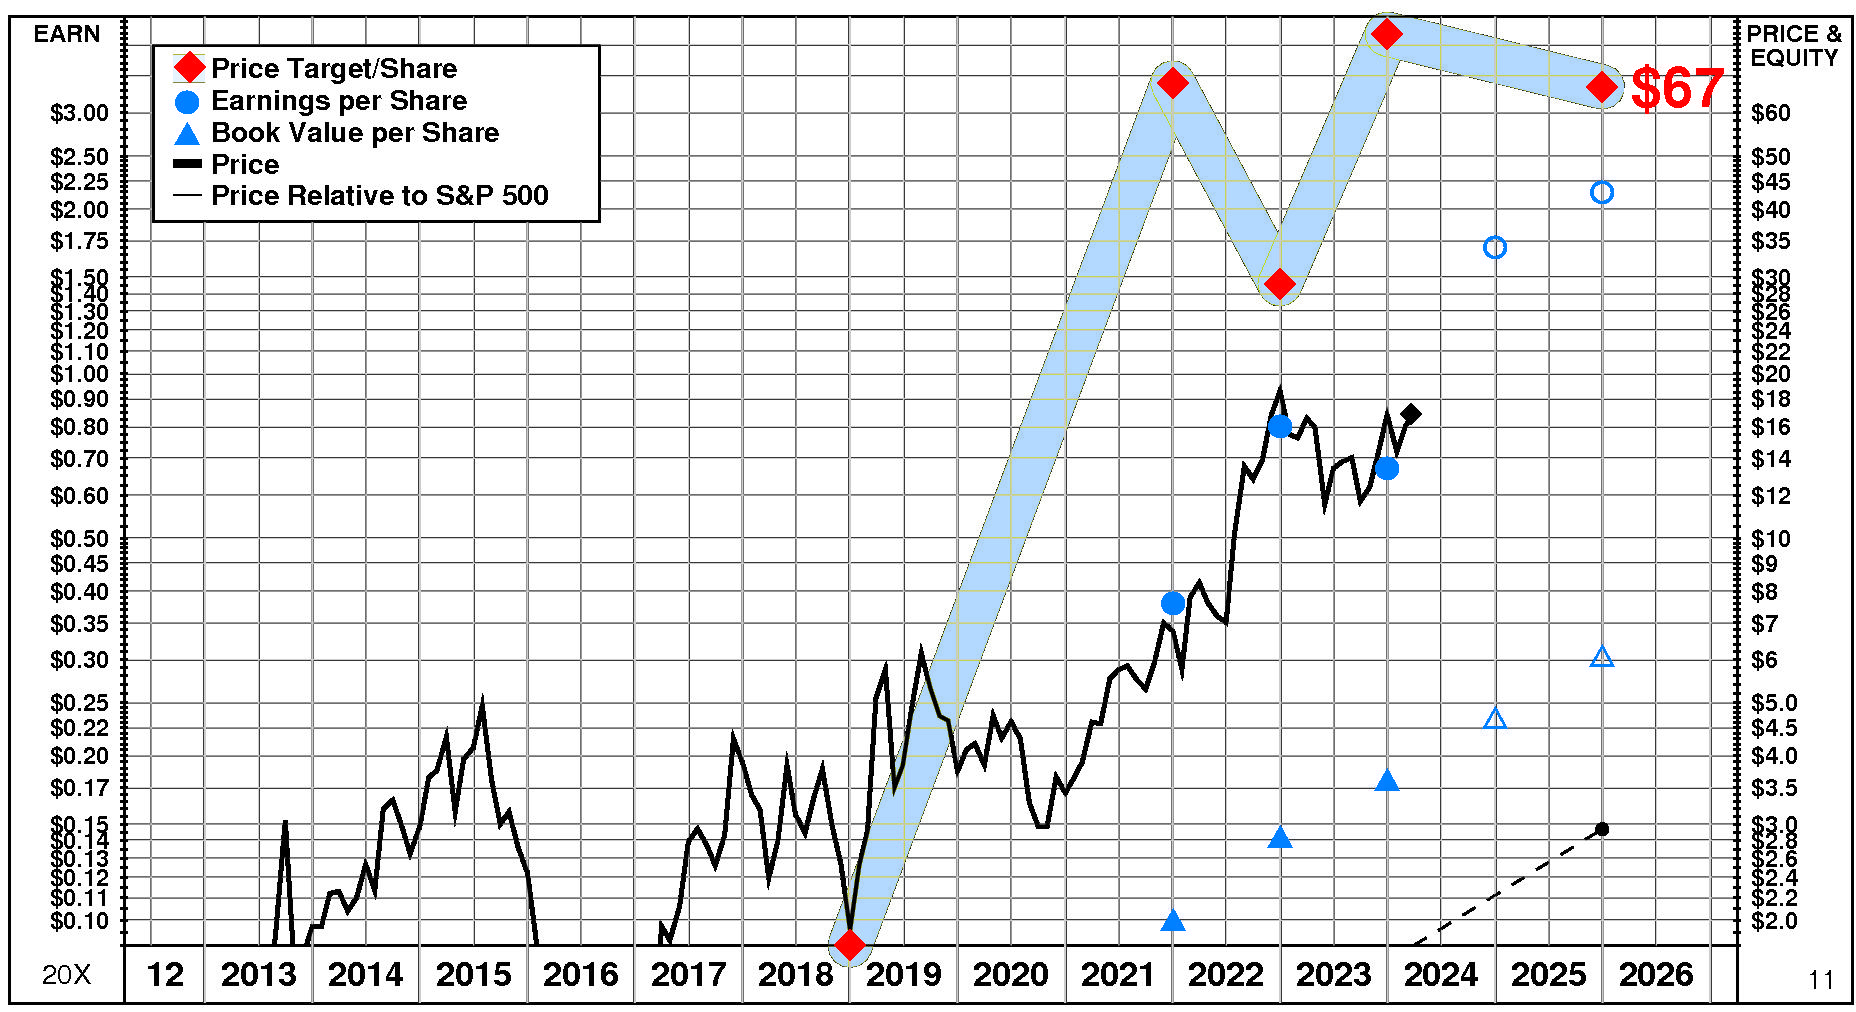
PRICE HISTORY
Over the full time period, Catalyst Pharmaceutical’s stock price performance has been volatile and exceptional. Between May, 2013 and March, 2024, Catalyst Pharmaceutical’s stock price rose +1800%; relative to the market, this was a +493% gain. Significant price moves during the period: 1) January, 2022 – December, 2022: +223%; 2) October, 2020 – November, 2021: +136%; 3) December, 2018 – April, 2019: +199%; 4) May, 2016 – November, 2017: +599%; 5) July, 2015 – May, 2016: -88%; and 6) October, 2013 – September, 2014: +105%.
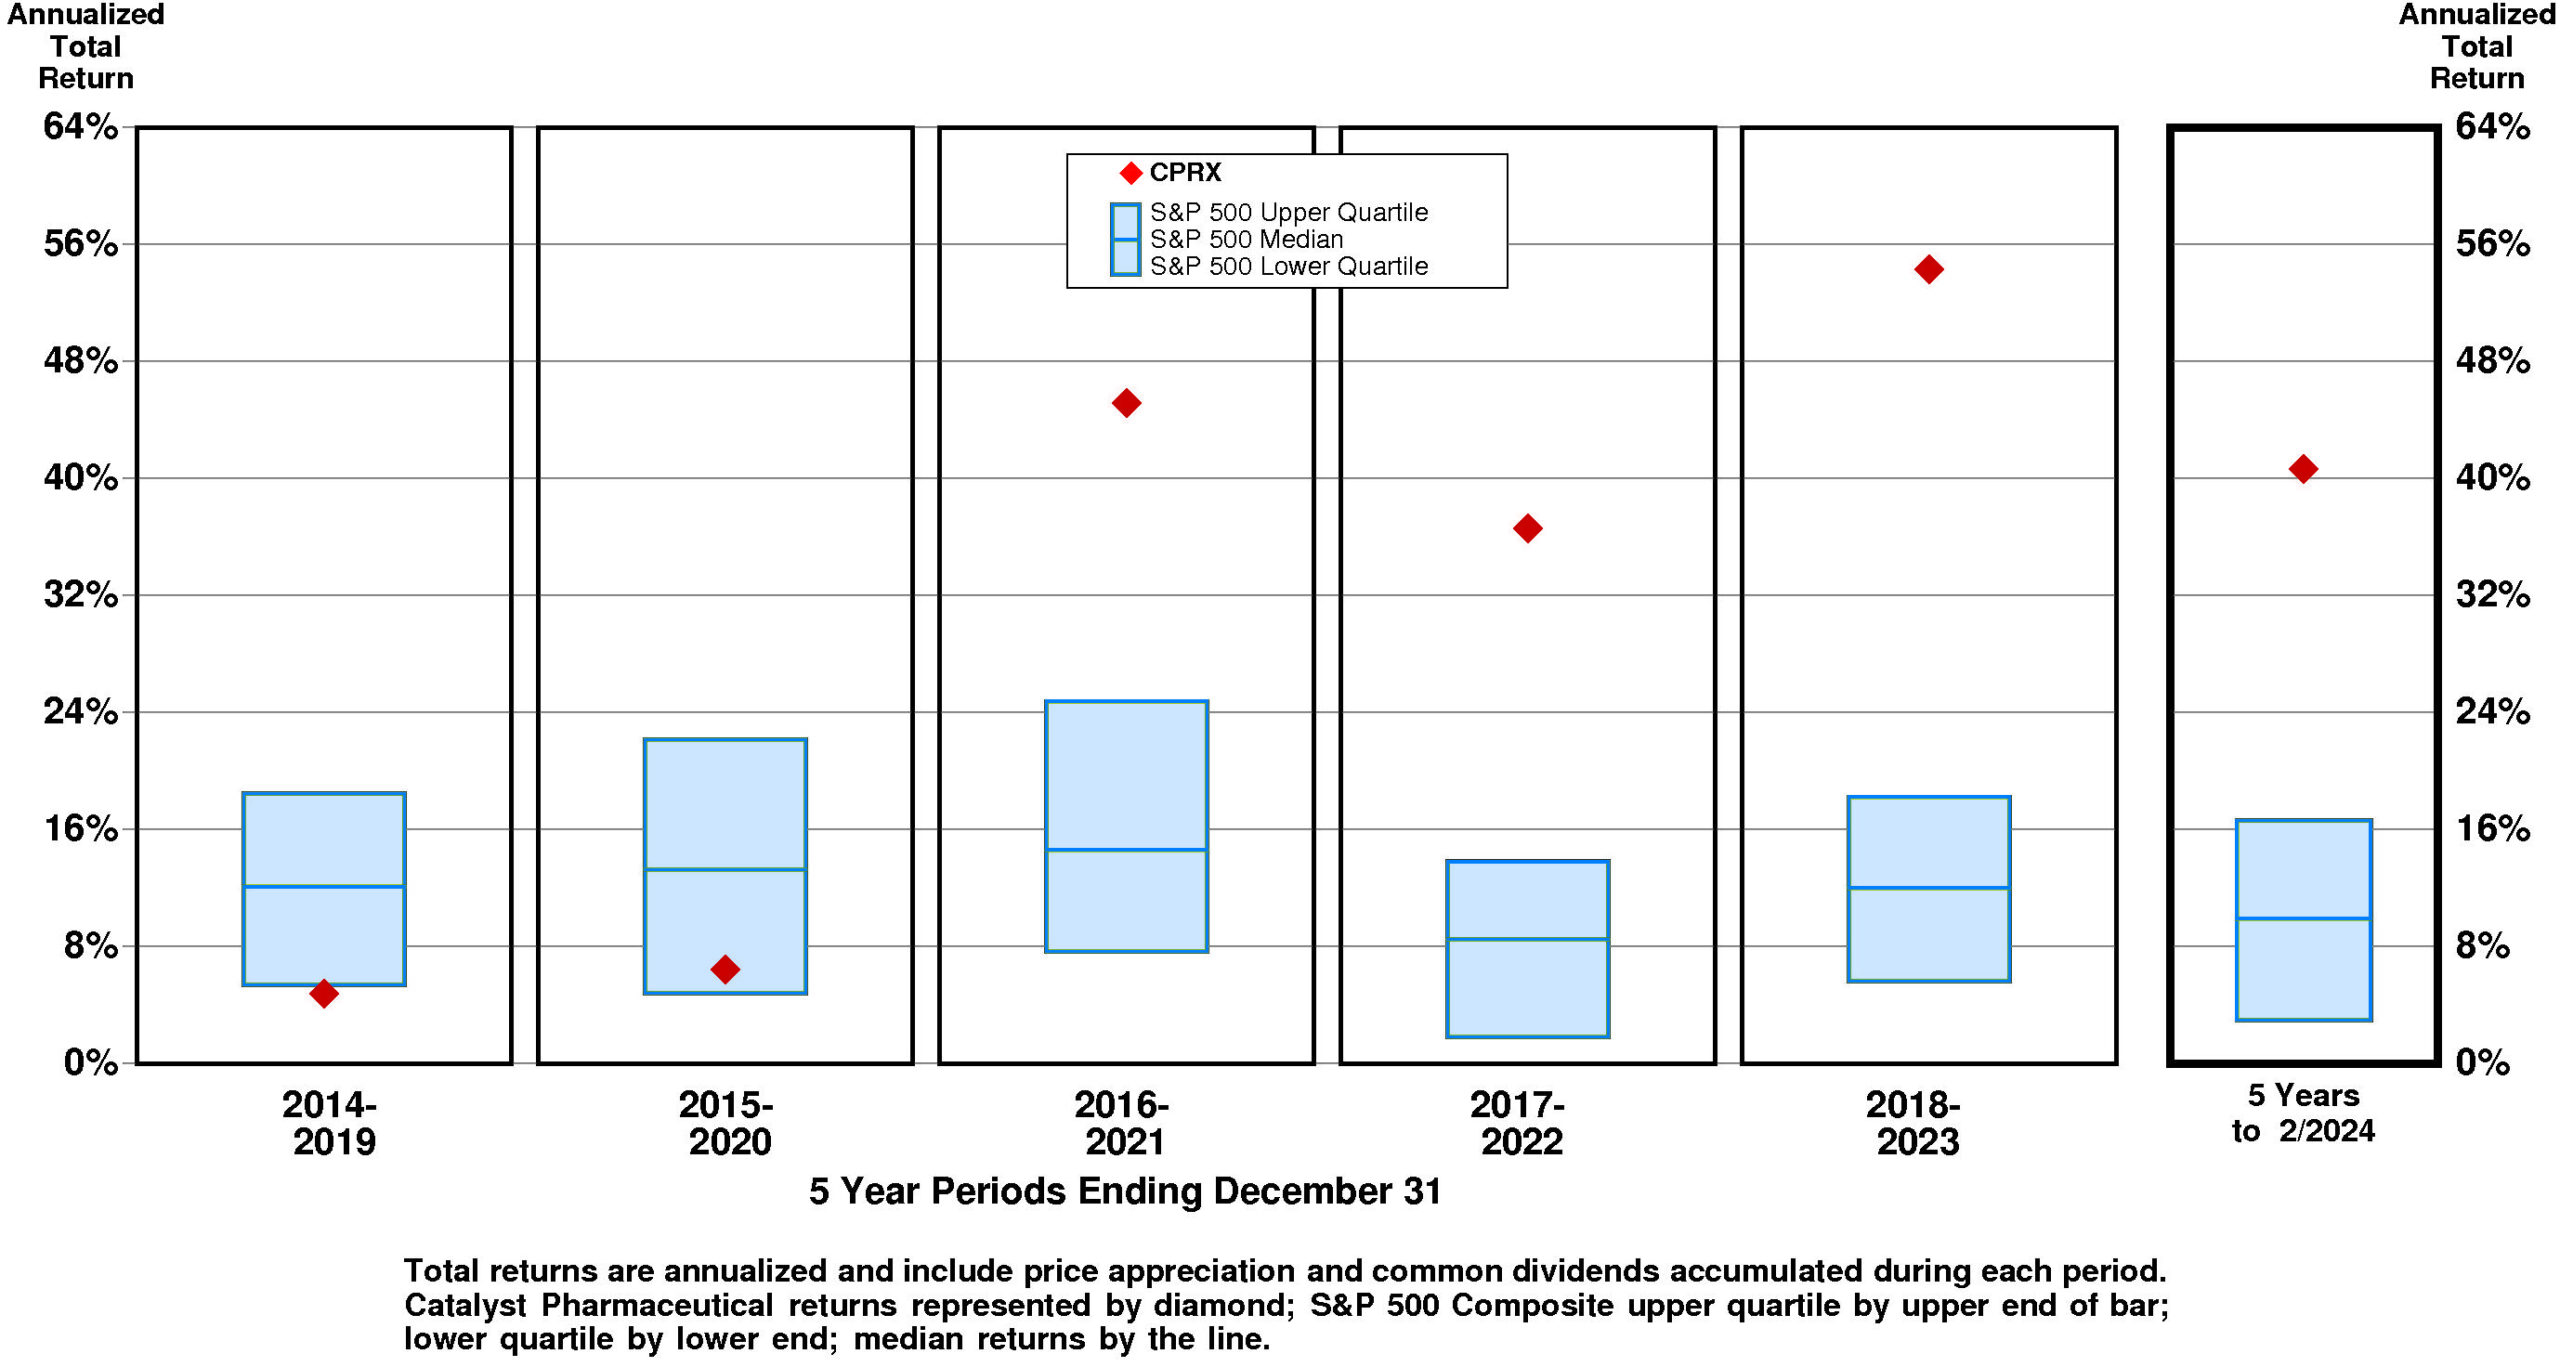
TOTAL INVESTMENT RETURNS
Current annual total return performance of 5.0% is below median relative to the S&P 500 Composite.
In addition to being below median relative to S&P 500 Composite, current annual total return performance through February, 2024 of 5.0% is lower quartile relative to CPRX Peer Group.
Current 5-year total return performance of 40.7% is upper quartile relative to the S&P 500 Composite.
Through February, 2024, with upper quartile current 5-year total return of 40.7% relative to S&P 500 Composite, Catalyst Pharmaceutical’s total return performance is upper quartile relative to CPRX Peer Group.
VALUATION BENCHMARKS
Relative to S&P 500 Composite, CPRX’s overall valuation is normal. The highest factor, the ratio of enterprise value/assets, is upper quartile. Price/equity ratio is above median. Ratio of enterprise value/revenue is above median. Price/earnings ratio is above median. The lowest factor, the ratio of enterprise value/earnings before interest and taxes, is lower quartile.
Relative to Catalyst Pharmaceutical Peer Group, CPRX’s overall valuation is low. The highest factor, the ratio of enterprise value/assets, is above median. Ratio of enterprise value/revenue is below median. Price/earnings ratio is below median. Price/equity ratio is below median. The lowest factor, the ratio of enterprise value/earnings before interest and taxes, is lower quartile.
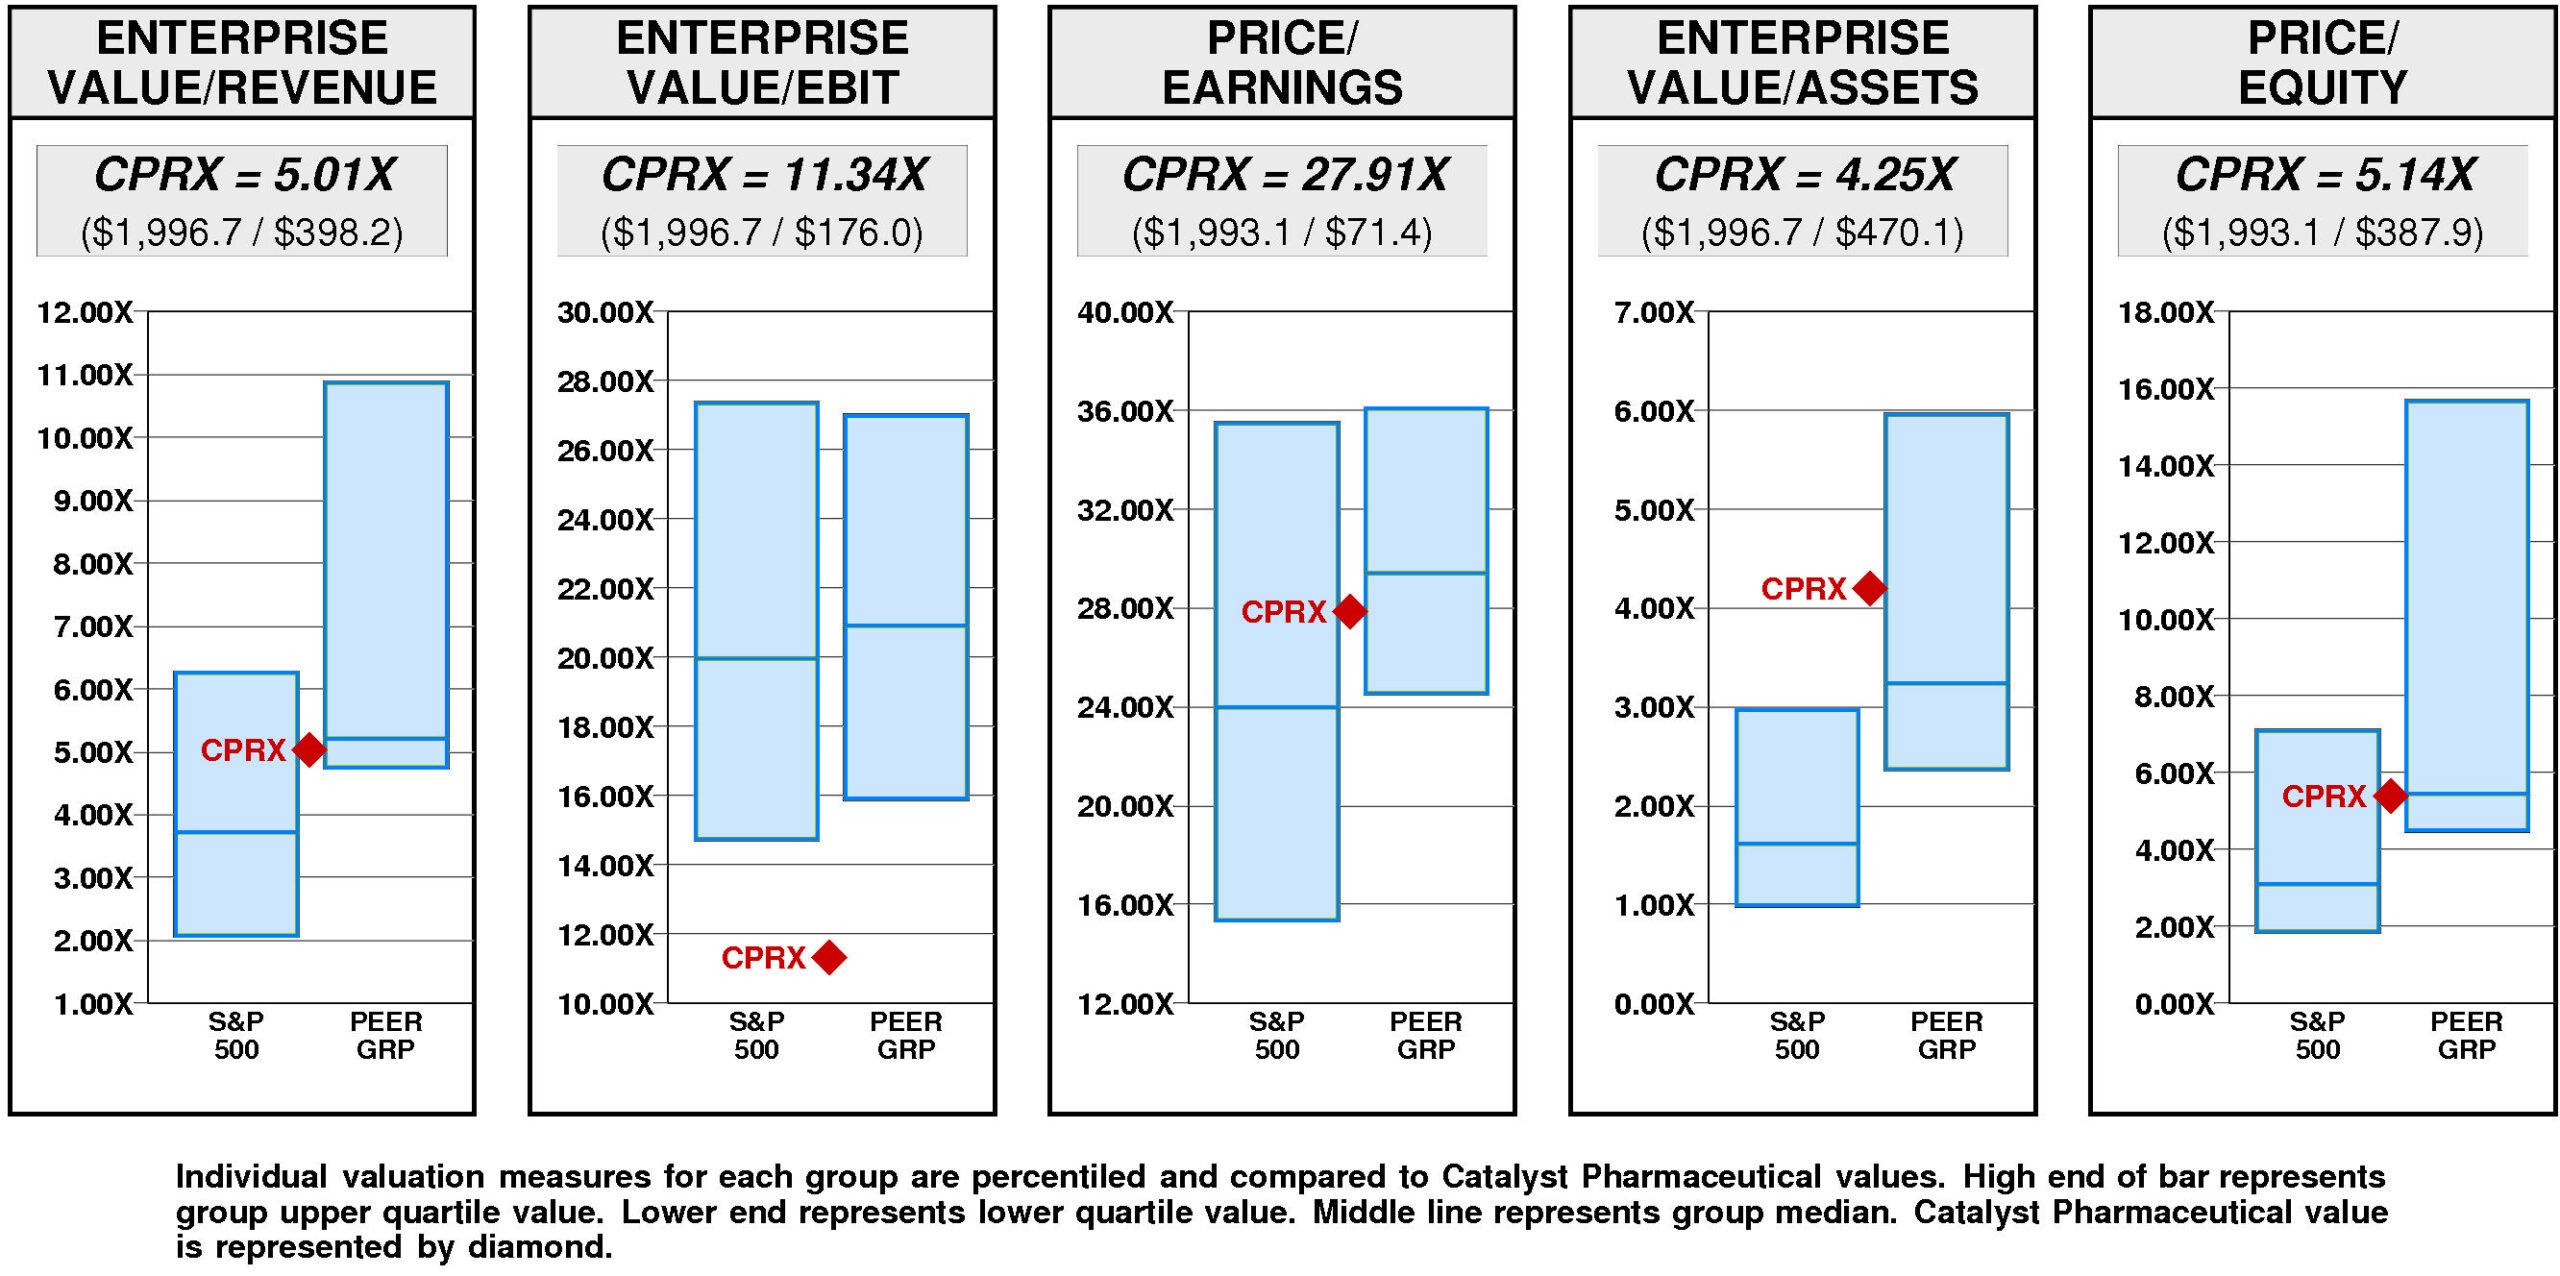
Catalyst Pharmaceutical has no value gap compared to the median valuation. For CPRX to rise to median valuation, its current ratio of enterprise value/revenue would have to rise from the current level of 5.01X to 5.21X. If CPRX’s ratio of enterprise value/revenue were to rise to 5.21X, its stock price would be lower by $1 to $18.
For CPRX to hit lower quartile valuation relative to the Catalyst Pharmaceutical Peer Group, its current ratio of enterprise value/revenue would have to fall from the current level of 5.01X to 4.75X. If CPRX’s ratio of enterprise value/revenue were to fall to 4.75X, its stock price would decline by $-1 from the current level of $17.
VALUE TARGETS
Reflecting future returns on capital that are forecasted to be above the cost of capital, CPRX is expected to continue to be a major Value Builder.
Catalyst Pharmaceutical’s current Price Target of $67 represents a +296% change from the current price of $16.91.
This very high appreciation potential results in an appreciation score of 93 (only 7% of the universe has greater appreciation potential.)
Reinforcing this high Appreciation Score of 93, the moderately high Power Rating of 65 contributes to an Value Trend Rating of A.
Catalyst Pharmaceutical’s current Price Target is $67 (-20% from the 2023 Target of $84 but +296% from the 03/20/24 price of $16.91). This fall in the Target is the result of a +51% increase in the equity base and a -47% decrease in the price/equity multiple. Each of the Value Drivers contributed to this decline in the price/equity multiple. The forecasted decline in return on equity has a very large negative impact on the multiple. The forecasted decline in growth also has a very large negative impact as did the increase in cost of equity.
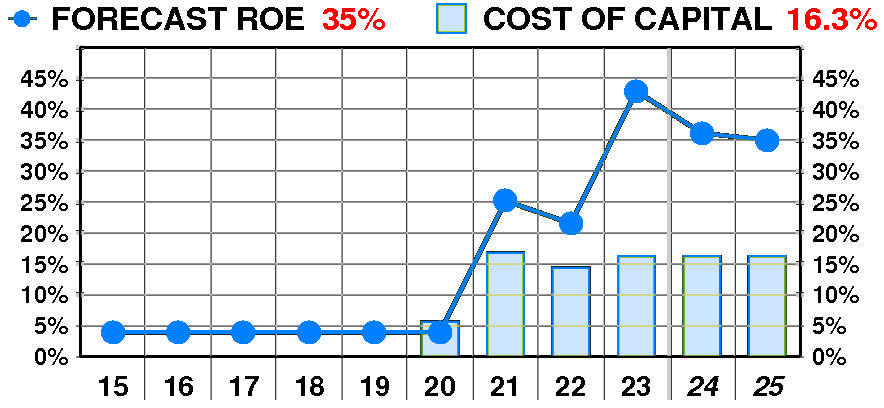
PTR’s return on equity forecast is 35.0% — below our recent forecasts. Forecasted return on equity enjoyed a dramatic, variable increase between 2015 and 2023. The current forecast is significantly above the 2020 low of 4%.
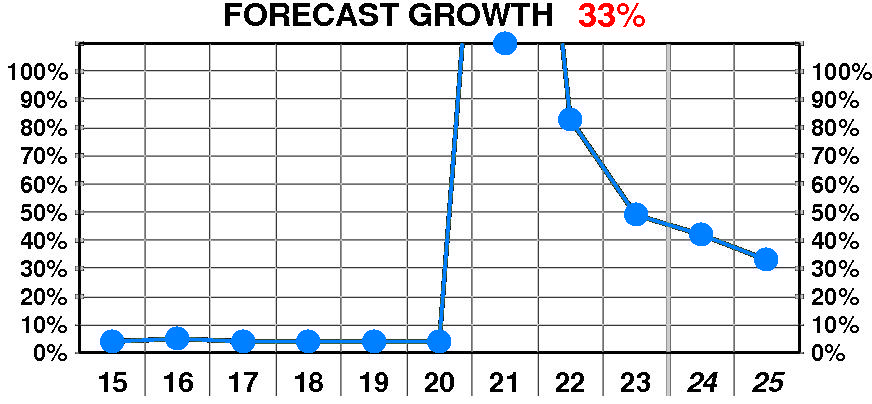
PTR’s growth forecast is 33.0% — significantly below our recent forecasts. Forecasted growth enjoyed a dramatic, erratic increase between 2015 and 2023. The current forecast is significantly below the 2021 peak of 306%.
PTR’s cost of equity forecast is 16.3% — in line with recent levels. Forecasted cost of equity suffered a dramatic, erratic increase between 2020 and 2023. The current forecast is significantly above the 2020 low of 5.6%.
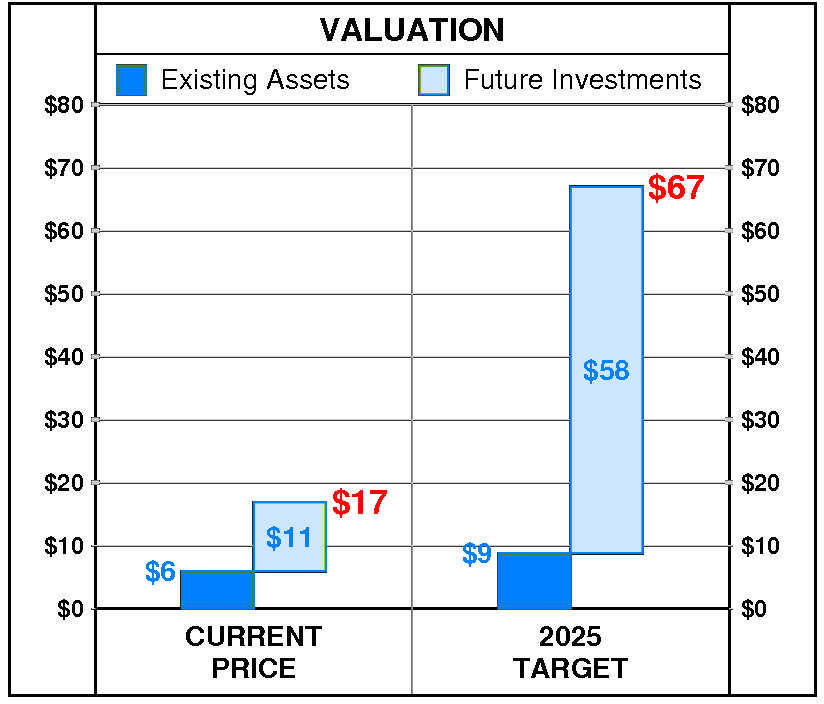
At Catalyst Pharmaceutical’s current price of $16.91, investors are placing a positive value of $11 on its future investments. This view is consistent with the company’s most recent performance that reflected a growth rate of 49.0% per year, and a return on equity of 42.9% versus a cost of equity of 16.3%.
PTR’s 2025 Price Target of $67 is based on these forecasts and reflects an estimated value of existing assets of $9 and a value of future investments of $58.
Be the first to comment