
BUSINESS
Redwood Trust, Inc., together with its subsidiaries, operates as a specialty finance company in the United States. The company operates through three segments: Residential Mortgage Banking, Business Purpose Mortgage Banking, and Investment Portfolio. The Residential Mortgage Banking segment operates a mortgage loan conduit that acquires residential loans from third-party originators for subsequent sale, securitization, or transfer to its investment portfolio. This segment also offers derivative financial instruments to manage risks associated with residential loans. The Business Purpose Mortgage Banking segment operates a platform that originates and acquires business purpose loans, such as single-family rental and bridge loans for subsequent securitization, sale, or transfer into its investment portfolio.
INVESTMENT RATING
With future capital returns forecasted to exceed the cost of capital, RWT is expected to continue to be a Value Builder.
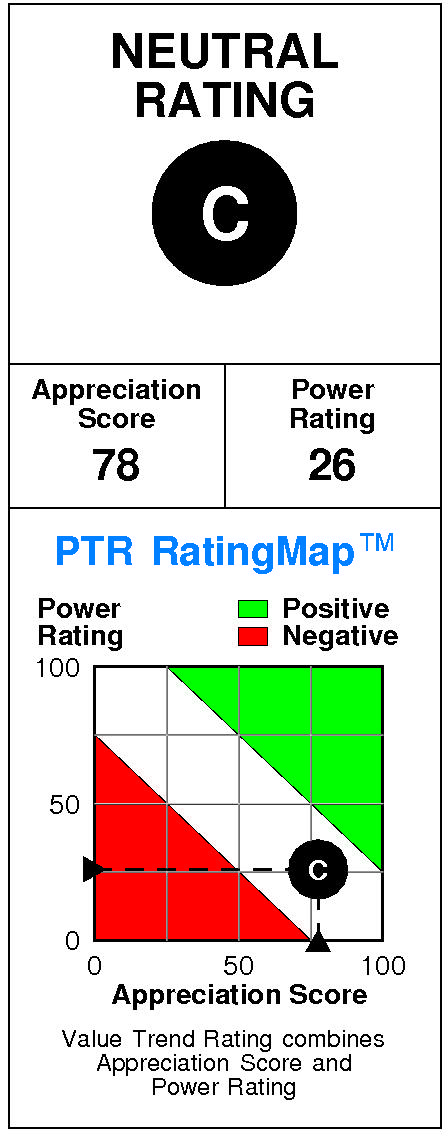
Redwood Trust has a current Value Trend Rating of C (Neutral).
This rating combines very contradictory signals from two proprietary PTR measures of a stock's attractiveness. Redwood Trust has a good Appreciation Score of 78 but a poor Power Rating of 26, triggering the Neutral Value Trend Rating.
Redwood Trust's stock is selling well below targeted value.
The current stock price of $6.39 compares to targeted value 12 months forward of $16.
Redwood Trust's high appreciation potential results in an appreciation score of 78 (only 22% of the universe has greater appreciation potential.)
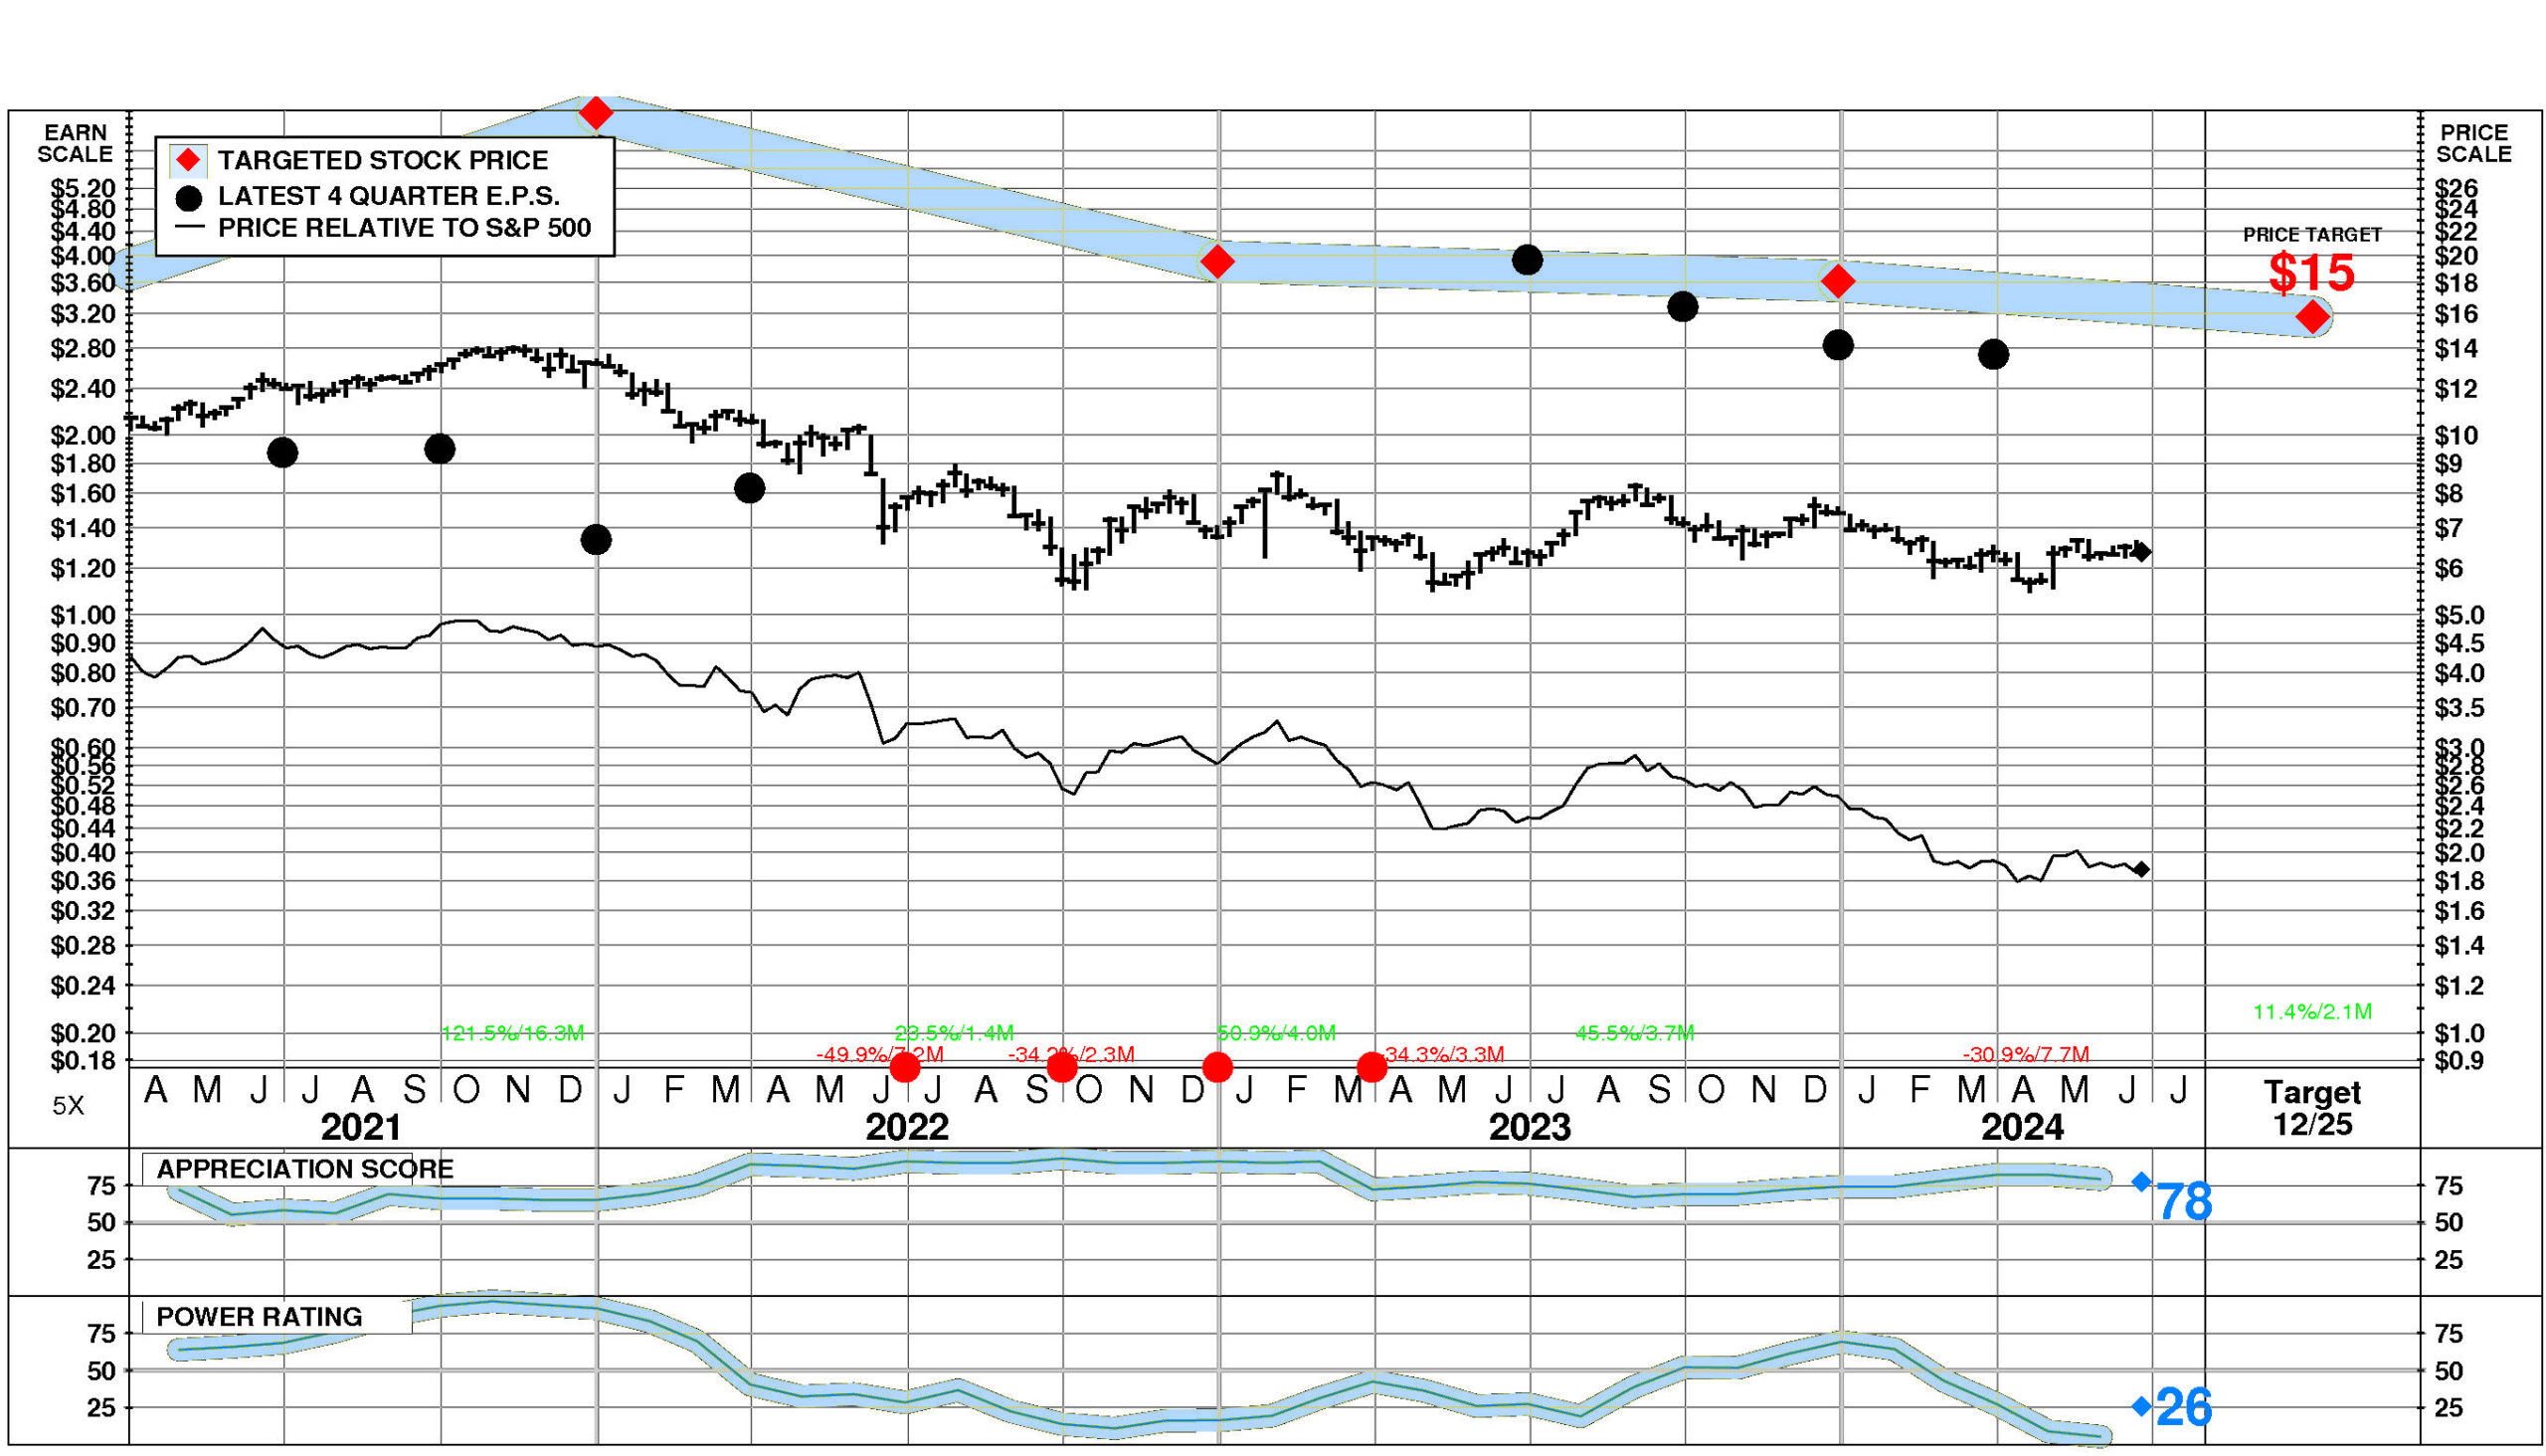
Redwood Trust has a Power Rating of 26.
(RWT's poor Power Rating indicates that it only has a higher likelihood of achieving favorable investment performance over the near to intermediate term than 26% of companies in the universe.)
Factors contributing to this poor Power Rating include: recent price action has been unfavorable; and the Real Estate Investment Trust comparison group is in a slightly weakened position currently. An offsetting factor is earnings estimate behavior for RWT has been slightly favorable recently.
INVESTMENT PROFILE
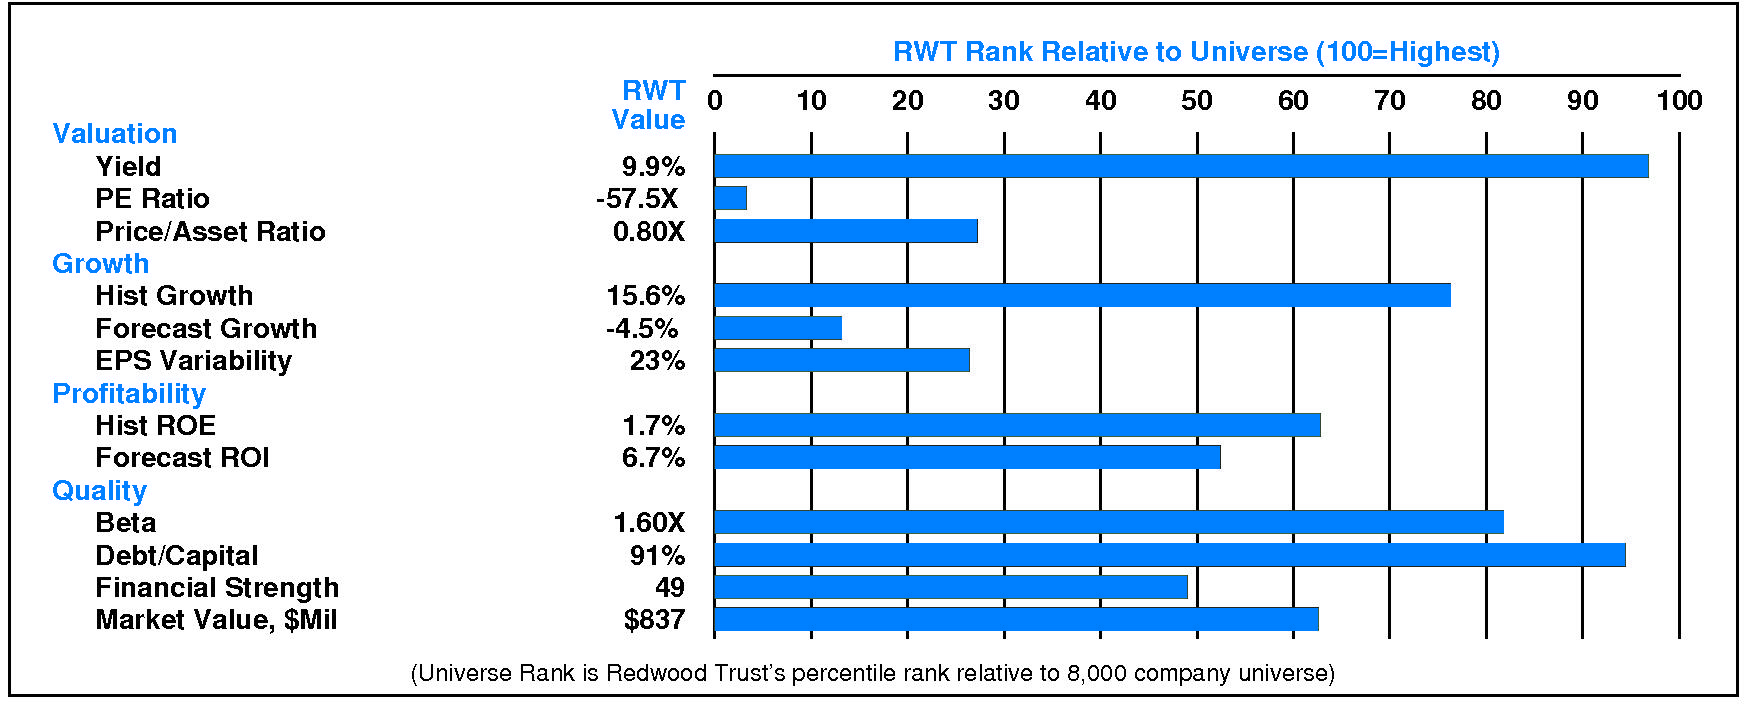
RWT's financial strength is average. Financial strength rating is 49.
Relative to the S&P 500 Composite, Redwood Trust Inc. has significant Value characteristics; its appeal is likely to be to investors heavily oriented toward Income; the perception is that RWT is higher risk.
All factors are relative weaknesses. Relative weaknesses for RWT include: low forecasted profitability, low historical profitability, low financial strength, high stock price volatility, high financial leverage, and low expected growth. RWT's valuation is low: high dividend yield, low P/E ratio, and low price/book ratio. RWT has unusually low market capitalization.
CURRENT SIGNALS
Redwood Trust's current operations are eroding.
Return on equity is falling, reflecting: falling asset utilization; declining pretax margin; and falling leverage.
Redwood Trust's current technical position is very weak.
The stock price is in a 7.7 month down move. The stock has declined 23.6% from its prior high. The stock price is below its 200 day moving average which is in a downtrend.
ALERTS
Recent small negative changes in fundamentals have impacted Redwood Trust Inc. (NYSE: RWT): significant quarterly sales deceleration occurred.
The stock is currently rated C.
On 6/24/24, Redwood Trust Inc. (NYSE: RWT) stock rose modestly by 0.9%, closing at $6.39. This advance was accompanied by normal trading volume. Relative to the market the stock has been weak over the last nine months and has declined -2.0% during the last week.
CASH FLOW
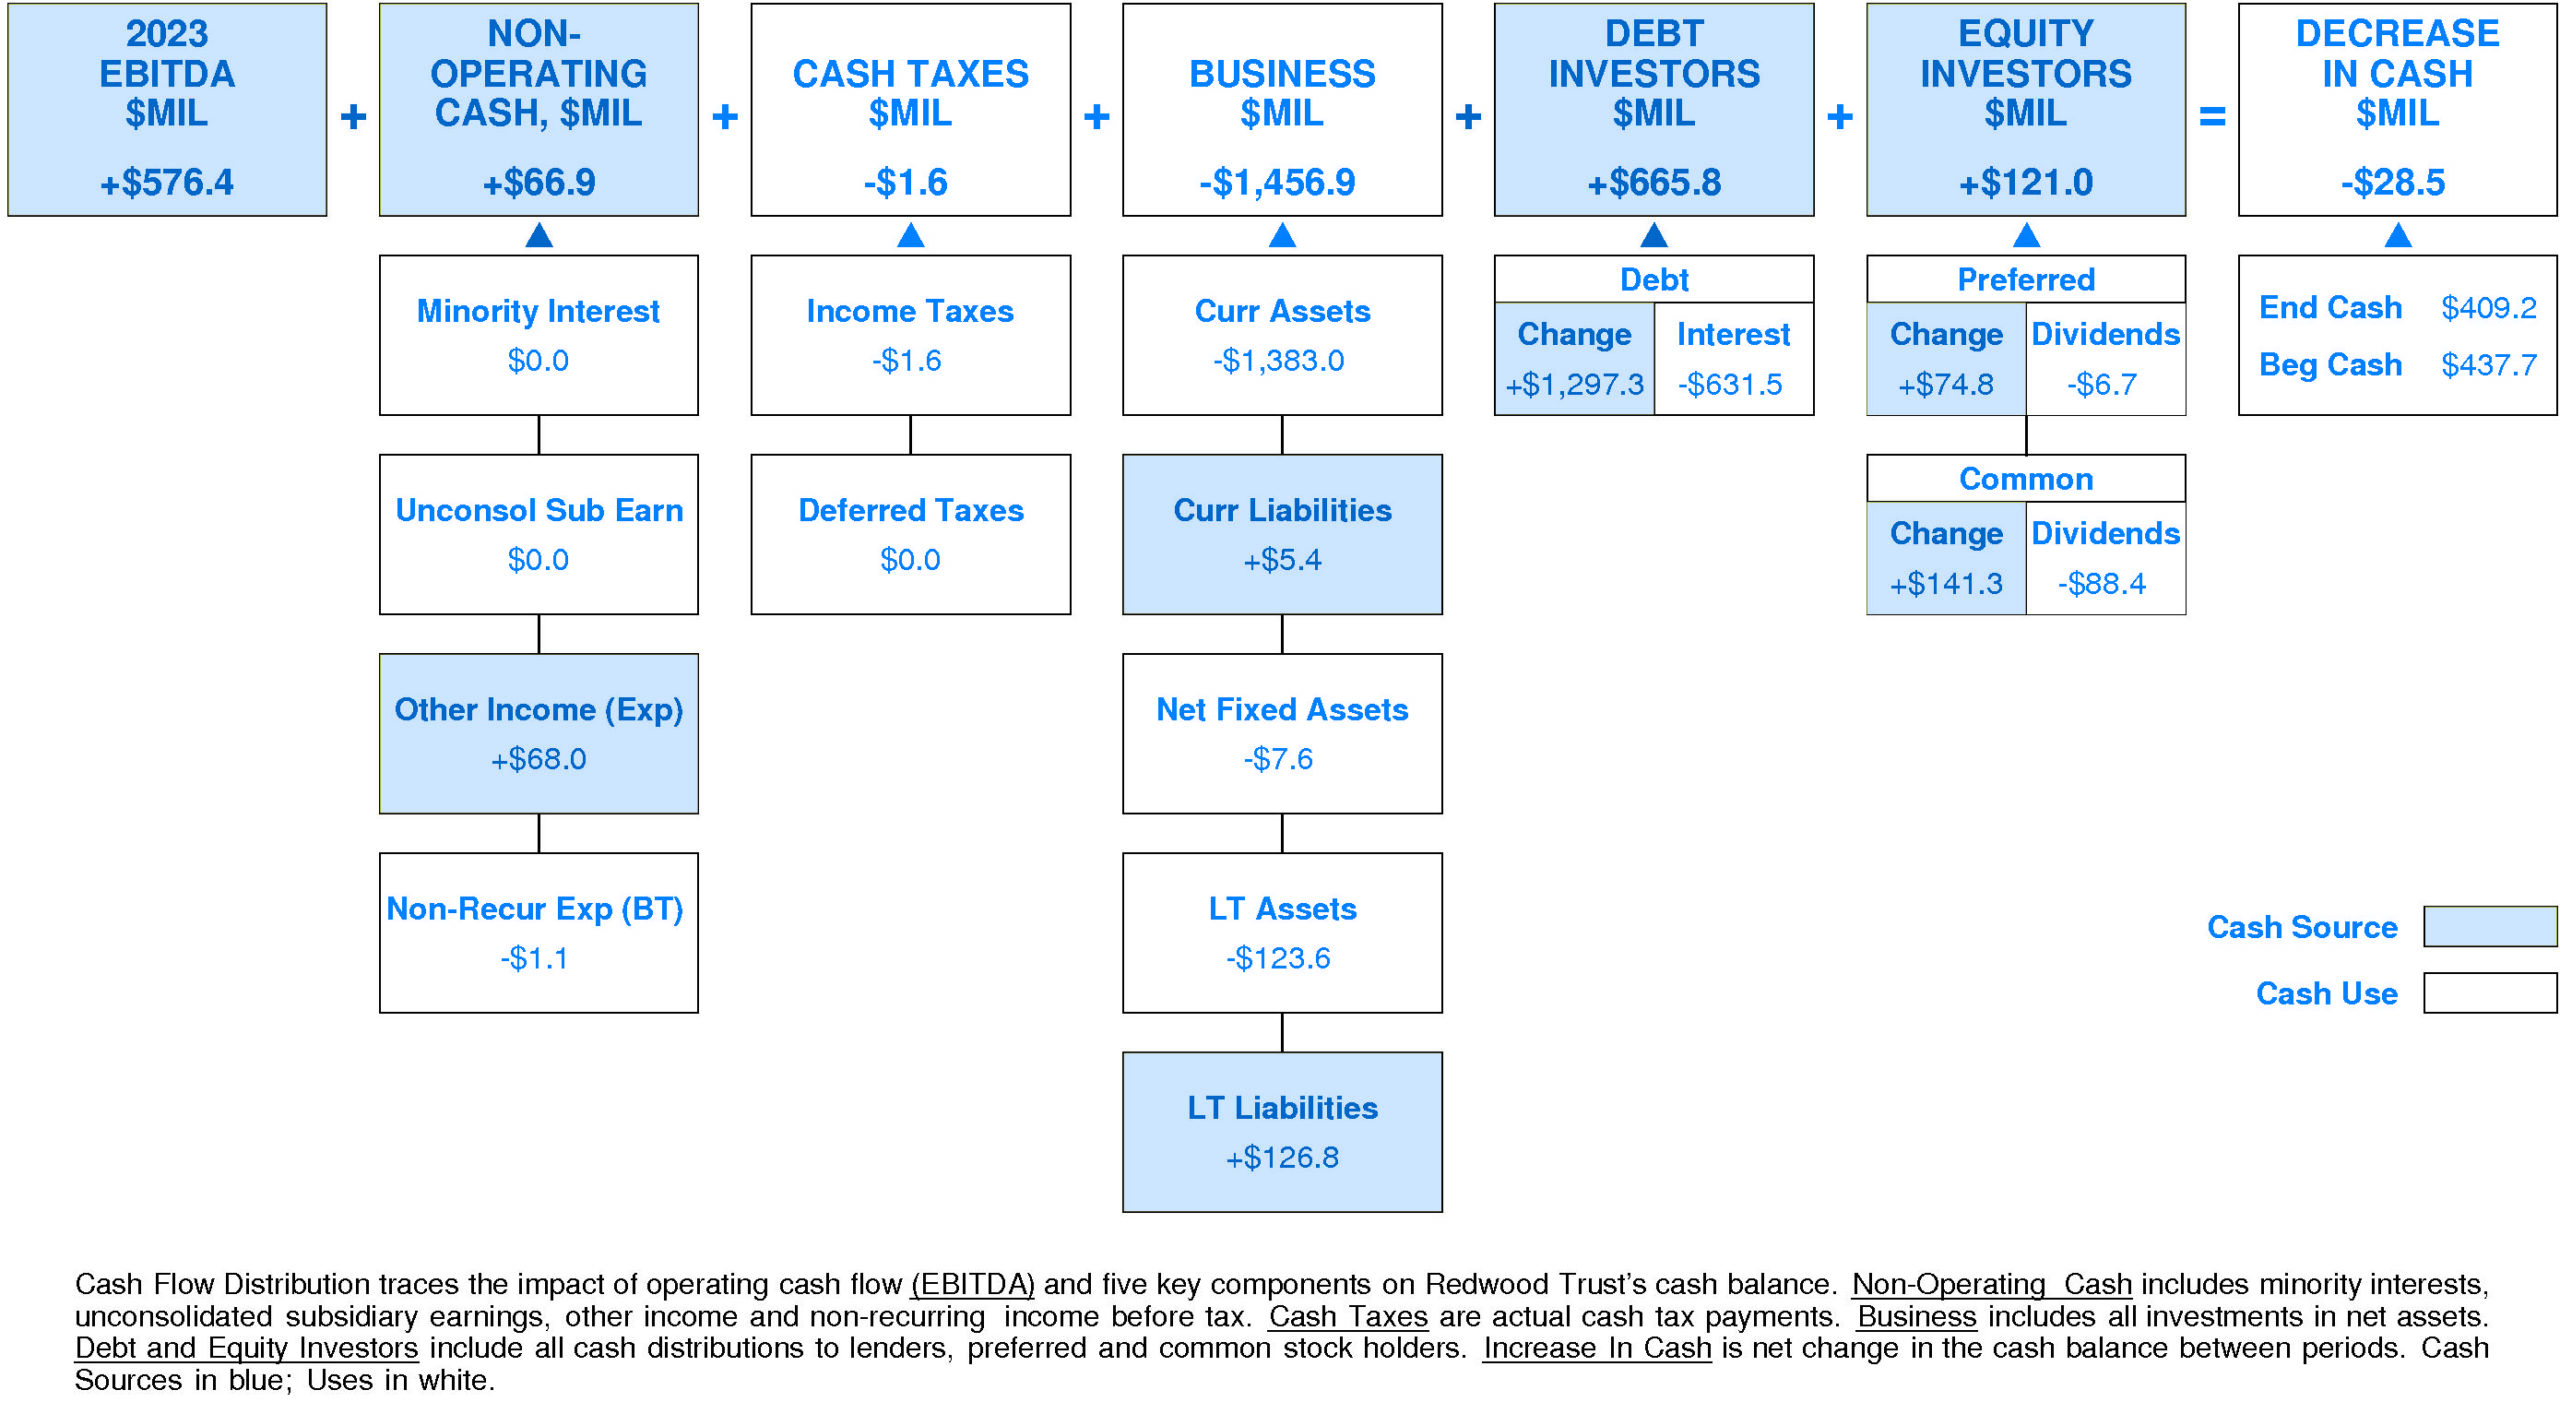
In 2023, Redwood Trust experienced a slight decrease in cash of -$28.5 million (-7%). Sources of cash were slightly lower than uses.
Cash generated from 2023 EBITDA totaled +$576.4 million. Non-operating sources contributed +$66.9 million (+12% of EBITDA). Cash taxes consumed -$1.6 million (-0% of EBITDA). Re-investment in the business amounted to -$1,456.9 million (-253% of EBITDA). On a net basis, debt investors supplied +$665.8 million (+116% of EBITDA) while equity investors supplied +$121.0 million (+21% of EBITDA).
Redwood Trust's Non-operating Income, %EBITDA has suffered a volatile overall downtrend over the period.
This downtrend was accompanied by a similar trend for the Redwood Trust Peer Group. In most years, Redwood Trust was in the top quartile. Currently, Redwood Trust is upper quartile at +12% of EBITDA (+$66.9 million).
Redwood Trust's Cash Taxes, %EBITDA has exhibited little to no overall change over the period.
This stability was accompanied by stability for the Redwood Trust Peer Group as well. In most years, Redwood Trust was in the second quartile and top quartile. Currently, Redwood Trust is at the upper quartile at -0% of EBITDA (-$1.6 million).
Redwood Trust's Business Re-investment, %EBITDA has enjoyed a volatile overall uptrend over the period.
This improvement was accompanied by a similar trend for the Redwood Trust Peer Group. In most years, Redwood Trust was in the lower quartile and top quartile. Currently, Redwood Trust is lower quartile at -253% of EBITDA (-$1,456.9 million).
Redwood Trust's Debt Investors, %EBITDA has experienced a volatile overall downtrend over the period.
This downtrend was accompanied by a similar trend for the Redwood Trust Peer Group. In most years, Redwood Trust was in the top quartile and lower quartile. Currently, Redwood Trust is above median at +116% of EBITDA (+$665.8 million).
Redwood Trust's Equity Investors, %EBITDA has enjoyed a very strong overall uptrend over the period.
This improvement was accompanied by stability for the Redwood Trust Peer Group. In most years, Redwood Trust was in the top quartile and lower quartile. Currently, Redwood Trust is upper quartile at +21% of EBITDA (+$121.0 million).
Redwood Trust's Change in Cash, %EBITDA has experienced a very strong overall downtrend over the period.
This downtrend was accompanied by a similar trend for the Redwood Trust Peer Group. In most years, Redwood Trust was in the top quartile and lower quartile. Currently, Redwood Trust is below median at -5% of EBITDA (-$28.5 million).
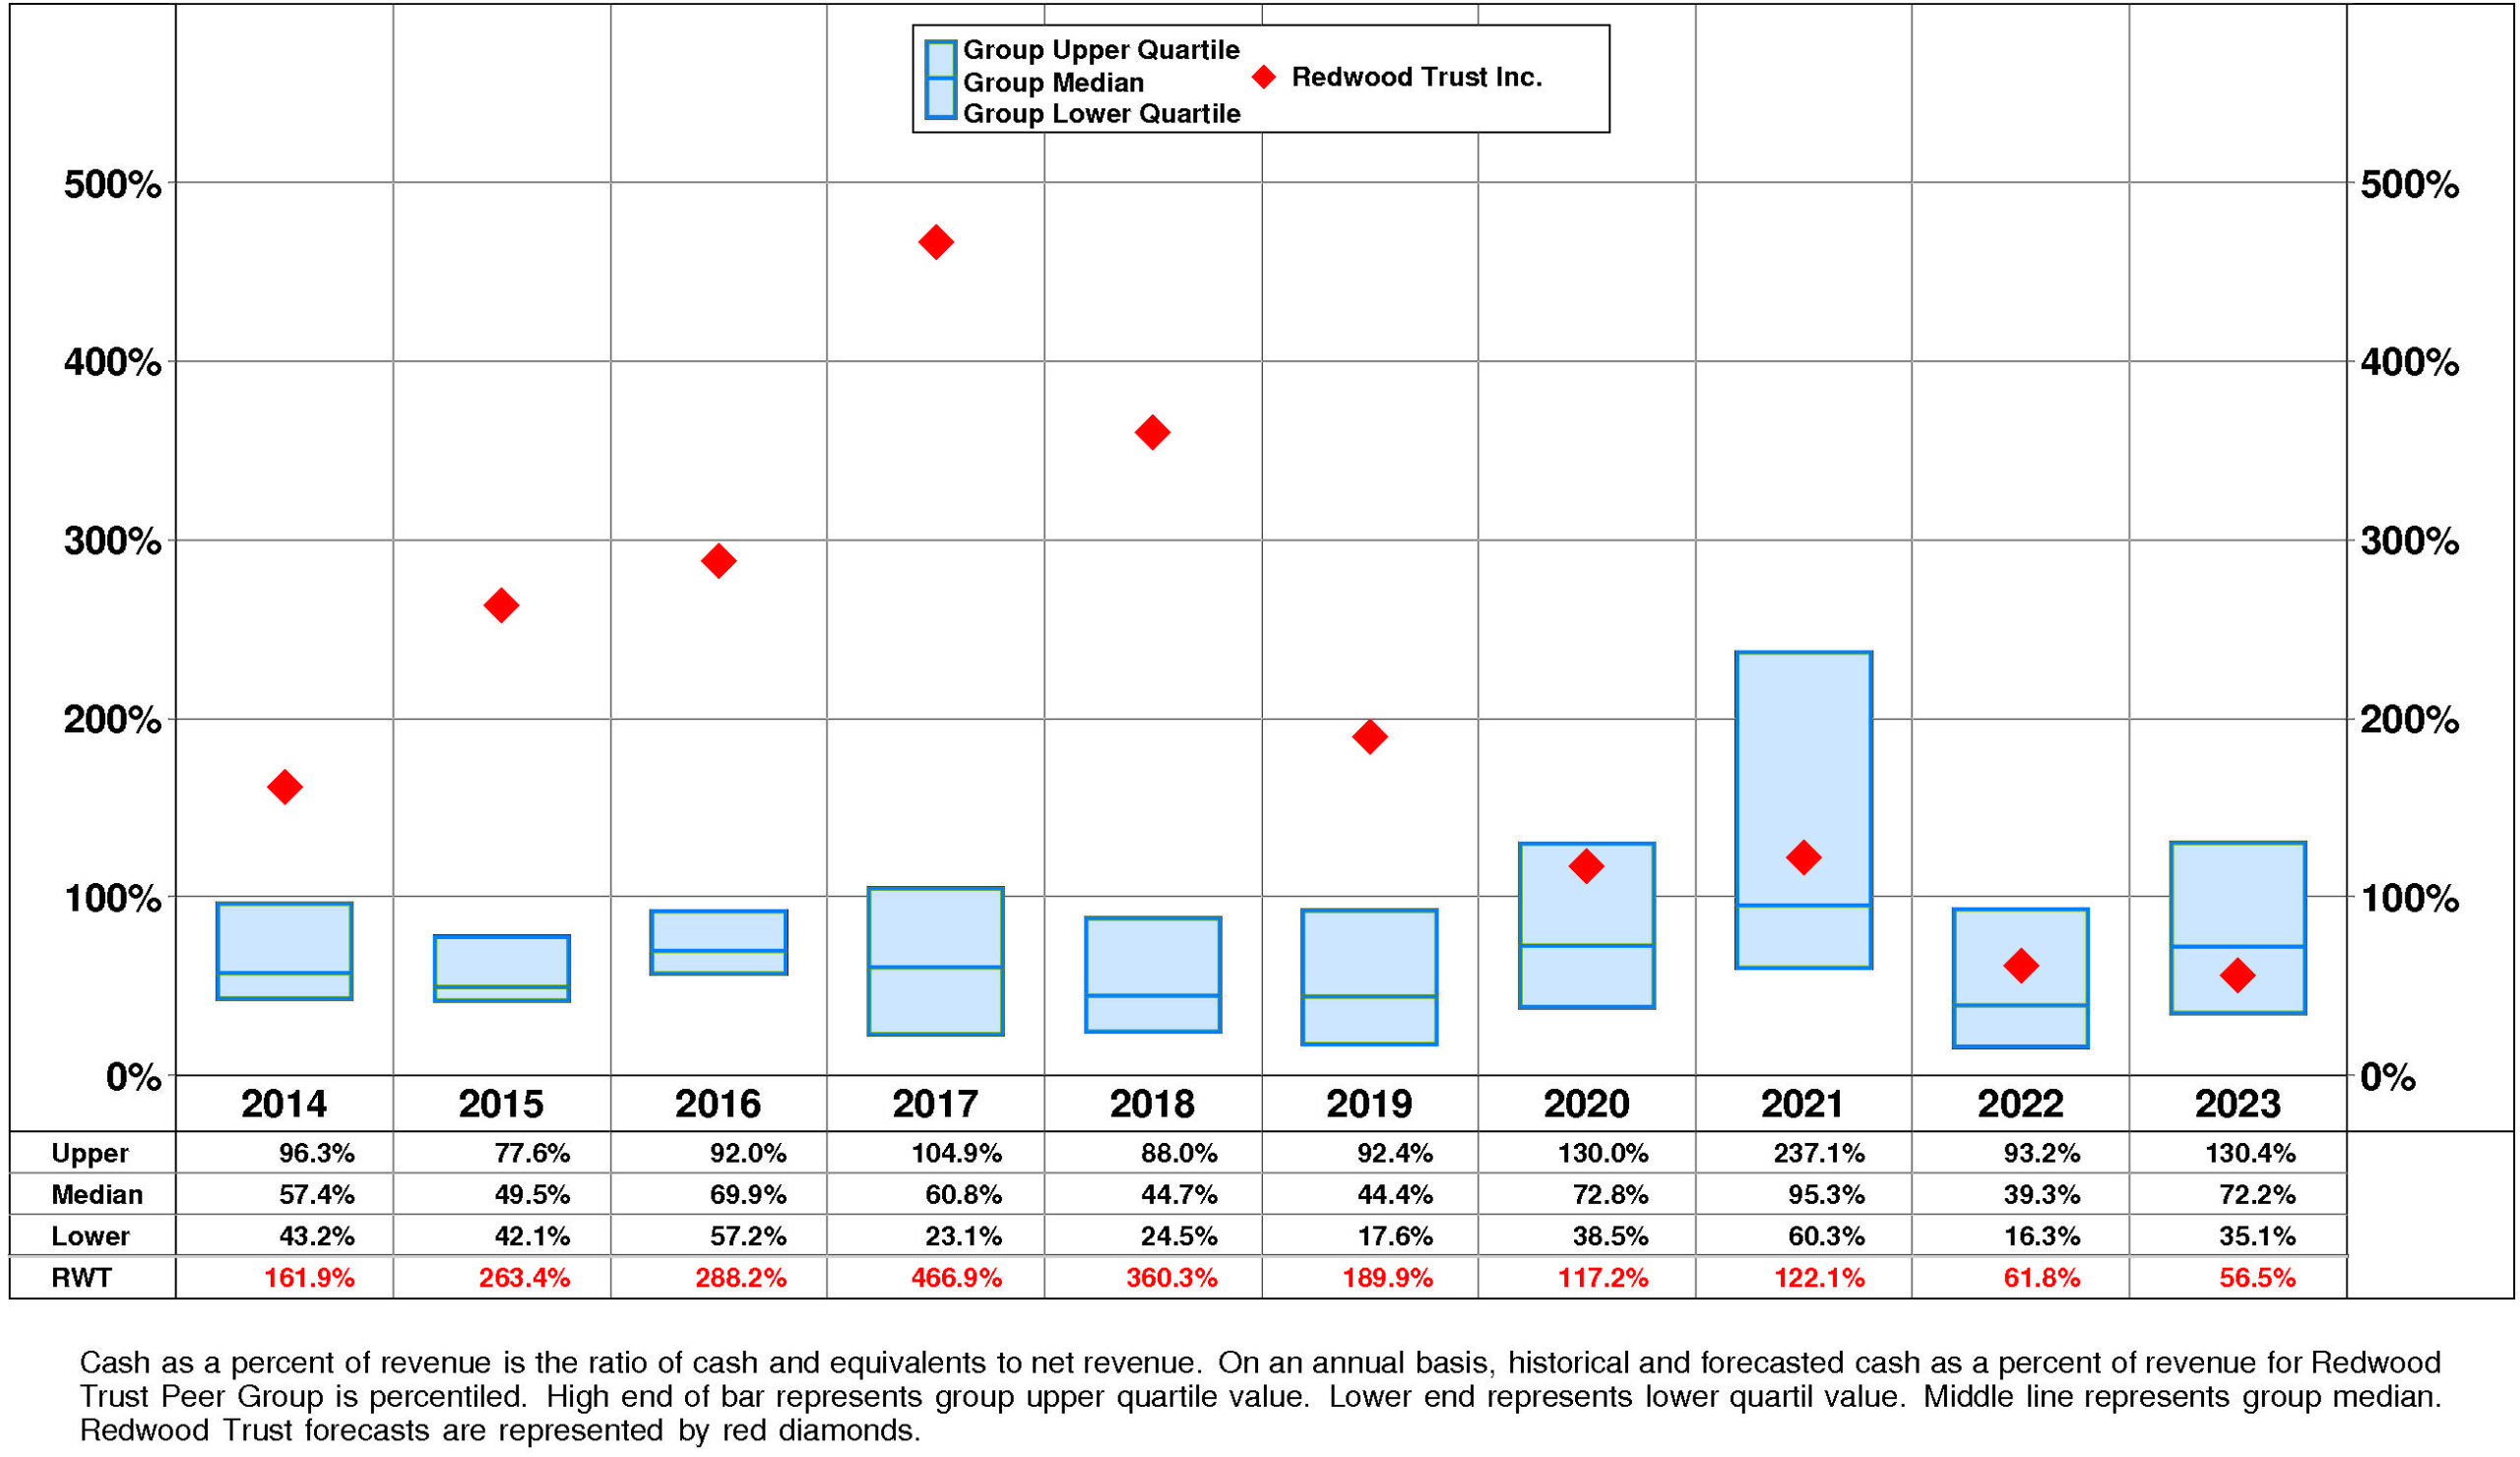
Redwood Trust's Cash, %Revenue has suffered a very strong overall downtrend over the period.
This downtrend was accompanied by an opposite trend for the Redwood Trust Peer Group. (Since 2017 Cash, %Revenue has accelerated very sharply.) In most years, Redwood Trust was in the top quartile and second quartile. Currently, Redwood Trust is below median at +56%.
PROFITABILITY
Redwood Trust's return on equity has eroded very significantly since 2014. The current level is 2.0% versus the high of 8.0% and the low of -52.4%.
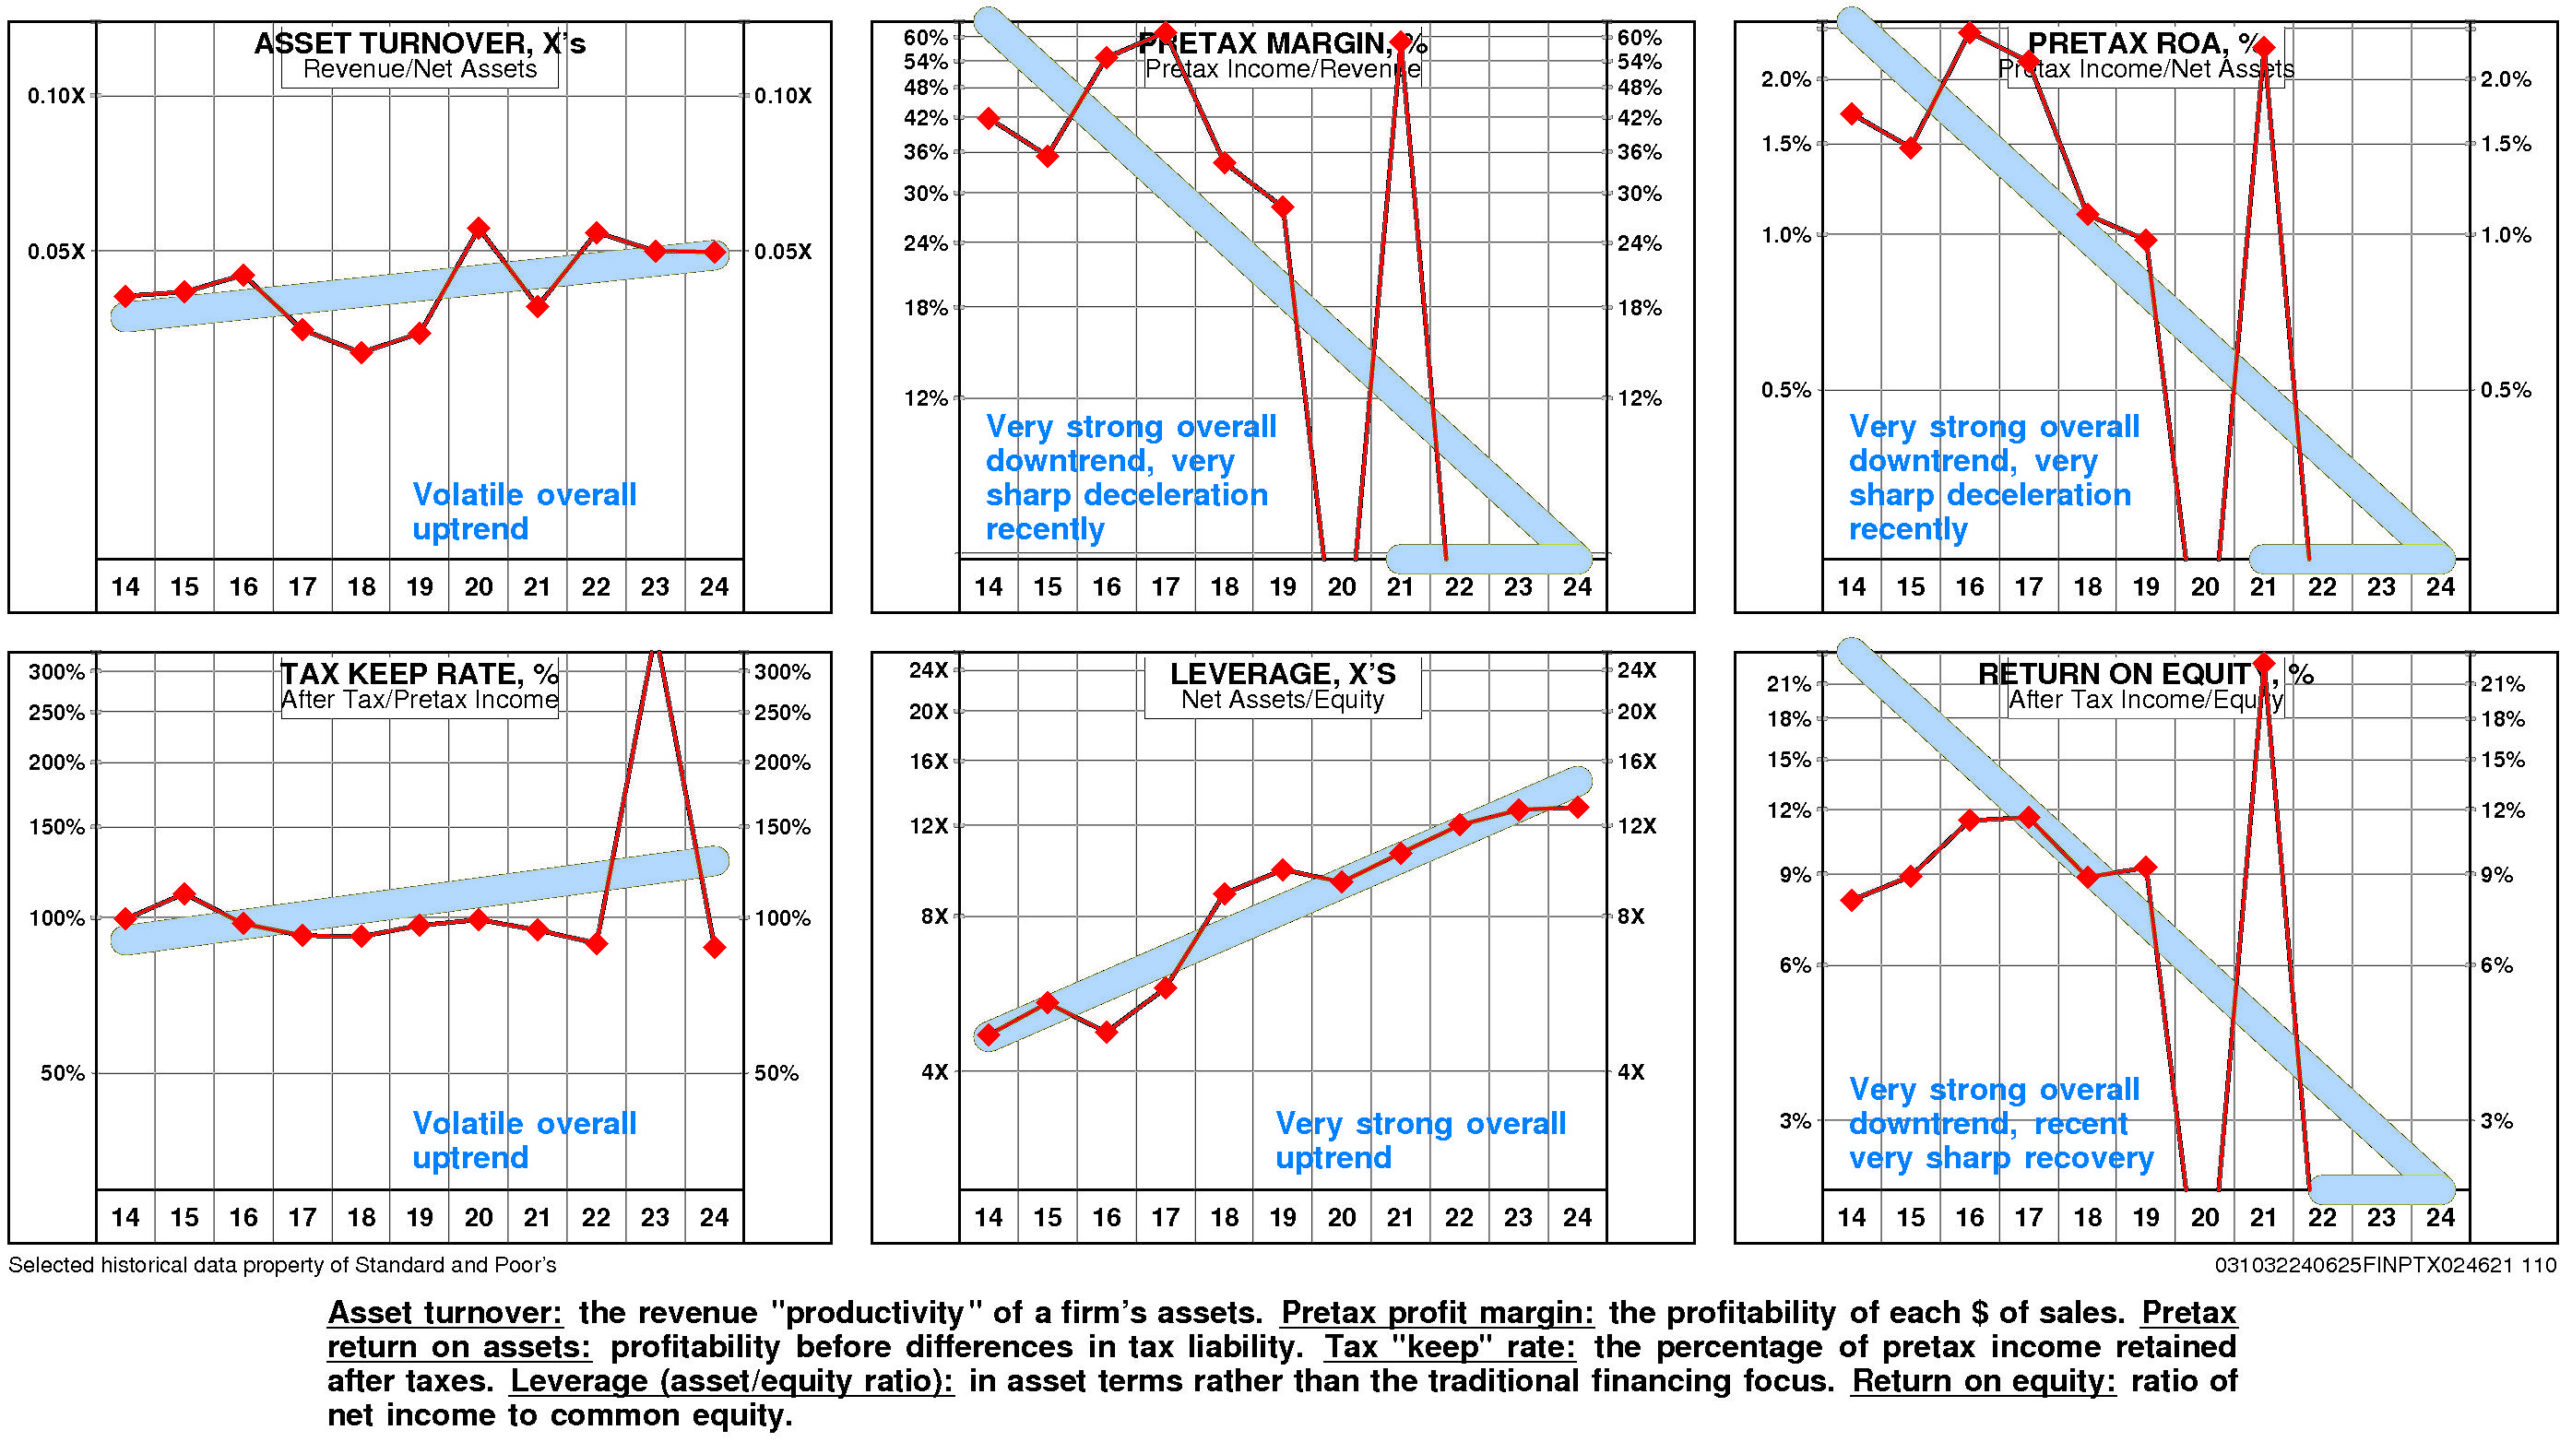
Redwood Trust's very strong negative trend in pretax operating return significantly augmented by a very strong negative trend in non-operating factors is a major performance consideration.
The productivity of Redwood Trust's assets rose over the full period 2014-2024: asset turnover has enjoyed a volatile overall uptrend.
More than offsetting this trend, however, pretax margin experienced a very strong overall downtrend that decelerated very sharply from the 2021 level.
Non-operating factors (income taxes and financial leverage) had a significant negative influence on return on equity.
Redwood Trust's return on equity is substantially below median (2.0%) for the four quarters ended March, 2024.
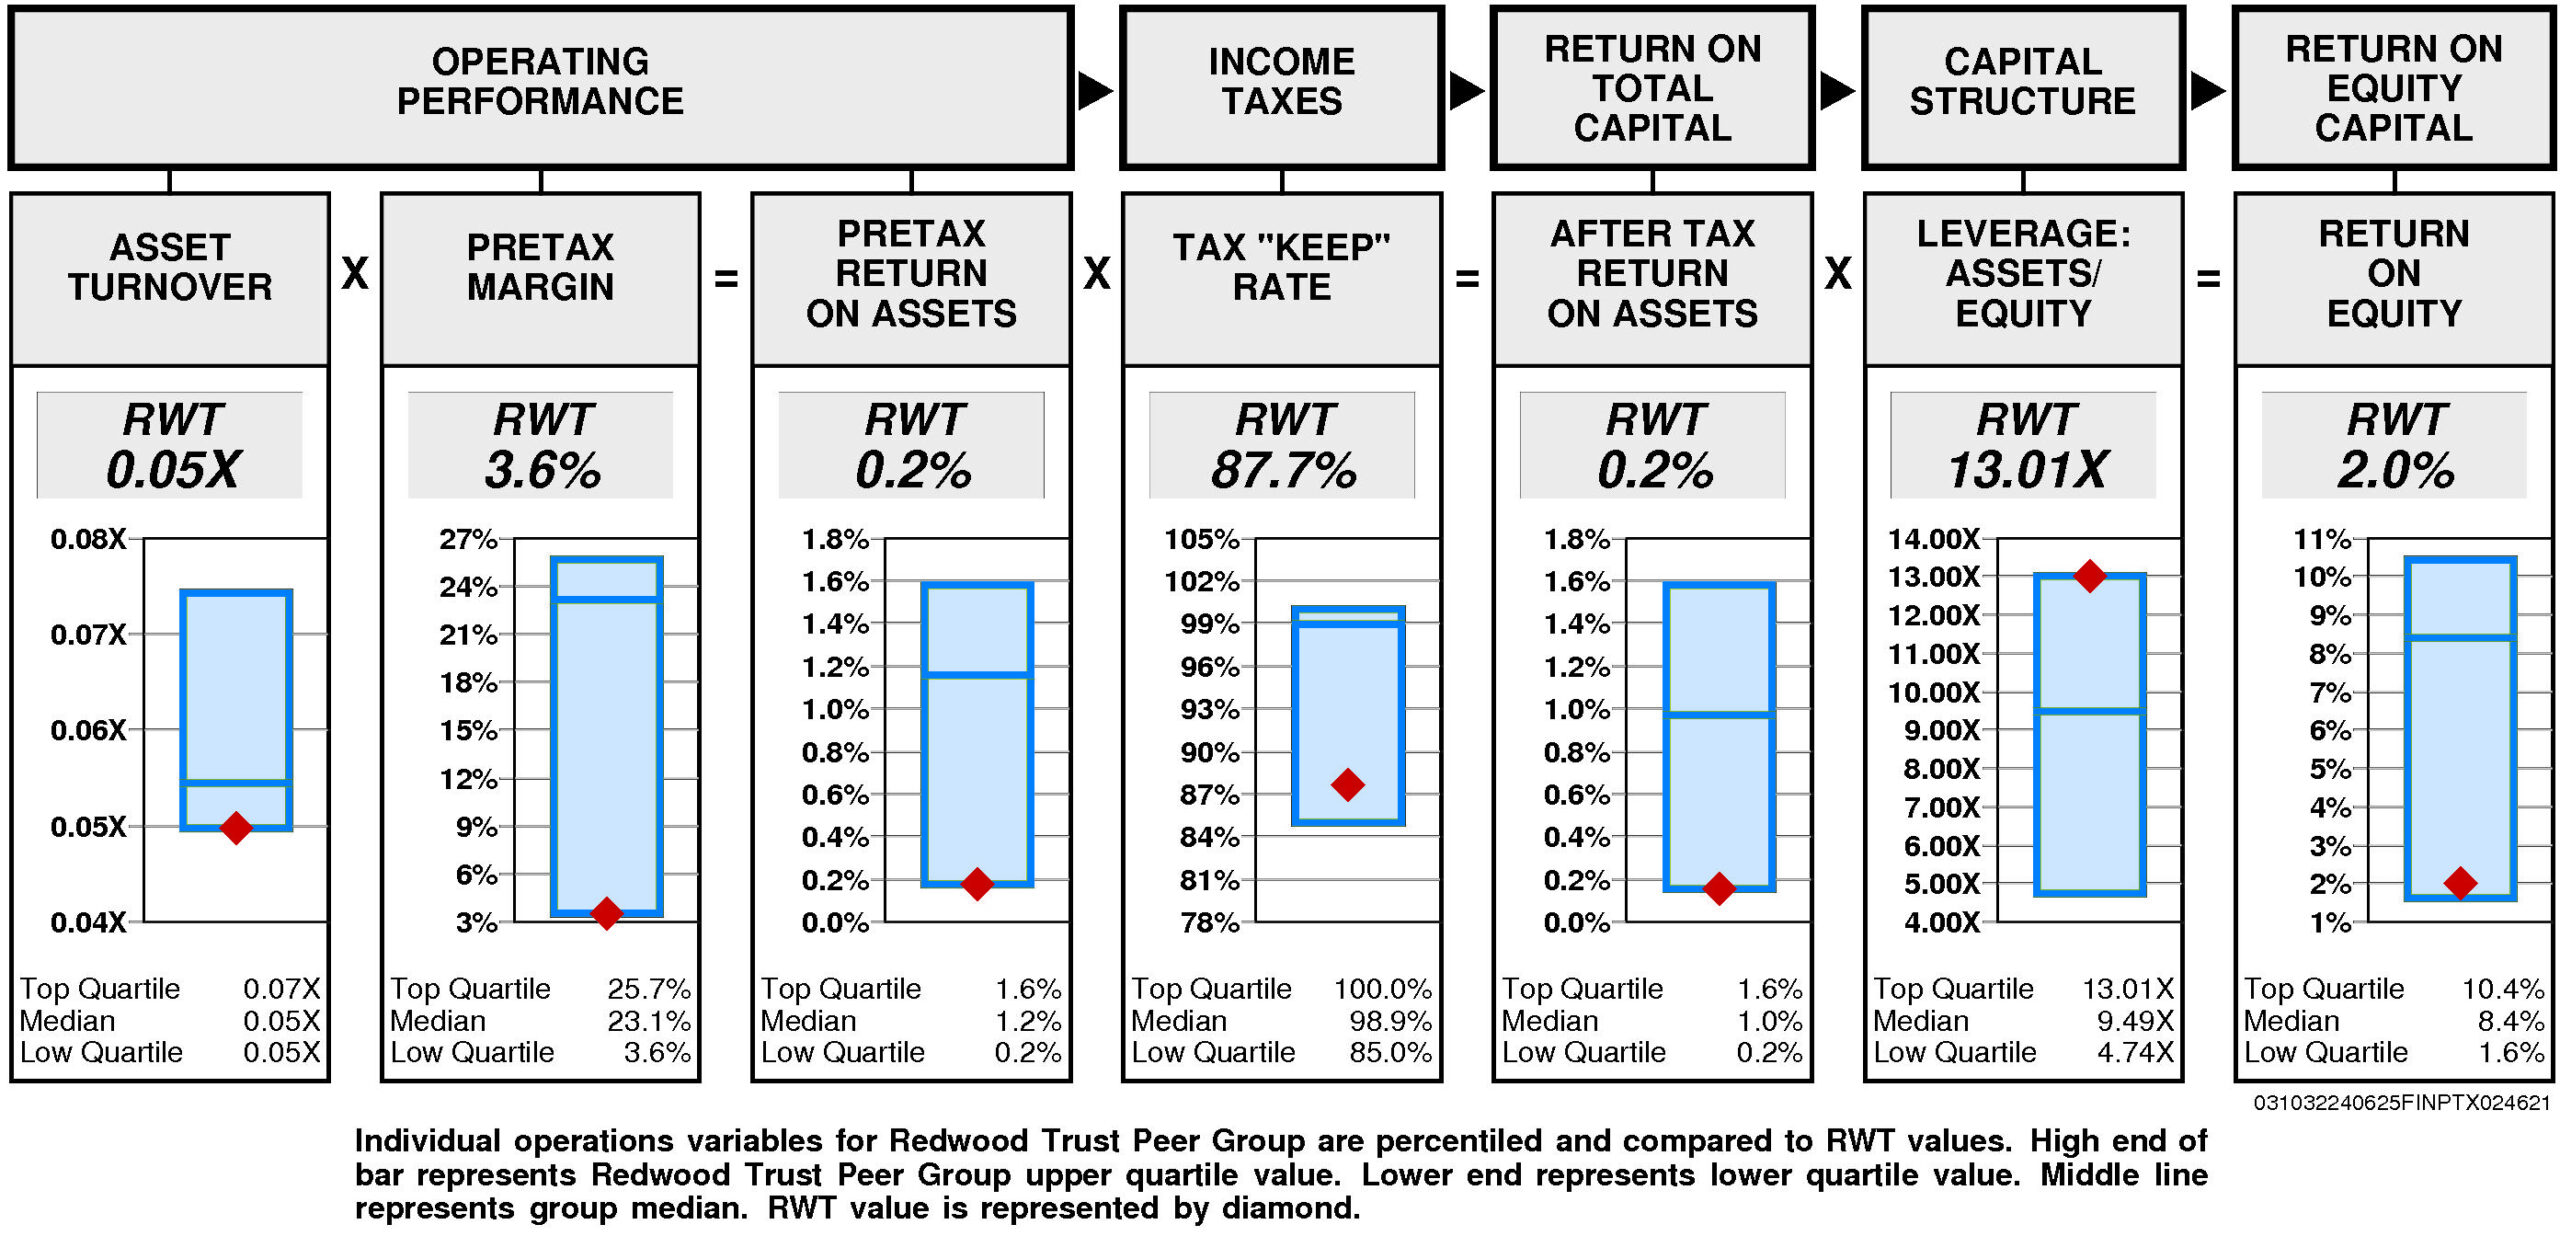
Operating performance (pretax return on assets) is at the lower quartile (0.2%) reflecting asset turnover that is at the lower quartile (0.05X) and pretax margin at the lower quartile (3.6%).
Tax “keep” rate (income tax management) is substantially below median (87.7%) resulting in after tax return on assets that is at the lower quartile.
Financial leverage (leverage) is at the upper quartile (13.01X).
GROWTH RATES
Overall, Redwood Trust's growth rate has slowed very considerably in recent years.
Redwood Trust's historical income statement growth has been in line with balance sheet growth. Revenue growth has paralleled asset growth; earnings growth has paralleled equity growth.
Annual revenue growth
has been 8.6% per year. (More recently it has been 3.9%.)
Total asset growth
has been 5.6% per year. (More recently it has been 0.3%.)
Annual E.P.S. growth
has been -3.9% per year.
Equity growth
has been -5.8% per year.
No consensus growth rate forecast is available for Redwood Trust.
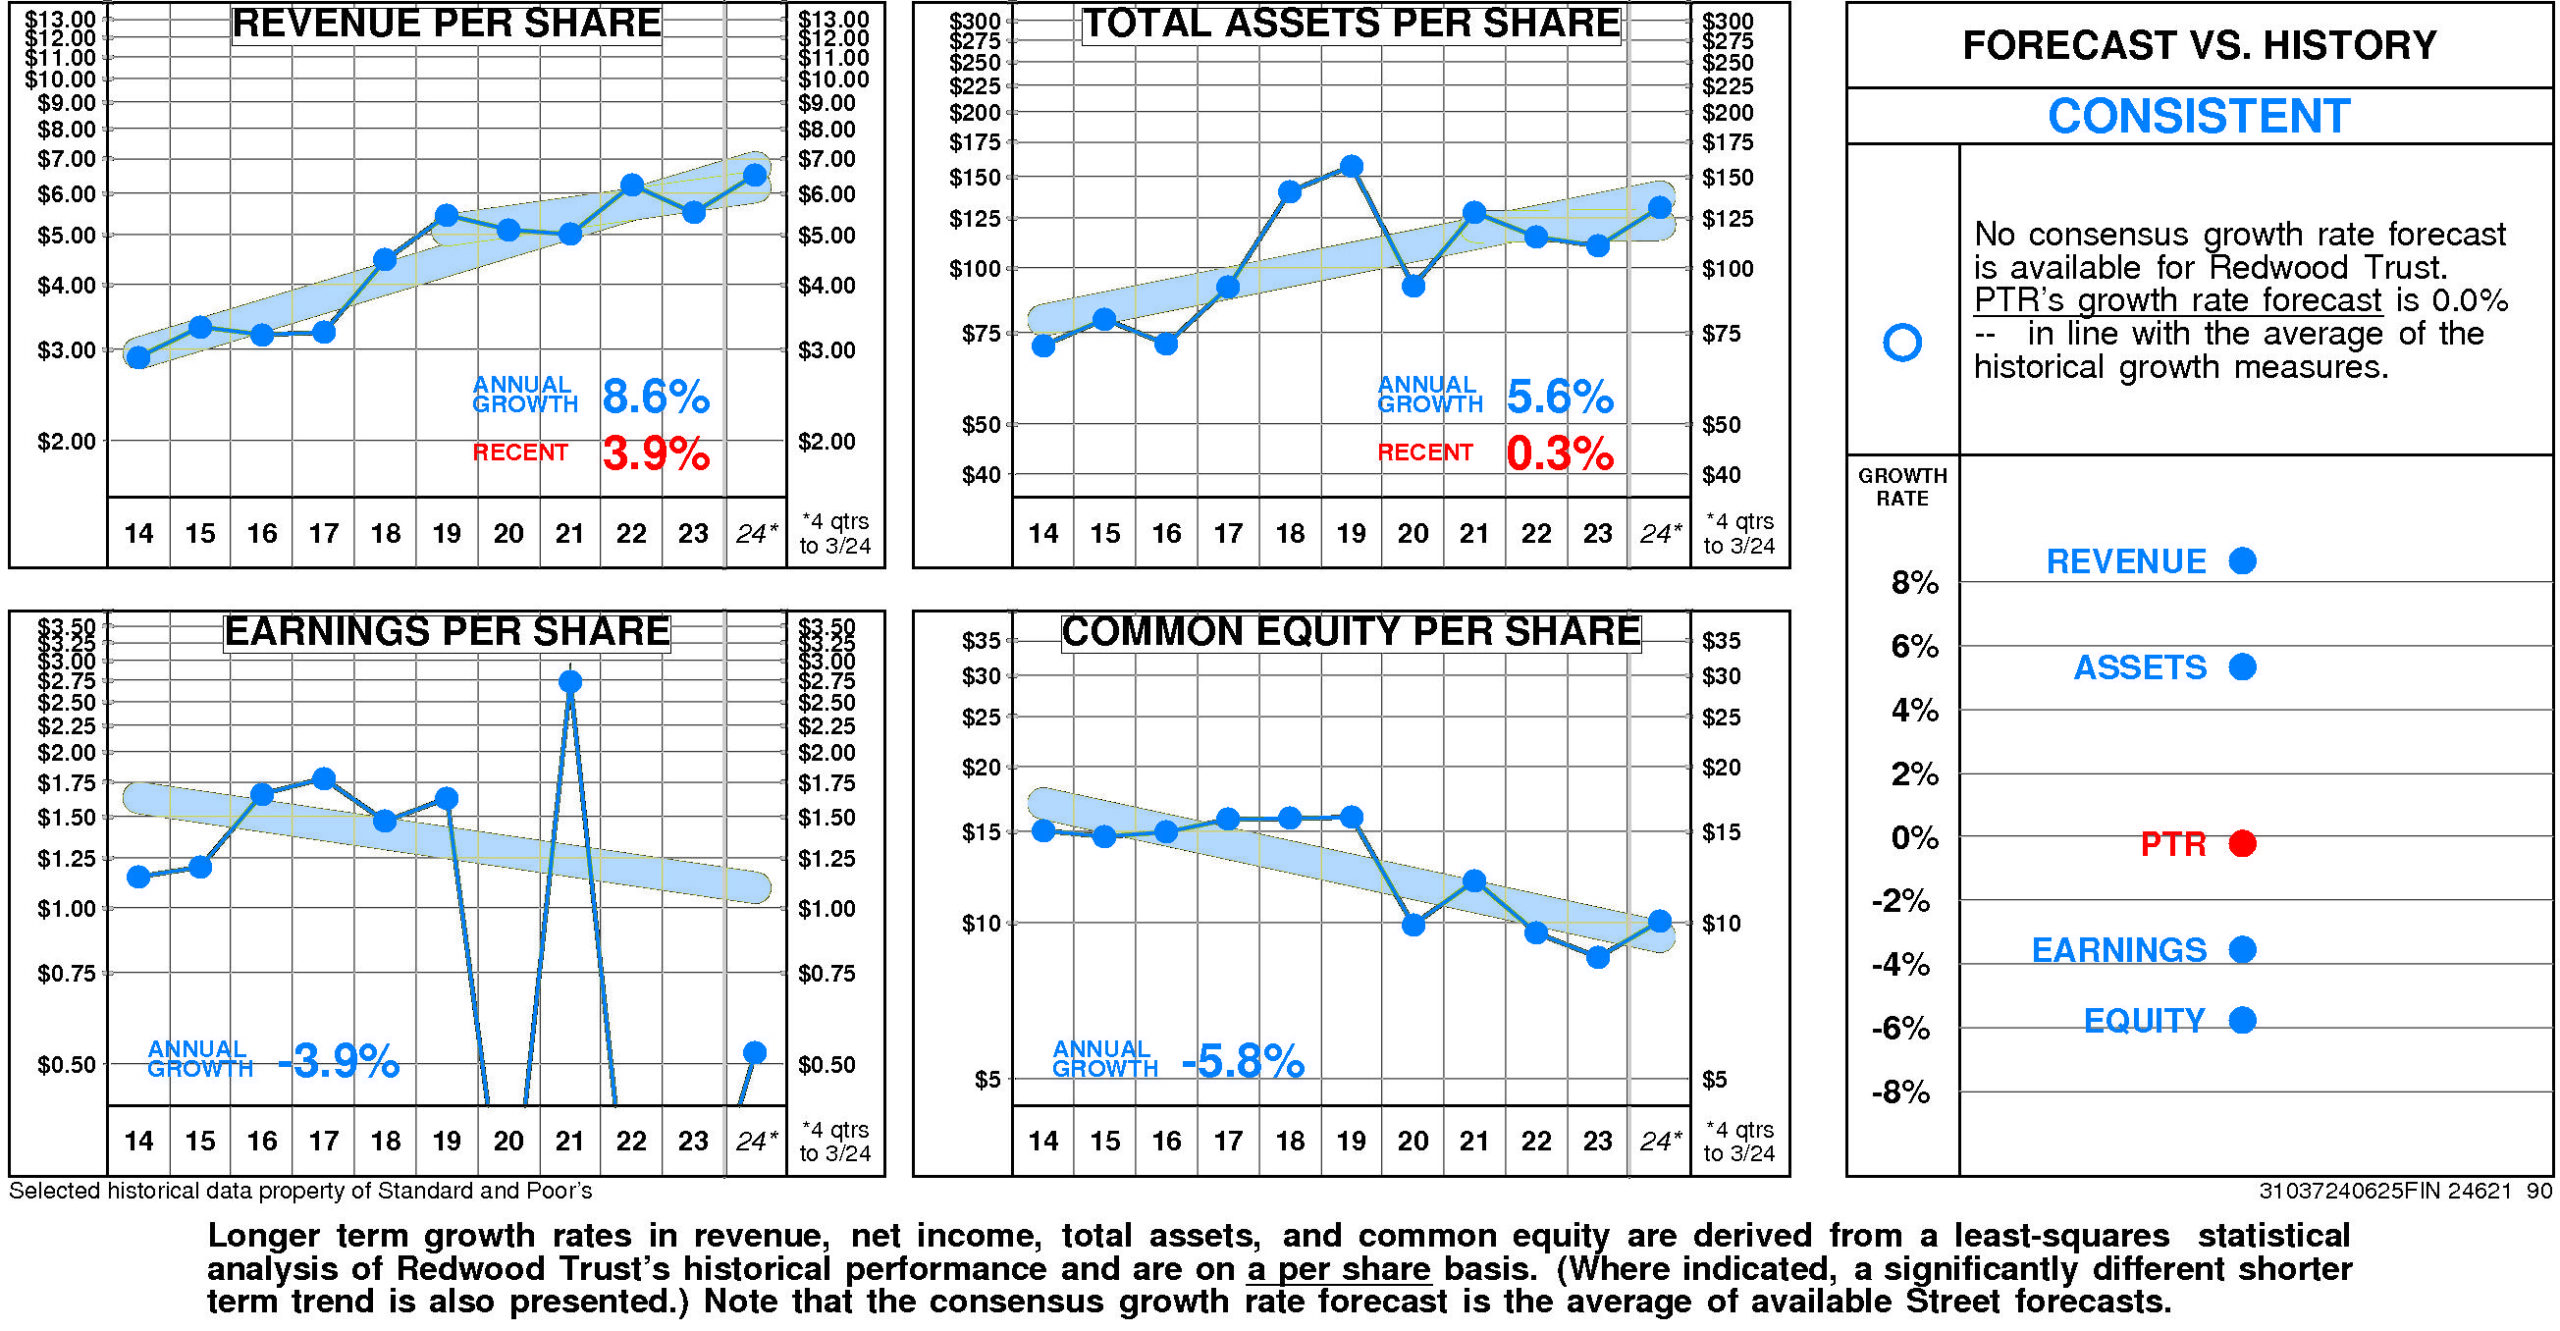
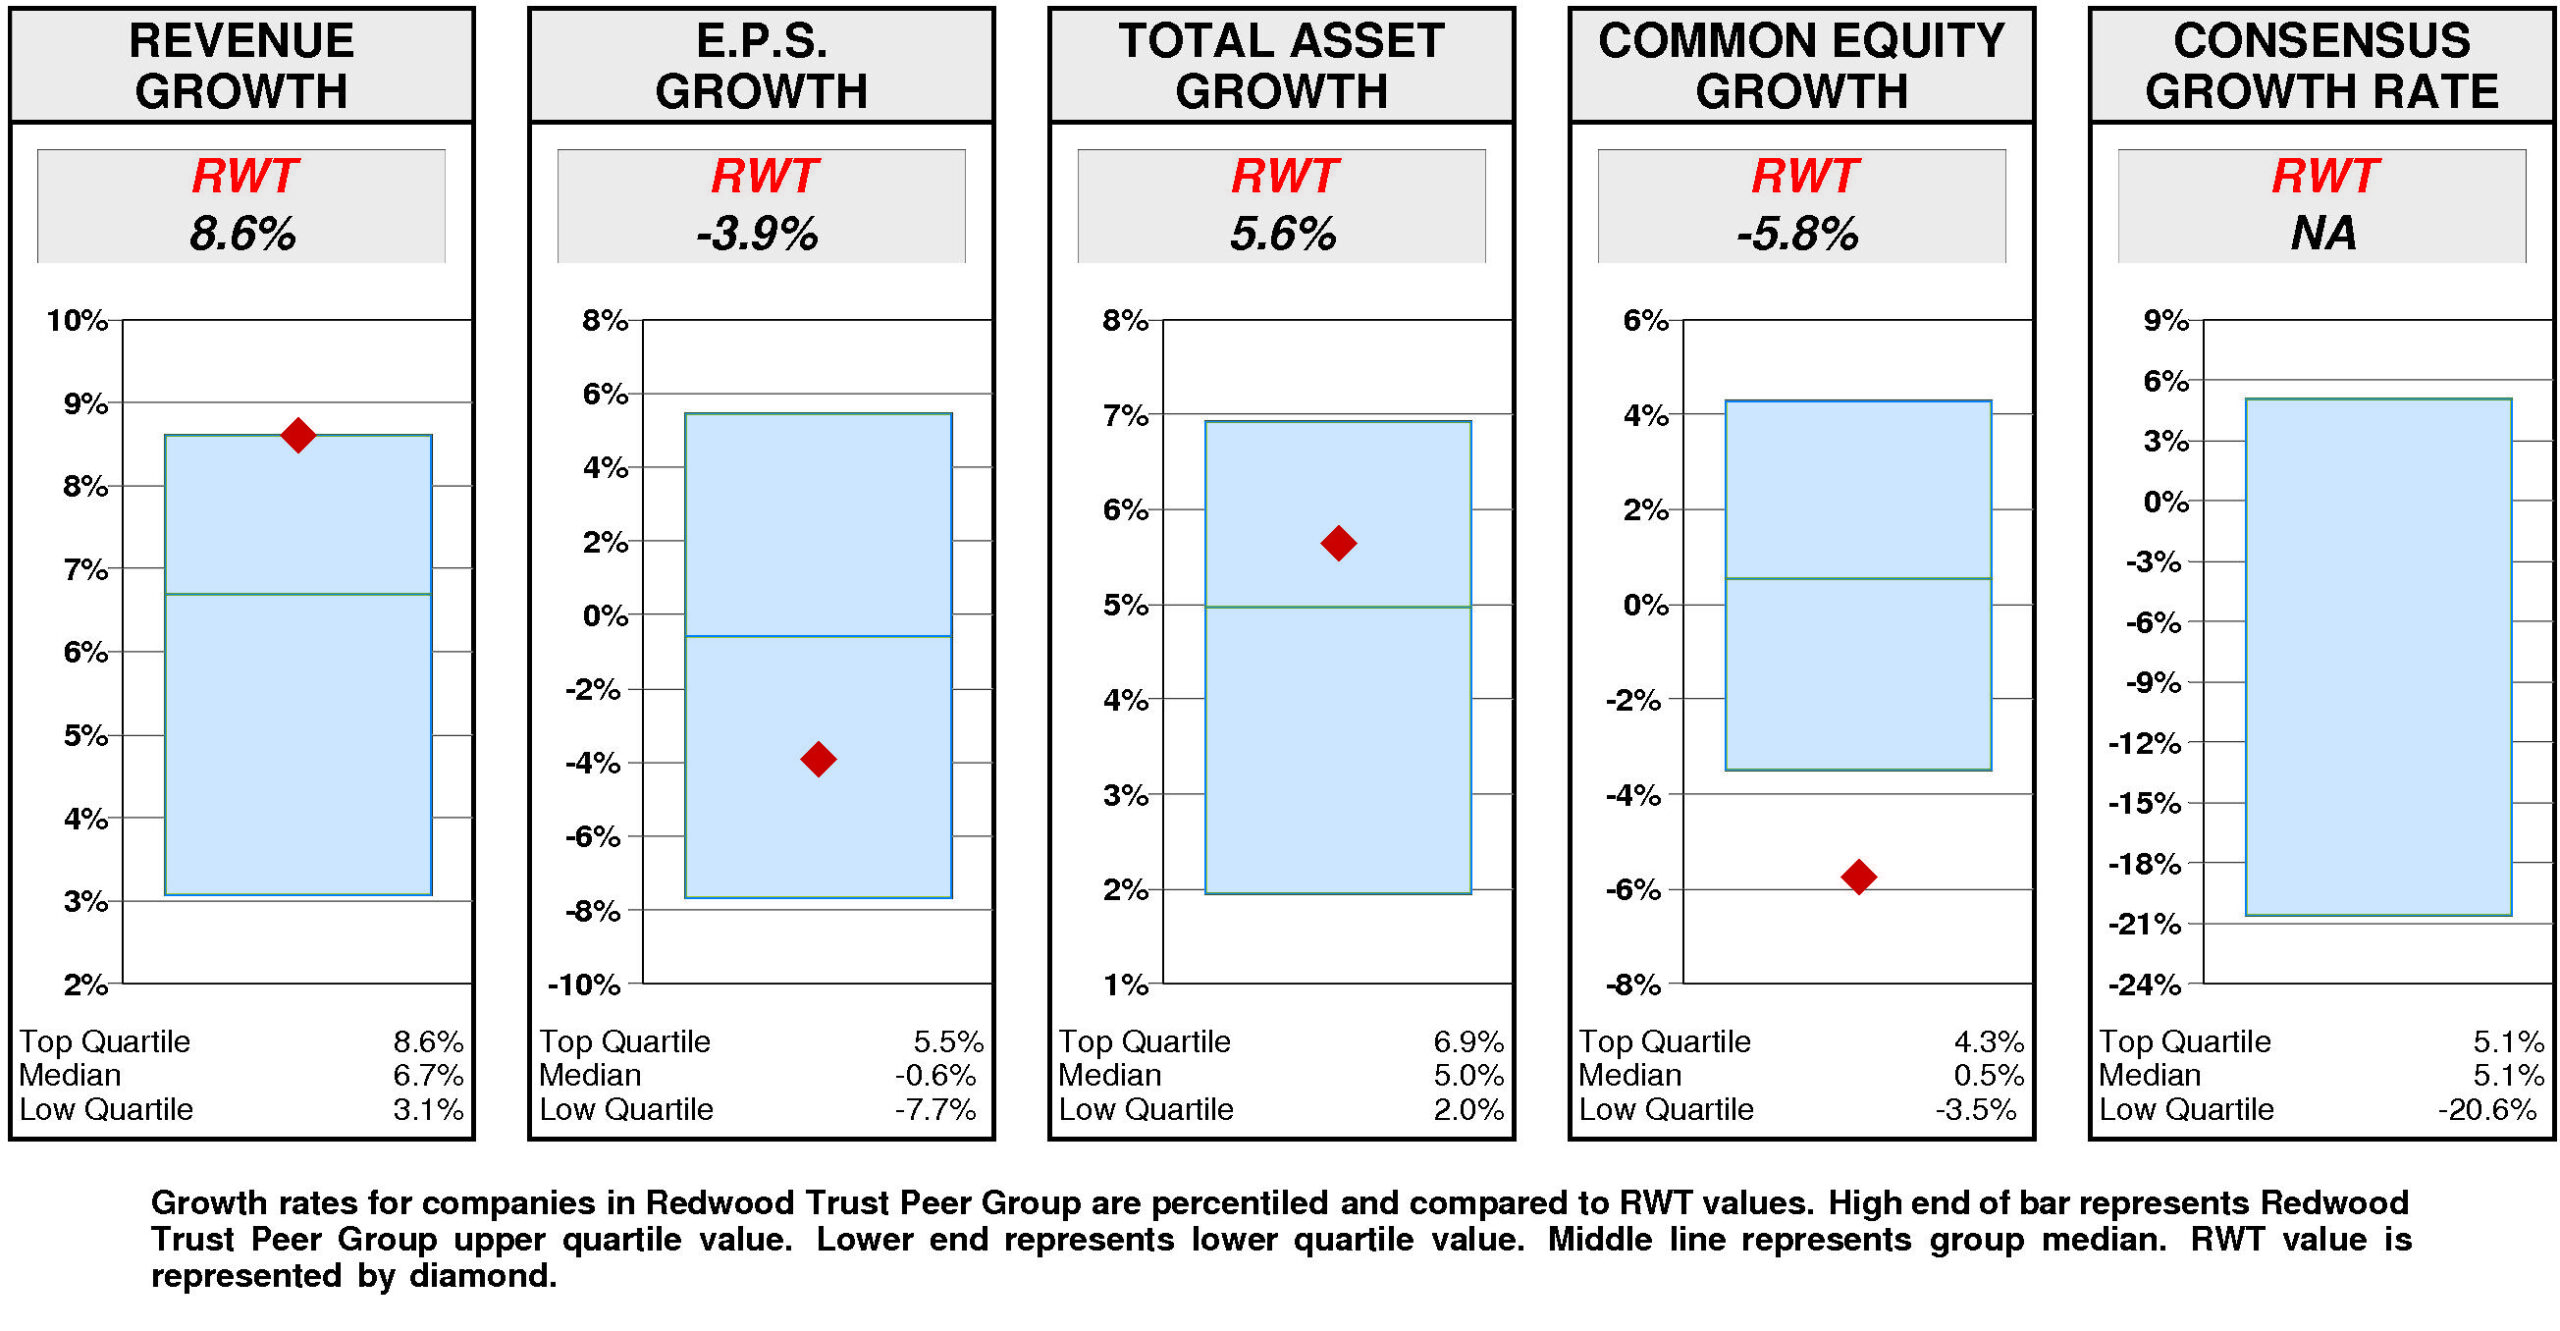
Relative to the Redwood Trust Peer Group, Redwood Trust's historical growth measures are highly erratic.
Revenue growth (8.6%) has been at the upper quartile. Total asset growth (5.6%) has been above median. E.P.S. growth (-3.9%) has been below median. Equity growth (-5.8%) has been lower quartile.
Consensus growth forecast is unavailable.
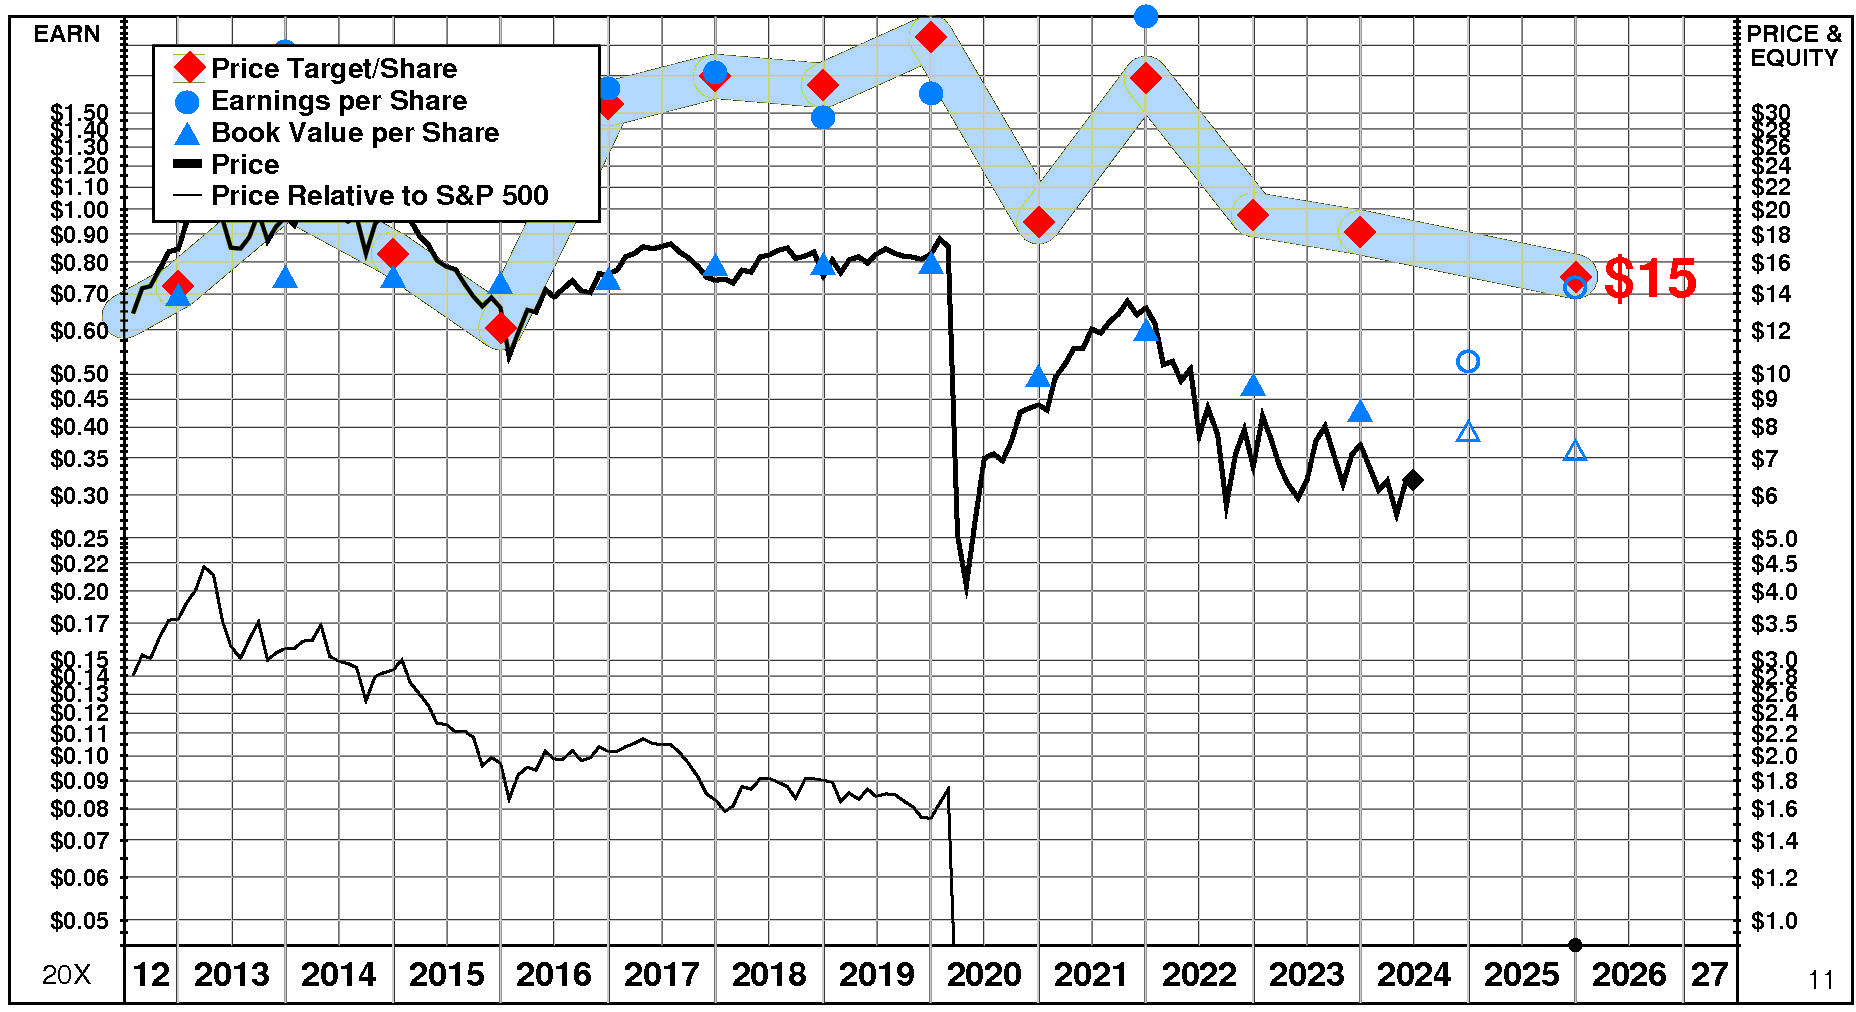
PRICE HISTORY
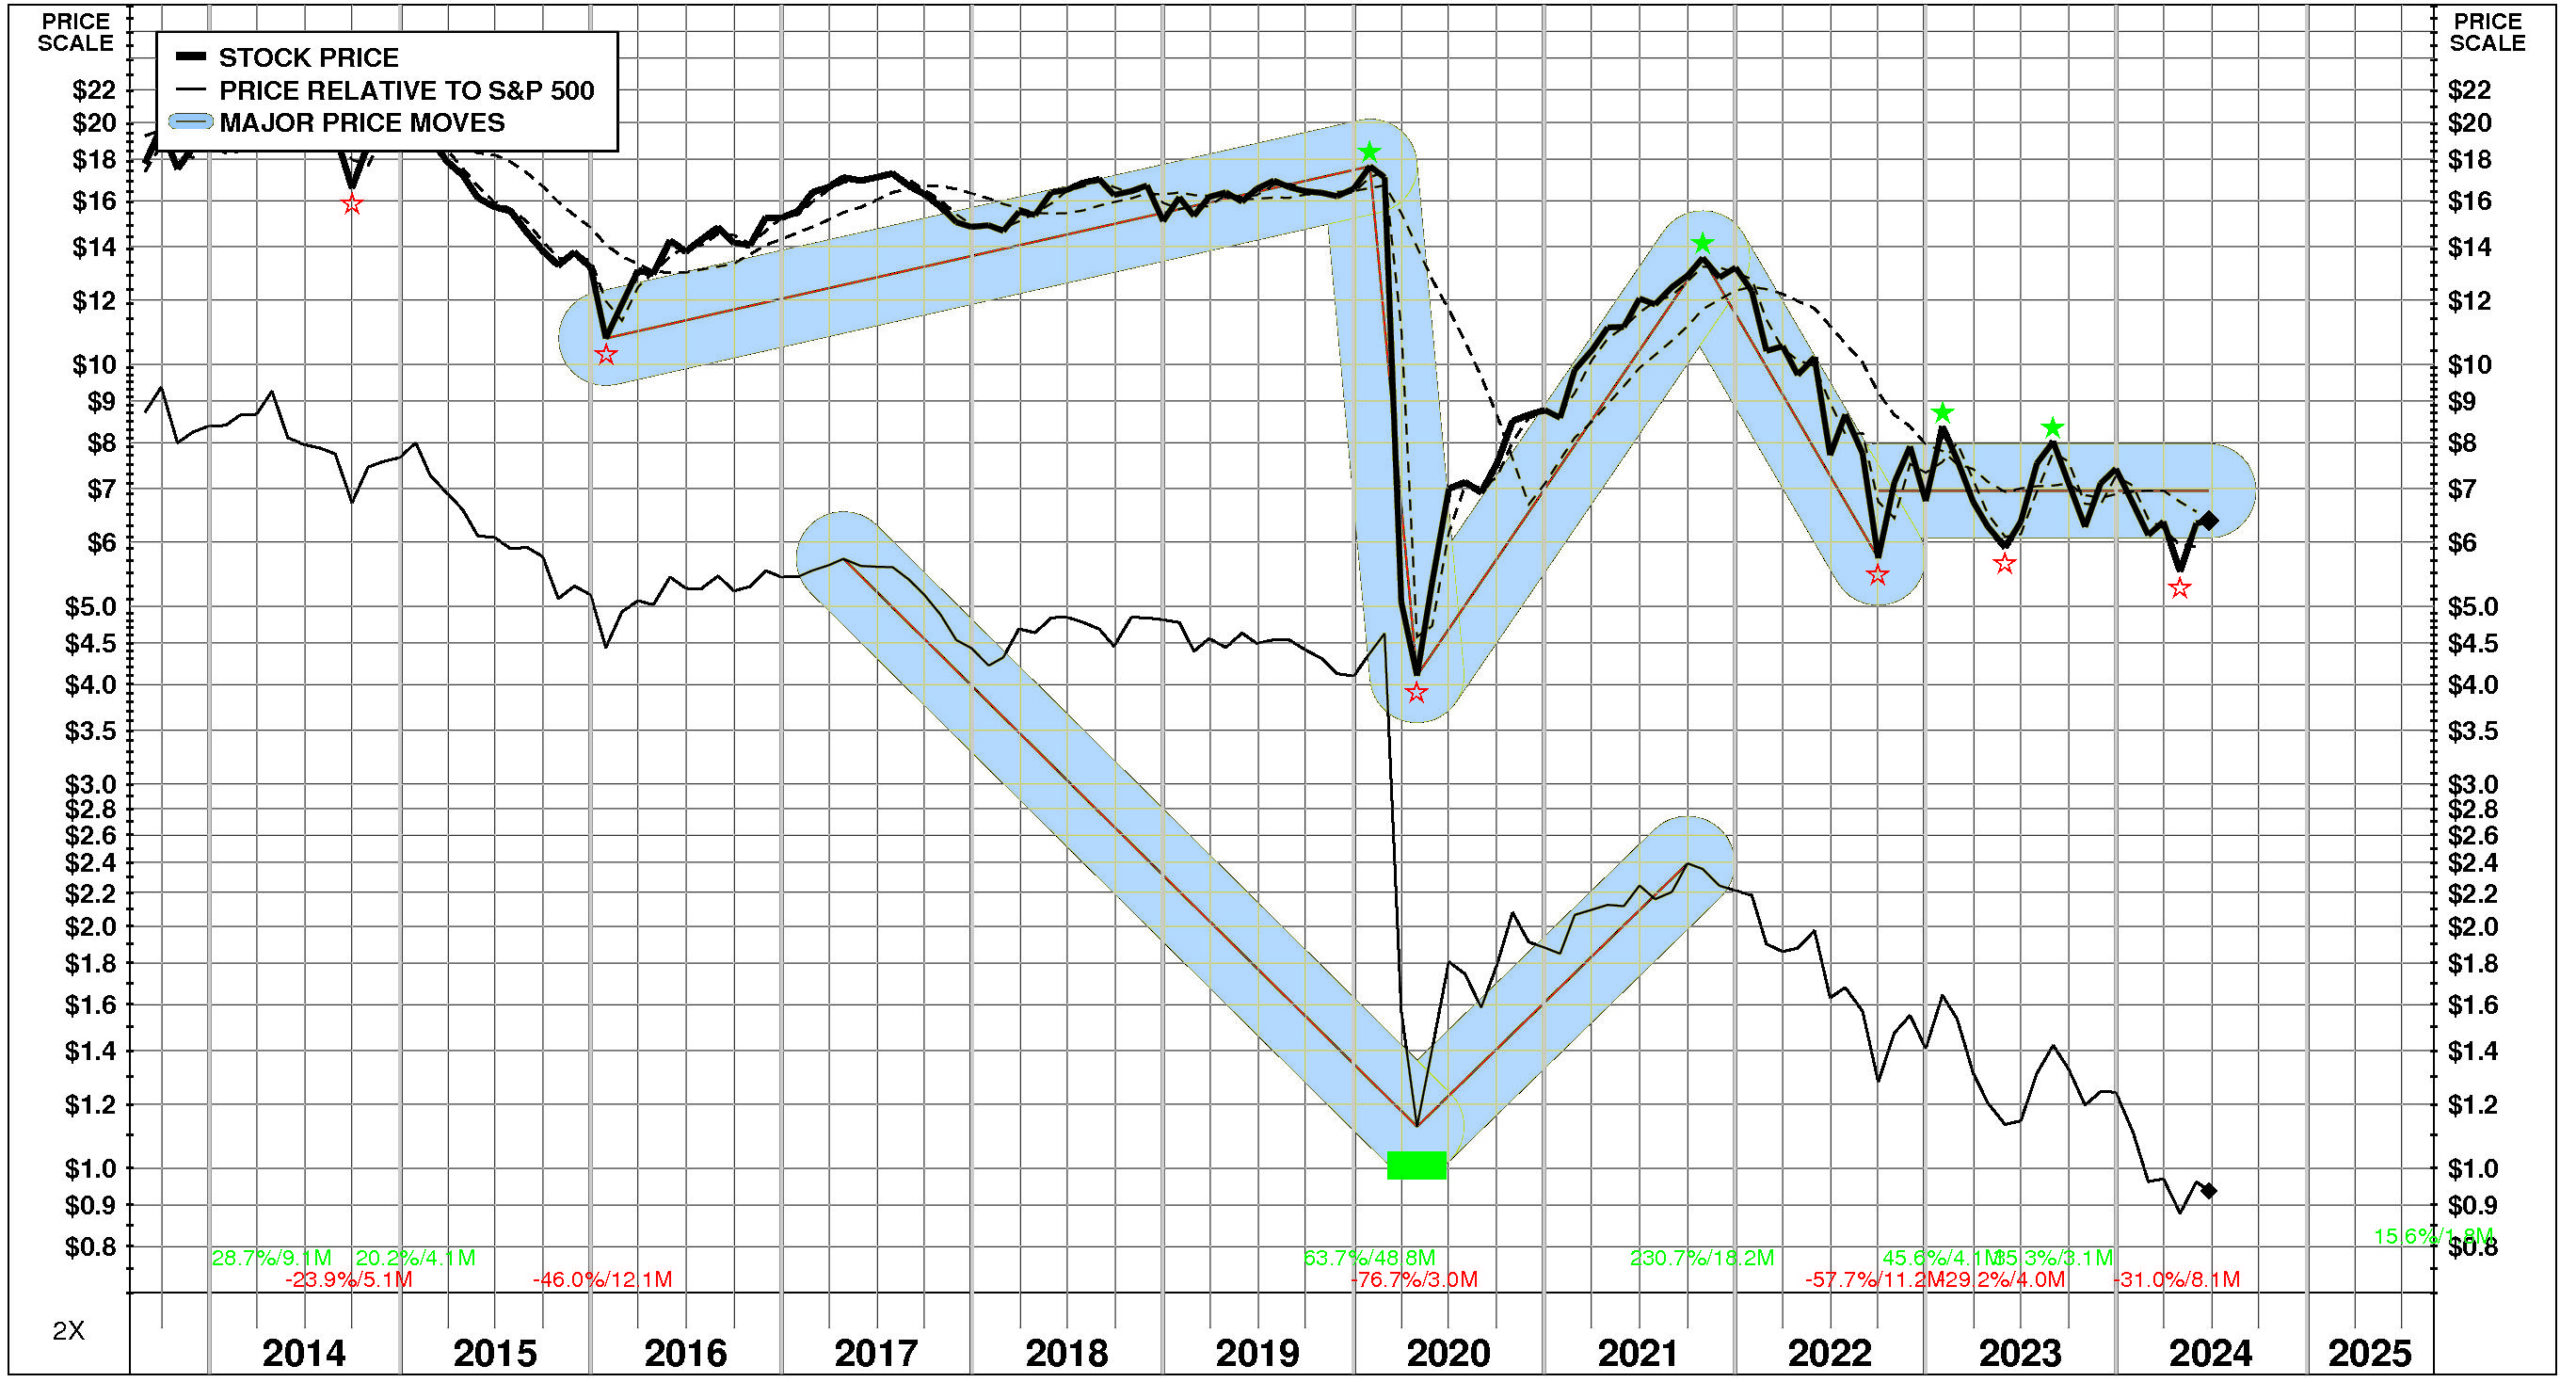
Over the full time period, Redwood Trust's stock price performance has been variable and significantly below market.
Between August, 2013 and June, 2024, Redwood Trust's stock price fell -64%; relative to the market, this was a -89% loss. Significant price moves during the period: 1) October, 2021 – September, 2022: -58%; 2) April, 2020 – October, 2021: +231%; 3) January, 2020 – April, 2020: -77%; and 4) January, 2016 – January, 2020: +64%.
TOTAL INVESTMENT RETURNS
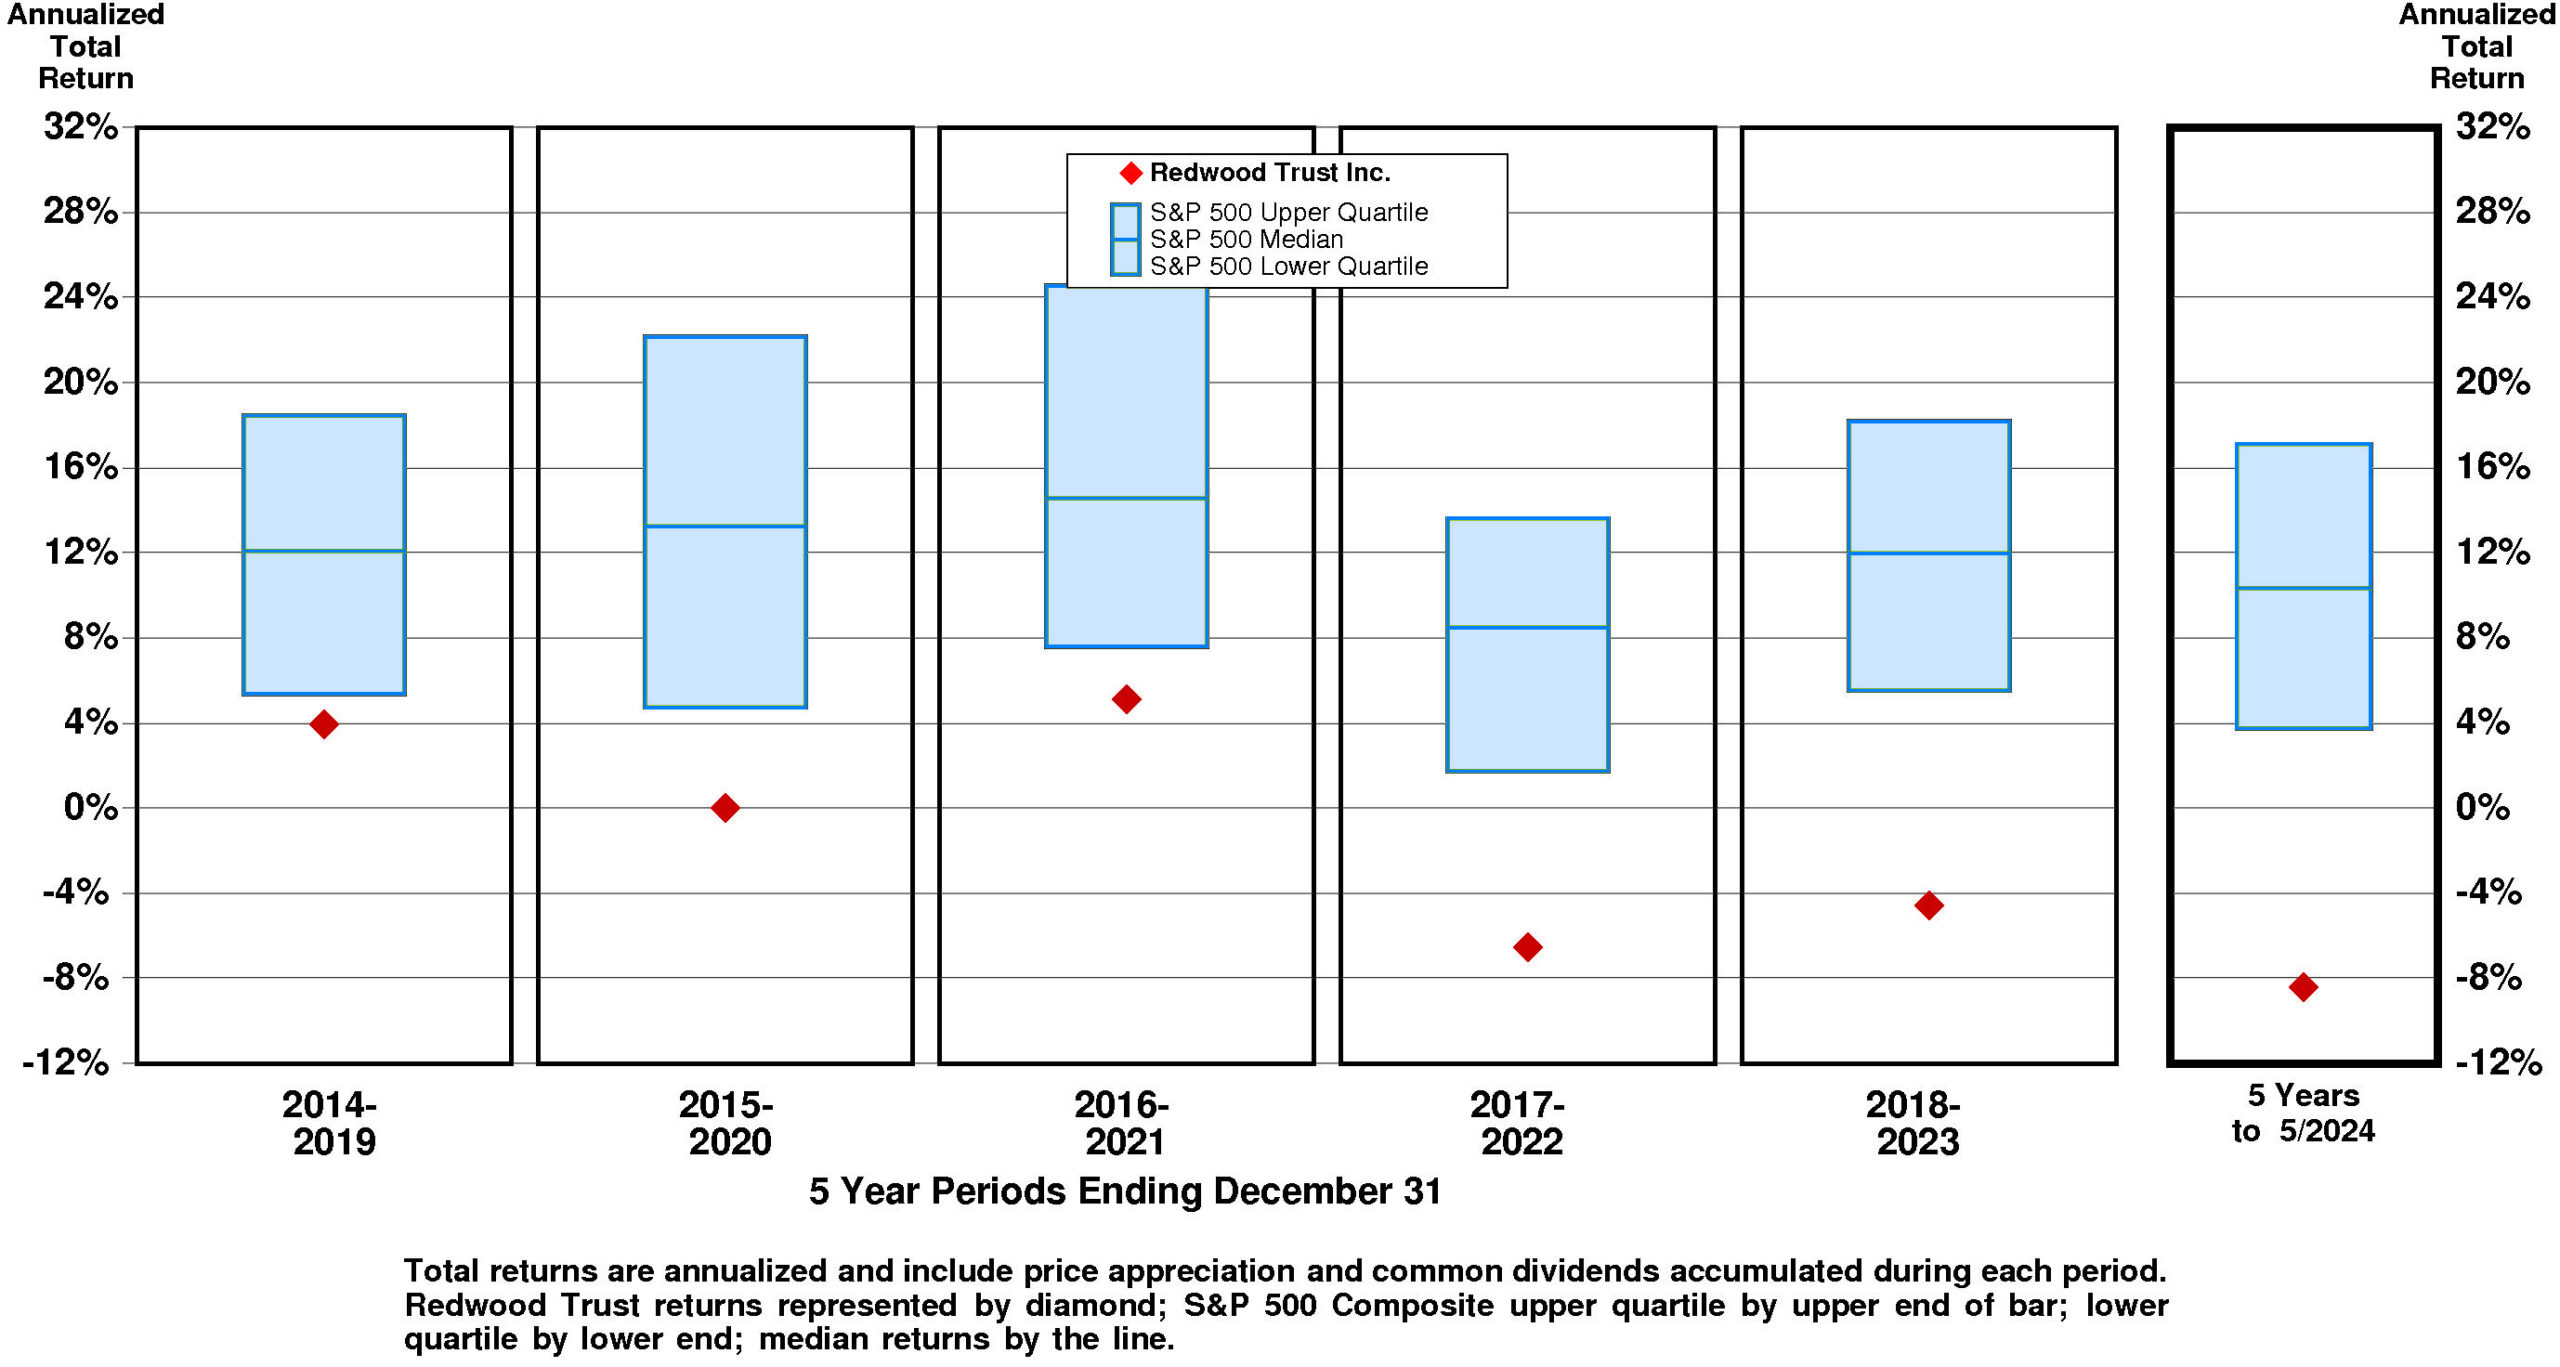
Current annual total return performance of 17.6% is slightly below median relative to the S&P 500 Composite.
In addition to being slightly below median relative to S&P 500 Composite, current annual total return performance through May, 2024 of 17.6% is at the upper quartile relative to Redwood Trust Inc. Peer Group.
Current 5-year total return performance of -8.4% is lower quartile relative to the S&P 500 Composite.
Through May, 2024, with lower quartile current 5-year total return of -8.4% relative to S&P 500 Composite, Redwood Trust's total return performance is below median relative to Redwood Trust Inc. Peer Group.
VALUATION BENCHMARKS
Relative to S&P 500 Composite, RWT's overall valuation is normal.
The highest factor, the ratio of enterprise value/revenue, is upper quartile. Price/earnings ratio is upper quartile. Ratio of enterprise value/earnings before interest and taxes is slightly above median. Ratio of enterprise value/assets is near the lower quartile. The lowest factor, the price/equity ratio, is lower quartile.
Relative to Redwood Trust Peer Group, RWT's overall valuation is quite high.
The highest factor, the price/earnings ratio, is upper quartile. Ratio of enterprise value/revenue is upper quartile. Ratio of enterprise value/assets is upper quartile. Ratio of enterprise value/earnings before interest and taxes is near the upper quartile. The lowest factor, the price/equity ratio, is slightly above median.
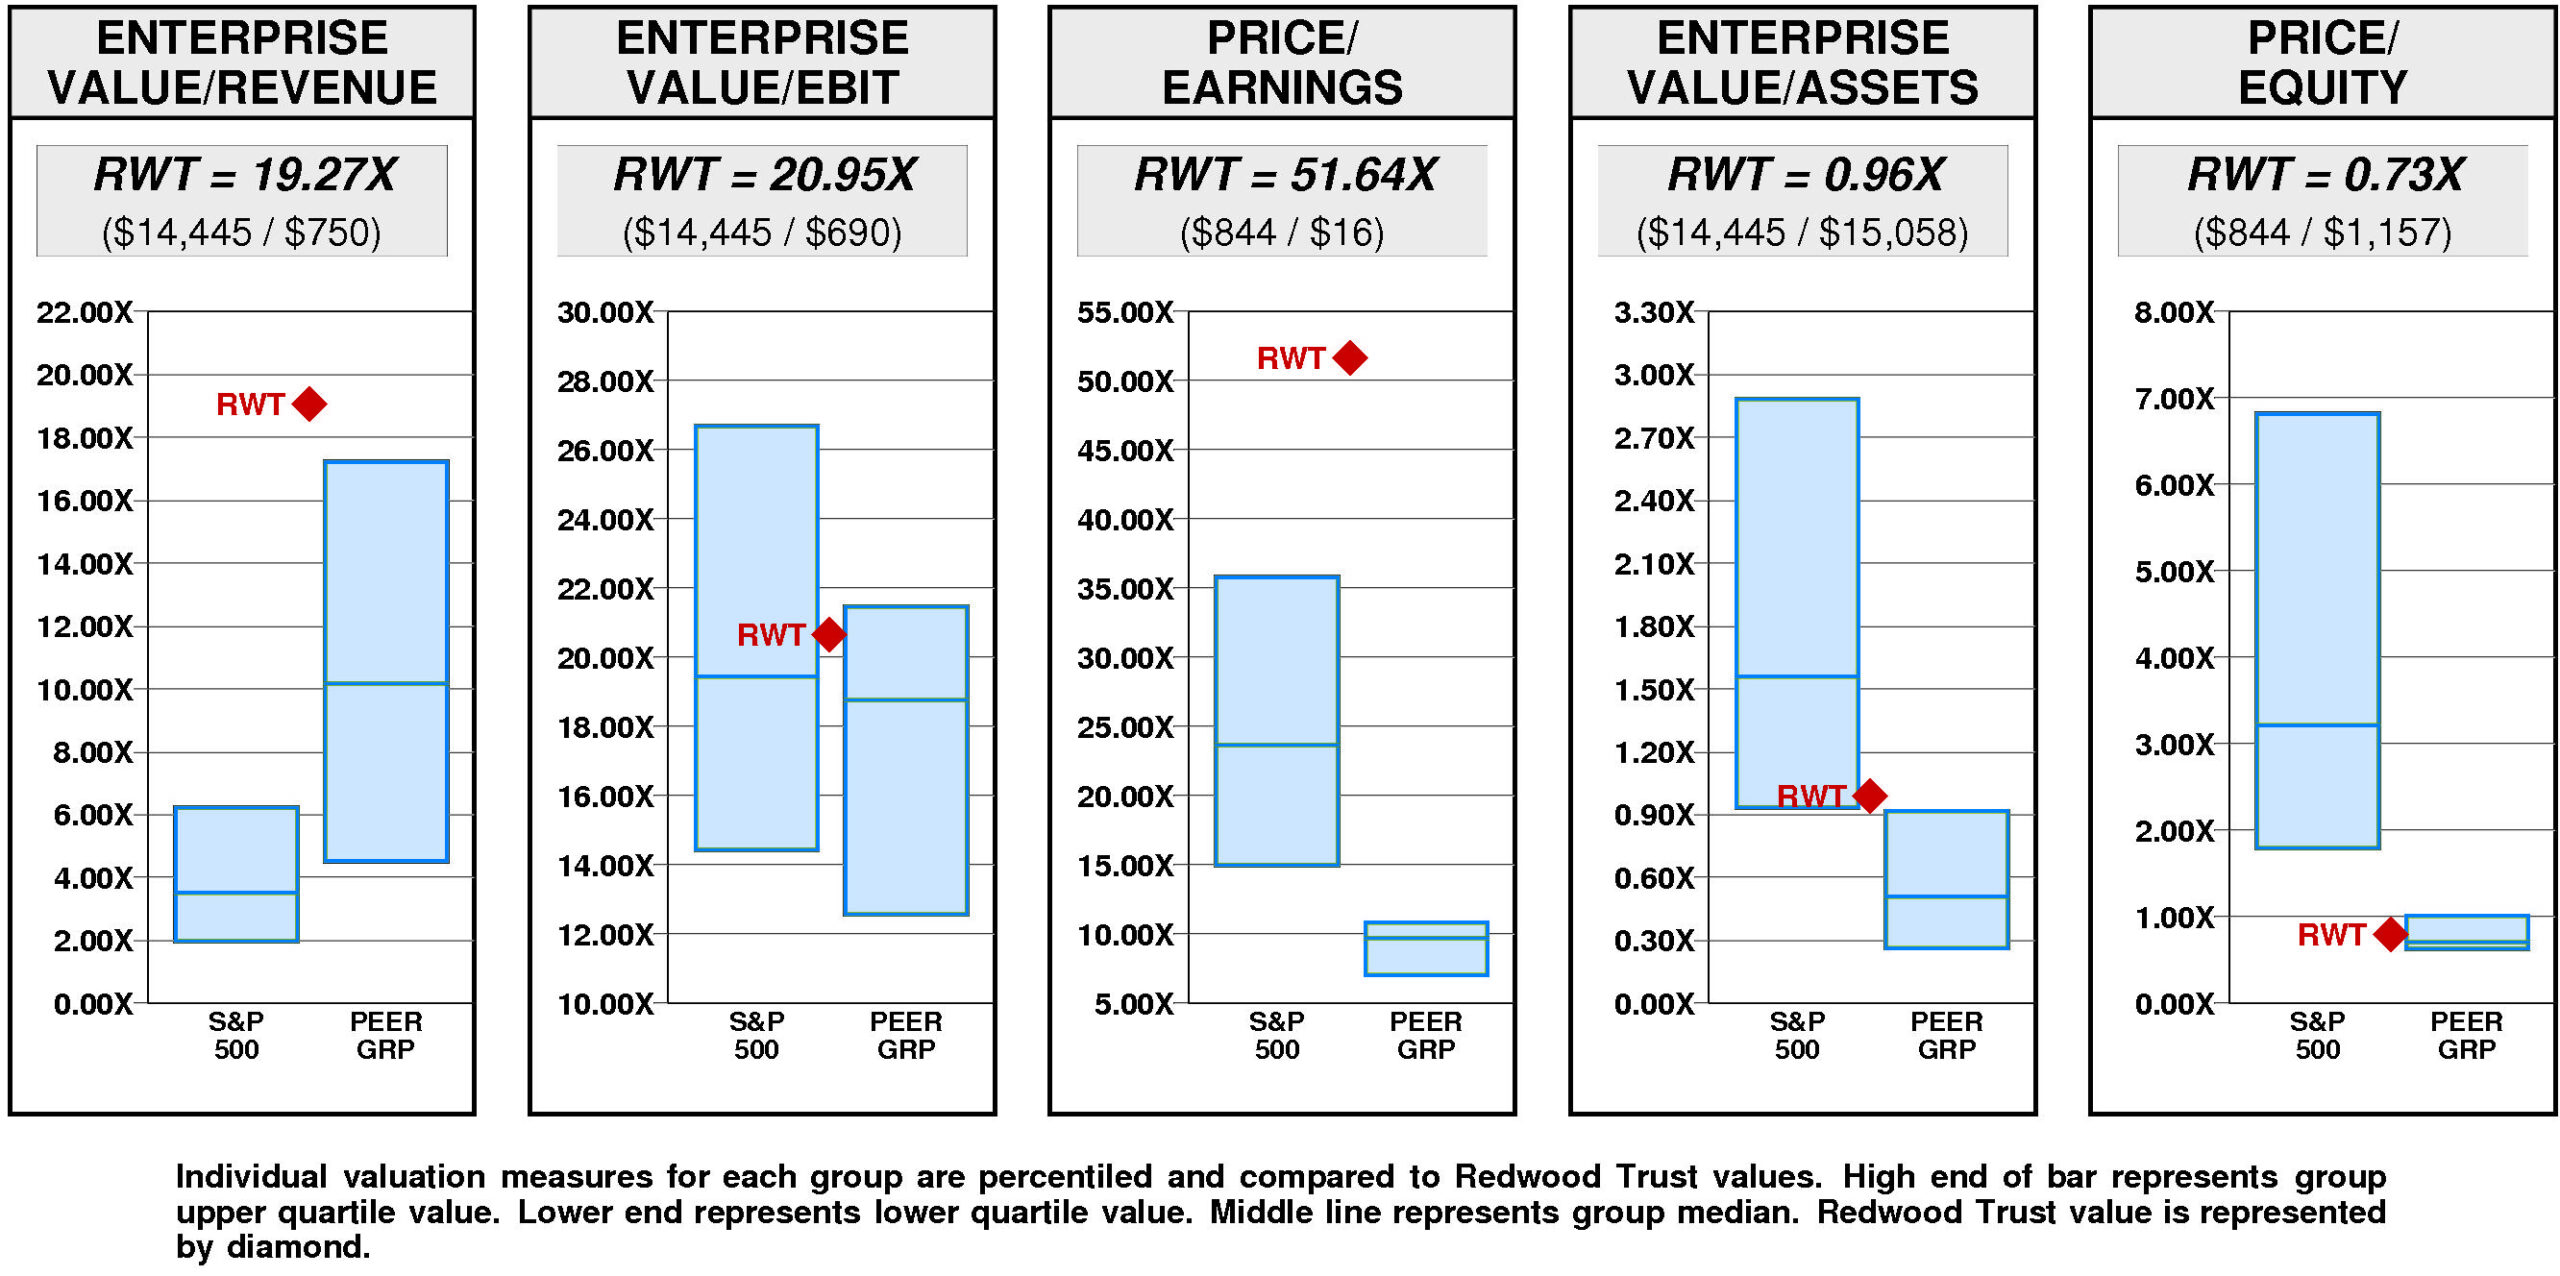
Redwood Trust has a major value gap compared to the median valuation.
For RWT to achieve median valuation, its current ratio of enterprise value/revenue would have to fall from the current level of 19.27X to 10.17X. If RWT's ratio of enterprise value/revenue were to fall to 10.17X, its stock price would be lower by $-52 to $-45.
For RWT to fall to lower quartile valuation relative to the Redwood Trust Peer Group, its current ratio of enterprise value/revenue would have to fall from the current level of 19.27X to 4.53X. If RWT's ratio of enterprise value/revenue were to fall to 4.53X, its stock price would decline by $-84 from the current level of $6.39.
VALUE TARGETS
With future capital returns forecasted to exceed the cost of capital, RWT is expected to continue to be a Value Builder.
Redwood Trust's current Price Target of $15 represents a +137% change from the current price of $6.34.
This high appreciation potential results in an appreciation score of 78 (only 22% of the universe has greater appreciation potential.)
Notwithstanding this high Appreciation Score of 78, the low Power Rating of 26 results in an Value Trend Rating of C.
Redwood Trust's current Price Target is $15 (-17% from the 2023 Target of $18 but +137% from the 05/03/24 price of $6.34).
This slight fall in the Target is the result of a -14% decrease in the equity base and a -4% decrease in the price/equity multiple. One Driver has a positive impact on the price/equity multiple, one has a negative impact, and one has no effect. The forecasted increase in return on equity has a very large positive impact on the price/equity multiple. The forecasted growth has no impact. The forecasted increase in cost of equity has a very large negative impact.
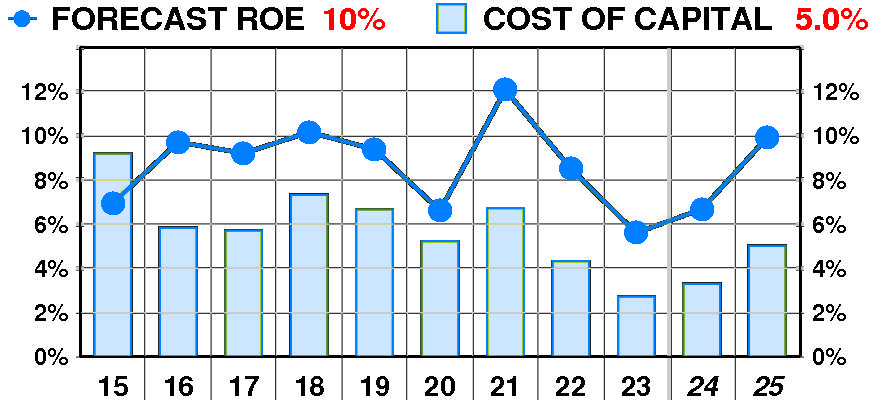

PTR's return on equity forecast is 9.9% — slightly above our recent forecasts.
Forecasted return on equity exhibited a modest, erratic decline between 2015 and 2023. The current forecast is above the 2020 low of 7%.
PTR's growth forecast is 0.0% — in line with our recent forecasts.
Forecasted growth enjoyed a dramatic, erratic increase between 2016 and 2023. The current forecast is significantly below the 2019 peak of 14%.
PTR's cost of equity forecast is 5.0% — slightly above recent levels.
Forecasted cost of equity enjoyed a dramatic, erratic decline between 2015 and 2023. The current forecast is below the 2015 peak of 9.2%.
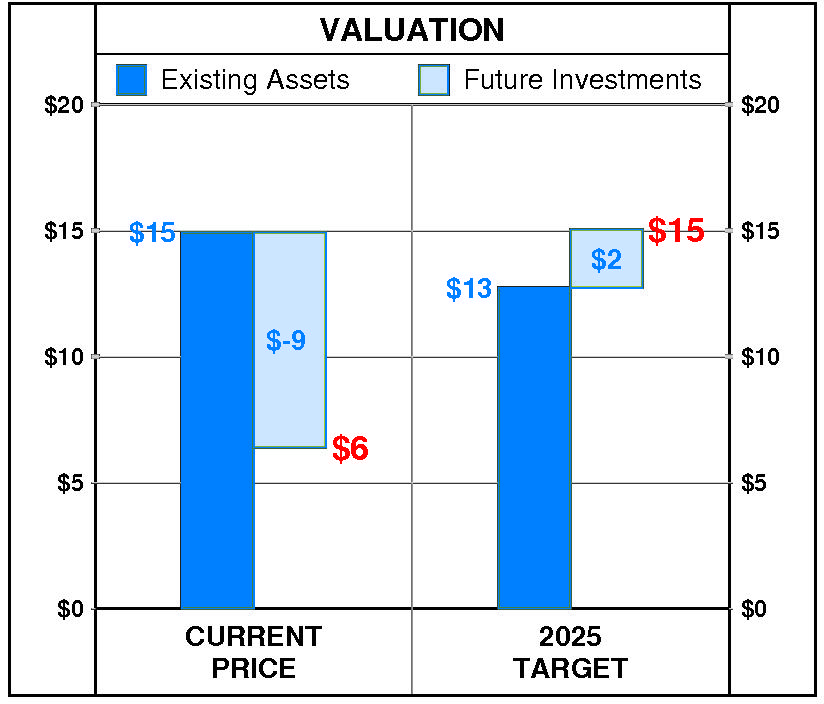
At Redwood Trust's current price of $6.34, investors are placing a negative value of $-9 on its future investments. This view is not supported by the company's most recent performance that reflected a growth rate of 0.0% per year, and a return on equity of 5.6% versus a cost of equity of 2.7%.
PTR's 2025 Price Target of $15 is based on these forecasts and reflects an estimated value of existing assets of $13 and a value of future investments of $2.