
BUSINESS
Pan American Silver Corp., together with its subsidiaries, engages in the exploration, mine development, extraction, processing, refining, and reclamation of silver, gold, zinc, lead, and copper mines in Canada, Mexico, Peru, Argentina, and Bolivia. It holds interests in the La Colorada, Dolores, Huaron, Morococha, Shahuindo, La Arena, Timmins West, Bell Creek, Manantial Espejo, San Vicente, Joaquin, Cap-Oeste Sur Este, and Navidad mines. The company was formerly known as Pan American Minerals Corp. and changed its name to Pan American Silver Corp. in April 1995. Pan American Silver Corp. was incorporated in 1979 and is headquartered in Vancouver, Canada.
INVESTMENT RATING
PAAS' future returns on capital are forecasted to exceed the cost of capital. Accordingly, the company is expected to be a modest Value Builder.
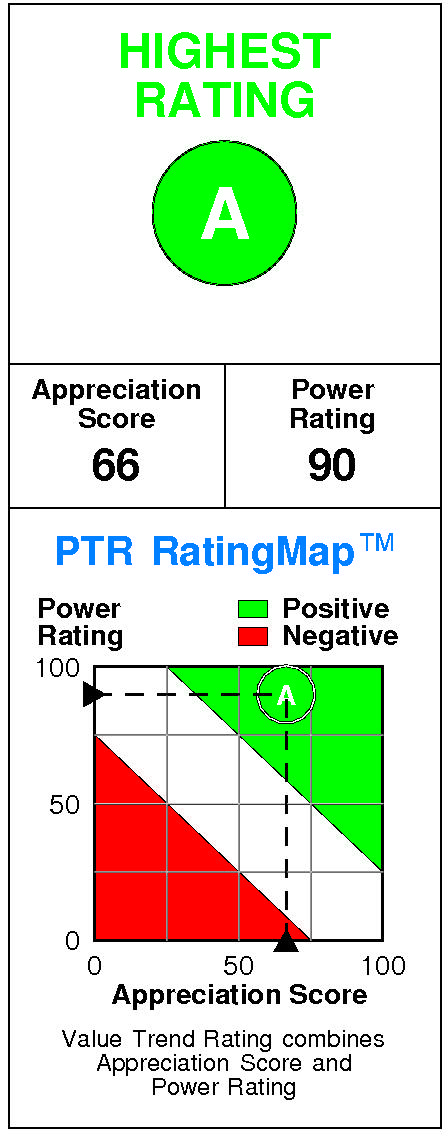
Pan American Silver has a current Value Trend Rating of A (Highest Rating).
The Value Trend Rating reflects complementary signals from PTR's two proprietary measures of a stock's attractiveness. Pan American Silver has a slightly positive Appreciation Score of 66 and a very high Power Rating of 90, with the Highest Value Trend Rating the result.
Pan American Silver's stock is selling well below targeted value.
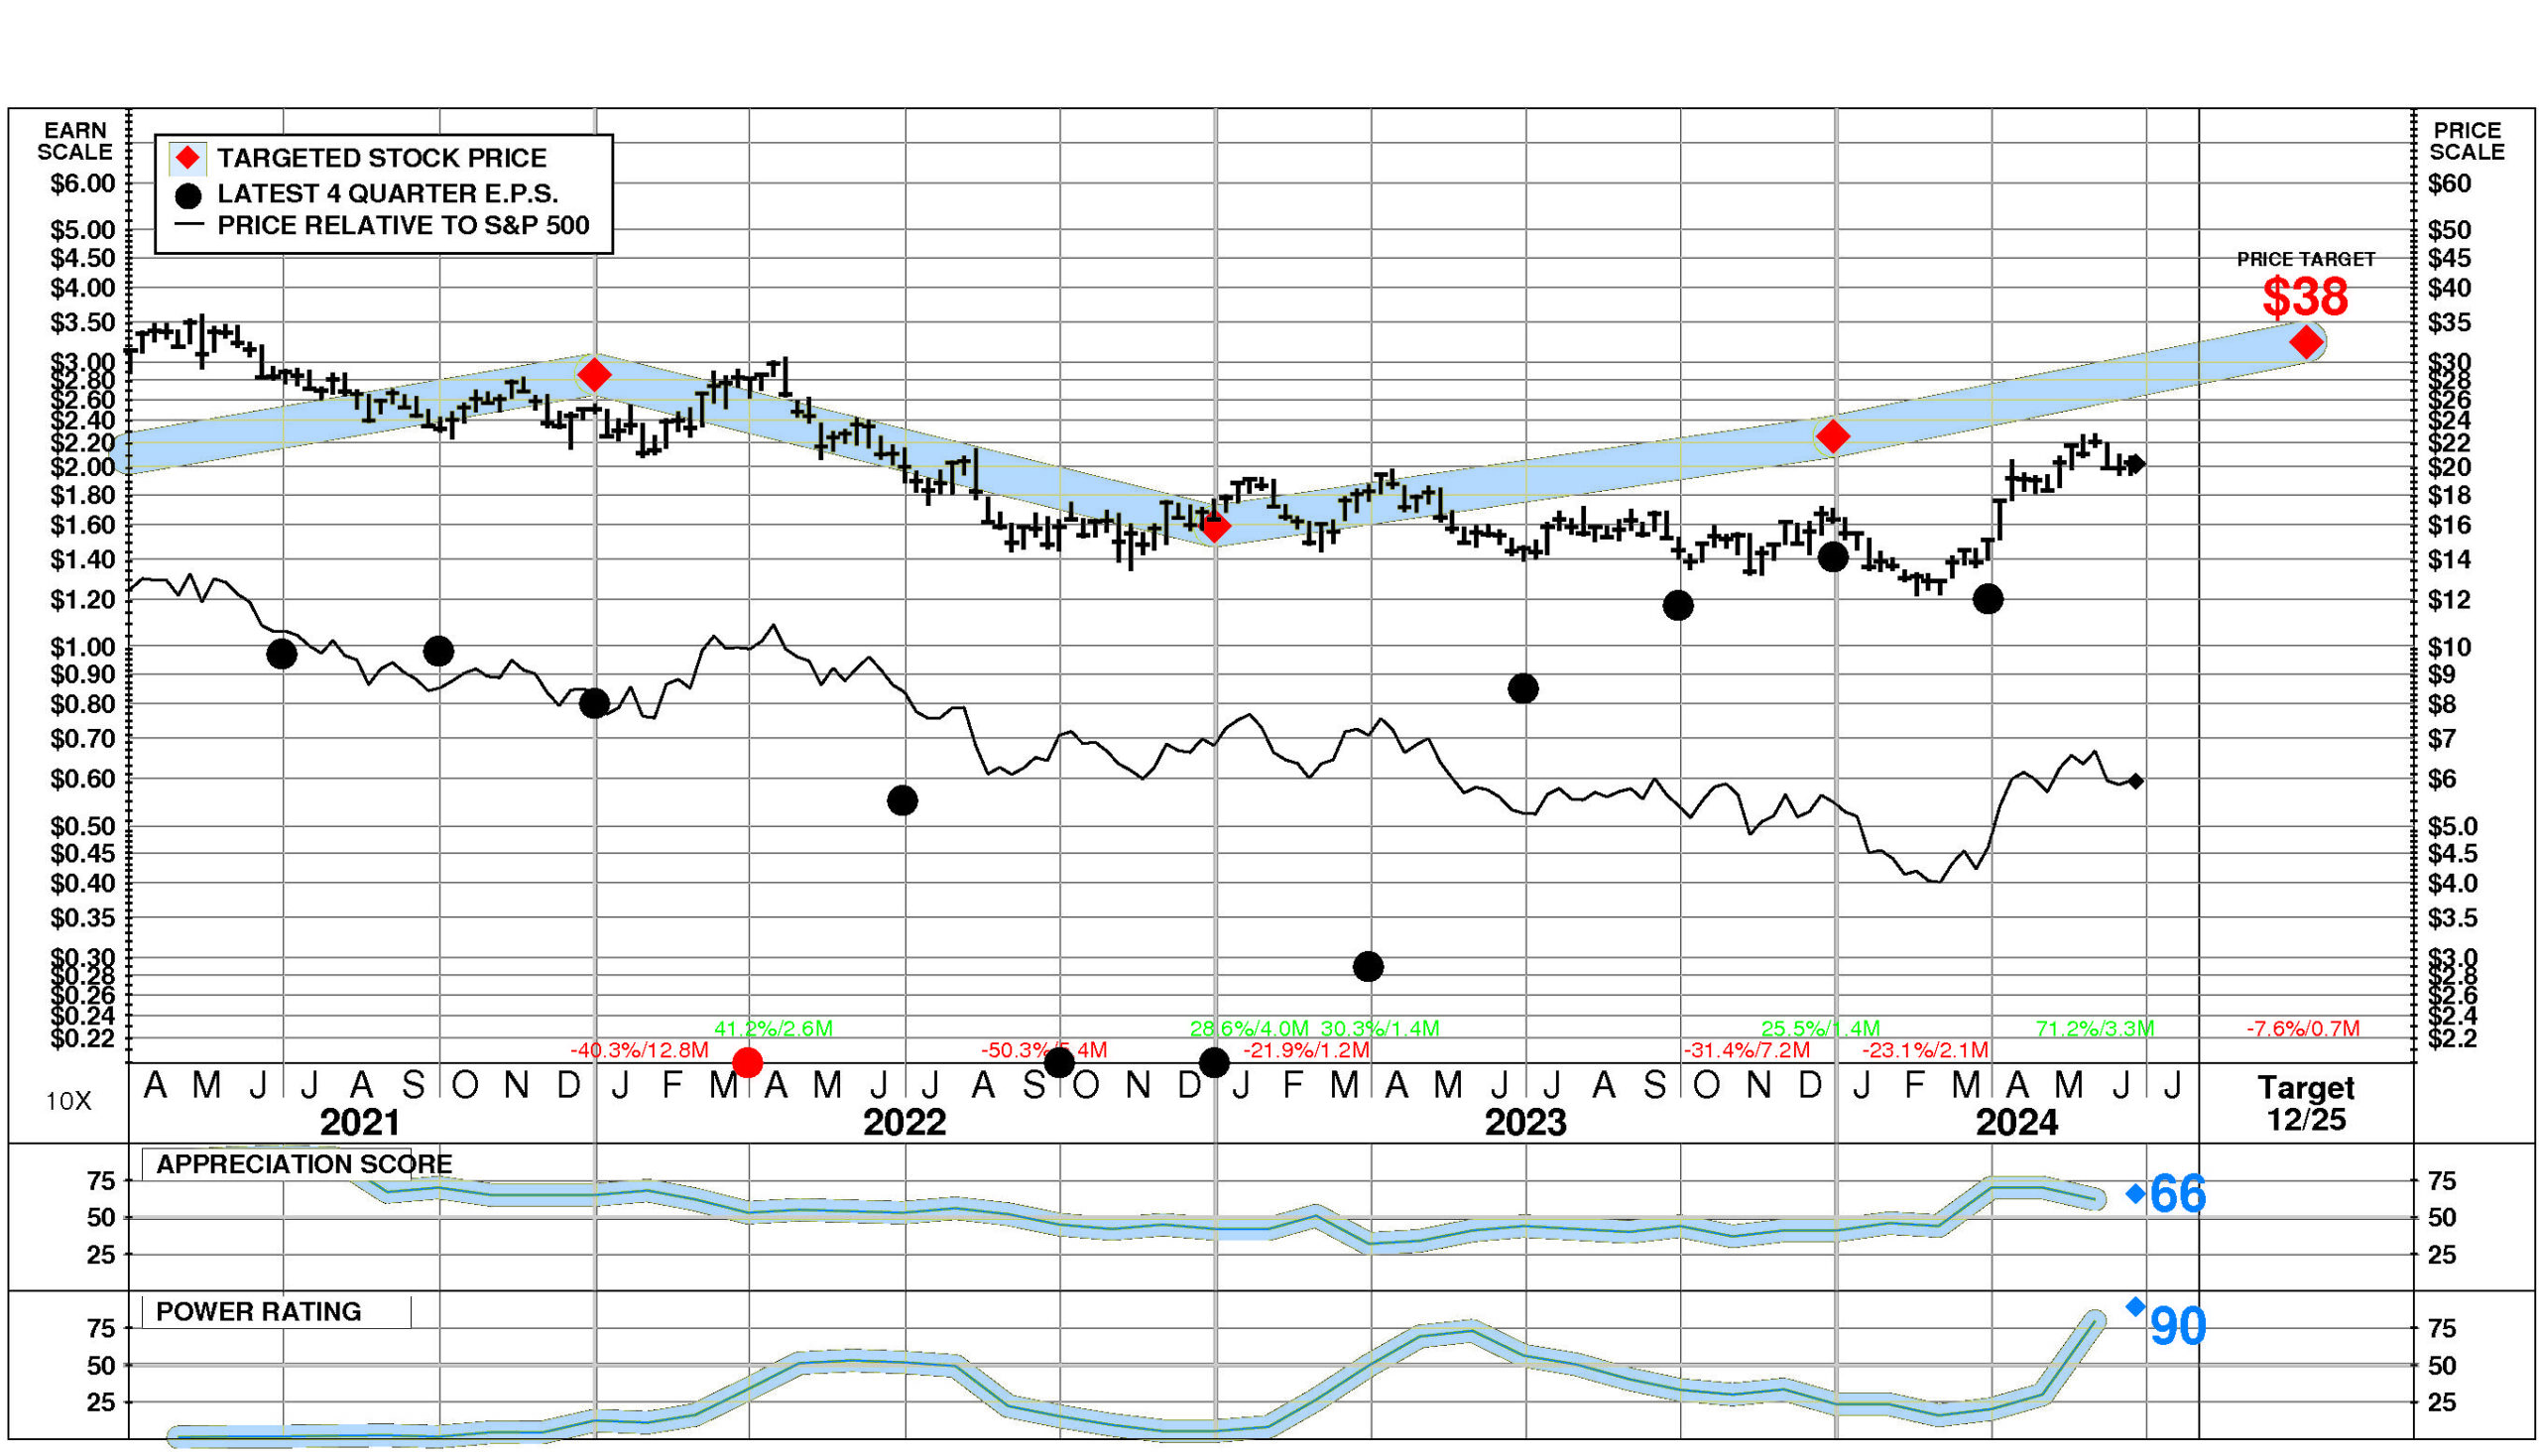
The current stock price of $20.27 compares to targeted value 12 months forward of $32.
This moderately high appreciation potential results in an appreciation score of 66 (only 34% of the universe has greater appreciation potential.)
Pan American Silver has a Power Rating of 90.
(This very high Power Rating indicates that PAAS has a better chance of achieving attractive investment performance over the near to intermediate term than all but 10% of companies in the universe.)
Factors contributing to this very high Power Rating include: the recent trend in PAAS' earnings estimates has been extremely favorable; recent price action has been favorable; and the Gold and Silver Ores comparison group is currently in a modestly favorable position.
INVESTMENT PROFILE
PAAS' financial strength is below average. Financial strength rating is 37.
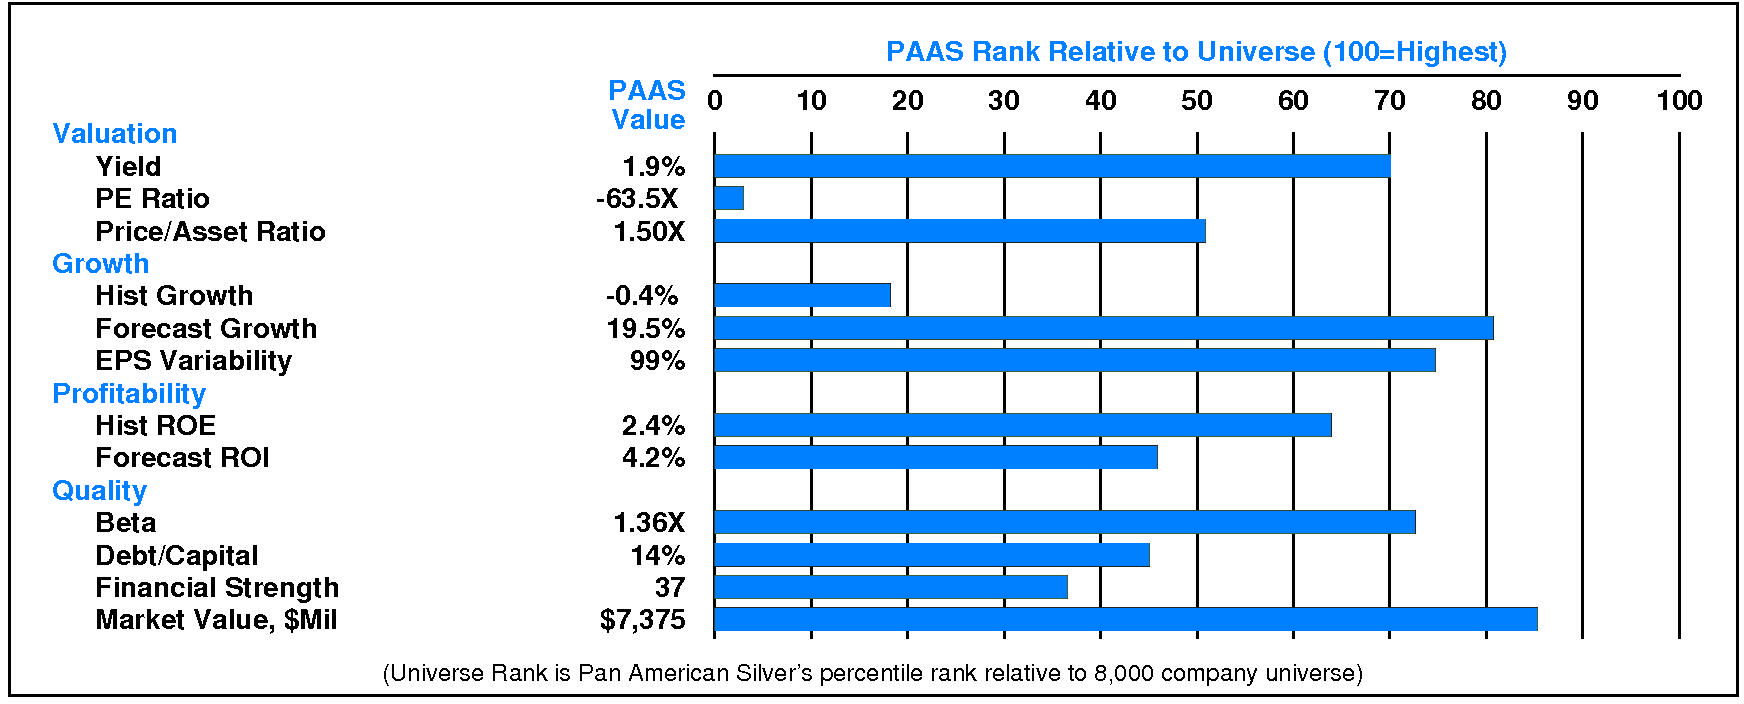
Relative to the S&P 500 Composite, Pan American Silver Corp has slightly more Value than Growth characteristics; its appeal is likely to be to Income-oriented investors; the perception is that PAAS is higher risk.
Relative weaknesses include: low forecasted profitability, low historical profitability, low financial strength, high stock price volatility, low historical growth, and high earnings variability. PAAS' valuation is moderate: moderate dividend yield, high P/E ratio, and low price/book ratio. PAAS has unusually low market capitalization.
CURRENT SIGNALS
Pan American Silver's current operations are eroding.
Return on equity is falling, reflecting: falling asset utilization; declining pretax margin; and falling leverage.
Pan American Silver's current technical position is very strong.
The stock price is in a 3.3 month up move. The stock has appreciated 71.2% from its prior low. The stock price is above its 200 day moving average which is in an uptrend.
ALERTS
Pan American Silver Corp (NYSE: PAAS) has benefited from notable positive changes in fundamentals. Positive developments: significant quarterly sales acceleration occurred, the consensus estimate for December, 2024 increased significantly, and significant quarterly earnings acceleration occurred. Negative development: the consensus estimate for December, 2025 decreased significantly.
The stock is currently rated A.
On 6/24/24, Pan American Silver Corp (NYSE: PAAS) stock declined slightly by -0.2%, closing at $20.27. However, this decline was accompanied by unusually low trading volume at 56% of normal. Relative to the market the stock has been exceptionally strong over the last nine months and has risen 2.5% during the last week.
CASH FLOW
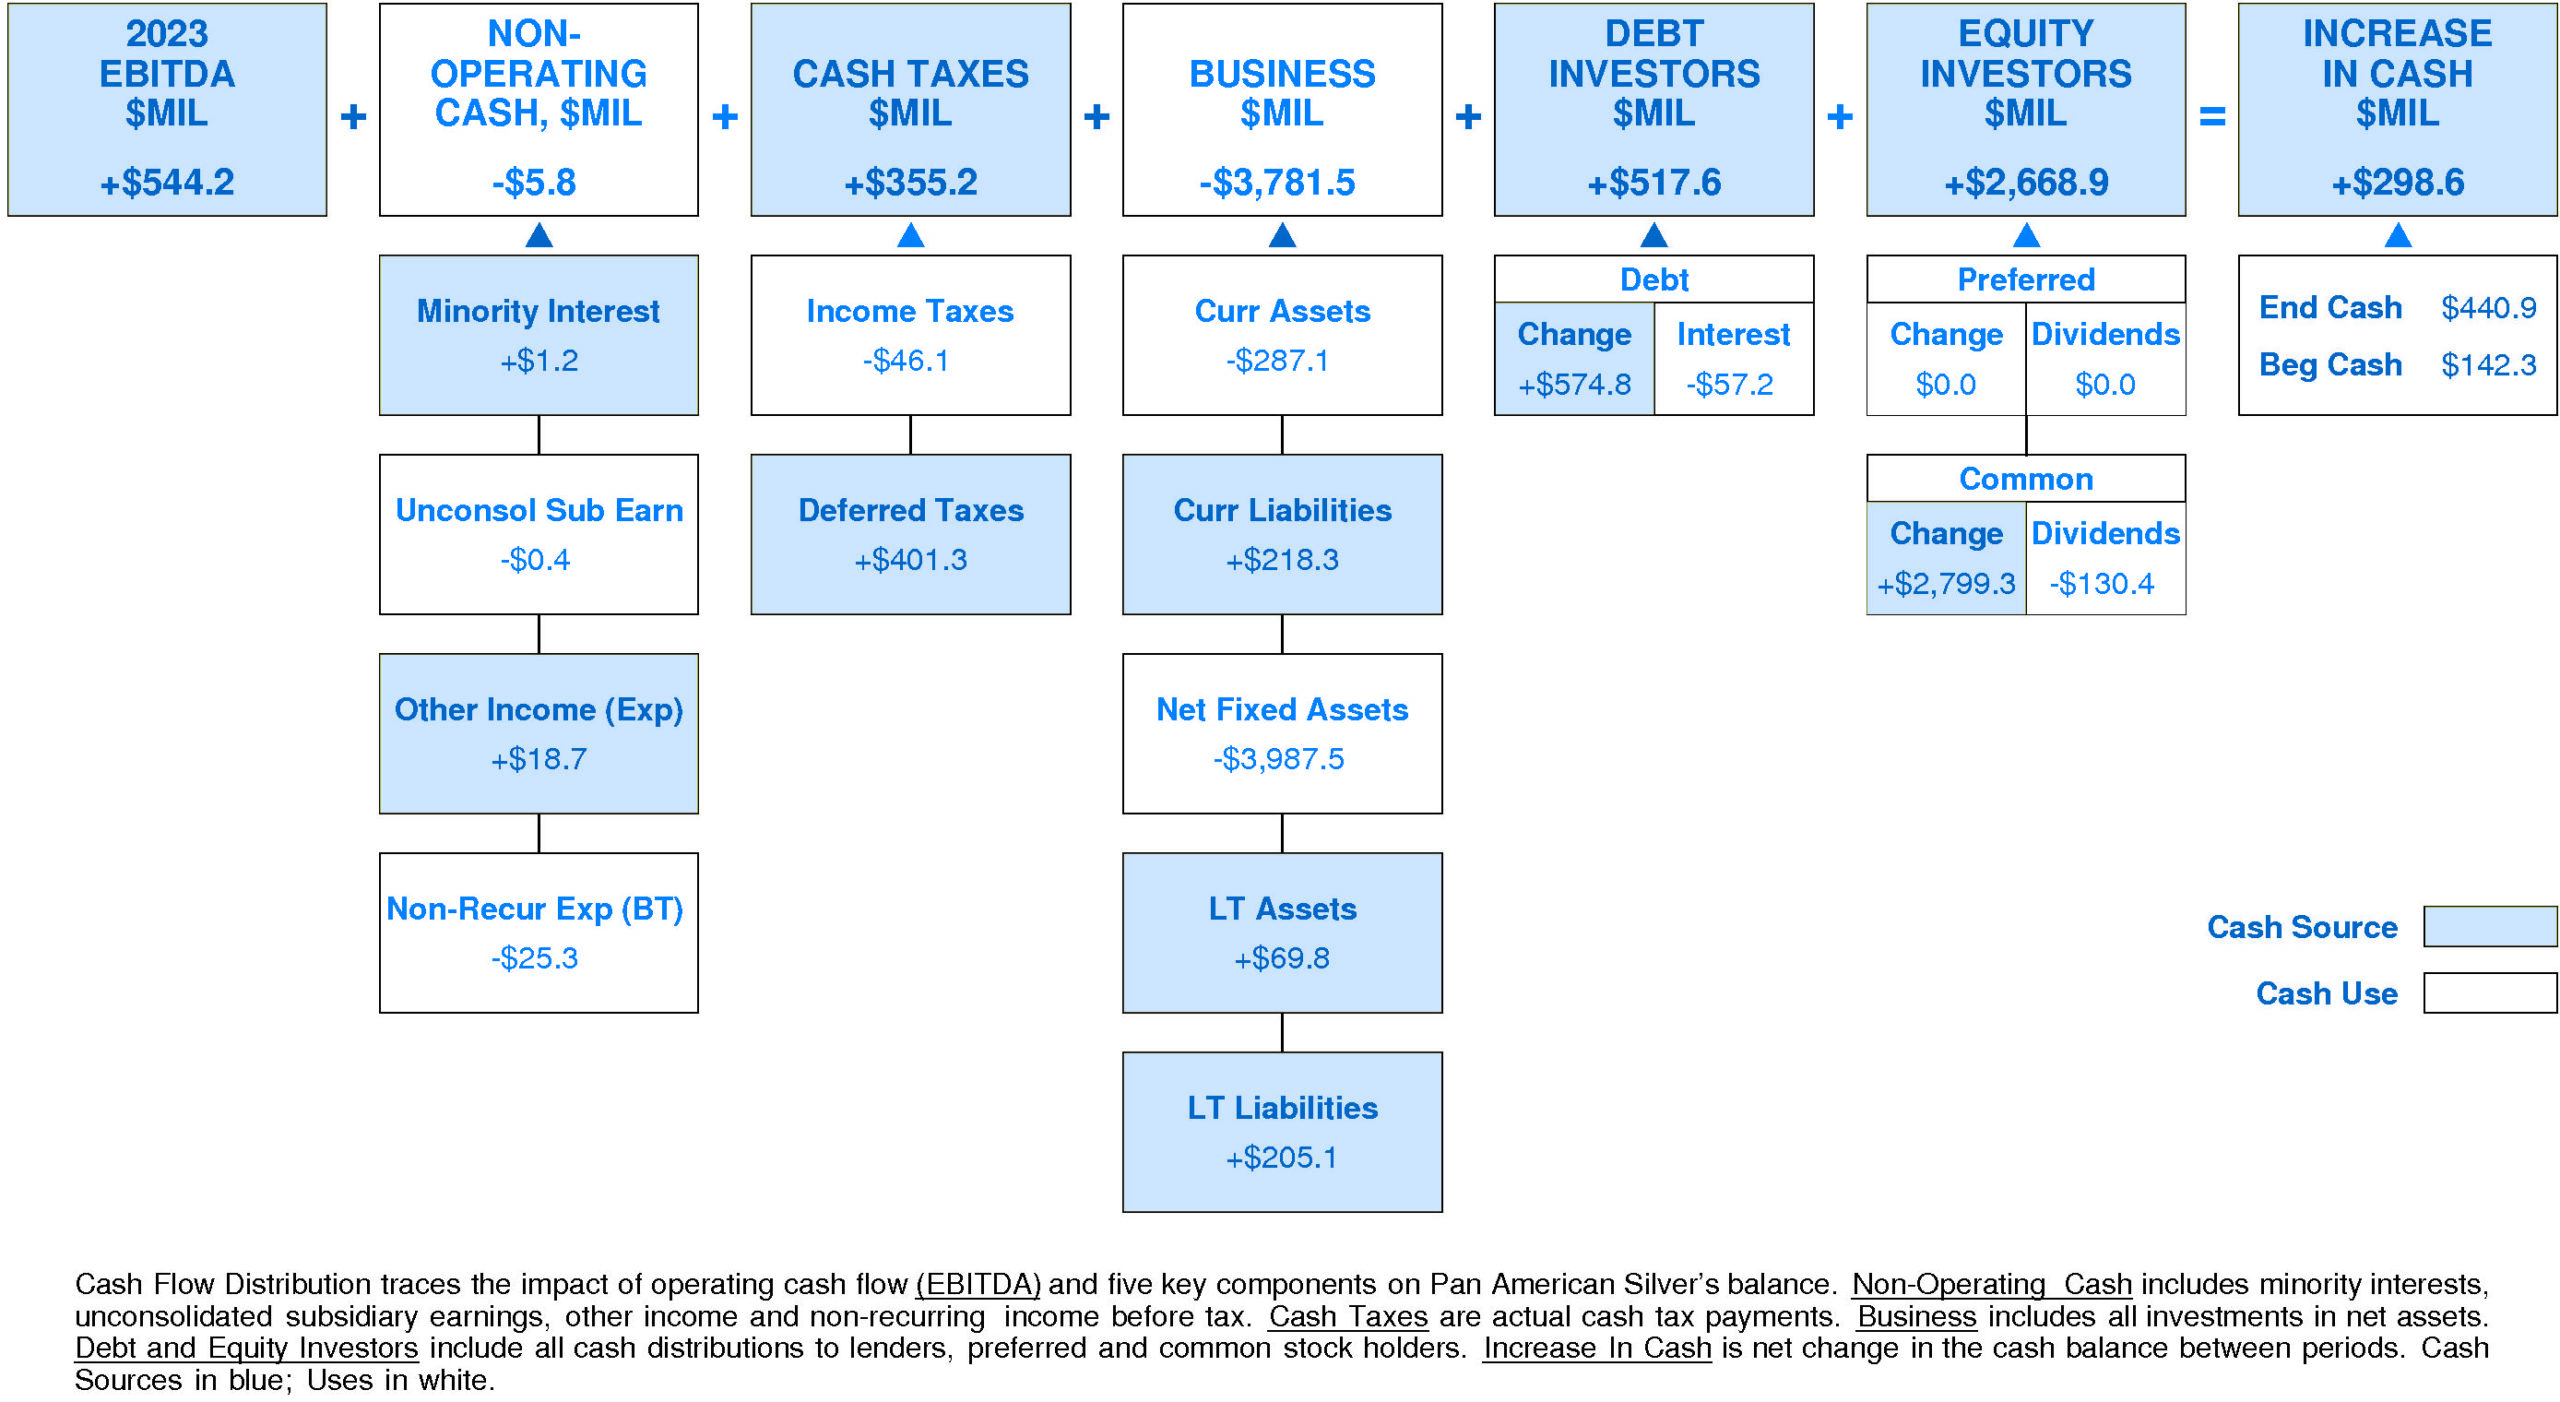
In 2023, Pan American Silver generated a very significant increase in cash of +$298.6 million (+210%). Sources of cash were much larger than uses.
Cash generated from 2023 EBITDA totaled +$544.2 million. Non-operating uses consumed -$5.8 million (-1% of EBITDA). Cash taxes contributed +$355.2 million (+65% of EBITDA). Re-investment in the business amounted to -$3,781.5 million (-695% of EBITDA). On a net basis, debt investors provided +$517.6 million (+95% of EBITDA) while equity investors provided +$2,668.9 million (+490% of EBITDA).
Pan American Silver's Non-operating Income, %EBITDA has suffered a volatile overall downtrend over the period.
This downtrend was accompanied by stability for the Pan American Silver Peer Group. In most years, Pan American Silver was in the top quartile and third quartile. Currently, Pan American Silver is below median at -1% of EBITDA (-$5.8 million).
Pan American Silver's Cash Taxes, %EBITDA has exhibited little to no overall change over the period.
This stability was accompanied by an uptrend for the Pan American Silver Peer Group. In most years, Pan American Silver was in the top quartile and second quartile. Currently, Pan American Silver is upper quartile at +65% of EBITDA (+$355.2 million).
Pan American Silver's Business Re-investment, %EBITDA has suffered a very strong overall downtrend over the period.
This downtrend was accompanied by stability for the Pan American Silver Peer Group. (Since 2020 Business Re-investment, %EBITDA has accelerated very sharply.) In most years, Pan American Silver was in the third quartile and lower quartile. Currently, Pan American Silver is lower quartile at -695% of EBITDA (-$3,781.5 million).
Pan American Silver's Debt Investors, %EBITDA has experienced a very strong overall uptrend over the period.
This improvement was accompanied by stability for the Pan American Silver Peer Group. (Since 2020 Debt Investors, %EBITDA has accelerated very sharply.) In most years, Pan American Silver was in the top quartile and lower quartile. Currently, Pan American Silver is at the upper quartile at +95% of EBITDA (+$517.6 million).
Pan American Silver's Equity Investors, %EBITDA has enjoyed a volatile overall uptrend over the period.
This improvement was accompanied by stability for the Pan American Silver Peer Group. In most years, Pan American Silver was in the top quartile. Currently, Pan American Silver is upper quartile at +490% of EBITDA (+$2,668.9 million).
Pan American Silver's Change in Cash, %EBITDA has experienced a volatile overall downtrend over the period.
This downtrend was accompanied by a similar trend for the Pan American Silver Peer Group. In most years, Pan American Silver was in the second quartile and top quartile. Currently, Pan American Silver is upper quartile at +55% of EBITDA (+$298.6 million).
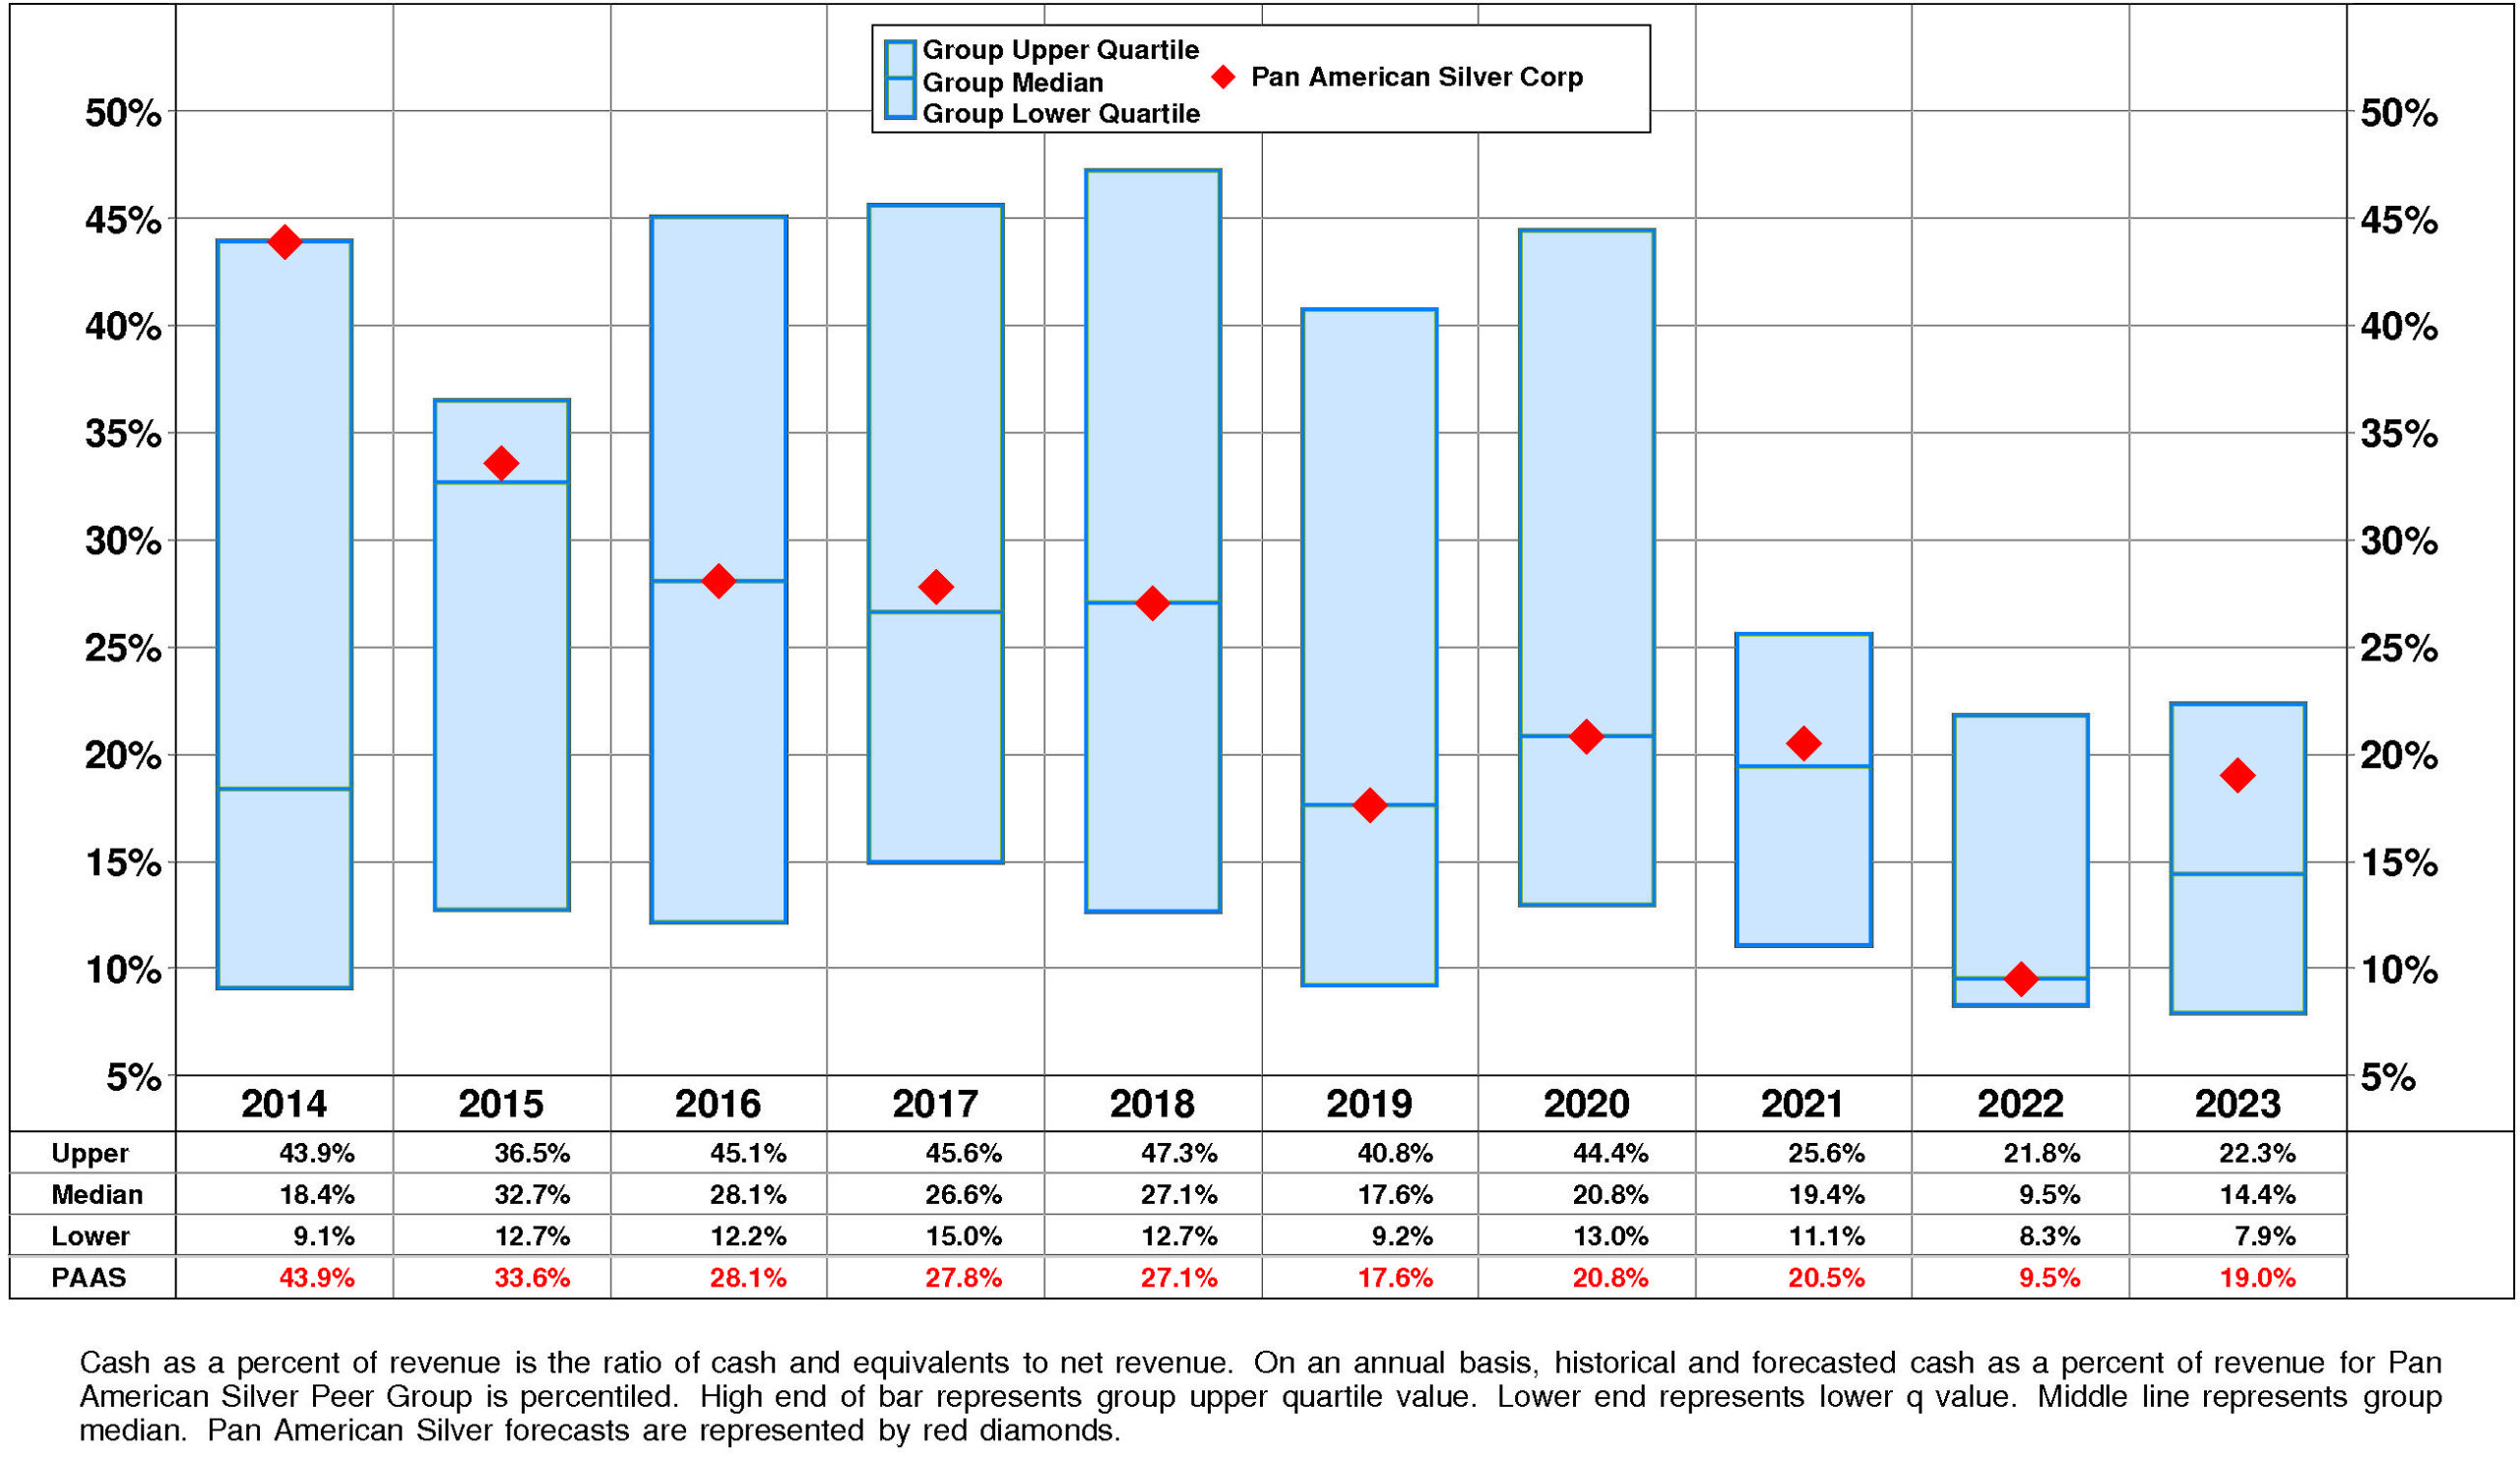
Pan American Silver's Cash, %Revenue has suffered a strong overall downtrend over the period.
This downtrend was accompanied by a similar trend for the Pan American Silver Peer Group. In most years, Pan American Silver was in the second quartile. Currently, Pan American Silver is above median at +19%.
PROFITABILITY
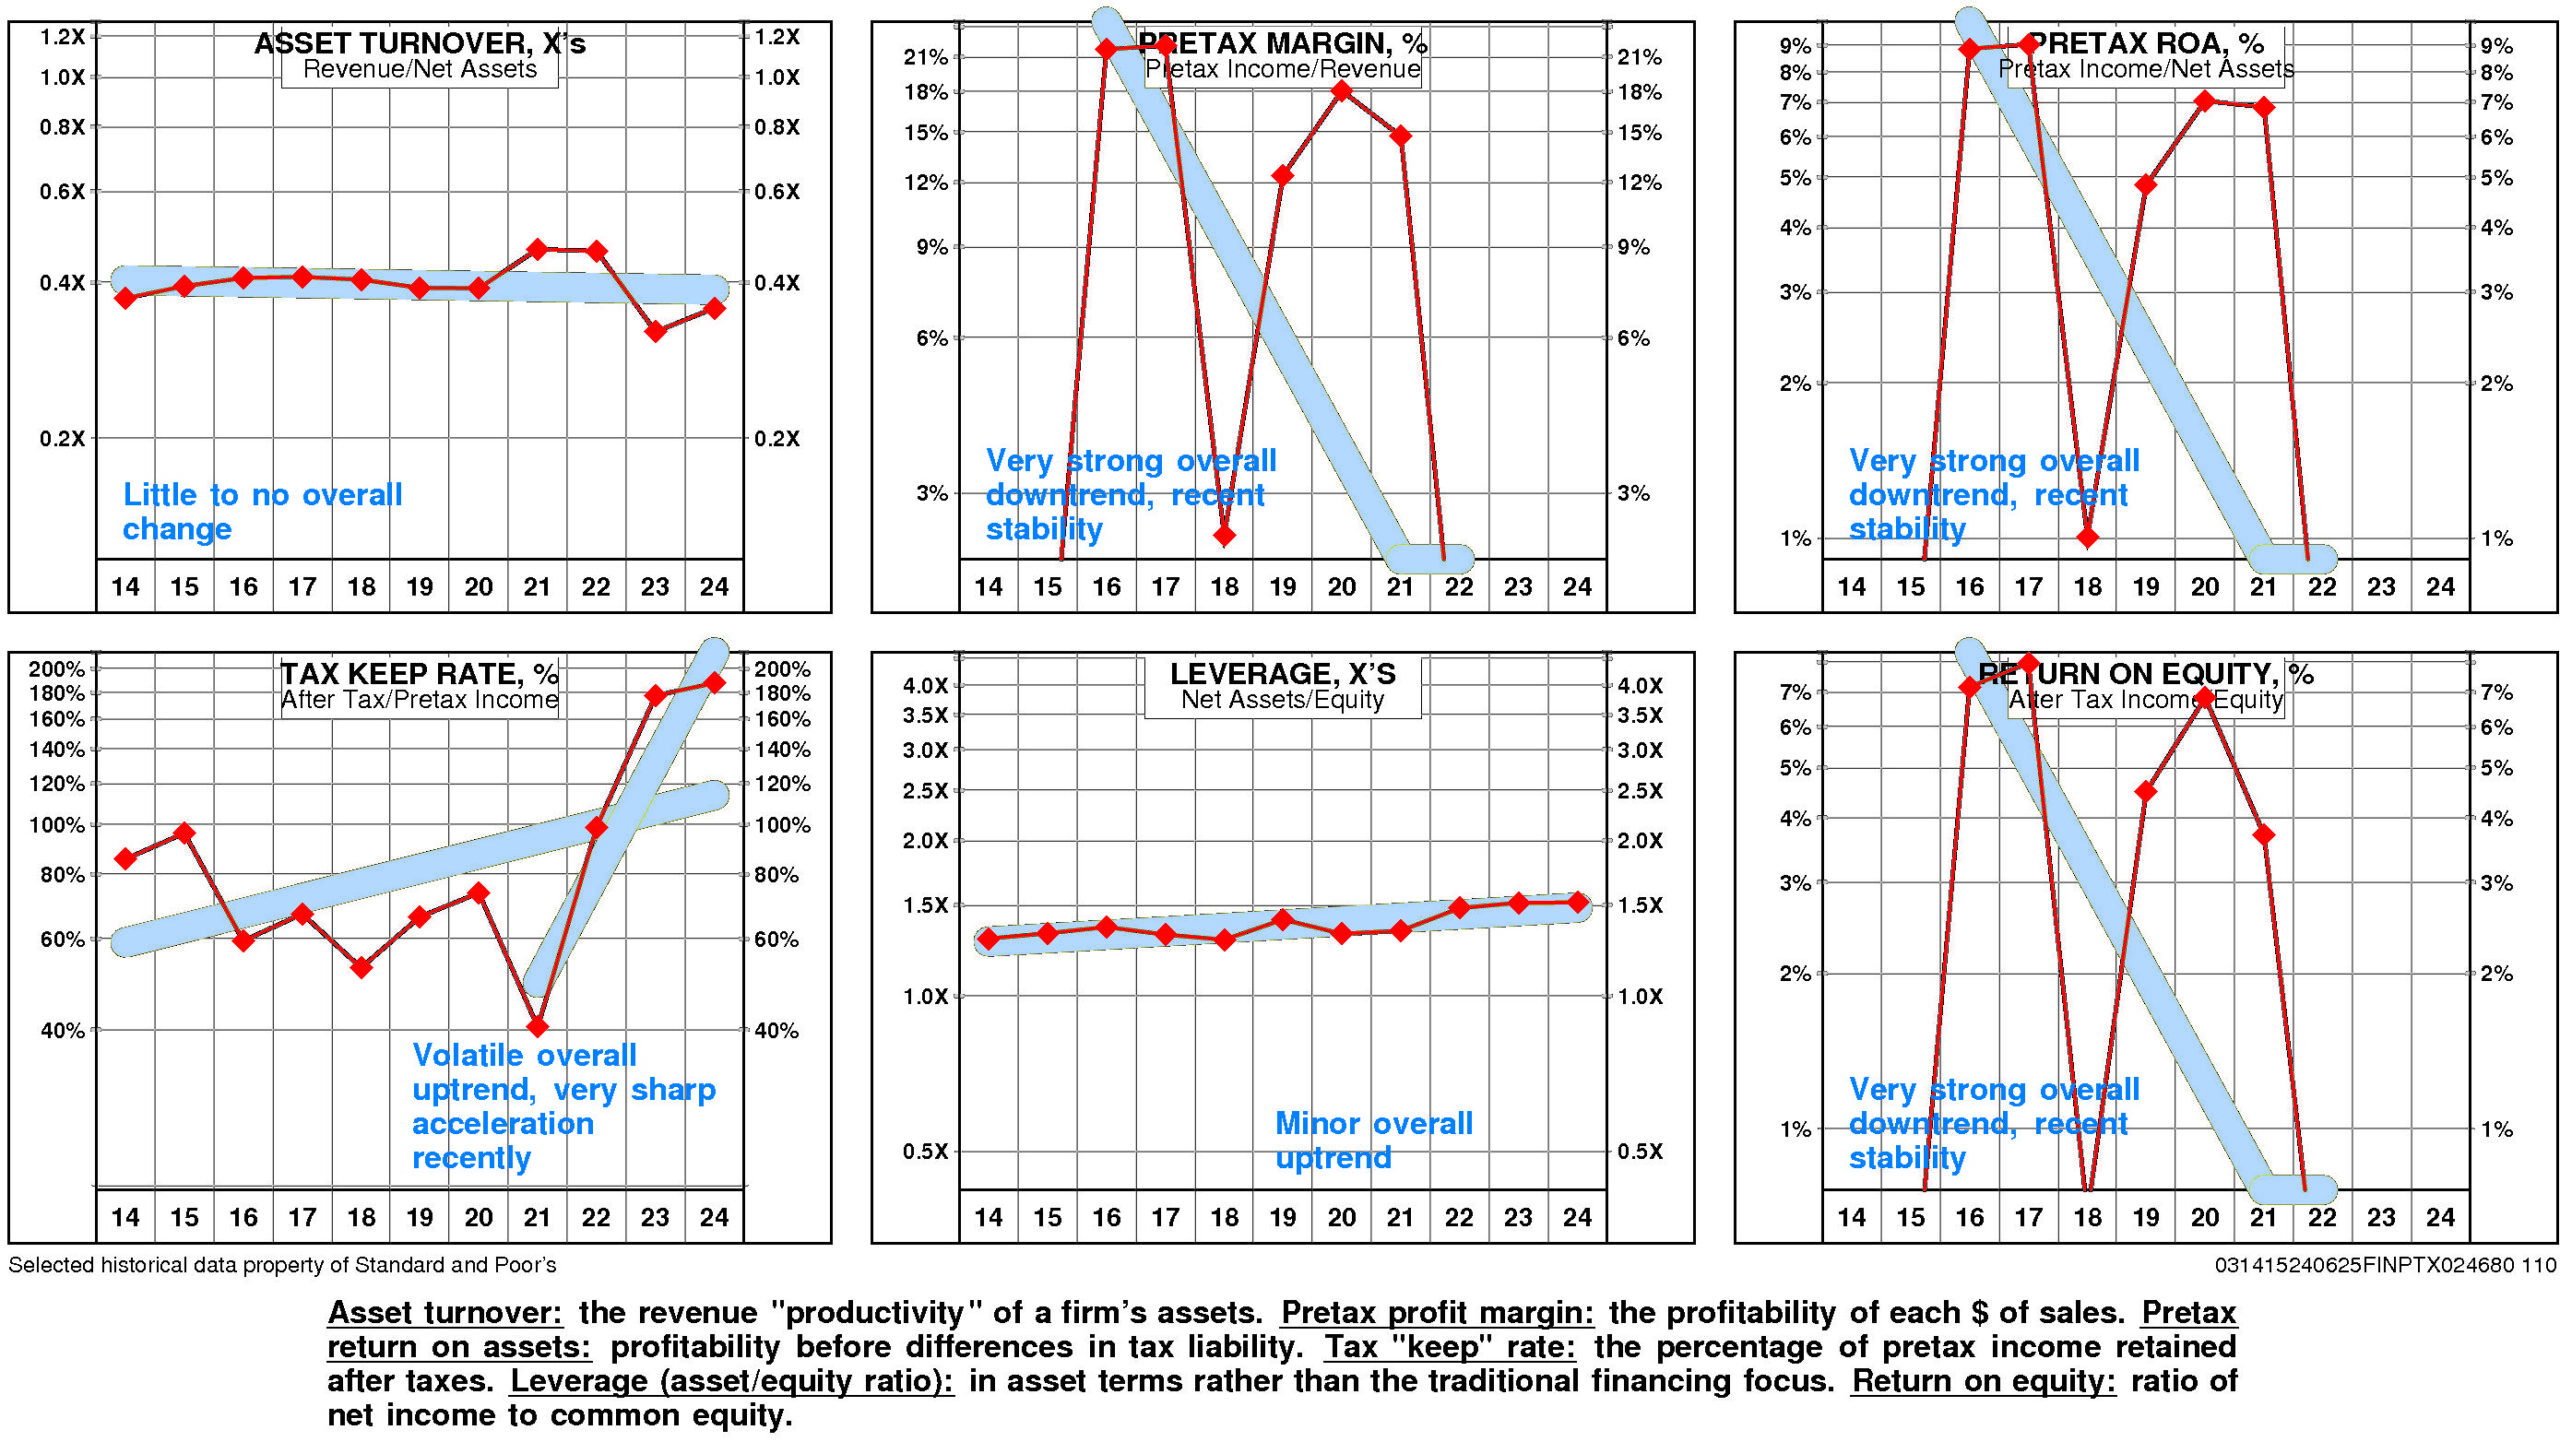
Pan American Silver's return on equity has eroded very significantly since 2016. The current level is -3.2% versus the high of 7.2% and the low of -15.6%.
This very significant erosion was due to very strong negative trend in pretax operating return and strong positive trend in non-operating factors.
The productivity of Pan American Silver's assets remained stable over the full period 2014-2024: asset turnover has exhibited little to no overall change.
Additionally, pretax margin experienced a very strong overall downtrend although it recently stabilized from the 2023 level.
Non-operating factors (income taxes and financial leverage) had a significant positive influence on return on equity.
Pan American Silver's return on equity is lower quartile (-3.2%) for the four quarters ended March, 2024.
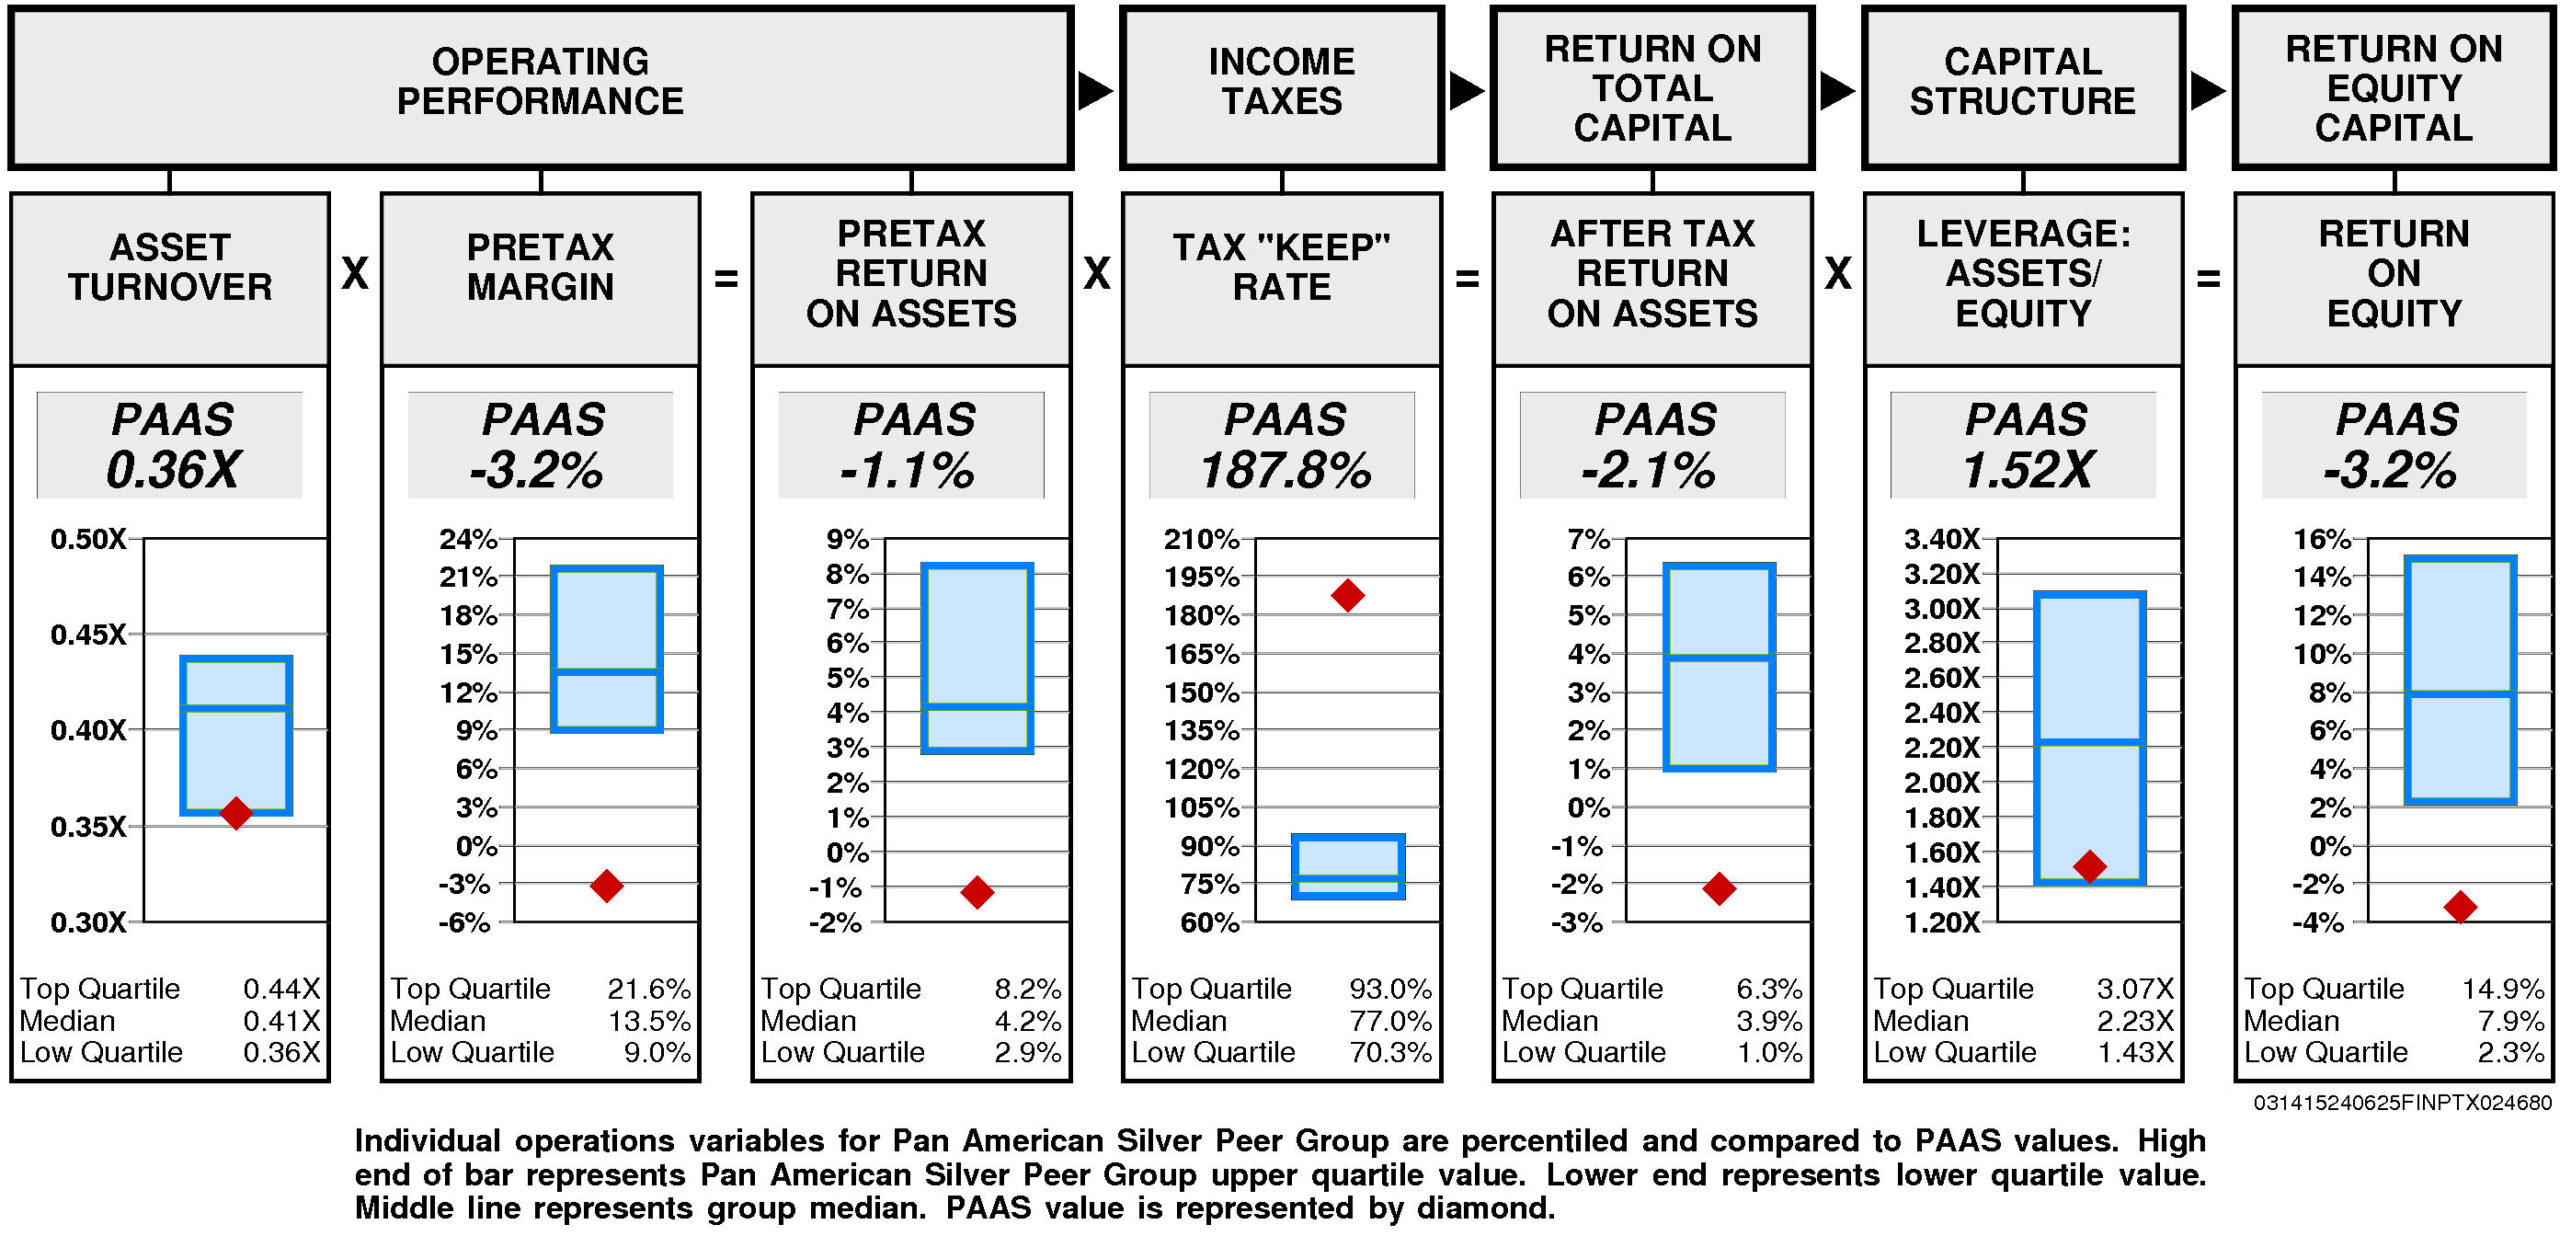
Operating performance (pretax return on assets) is lower quartile (-1.1%) reflecting asset turnover that is at the lower quartile (0.36X) and lower quartile pretax margin (-3.2%).
Tax “keep” rate (income tax management) is upper quartile (187.8%) resulting in after tax return on assets that is lower quartile.
Financial leverage (leverage) is substantially below median (1.52X).
GROWTH RATES
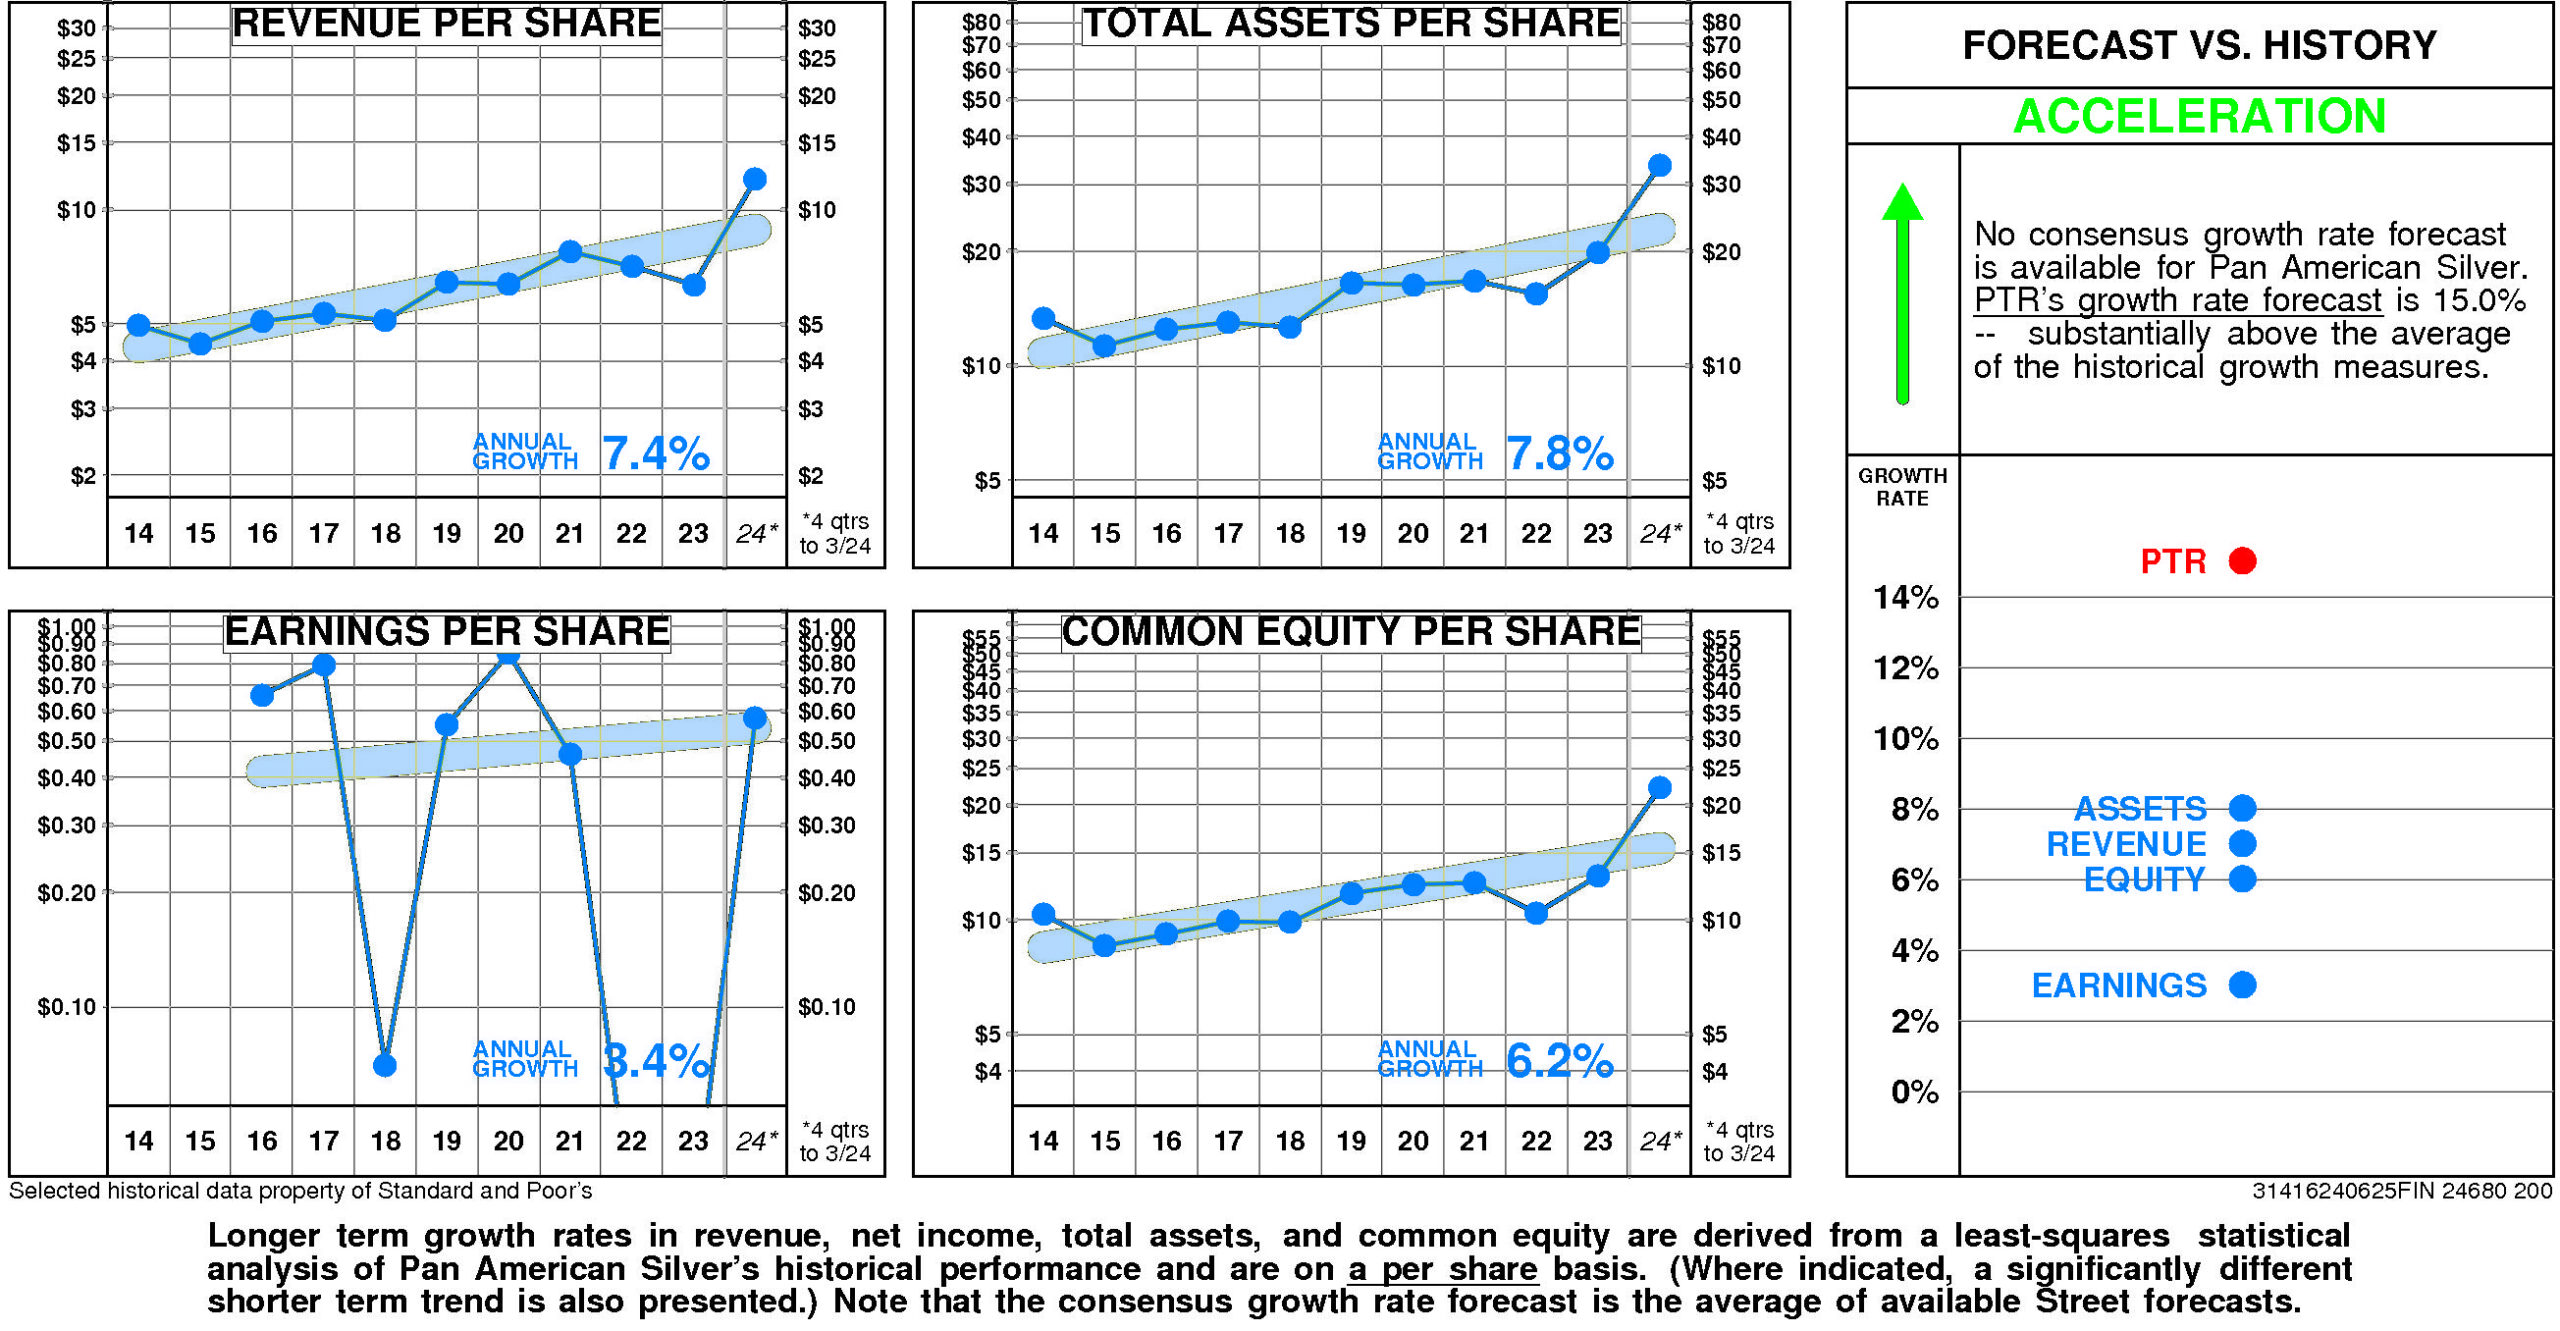
There are no significant differences between Pan American Silver's longer term growth and growth in recent years.
Pan American Silver's historical income statement growth has been in line with balance sheet growth. Revenue growth has paralleled asset growth; earnings growth has paralleled equity growth.
Annual revenue growth
has been 7.4% per year.
Total asset growth
has been 7.8% per year.
Annual E.P.S. growth
has been 3.4% per year.
Equity growth
has been 6.2% per year.
No consensus growth rate forecast is available for Pan American Silver.
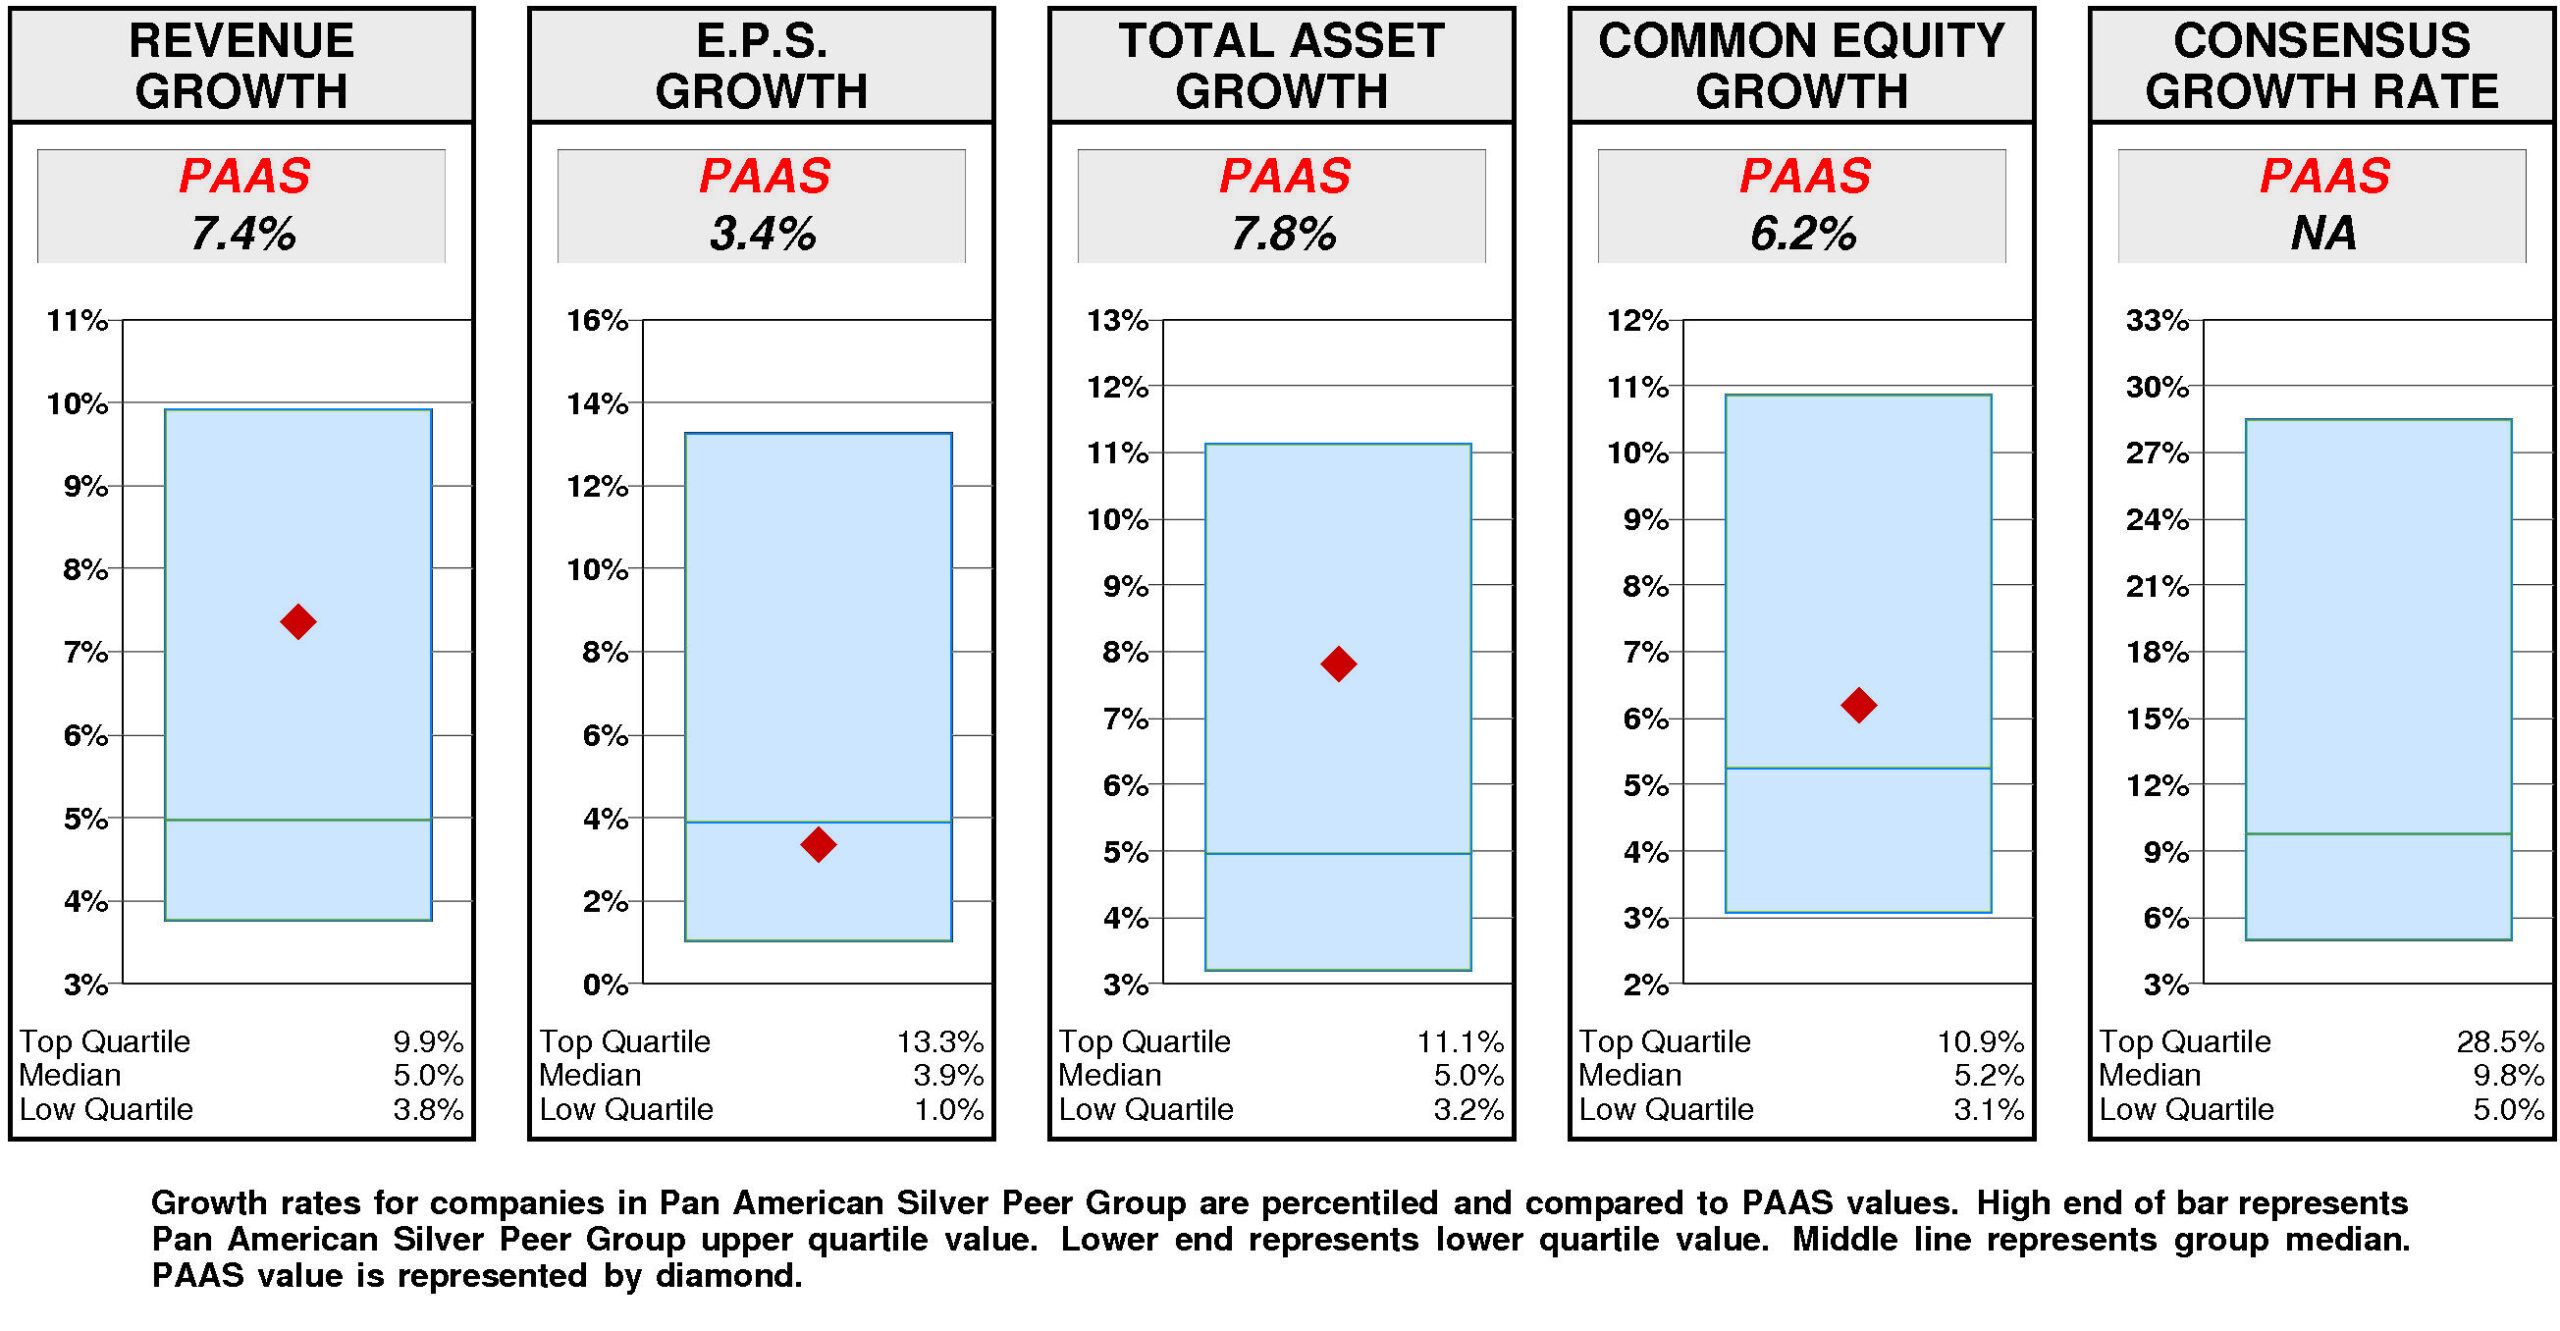
Relative to the Pan American Silver Peer Group, Pan American Silver's historical growth measures are generally second quartile.
Revenue growth (7.4%) has been above median. Total asset growth (7.8%) has been above median. Equity growth (6.2%) has been slightly above median. E.P.S. growth (3.4%) has been slightly below median.
Consensus growth forecast is unavailable.
PRICE HISTORY
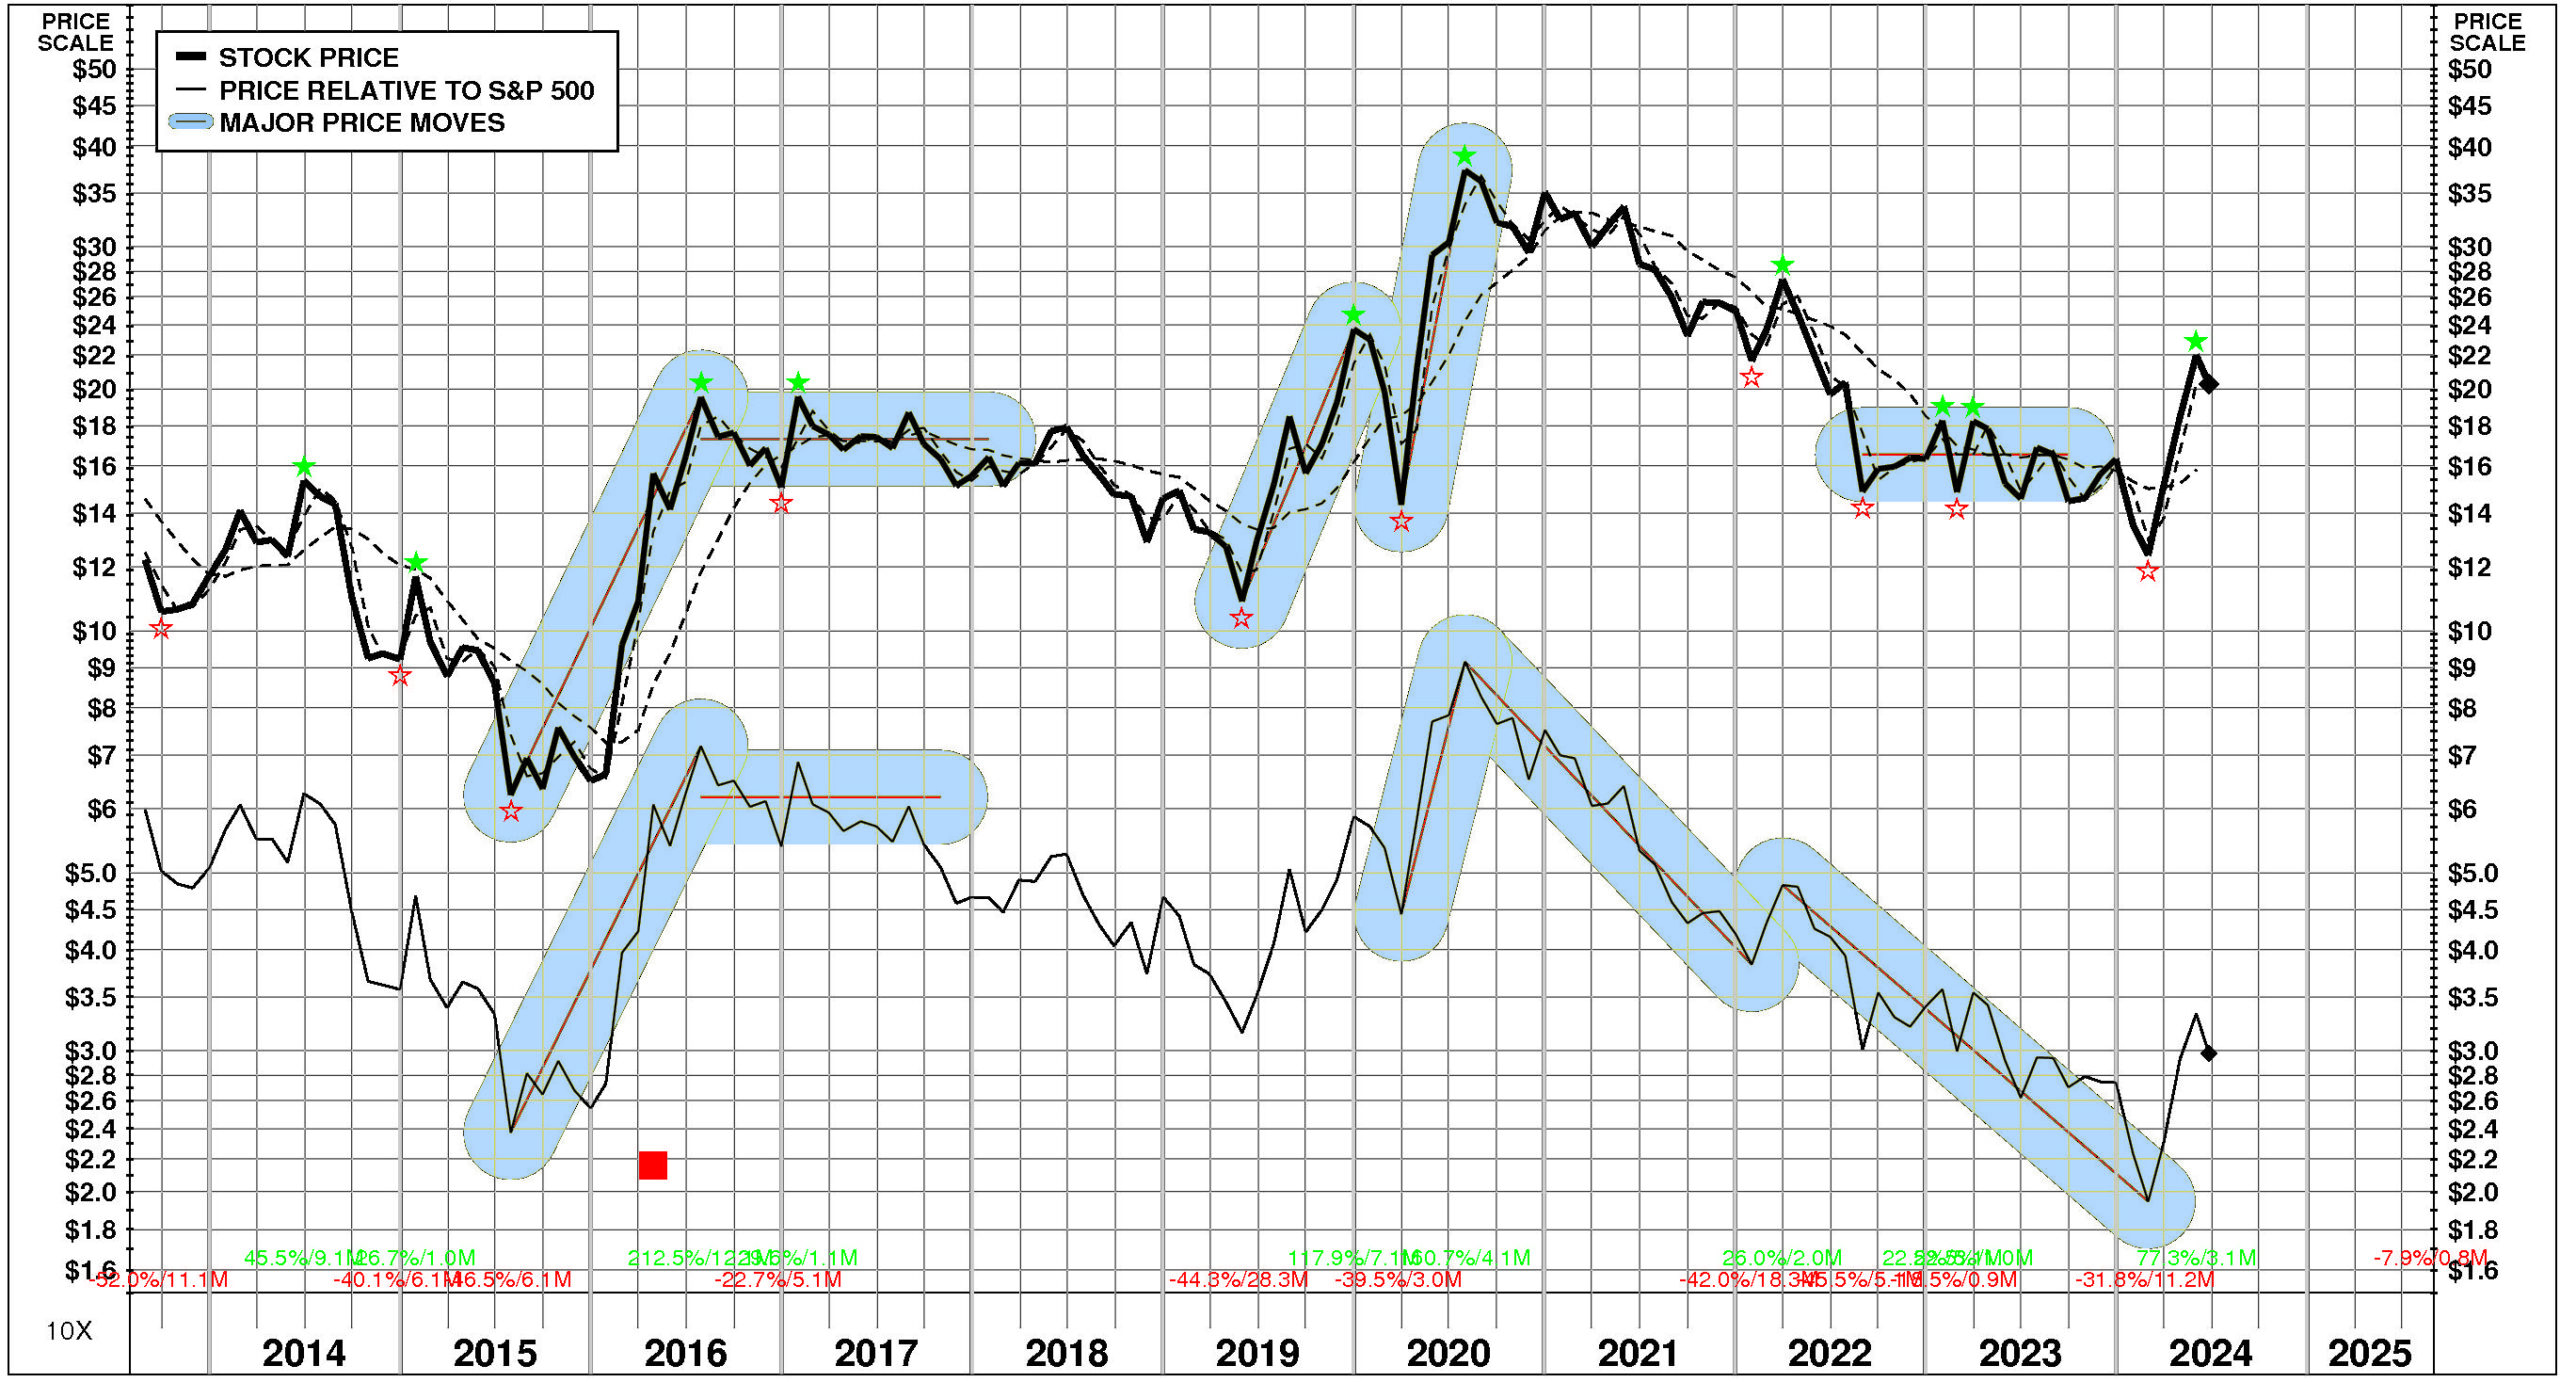
Over the full time period, Pan American Silver's stock price performance has been volatile and significantly below market.
Between August, 2013 and June, 2024, Pan American Silver's stock price rose +66%; relative to the market, this was a -50% loss. Significant price moves during the period: 1) March, 2020 – July, 2020: +161%; 2) May, 2019 – December, 2019: +118%; and 3) July, 2015 – July, 2016: +213%.
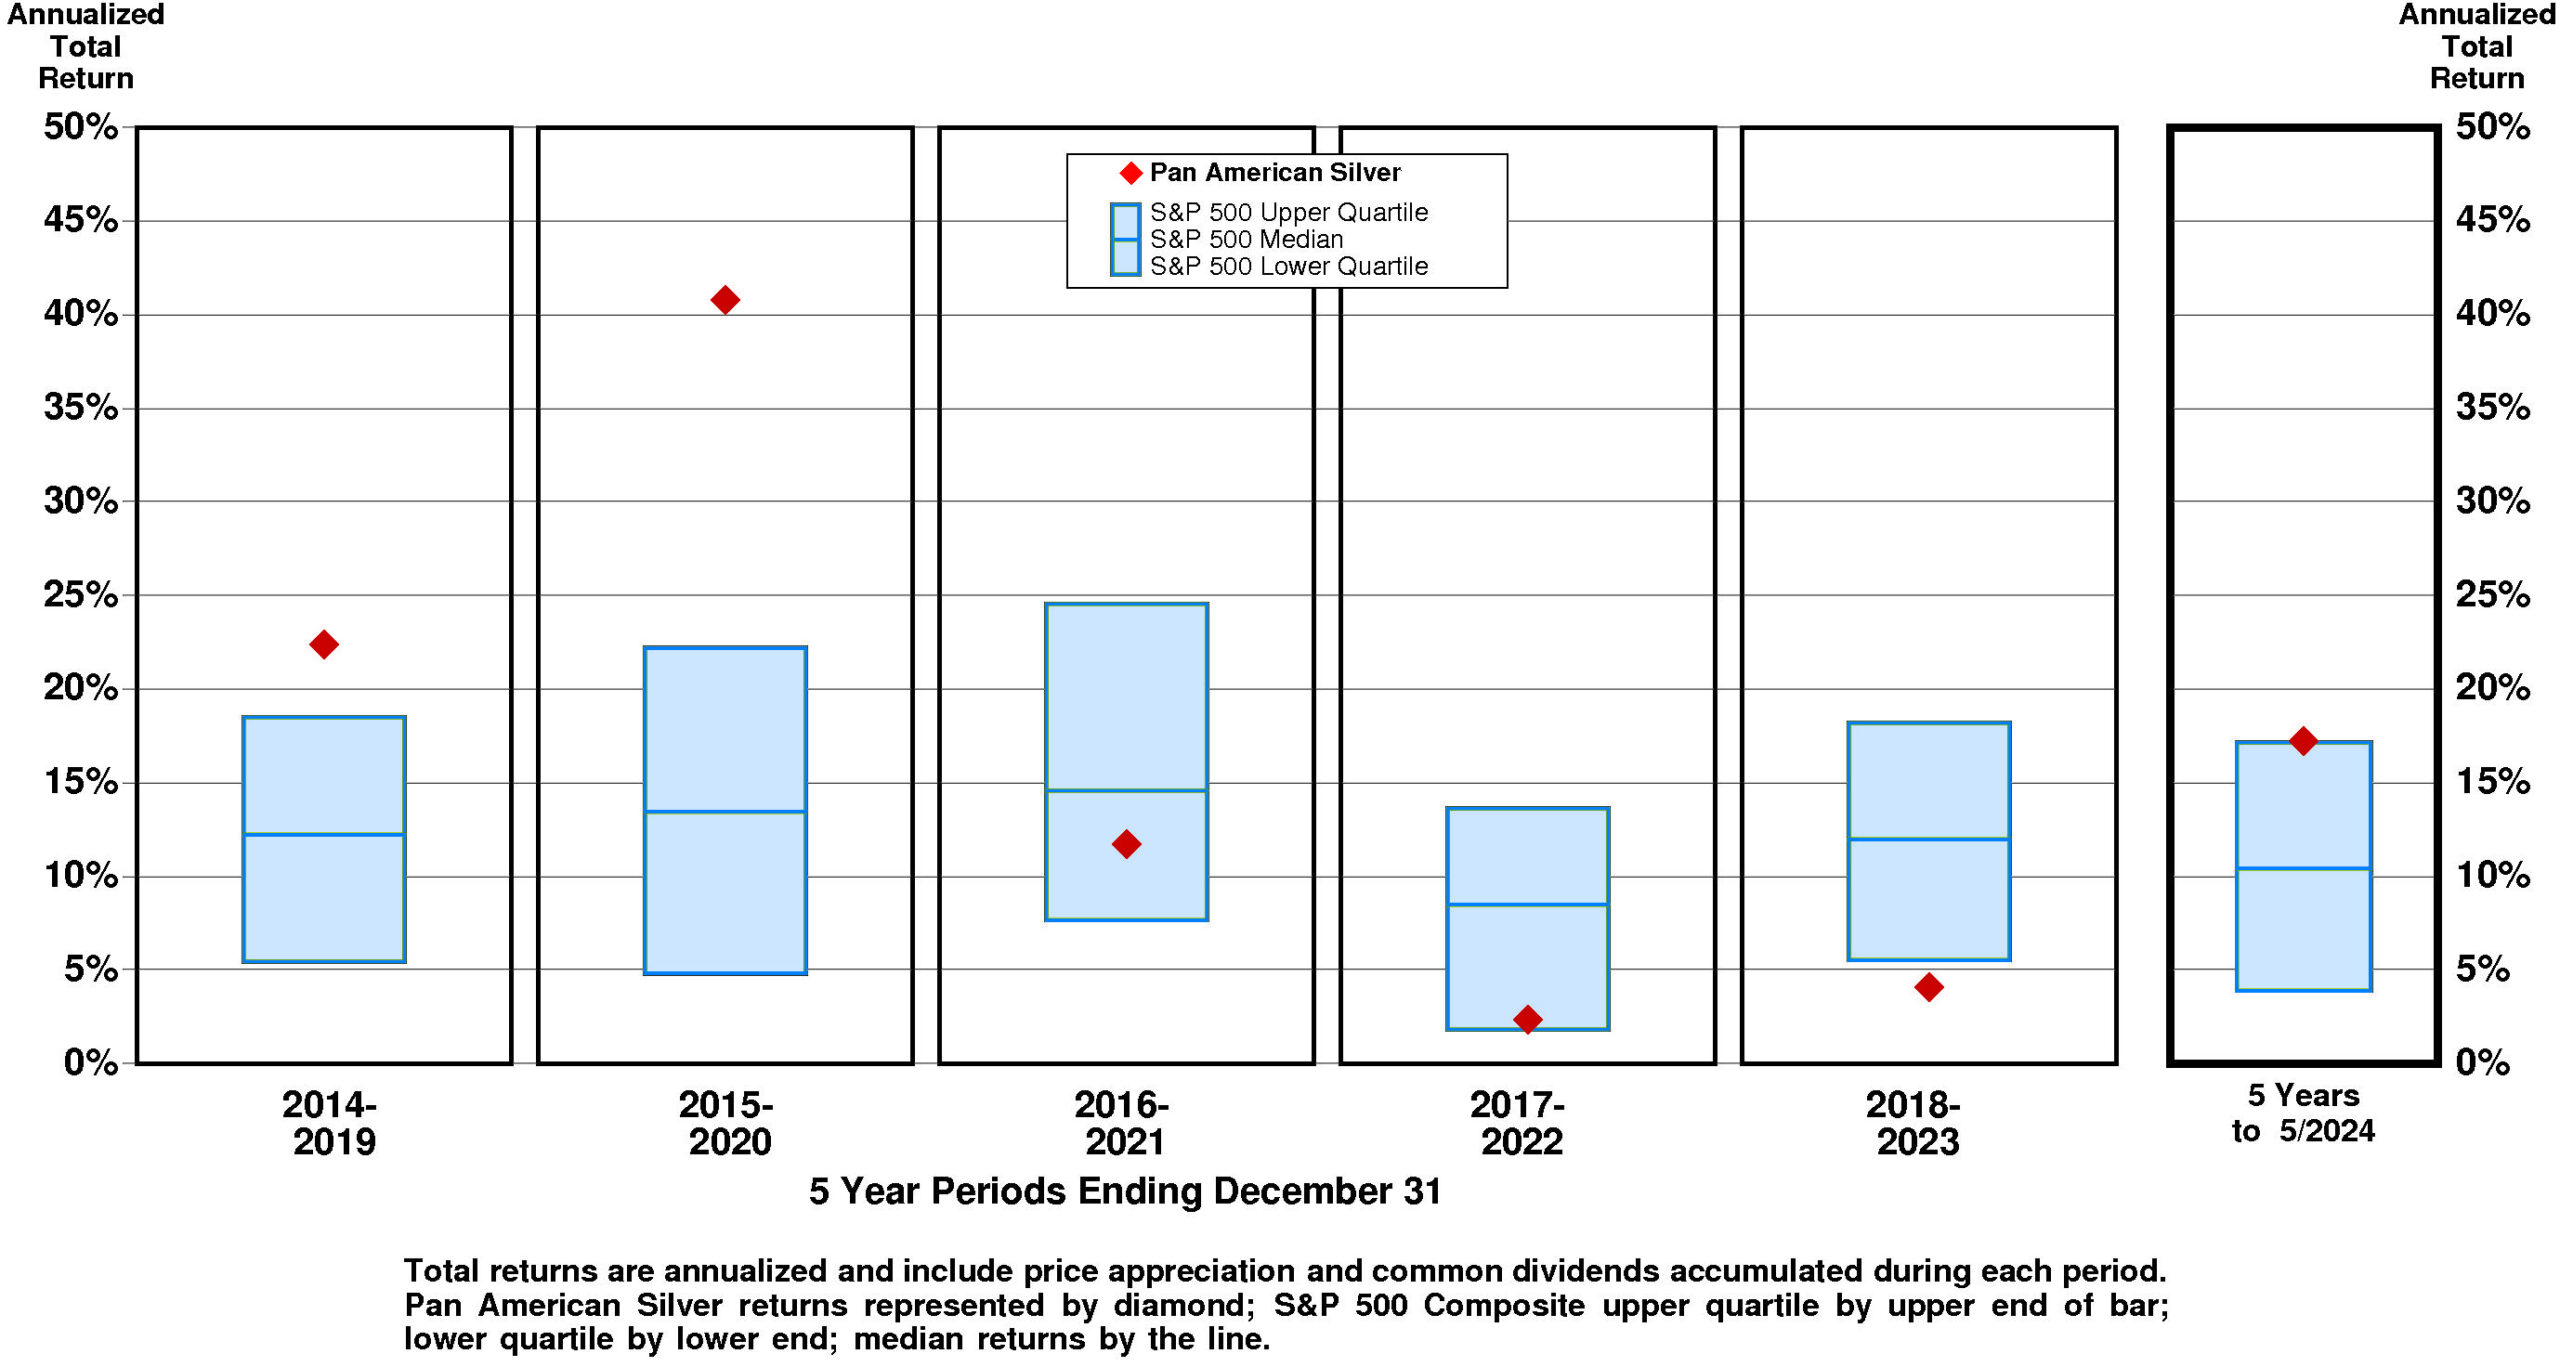
TOTAL INVESTMENT RETURNS
Current annual total return performance of 47.9% is upper quartile relative to the S&P 500 Composite.
In addition to being upper quartile relative to S&P 500 Composite, current annual total return performance through May, 2024 of 47.9% is at the upper quartile relative to Pan American Silver Corp Peer Group.
Current 5-year total return performance of 17.2% is at the upper quartile relative to the S&P 500 Composite.
Through May, 2024, with current 5-year total return of 17.2% relative to S&P 500 Composite at the upper quartile, Pan American Silver's total return performance is at the upper quartile relative to Pan American Silver Corp Peer Group.
VALUATION BENCHMARKS
Relative to S&P 500 Composite, PAAS' overall valuation is quite low.
Ratio of enterprise value/revenue is slightly below median. Ratio of enterprise value/assets is below median. Price/equity ratio is lower quartile. Price/earnings ratio is unavailable. Ratio of enterprise value/earnings before interest and taxes is unavailable.
Relative to Pan American Silver Peer Group, PAAS' overall valuation is normal.
Ratio of enterprise value/revenue is at median. Ratio of enterprise value/assets is at median. Price/equity ratio is below median. Price/earnings ratio is unavailable. Ratio of enterprise value/earnings before interest and taxes is unavailable.
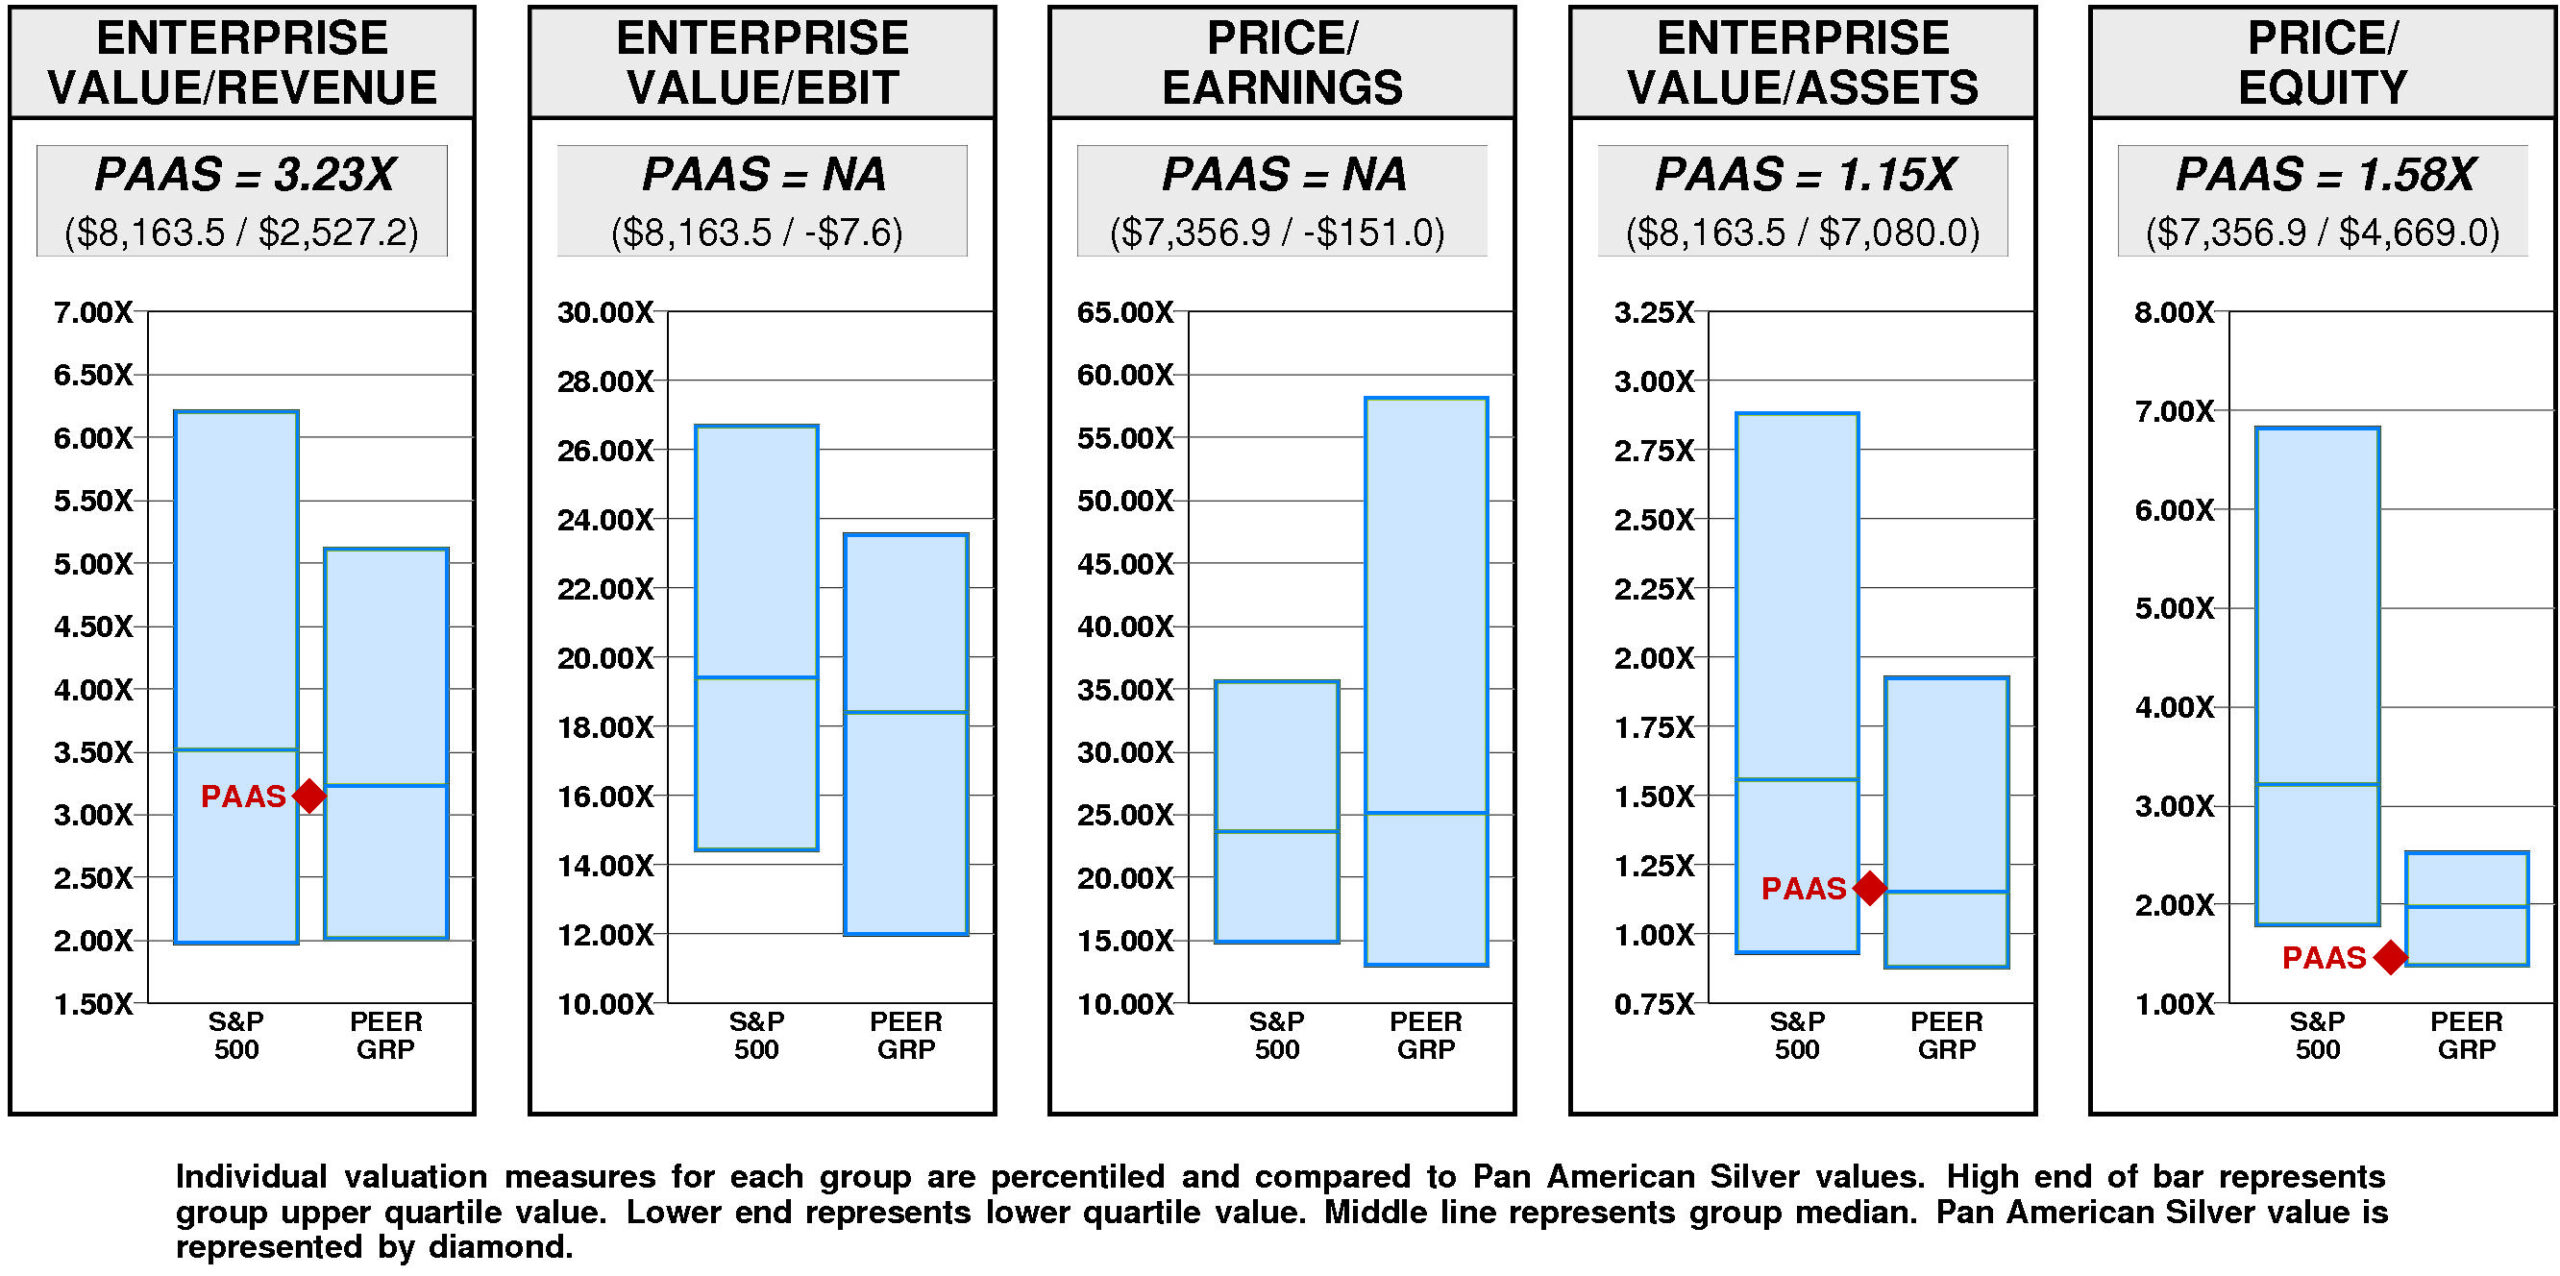
Pan American Silver has a major value gap compared to median valuation.
For PAAS to fall to lower quartile valuation, its current ratio of enterprise value/revenue would have to decline from the current level of 3.23X to 2.02X. If PAAS' ratio of enterprise value/revenue were to decline to 2.02X, its stock price would be lower by $-8 to $12.
For PAAS to achieve upper quartile valuation relative to the Pan American Silver Peer Group, its current ratio of enterprise value/revenue would have to rise from the current level of 3.23X to 5.11X. If PAAS' ratio of enterprise value/revenue were to rise to 5.11X, its stock price would increase by $13 from the current level of $20.
VALUE TARGETS
PAAS' future returns on capital are forecasted to exceed the cost of capital. Accordingly, the company is expected to be a modest Value Builder.
Pan American Silver's current Price Target of $38 represents a +107% change from the current price of $18.25.
This moderately high appreciation potential results in an appreciation score of 66 (only 34% of the universe has greater appreciation potential.)
Reinforcing this moderately high Appreciation Score of 66, the high Power Rating of 90 contributes to an Value Trend Rating of A.
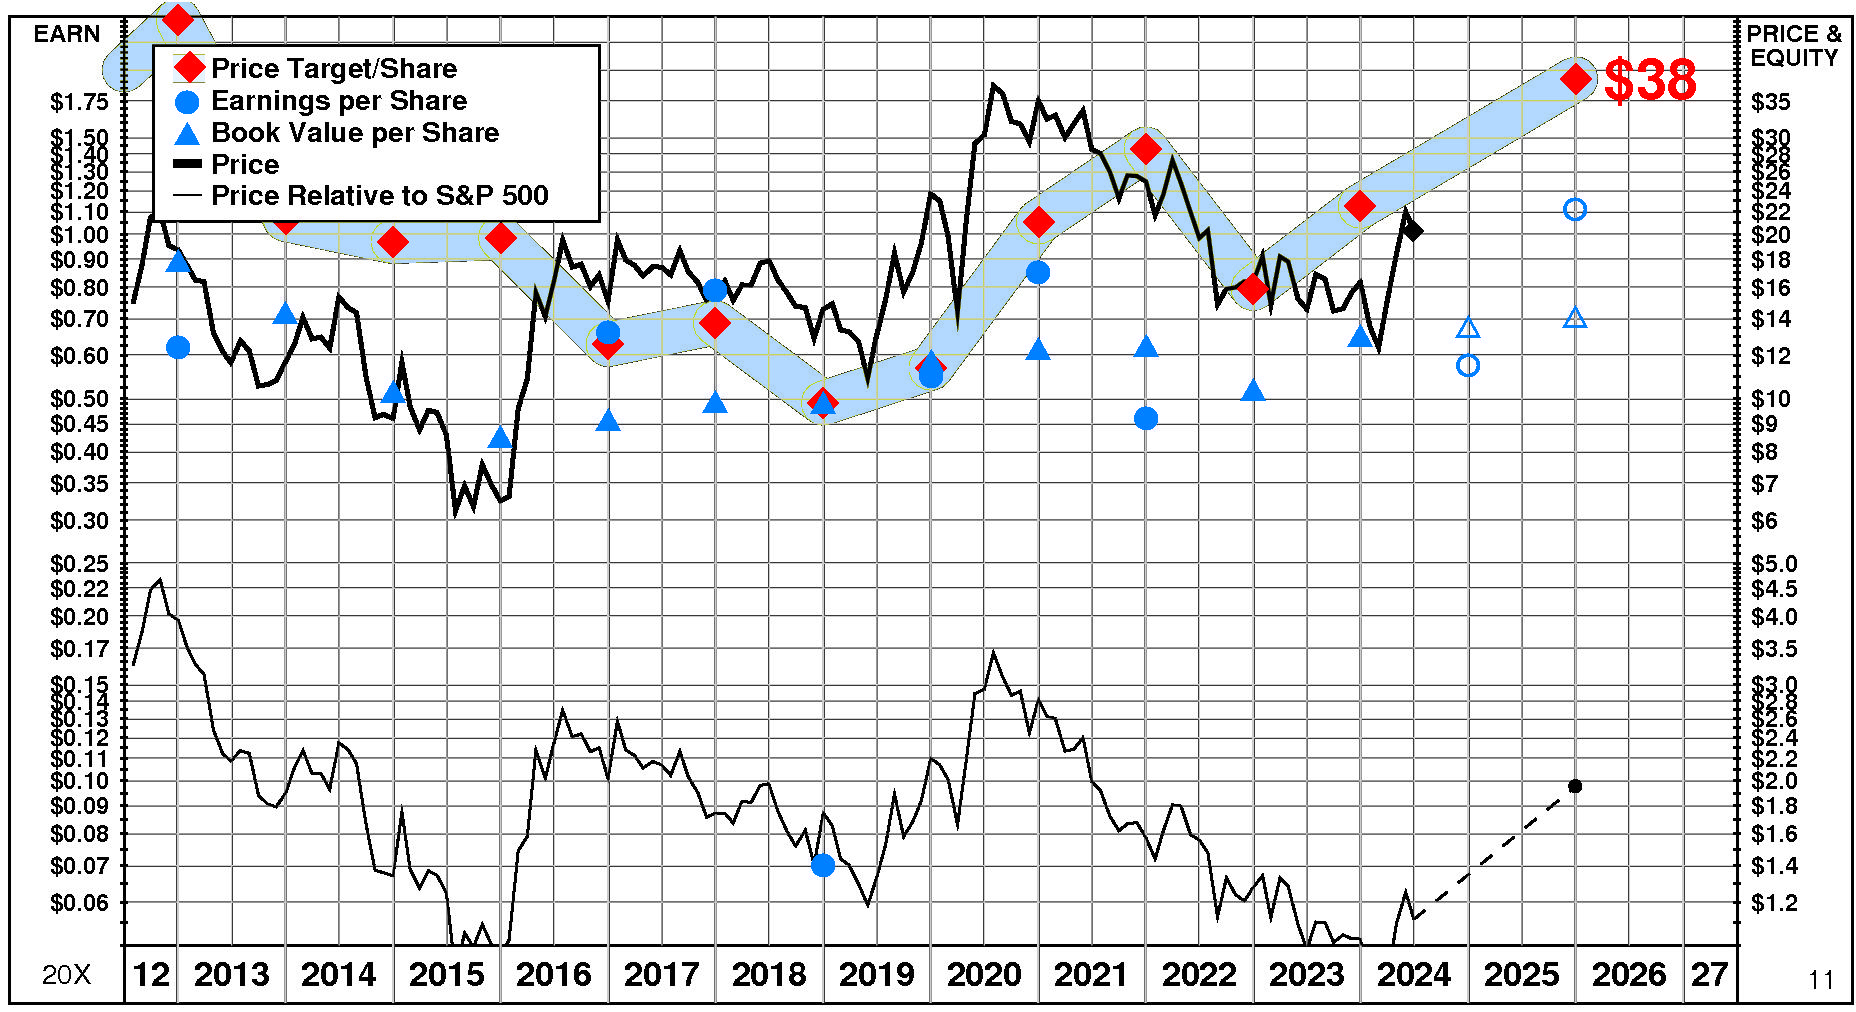
Pan American Silver's current Price Target is $38 (+68% from the 2023 Target of $22 and +107% from the 05/03/24 price of $18.25).
This dramatic rise in the Target is the result of a +11% increase in the equity base and a +52% increase in the price/equity multiple. The forecasted increase in return on equity has a huge positive impact on the price/equity multiple and the forecasted increase in growth has a slight positive impact as well. Partially offsetting these Drivers, the forecasted increase in cost of equity has a very large negative impact.
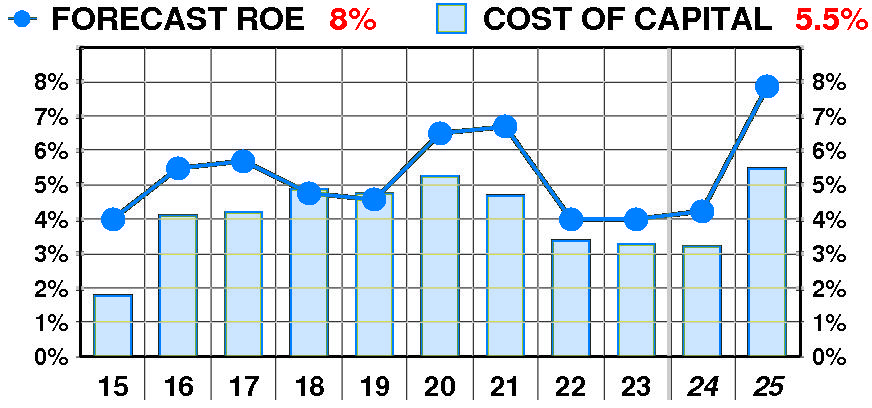
PTR's return on equity forecast is 8.3% — slightly above our recent forecasts.
Forecasted return on equity exhibited a slight, erratic decline between 2015 and 2023. The current forecast is above the 2015 low of 4%.
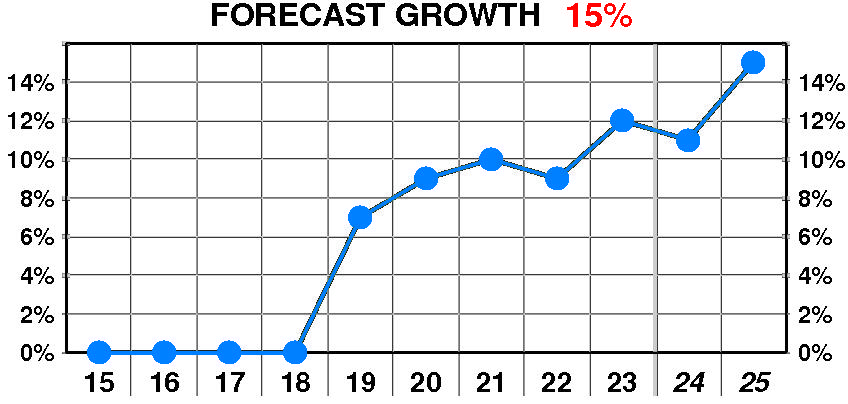
PTR's growth forecast is 15.0% — slightly above our recent forecasts.
Forecasted growth enjoyed a dramatic, variable increase between 2019 and 2023. The current forecast is well above the 2019 low of 7%.
PTR's cost of equity forecast is 5.7% — slightly above recent levels.
Forecasted cost of equity suffered a dramatic, erratic increase between 2015 and 2023. The current forecast is above the 2015 low of 1.8%.
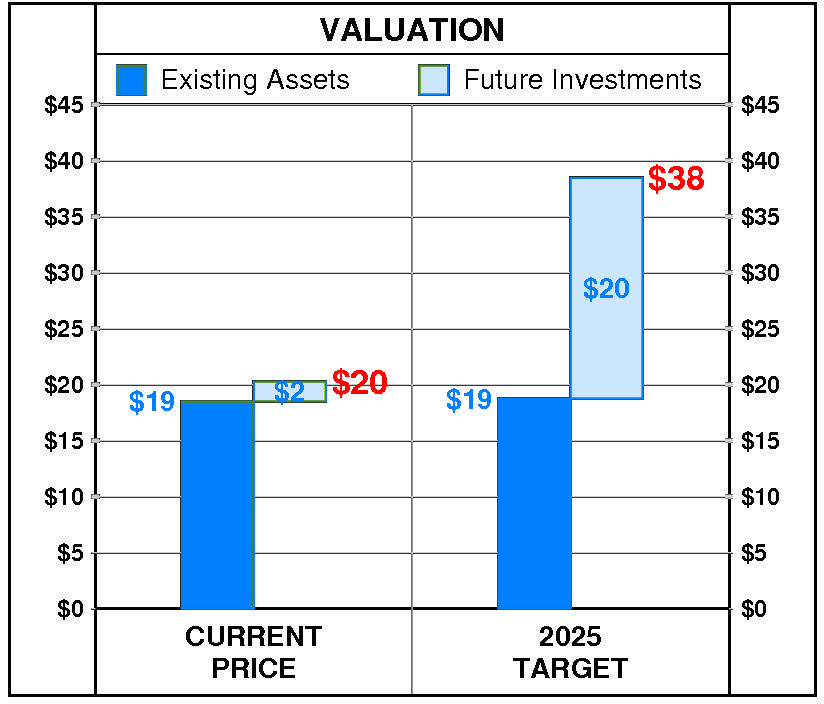
At Pan American Silver's current price of $18.25, investors are placing a negative value of $-0 on its future investments. This view is not supported by the company's most recent performance that reflected a growth rate of 12.0% per year, and a return on equity of 4.0% versus a cost of equity of 3.3%.
PTR's 2025 Price Target of $38 is based on these forecasts and reflects an estimated value of existing assets of $17 and a value of future investments of $21.