BUSINESS
Archer-Daniels-Midland Company procures, transports, stores, processes, and merchandises agricultural commodities, products, and ingredients in the United States, Switzerland, Cayman Islands, Brazil, Mexico, the United Kingdom, and internationally. The company operates through three segments: Ag Services and Oilseeds, Carbohydrate Solutions, and Nutrition. It procures, stores, cleans, and transports agricultural raw materials, such as oilseeds, corn, wheat, milo, oats, and barley. The company also engages in the agricultural commodity and feed product import, export, and distribution; and structured trade finance activities.
INVESTMENT RATING
ADM's future returns on capital are forecasted to exceed the cost of capital. Accordingly, the company is expected to continue to be an important Value Builder.
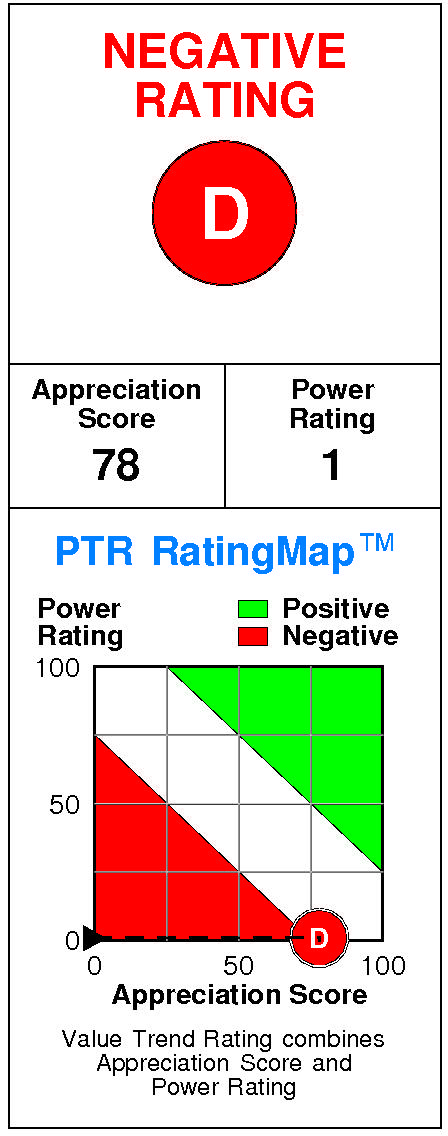
Archer-Daniels-Midland has a current Value Trend Rating of D (Negative).
The Value Trend Rating reflects very contradictory signals from PTR's two proprietary measures of a stock's attractiveness. Archer-Daniels-Midland has a good Appreciation Score of 78 but a very low Power Rating of 1, with the Negative Value Trend Rating the result.
Archer-Daniels-Midland's stock is selling well below targeted value.
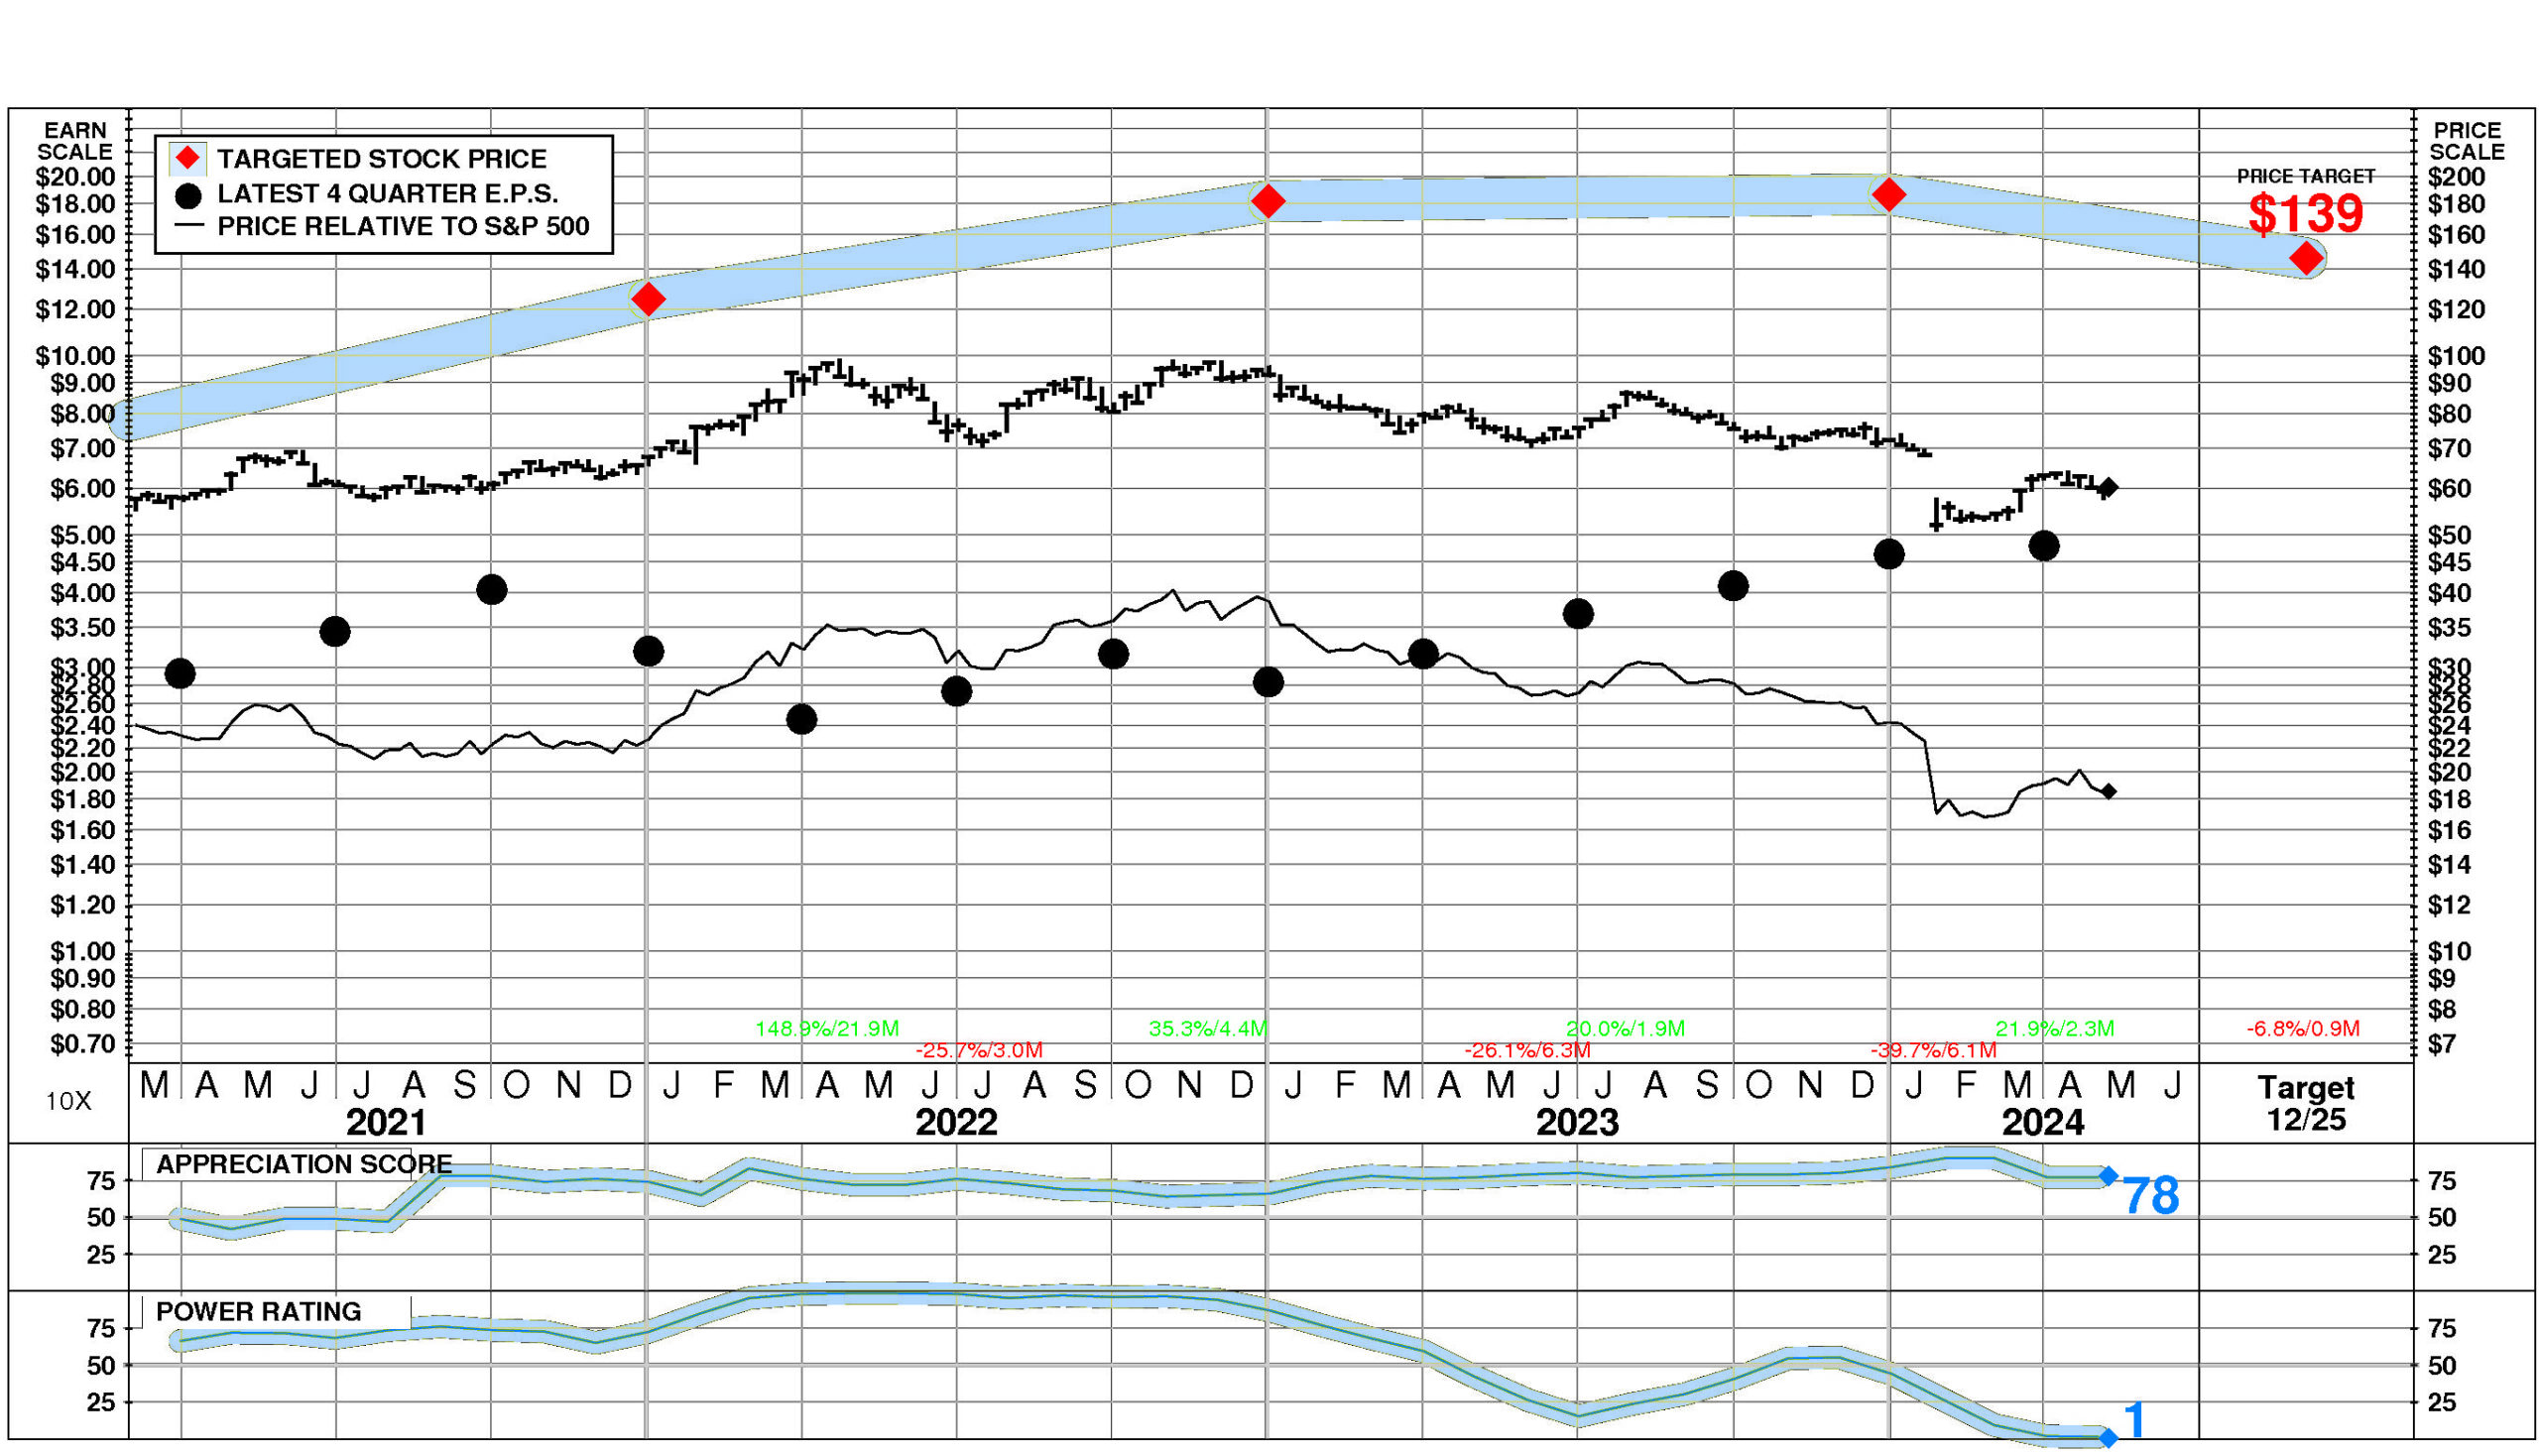
The current stock price of $60.19 compares to targeted value 12 months forward of $146.
Archer-Daniels-Midland's high appreciation potential results in an appreciation score of 78 (only 22% of the universe has greater appreciation potential.)
Archer-Daniels-Midland has a Power Rating of 1.
(ADM's very low Power Rating indicates that it only has a higher likelihood of achieving favorable investment performance over the near to intermediate term than 1% of companies in the universe.)
Factors contributing to this very low Power Rating include: ADM's earnings estimates have fallen very significantly in recent months; the Fats and Oils comparison group is in an extremely unfavorable position currently; and recent price action has been unfavorable.
INVESTMENT PROFILE
ADM's financial strength is average. Financial strength rating is 59.
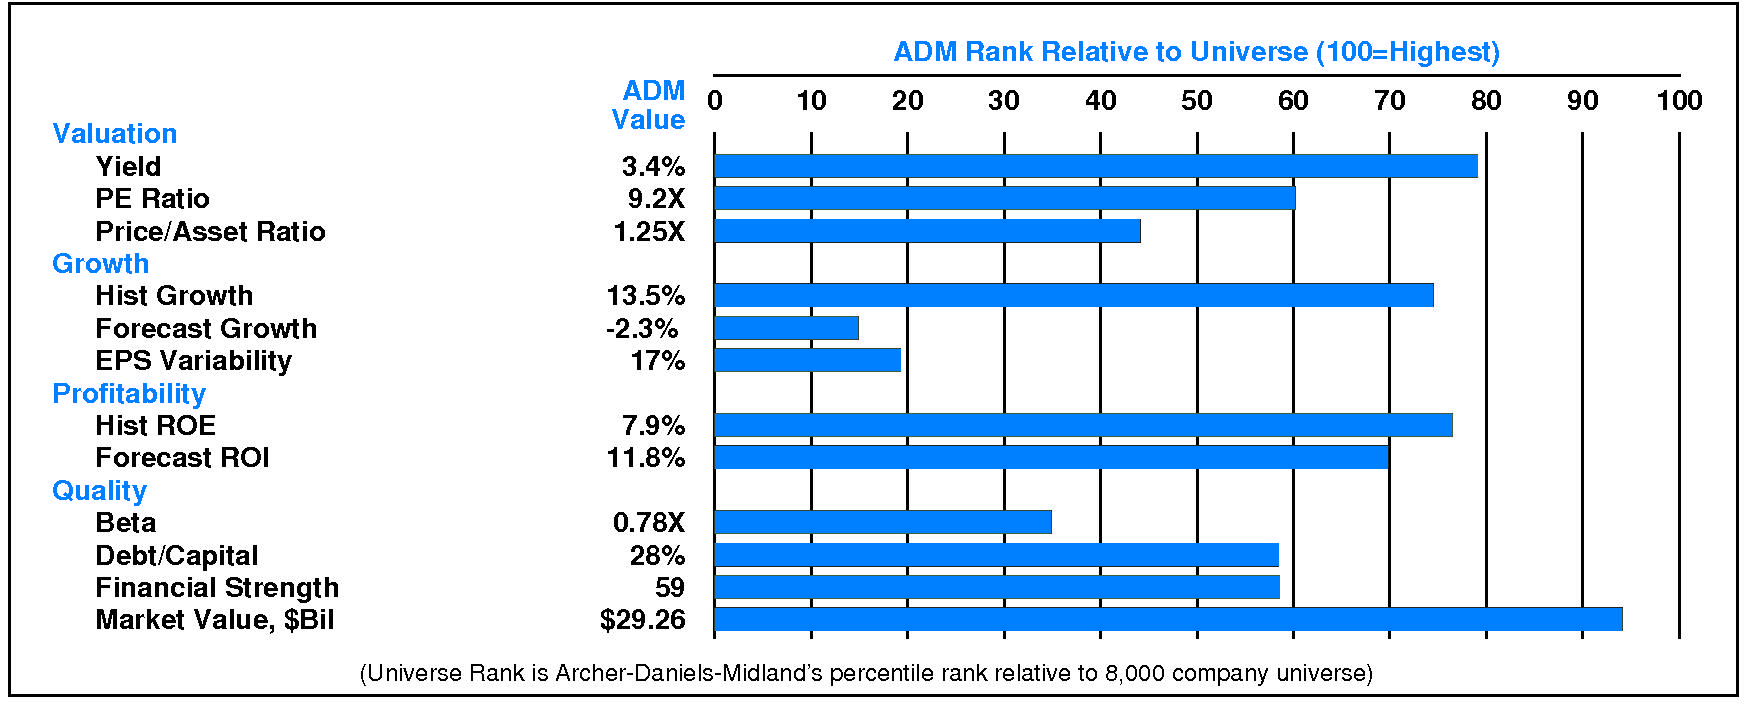
Relative to the S&P 500 Composite, Archer-Daniels-Midland Co has moderate Value characteristics; its appeal is likely to be to investors heavily oriented toward Income; the perception is that ADM is lower risk.
Low expected growth is a relative weakness for ADM. ADM's valuation is low: high dividend yield, low P/E ratio, and low price/book ratio. ADM has normal market capitalization.
CURRENT SIGNALS
Archer-Daniels-Midland's current operations are eroding.
Return on equity is falling, reflecting: falling asset utilization; declining pretax margin; falling tax keep rate; and falling leverage.
Archer-Daniels-Midland's current technical position is mixed.
The stock price is in a 2.3 month up move. The stock has appreciated 21.9% from its prior low. The 200 day moving average is in a downtrend. The stock price is above its 200 day moving average.
ALERTS
Recent notable positive changes in investment behavior have benefitted Archer-Daniels-Midland Co (NYSE: ADM): positive upside/downside volume developed.
Positive development: significant quarterly earnings acceleration occurred. Negative development: significant quarterly sales deceleration occurred.
The stock is currently rated D.
Archer-Daniels-Midland Co (NYSE: ADM) stock closed at $60.19 on 5/6/24 after an increase of 1.7%. This advance was accompanied by normal trading volume. The stock is unchanged during the last week but has been extremely weak relative to the market over the last nine months.
CASH FLOW
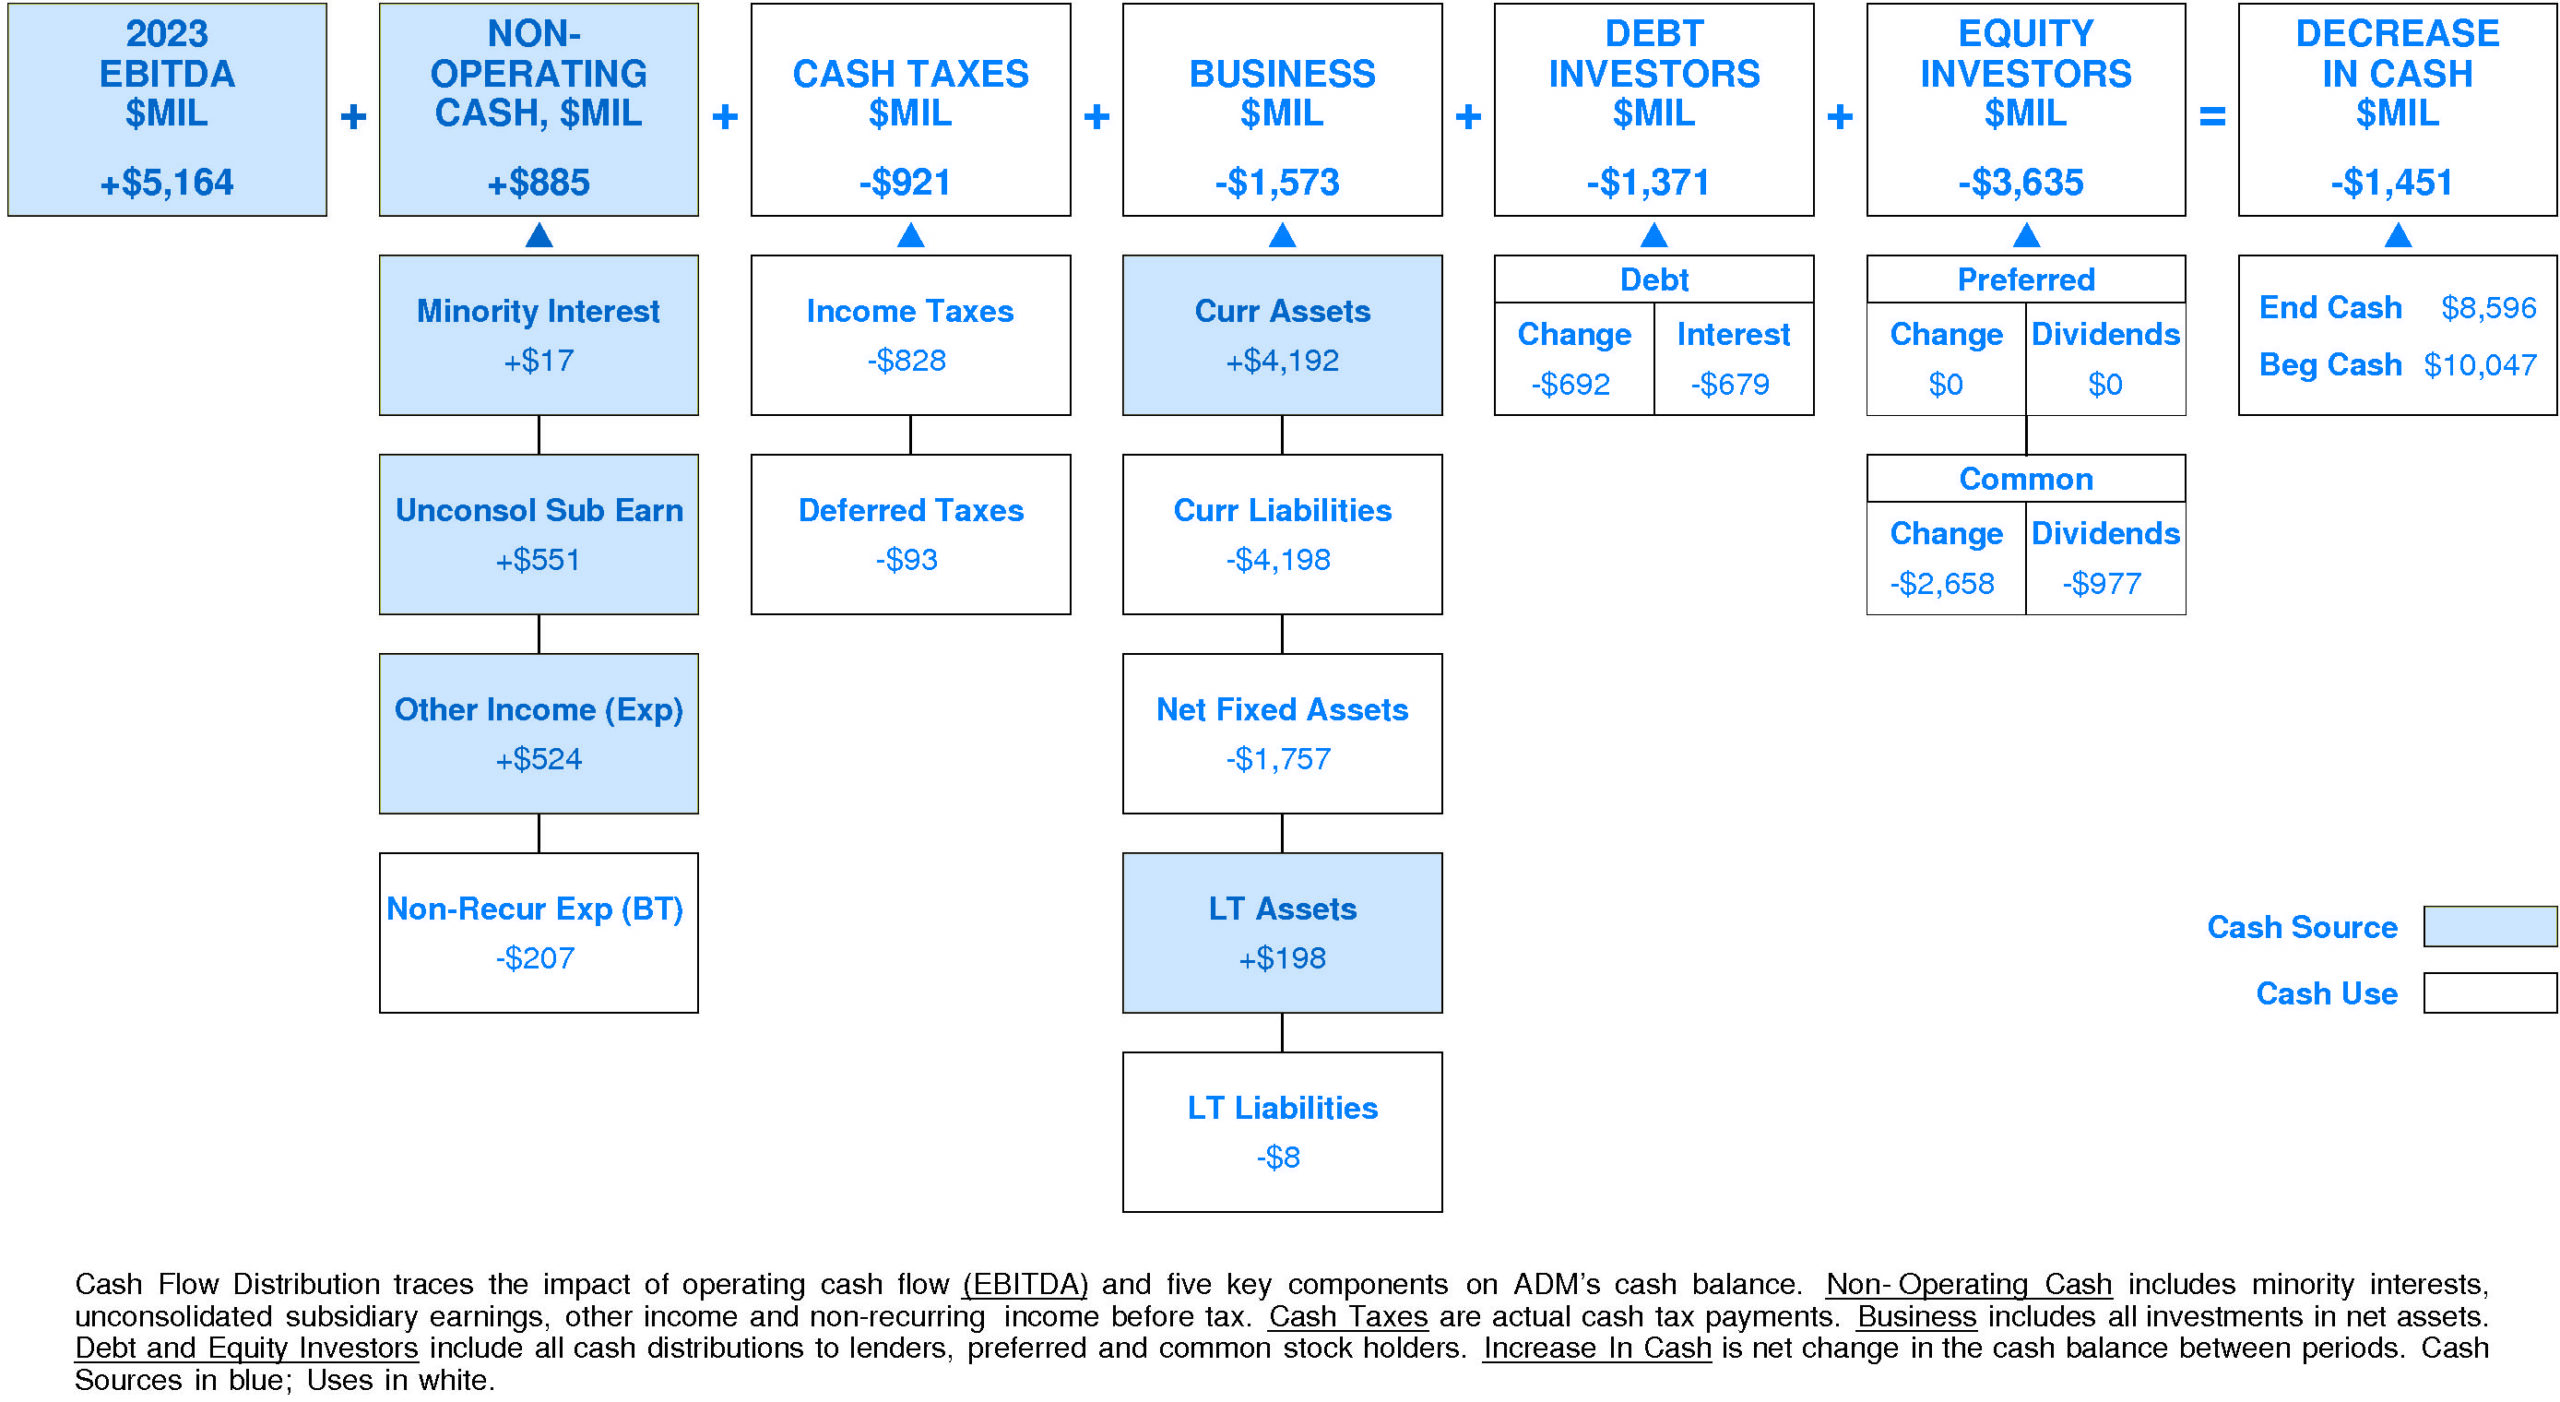
In 2023, Archer-Daniels-Midland experienced a significant decline in cash of -$1,451 million (-14%). Sources of cash were lower than uses.
Cash generated from 2023 EBITDA totaled +$5,164 million. Non-operating sources contributed +$885 million (+17% of EBITDA). Cash taxes consumed -$921 million (-18% of EBITDA). Re-investment in the business amounted to -$1,573 million (-30% of EBITDA). On a net basis, debt investors withdrew -$1,371 million (-27% of EBITDA) while equity investors pulled out -$3,635 million (-70% of EBITDA).
ADM's Non-operating Income, %EBITDA has exhibited little to no overall change over the period.
This stability was accompanied by an uptrend for the Archer-Daniels-Midland Peer Group. In most years, Archer-Daniels-Midland was in the top quartile. Currently, Archer-Daniels-Midland is upper quartile at +17% of EBITDA (+$885 million).
ADM's Cash Taxes, %EBITDA has exhibited a volatile overall uptrend over the period.
This improvement was accompanied by a similar trend for the Archer-Daniels-Midland Peer Group. (Since 2020 Cash Taxes, %EBITDA has experienced a very sharp decline.) In most years, Archer-Daniels-Midland was in the second quartile and top quartile. Currently, Archer-Daniels-Midland is at median at -18% of EBITDA (-$921 million).
ADM's Business Re-investment, %EBITDA has experienced a downtrend over the period.
This downtrend was accompanied by stability for the Archer-Daniels-Midland Peer Group. (Since 2021 Business Re-investment, %EBITDA has acccelerated.) In most years, Archer-Daniels-Midland was in the second quartile and top quartile. Currently, Archer-Daniels-Midland is slightly above median at -30% of EBITDA (-$1,573 million).
ADM's Debt Investors, %EBITDA has experienced a downtrend over the period.
This downtrend was accompanied by a similar trend for the Archer-Daniels-Midland Peer Group. In most years, Archer-Daniels-Midland was in the third quartile and top quartile. Currently, Archer-Daniels-Midland is substantially below median at -27% of EBITDA (-$1,371 million).
ADM's Equity Investors, %EBITDA has enjoyed a volatile overall uptrend over the period.
This improvement was accompanied by a similar trend for the Archer-Daniels-Midland Peer Group. (Since 2021 Equity Investors, %EBITDA has experienced a very sharp decline.) In most years, Archer-Daniels-Midland was in the lower quartile and third quartile. Currently, Archer-Daniels-Midland is lower quartile at -70% of EBITDA (-$3,635 million).
ADM's Change in Cash, %EBITDA has experienced a volatile overall uptrend over the period.
This improvement was accompanied by a similar trend for the Archer-Daniels-Midland Peer Group. (Since 2021 Change in Cash, %EBITDA has experienced a very sharp decline.) In most years, Archer-Daniels-Midland was in the top quartile and lower quartile. Currently, Archer-Daniels-Midland is lower quartile at -28% of EBITDA (-$1,451 million).
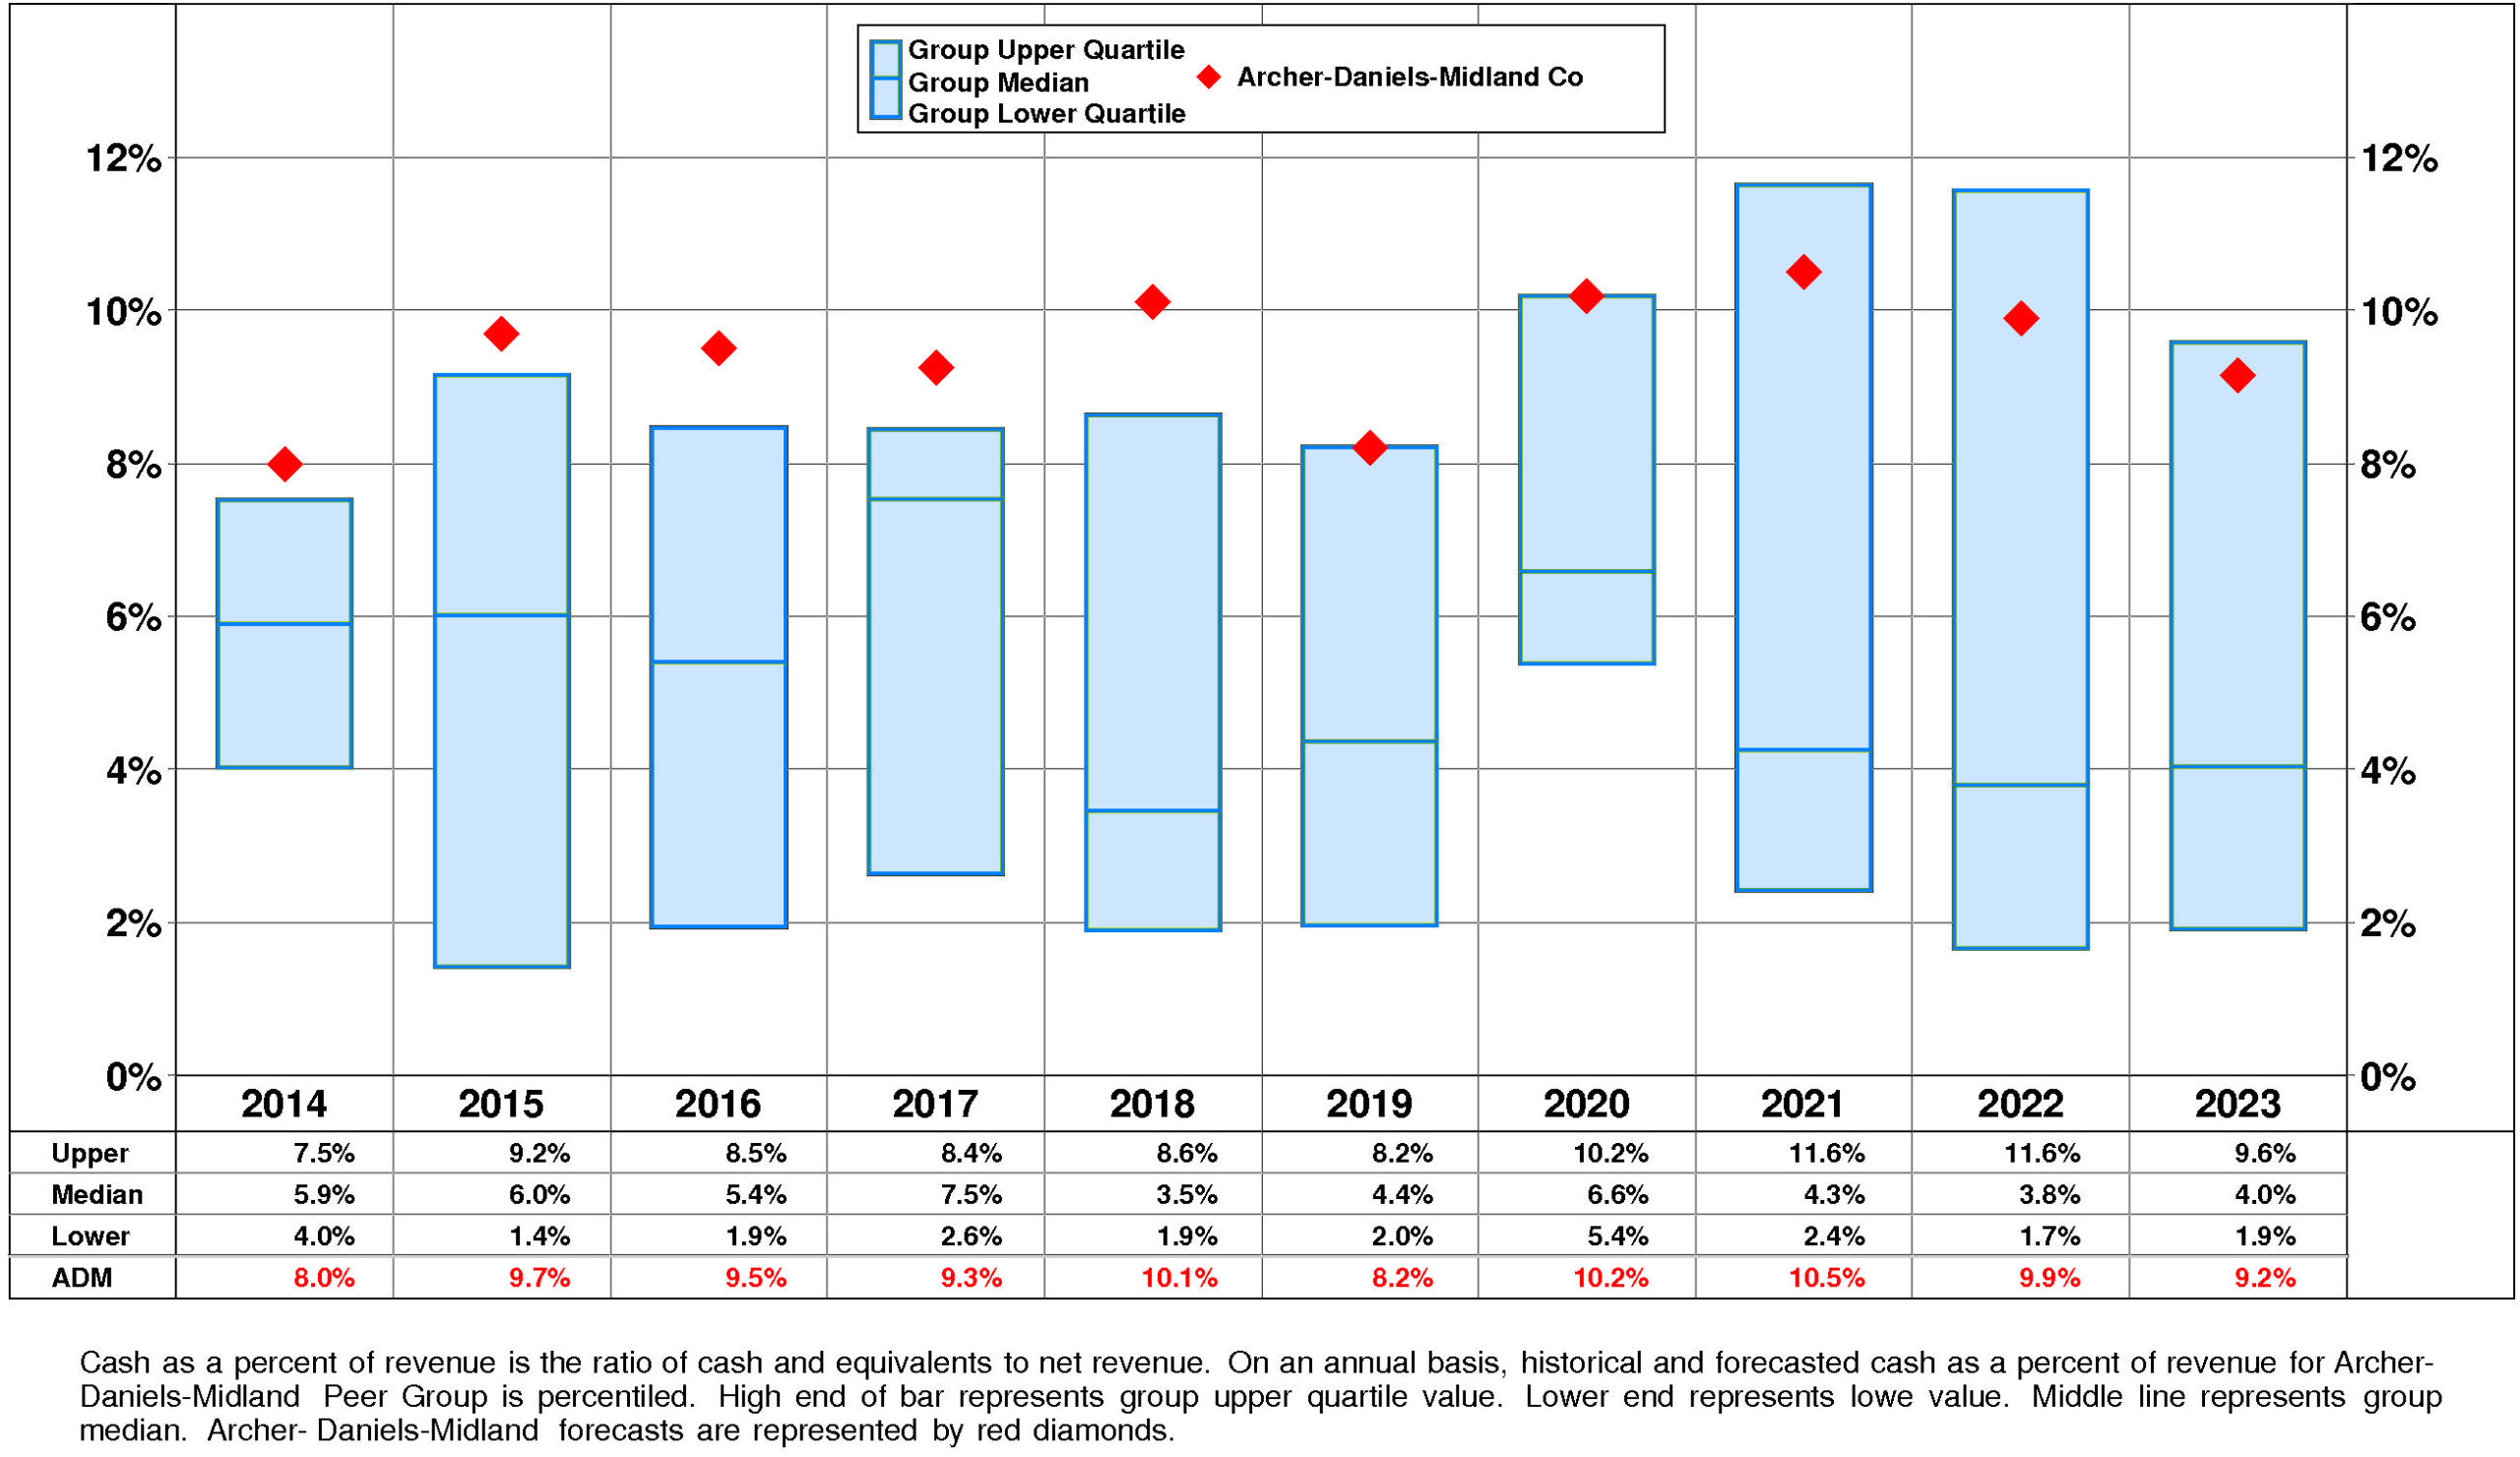
ADM's Cash, %Revenue has exhibited little to no overall change over the period.
This stability was accompanied by stability for the Archer-Daniels-Midland Peer Group as well. In most years, Archer-Daniels-Midland was in the top quartile. Currently, Archer-Daniels-Midland is substantially above median at +9%.
PROFITABILITY
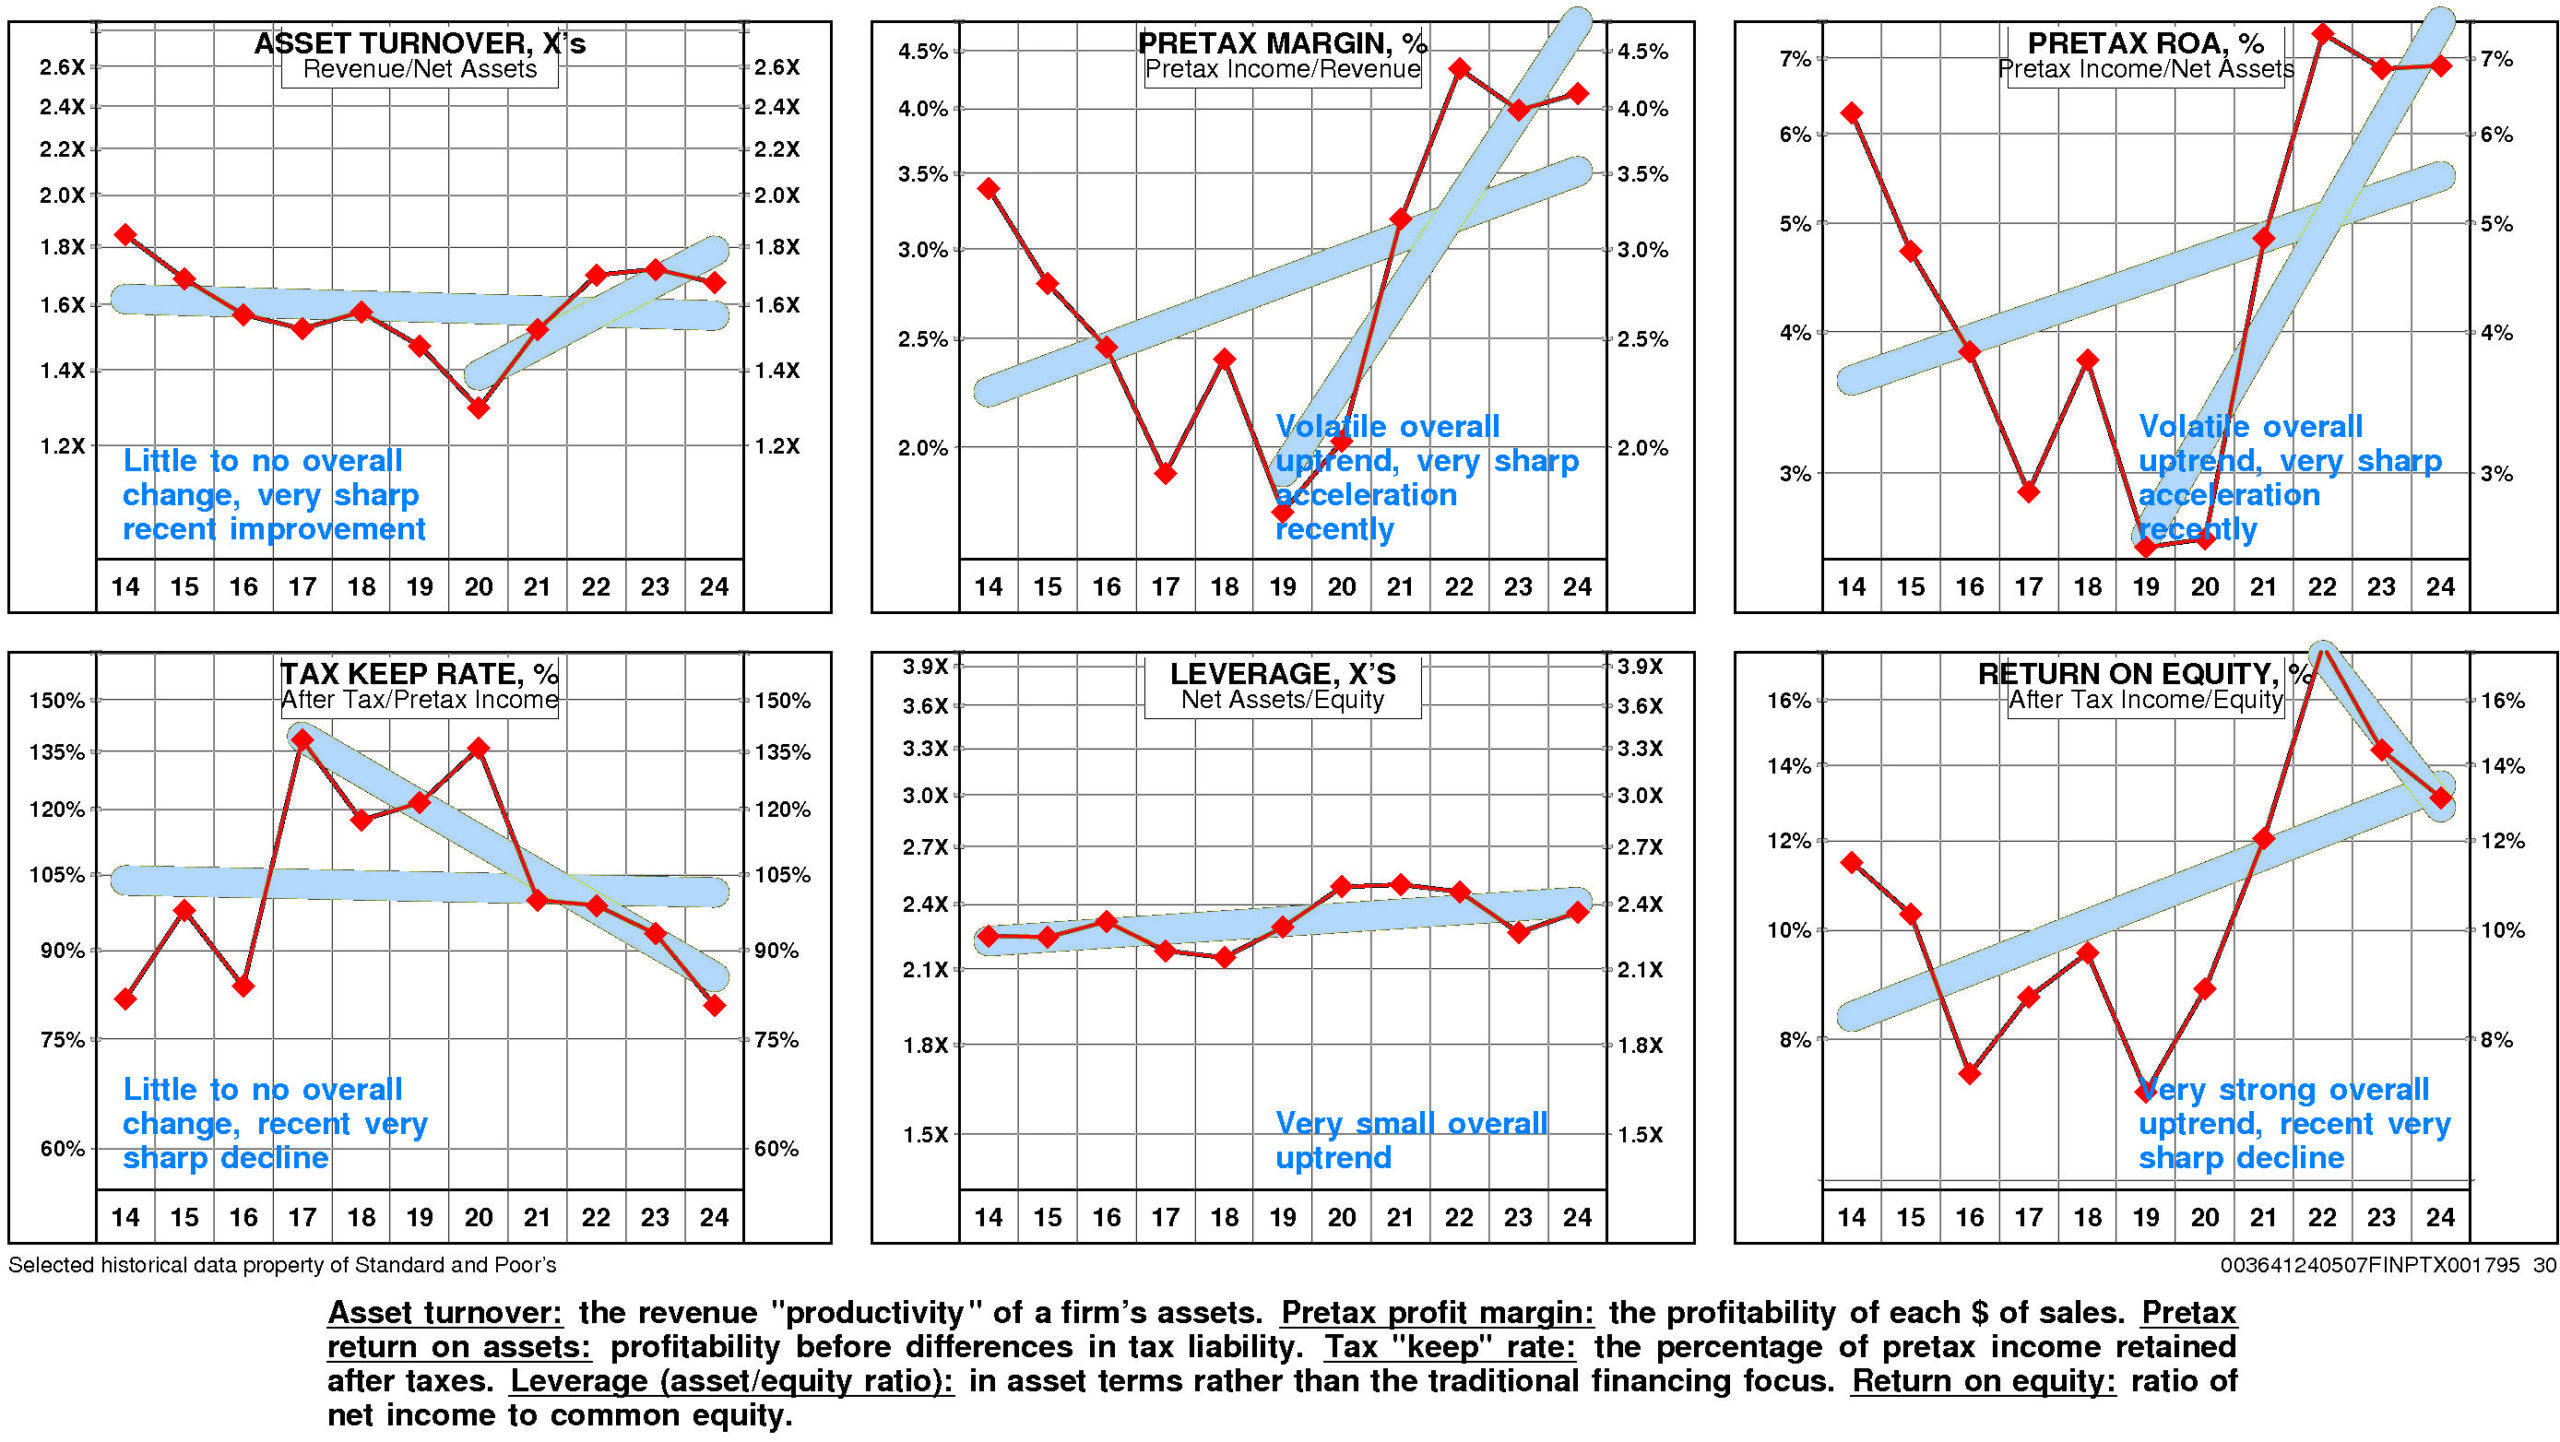
ADM's return on equity has improved very significantly since 2014. The current level of 13.1% is 1.14X the low for the period and is -26.7% from the high.
This very significant improvement was due to very strong positive trend in pretax operating return and very minor positive trend in non-operating factors.
The productivity of ADM's assets remained stable over the full period 2014-2024: asset turnover has exhibited little to no overall change but it experienced very sharp improvement from the 2020 level.
Additionally, pretax margin enjoyed a volatile overall uptrend that accelerated very sharply from the 2019 level.
Non-operating factors (income taxes and financial leverage) had a very small positive influence on return on equity.
ADM's return on equity is below median (13.1%) for the four quarters ended March, 2024.
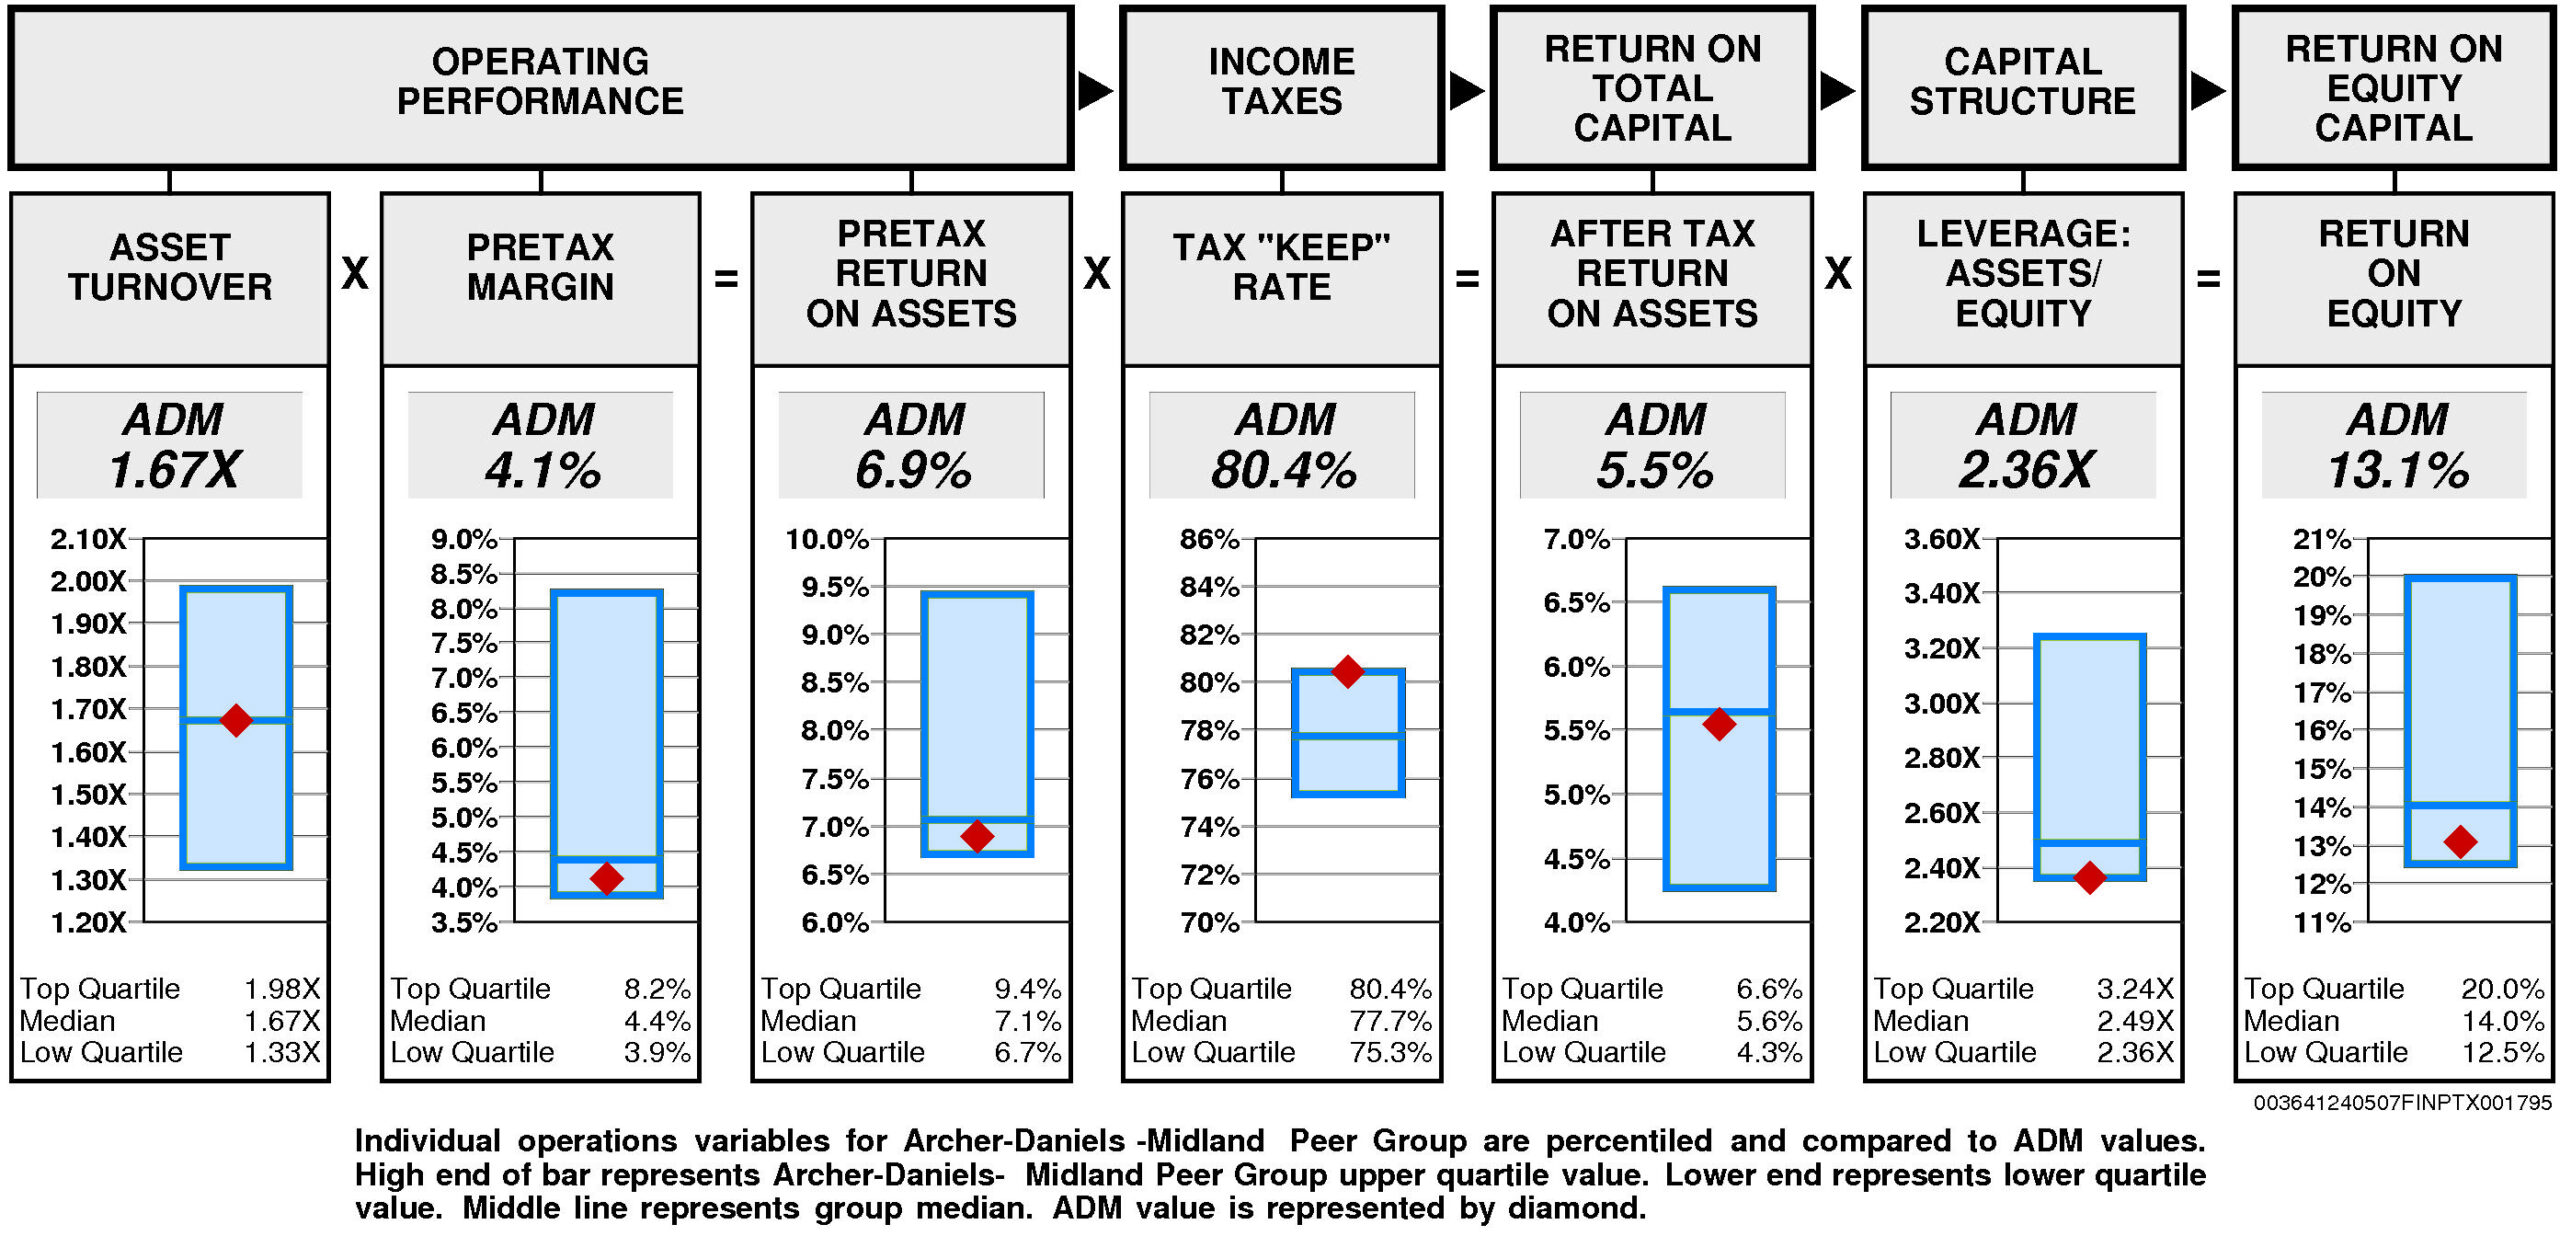
Operating performance (pretax return on assets) is below median (6.9%) reflecting asset turnover that is at median (1.67X) and below median pretax margin (4.1%).
Tax “keep” rate (income tax management) is at the upper quartile (80.4%) resulting in after tax return on assets that is at median.
Financial leverage (leverage) is at the lower quartile (2.36X).
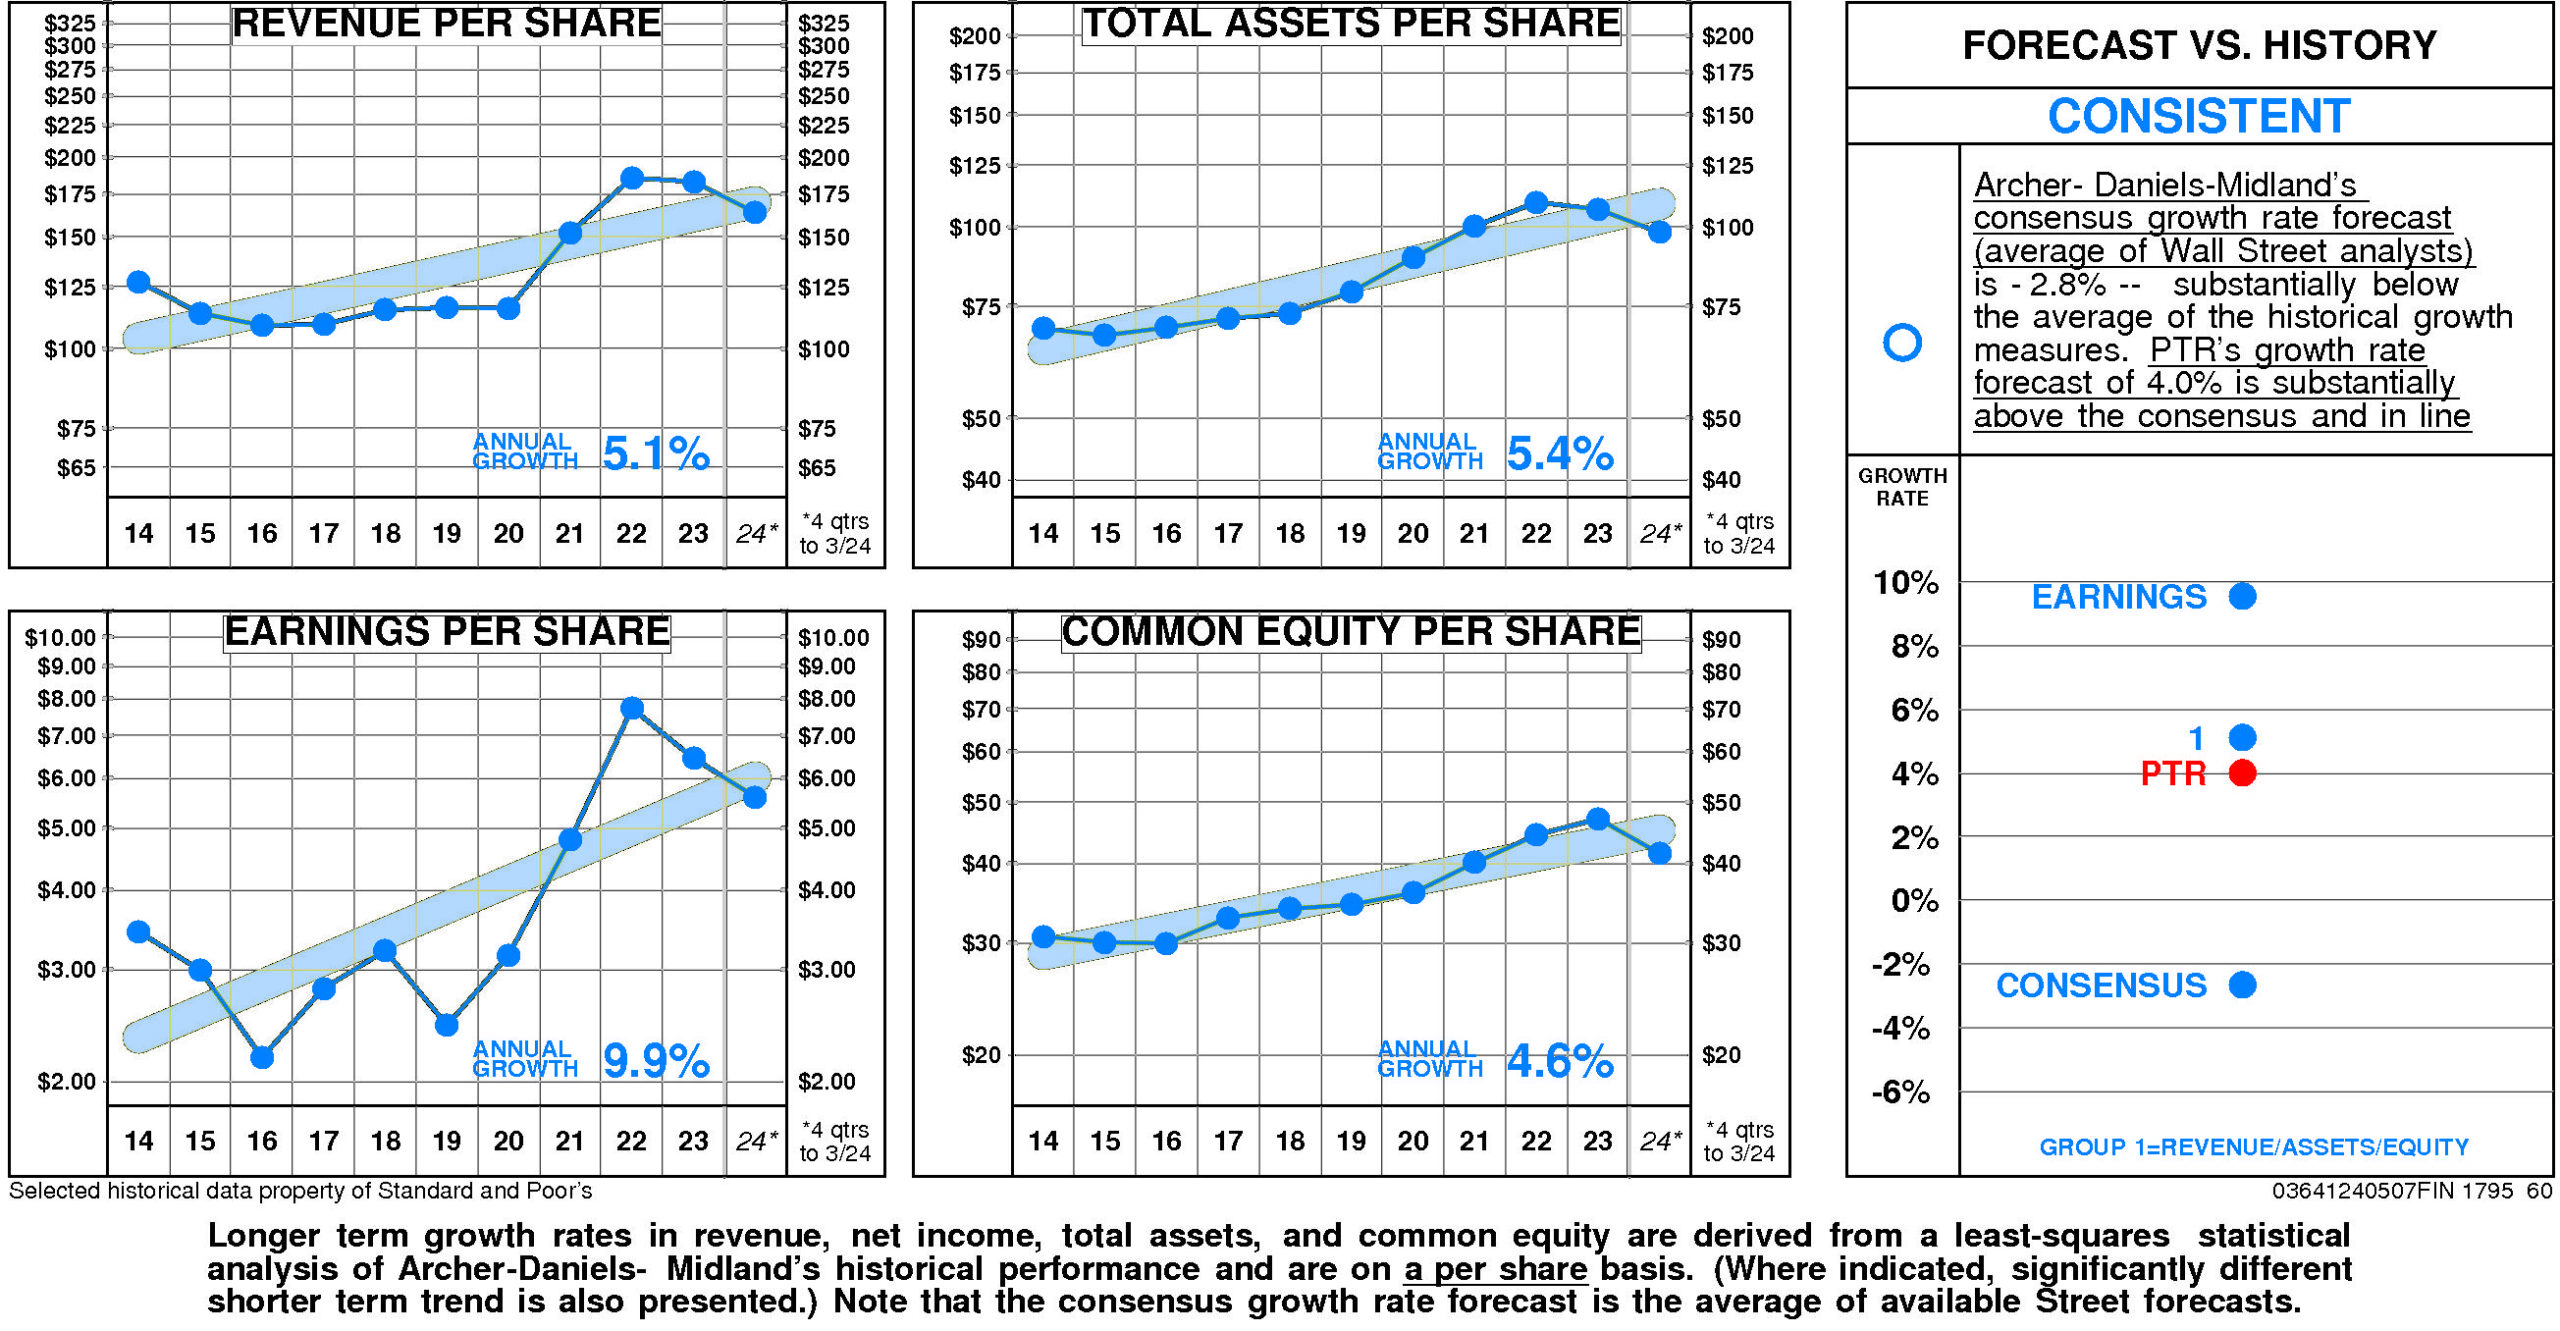
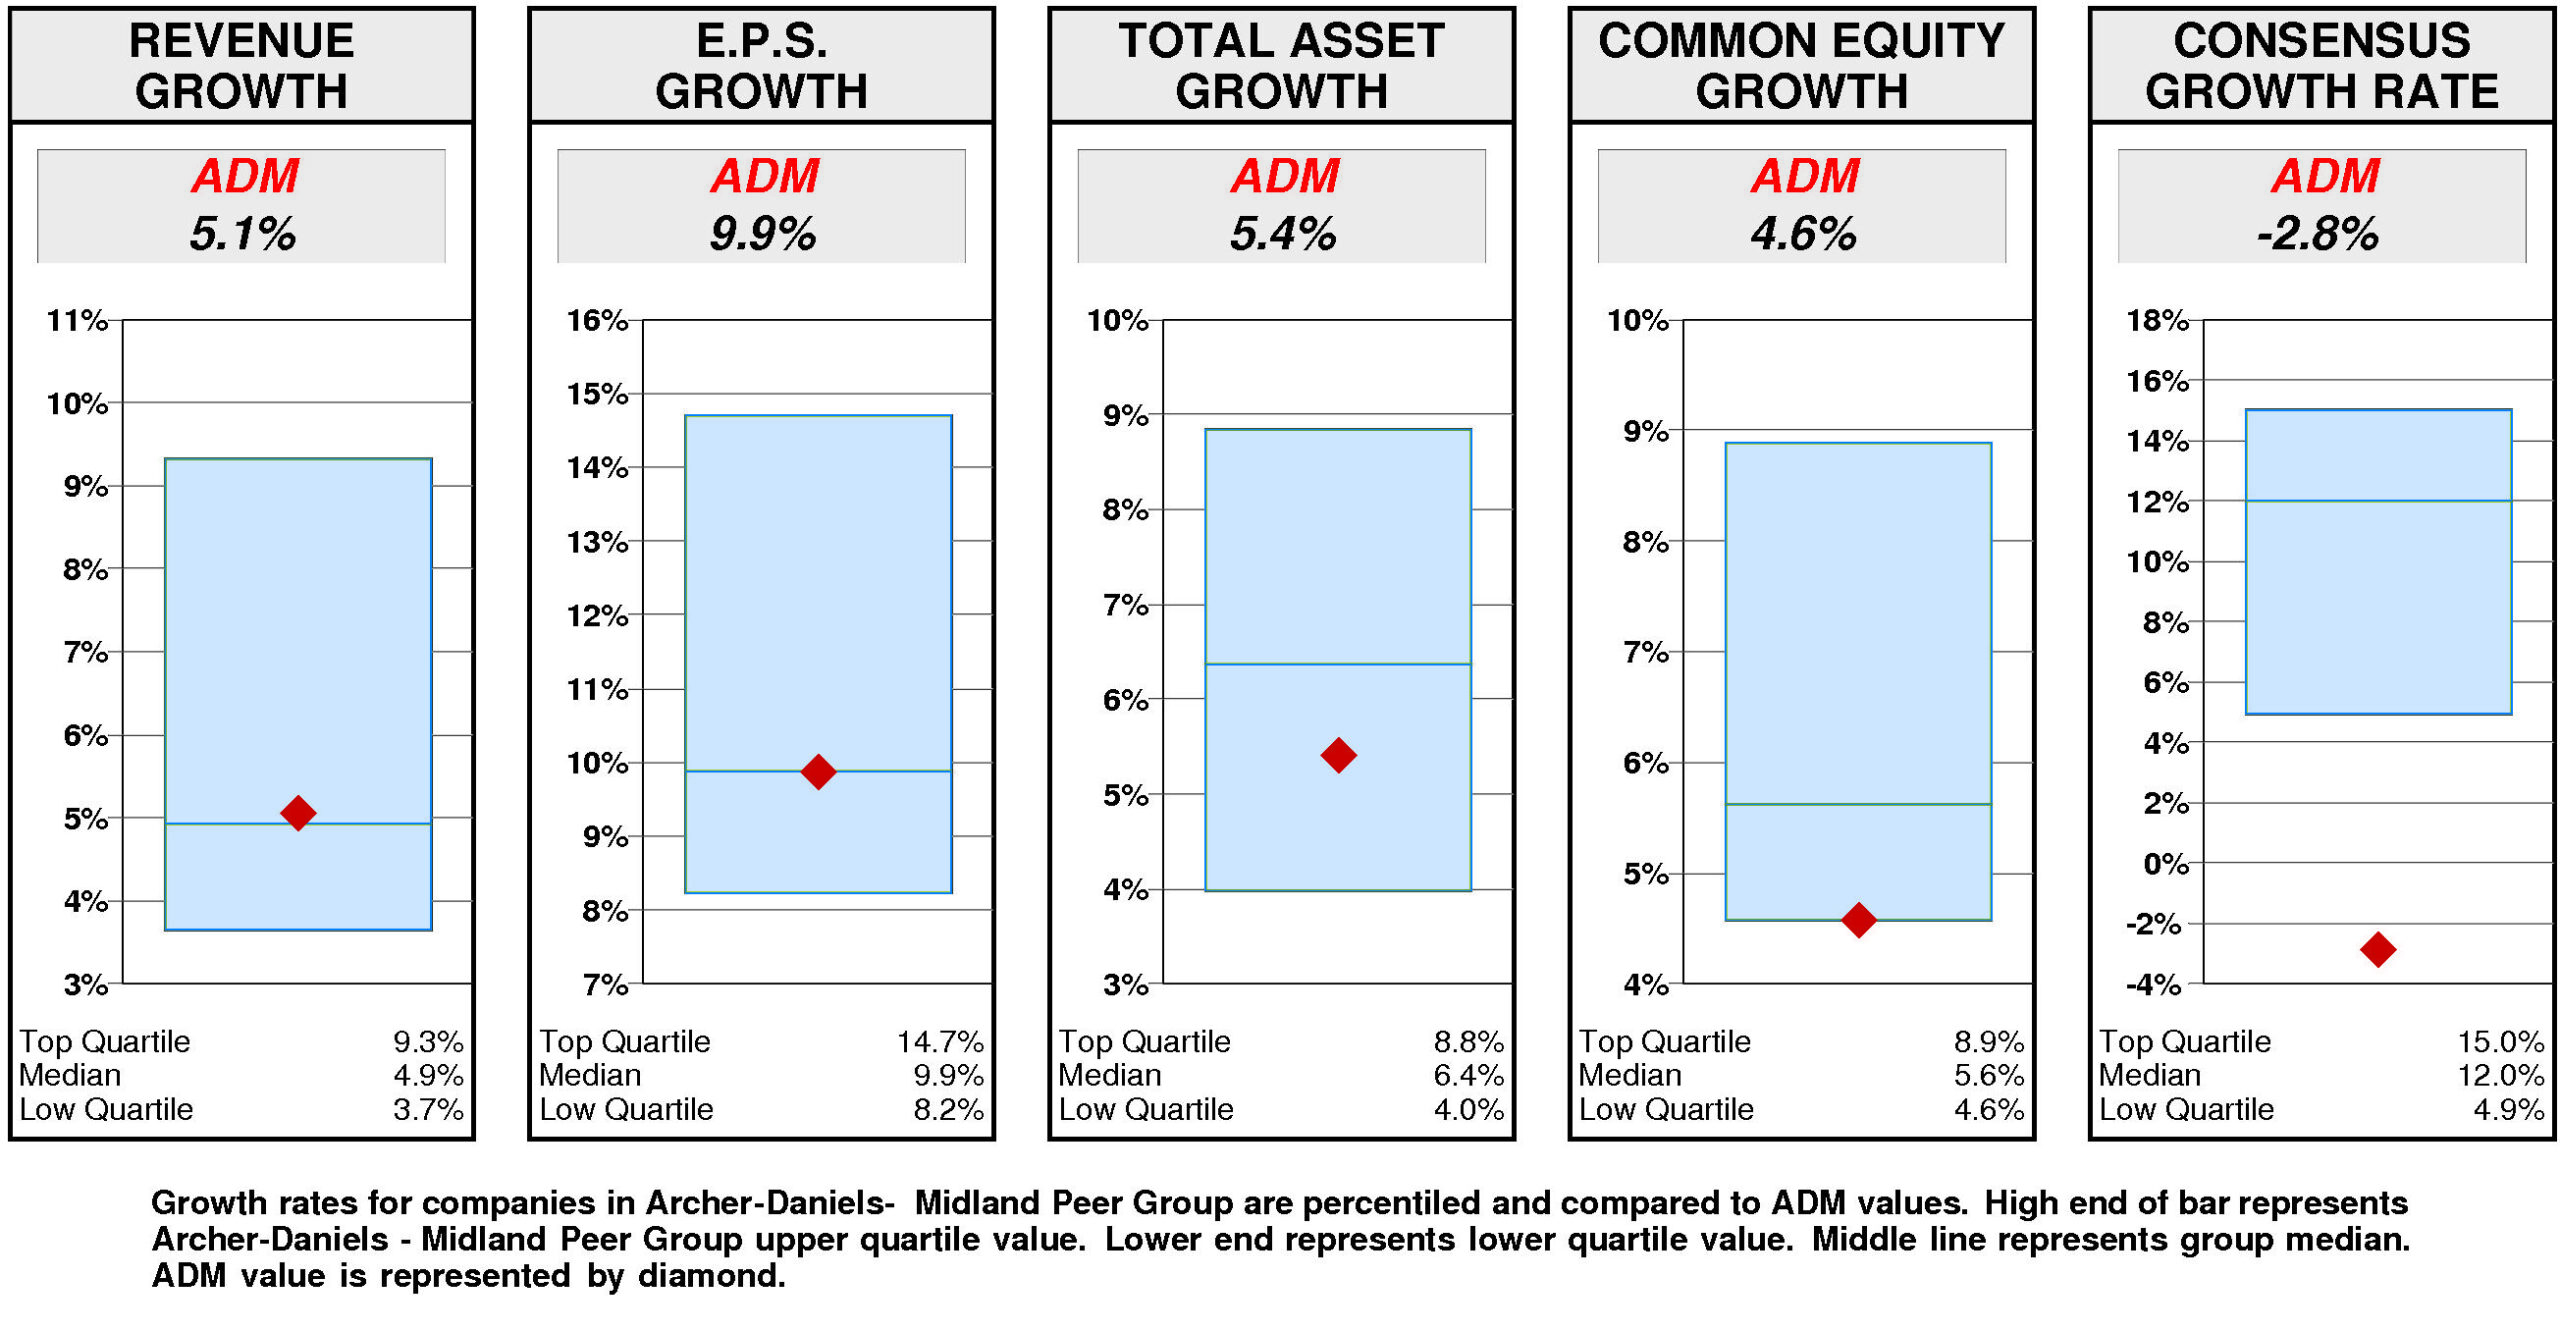
GROWTH RATES
There are no significant differences between Archer-Daniels-Midland's longer term growth and growth in recent years.
Archer-Daniels-Midland's historical income statement growth and balance sheet growth have diverged. Revenue growth has paralleled asset growth; earnings growth has exceeded equity growth.
Annual revenue growth
has been 5.1% per year.
Total asset growth
has been 5.4% per year.
Annual E.P.S. growth
has been 9.9% per year.
Equity growth
has been 4.6% per year.
Archer-Daniels-Midland's consensus growth rate forecast (average of Wall Street analysts)
is -2.8% — substantially below the average of the historical growth measures.
Relative to the Archer-Daniels-Midland Peer Group, Archer-Daniels-Midland's historical growth measures are erratic.
Revenue growth (5.1%) has been slightly above median. E.P.S. growth (9.9%) has been at median. Total asset growth (5.4%) has been below median. Equity growth (4.6%) has been at the lower quartile.
Consensus growth forecast (-2.8%) is lower quartile.
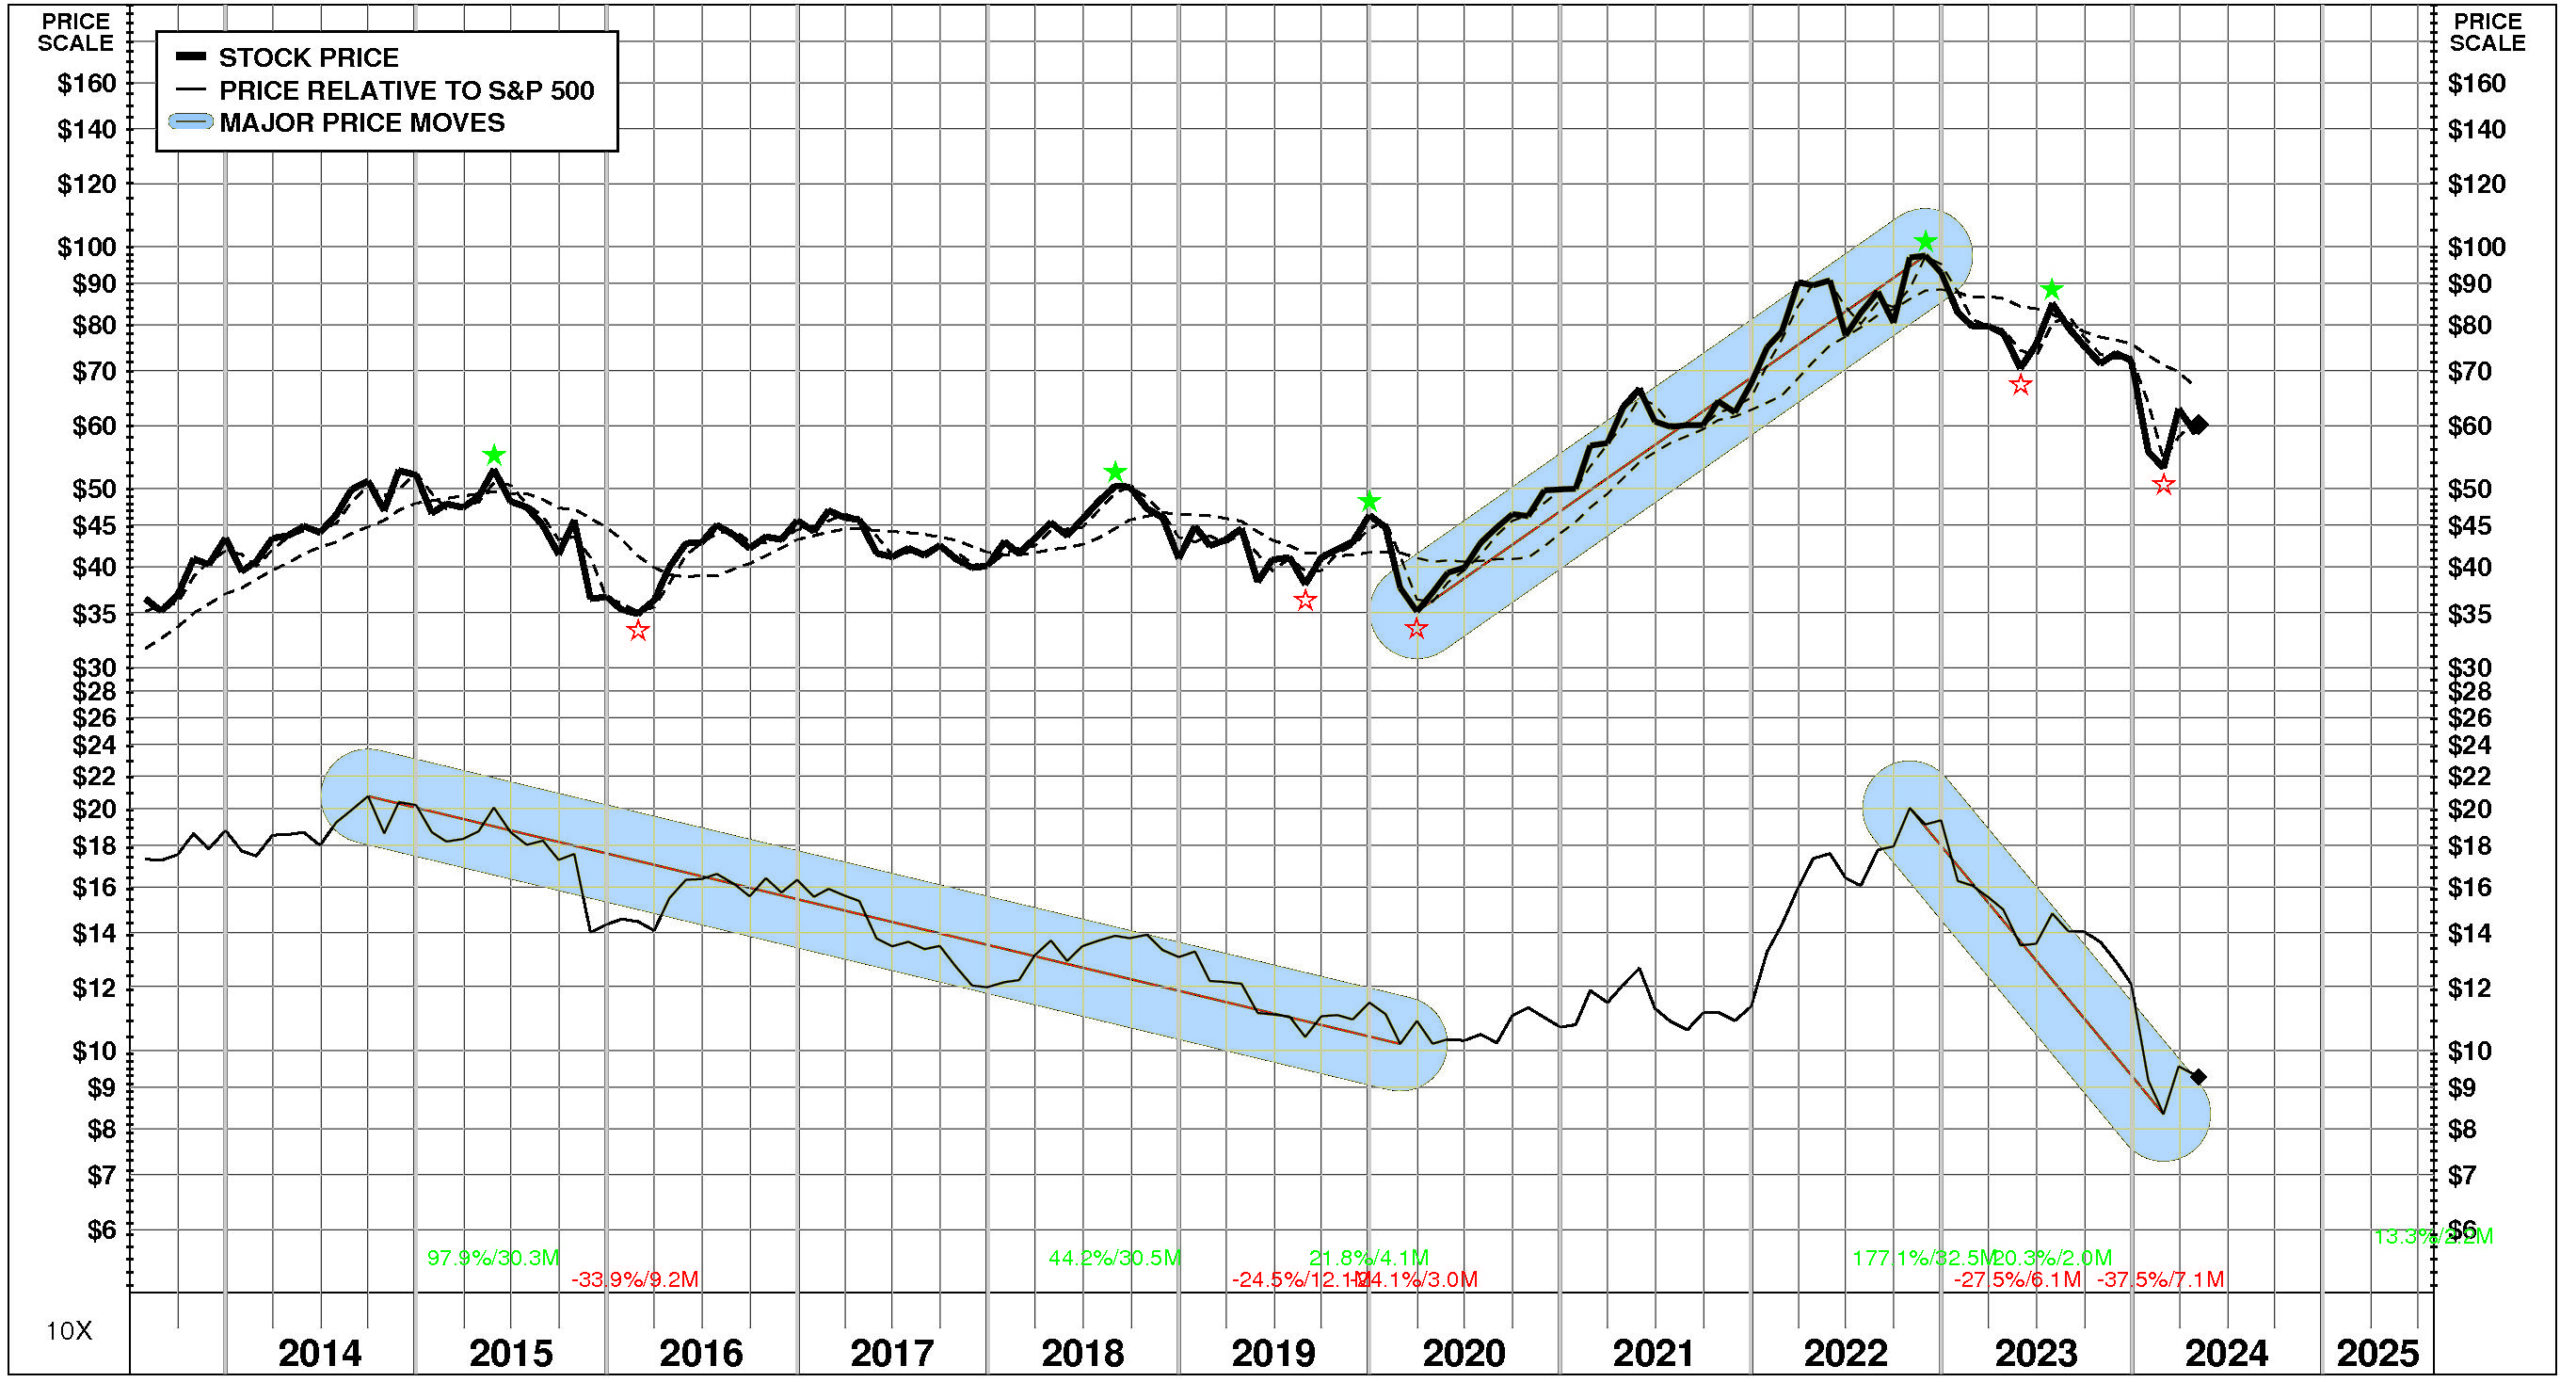
PRICE HISTORY
Over the full time period, Archer-Daniels-Midland's stock price performance has been variable and below market.
Between July, 2013 and May, 2024, Archer-Daniels-Midland's stock price rose +65%; relative to the market, this was a -46% loss. Significant price move during the period: 1) March, 2020 – November, 2022: +177%.
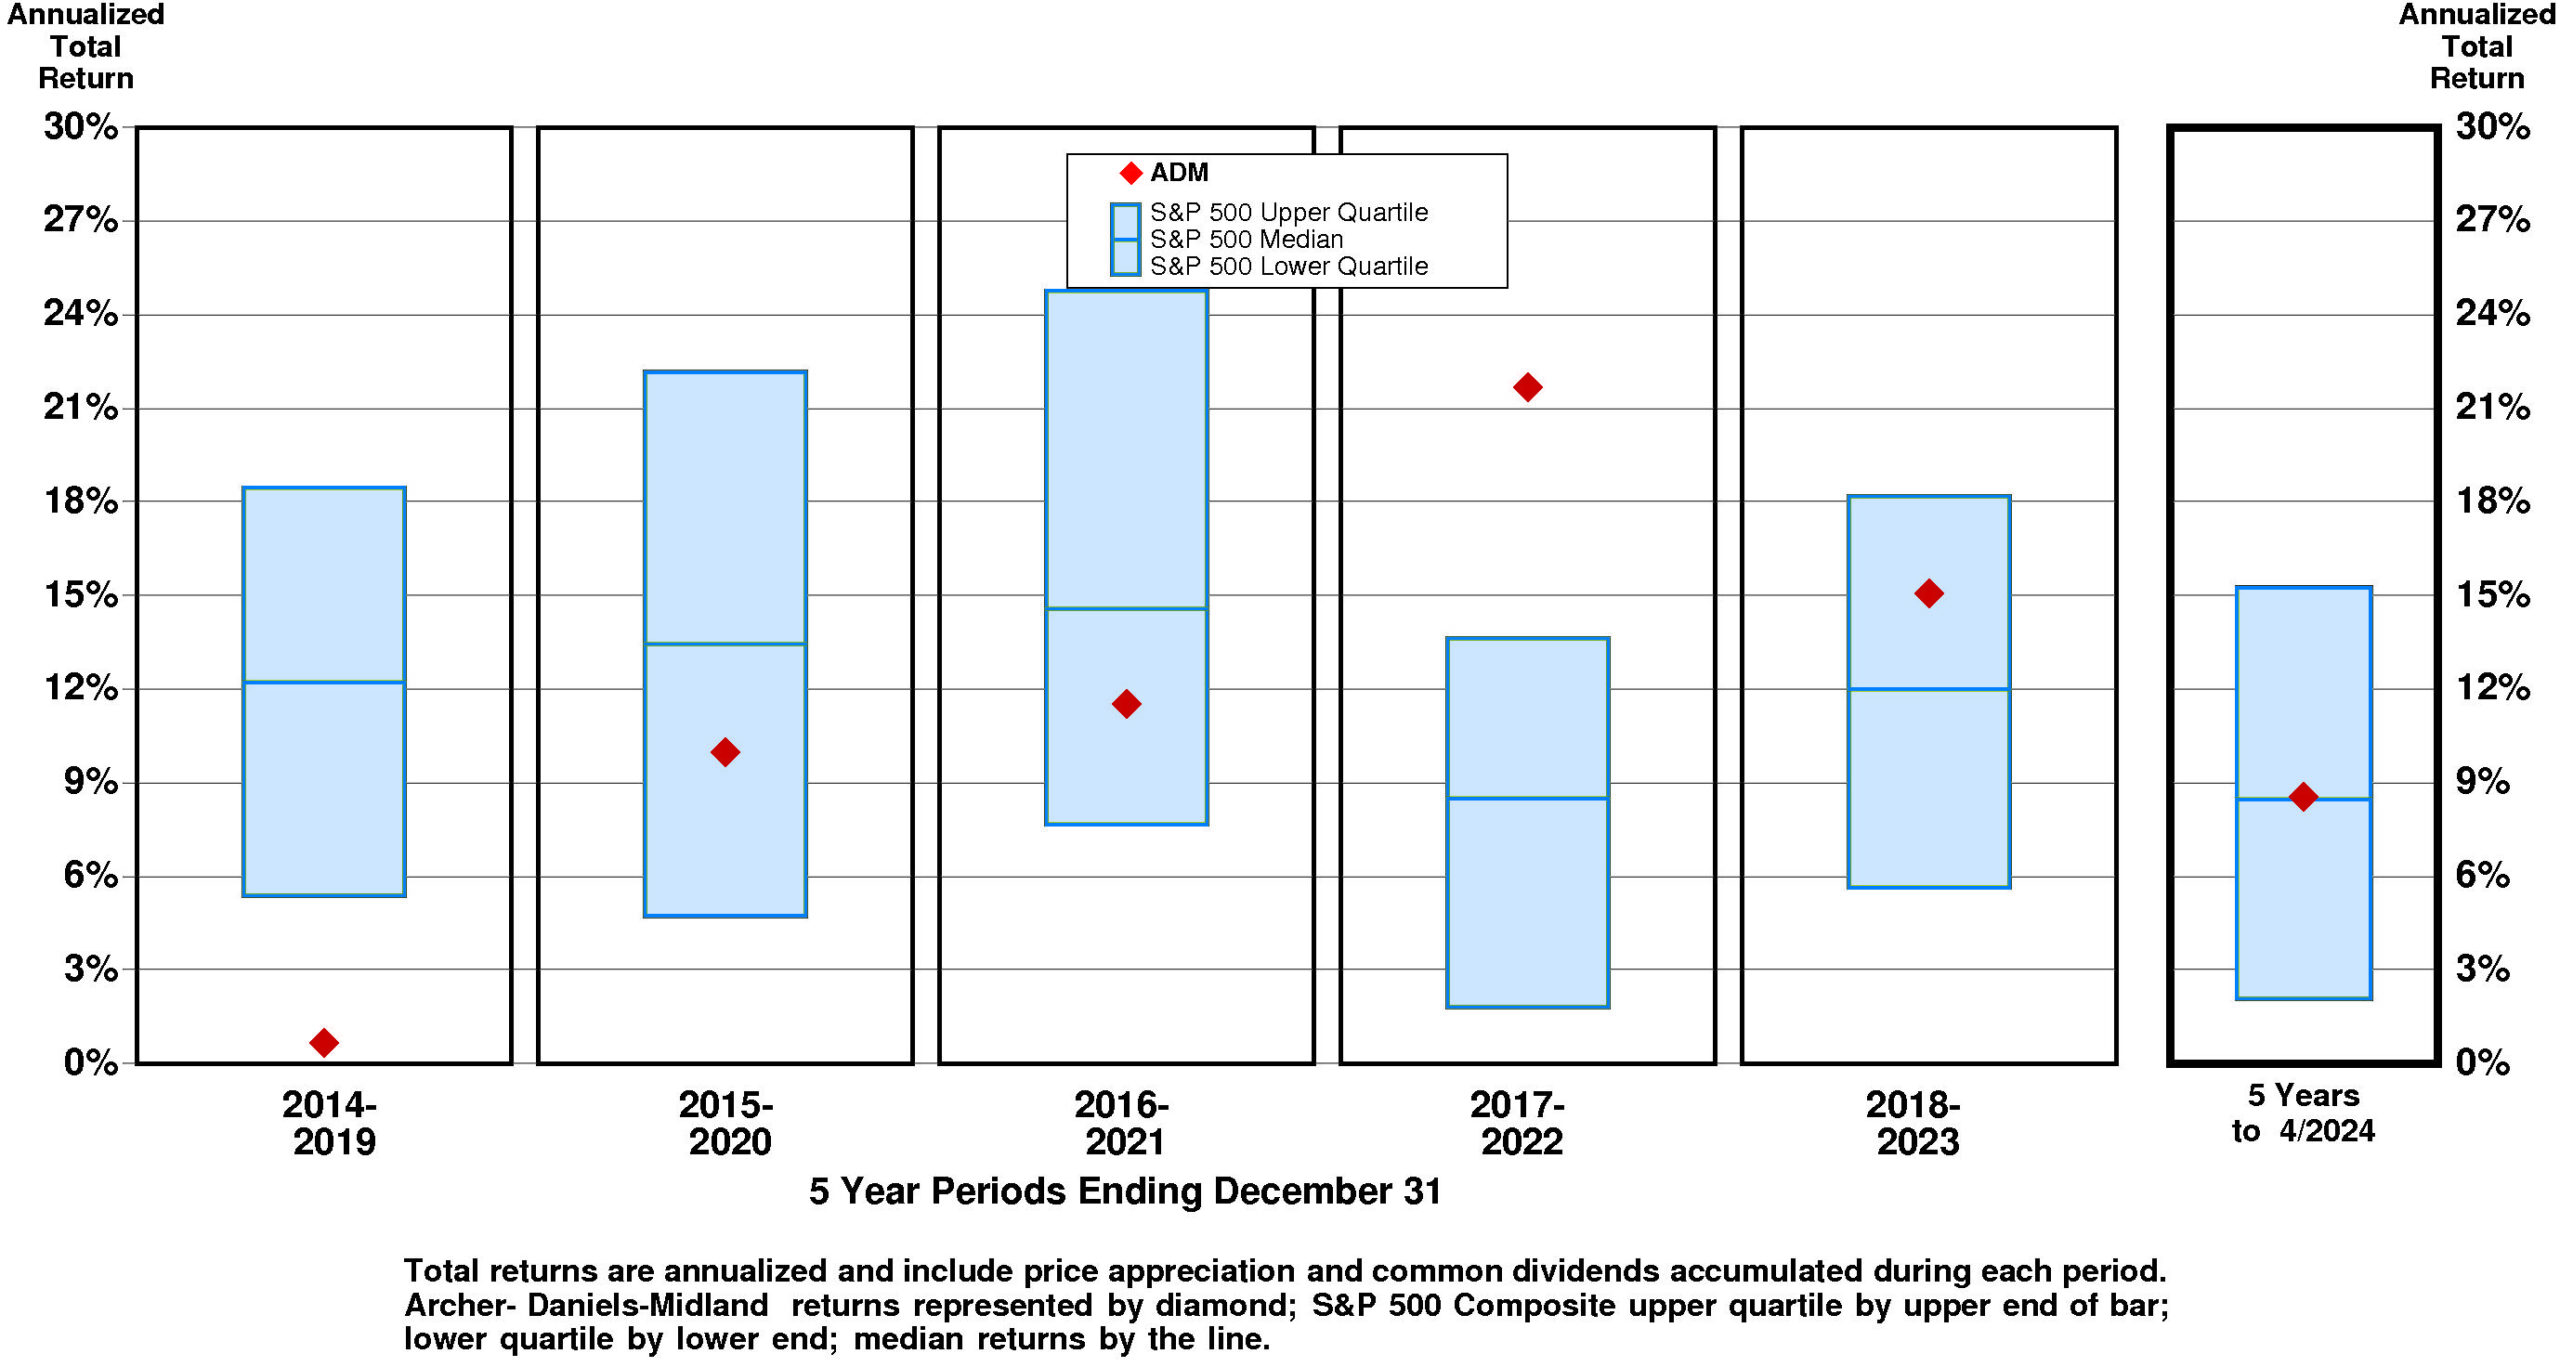
TOTAL INVESTMENT RETURNS
Current annual total return performance of -22.8% is lower quartile relative to the S&P 500 Composite.
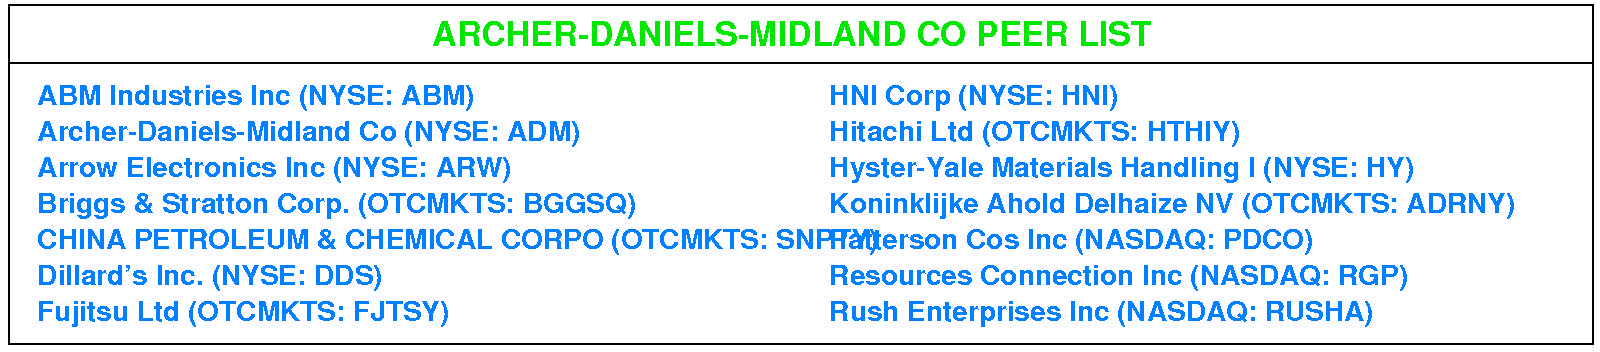
In addition to being lower quartile relative to S&P 500 Composite, current annual total return performance through April, 2024 of -22.8% is lower quartile relative to Archer-Daniels-Midland Co Peer Group.
Current 5-year total return performance of 8.5% is at median relative to the S&P 500 Composite.
Through April, 2024, with current 5-year total return of 8.5% relative to S&P 500 Composite at median, Archer-Daniels-Midland's total return performance is at median relative to Archer-Daniels-Midland Co Peer Group.
VALUATION BENCHMARKS
Relative to S&P 500 Composite, ADM's overall valuation is exceptionally low.
All five factors are lower quartile. The highest factor is the ratio of enterprise value/assets, followed by the ratio of enterprise value/earnings before interest and taxes, then by the price/earnings ratio, then by the price/equity ratio. The lowest factor is the ratio of enterprise value/revenue.
Relative to Archer-Daniels-Midland Peer Group, ADM's overall valuation is low.
The highest factor, the ratio of enterprise value/earnings before interest and taxes, is below median. Price/earnings ratio is below median. Ratio of enterprise value/revenue is below median. Ratio of enterprise value/assets is below median. The lowest factor, the price/equity ratio, is near the lower quartile.
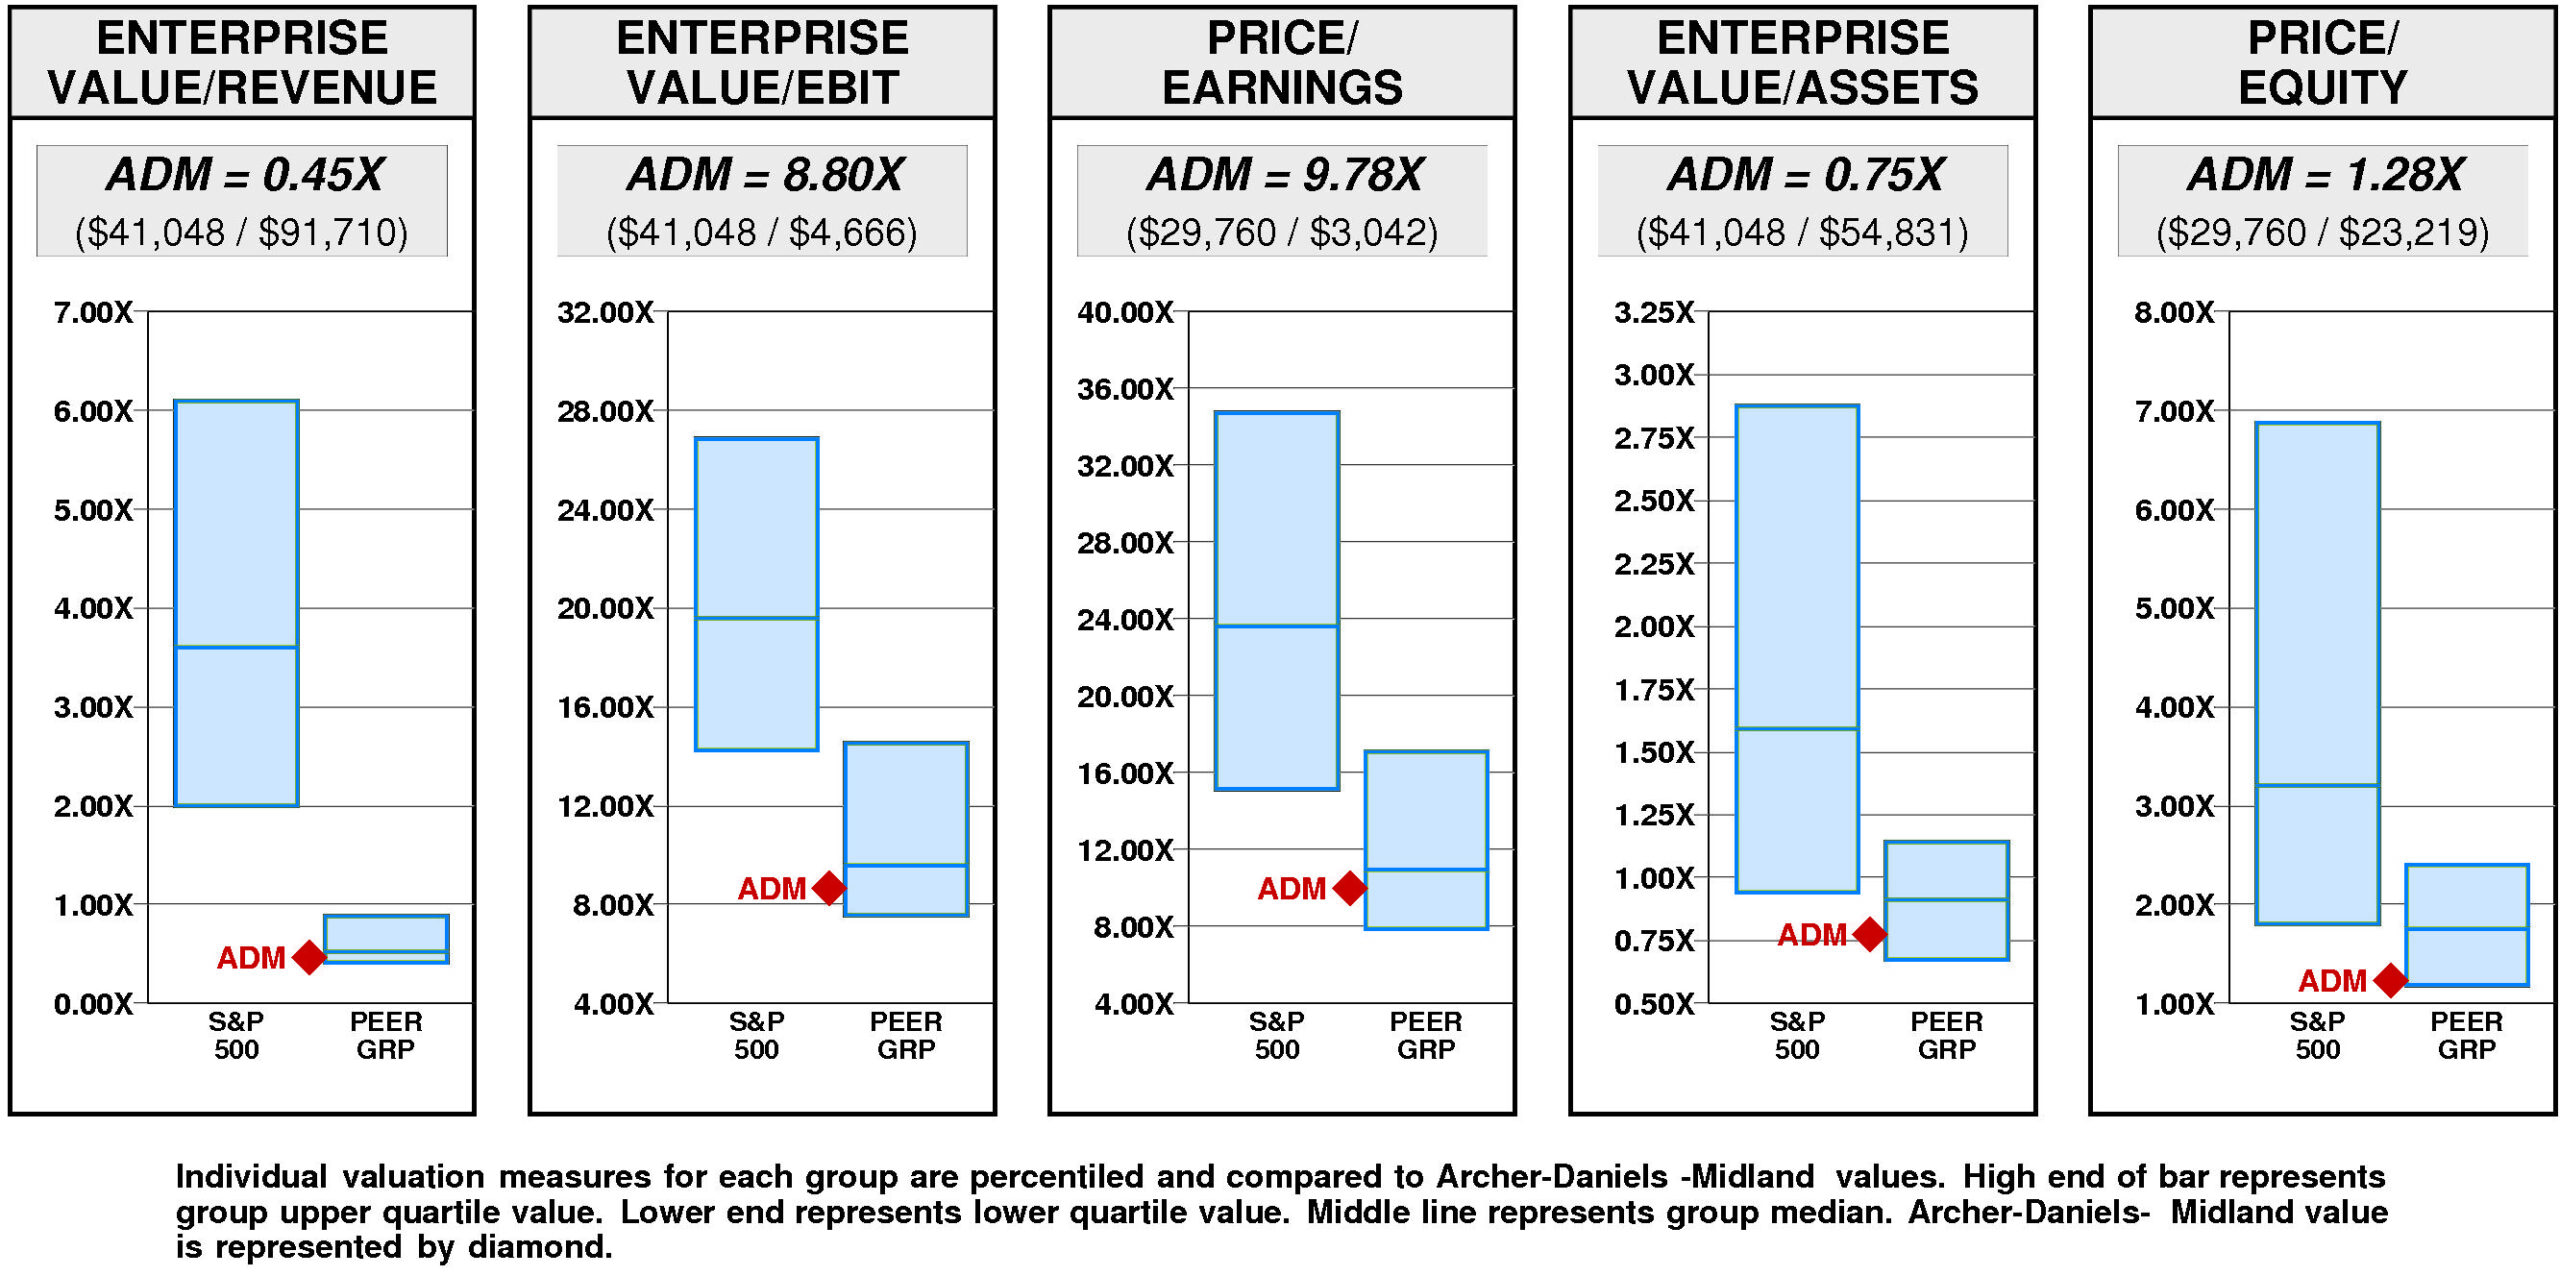
Archer-Daniels-Midland has a very large value gap compared to the median valuation.
For ADM to rise to median valuation, its current ratio of enterprise value/revenue would have to rise from the current level of 0.45X to 0.52X. If ADM's ratio of enterprise value/revenue were to rise to 0.52X, its stock price would be lower by $14 to $74.
For ADM to hit lower quartile valuation relative to the Archer-Daniels-Midland Peer Group, its current ratio of enterprise value/revenue would have to fall from the current level of 0.45X to 0.41X. If ADM's ratio of enterprise value/revenue were to fall to 0.41X, its stock price would decline by $-6 from the current level of $60.
VALUE TARGETS
ADM's future returns on capital are forecasted to exceed the cost of capital. Accordingly, the company is expected to continue to be an important Value Builder.
Archer-Daniels-Midland's current Price Target of $139 represents a +137% change from the current price of $58.66.
This high appreciation potential results in an appreciation score of 78 (only 22% of the universe has greater appreciation potential.)
Notwithstanding this high Appreciation Score of 78, the low Power Rating of 1 results in an Value Trend Rating of D.
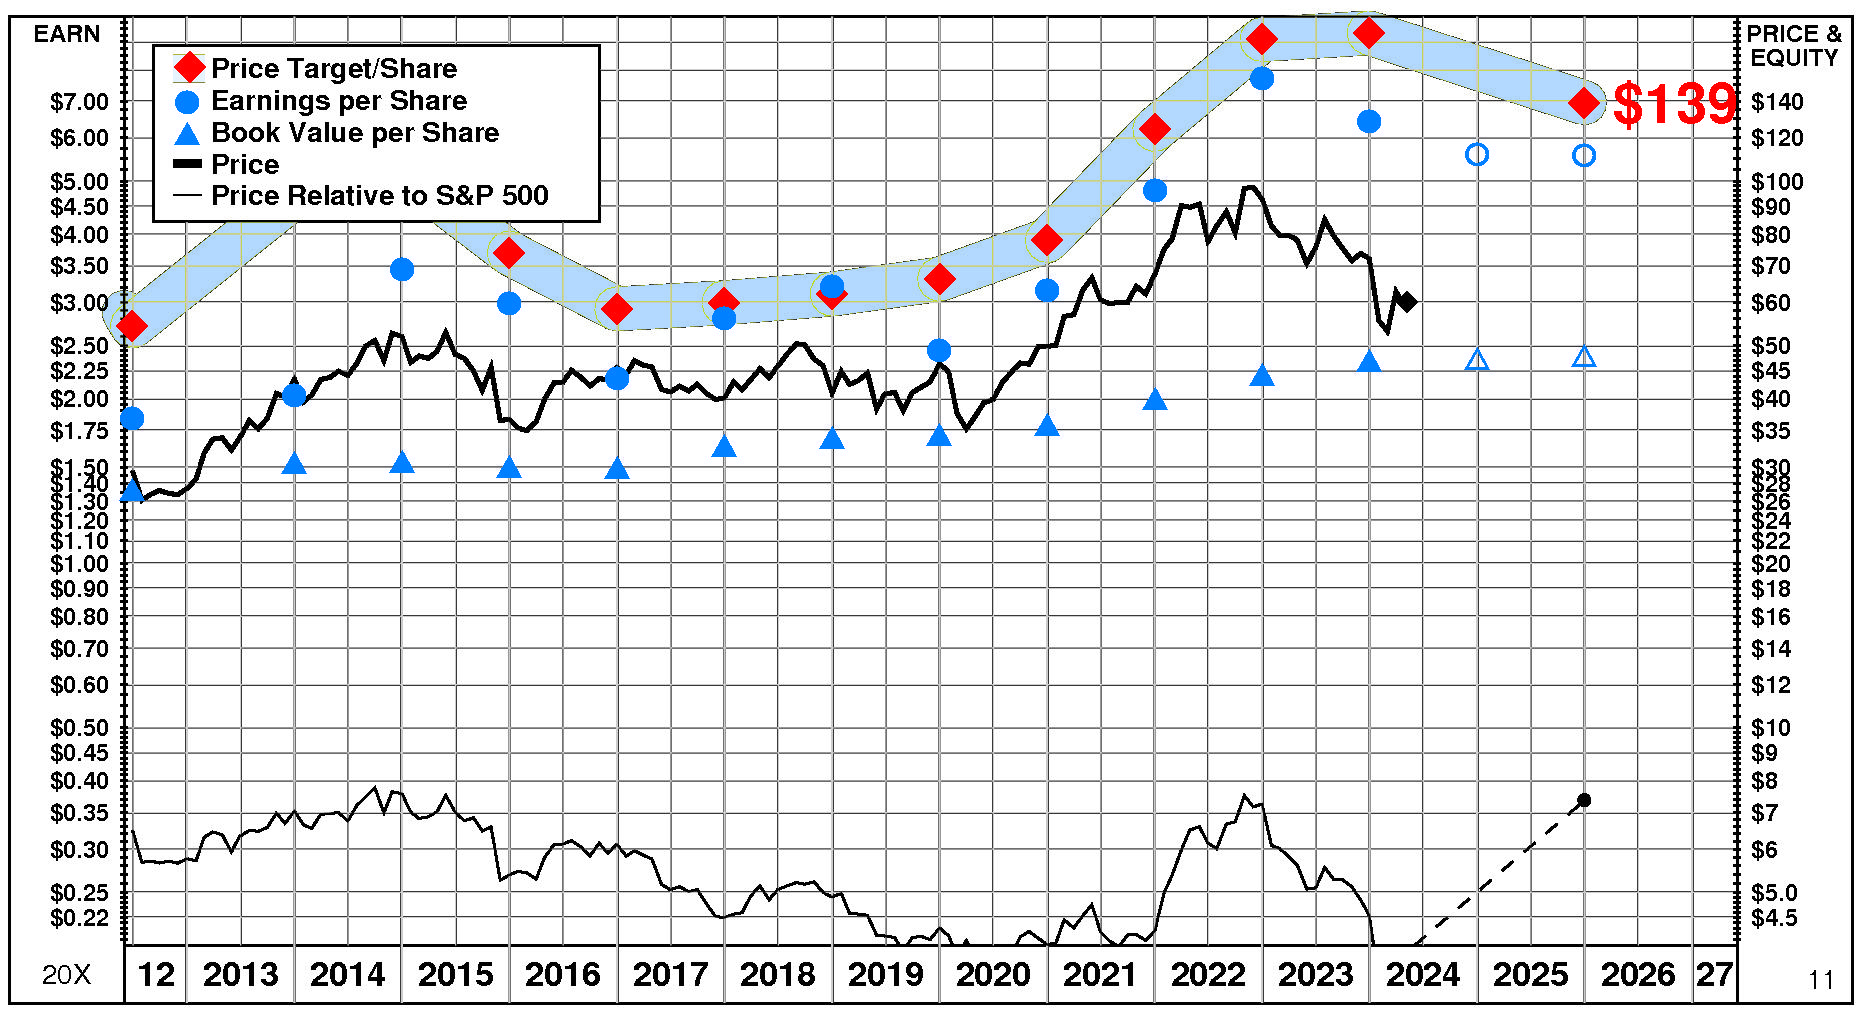
Archer-Daniels-Midland's current Price Target is $139 (-26% from the 2023 Target of $187 but +137% from the 04/30/24 price of $58.66).
This fall in the Target is the result of a -4% decrease in the equity base and a -23% decrease in the price/equity multiple. The forecasted decline in growth has a very large negative impact on the price/equity multiple and the forecasted decline in return on equity has a very large negative impact as well. Partially offsetting these Drivers, the forecasted decline in cost of equity has a very large positive impact.
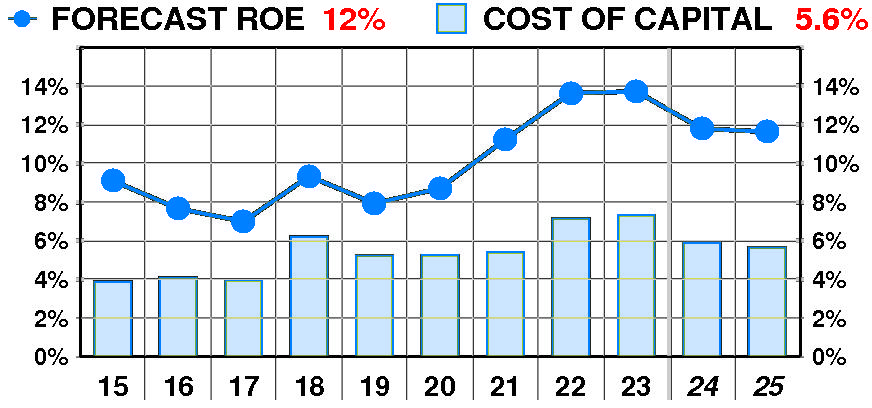
PTR's return on equity forecast is 11.9% — in line with our recent forecasts.
Forecasted return on equity enjoyed a dramatic, variable increase between 2015 and 2023. The current forecast is above the 2017 low of 7%.
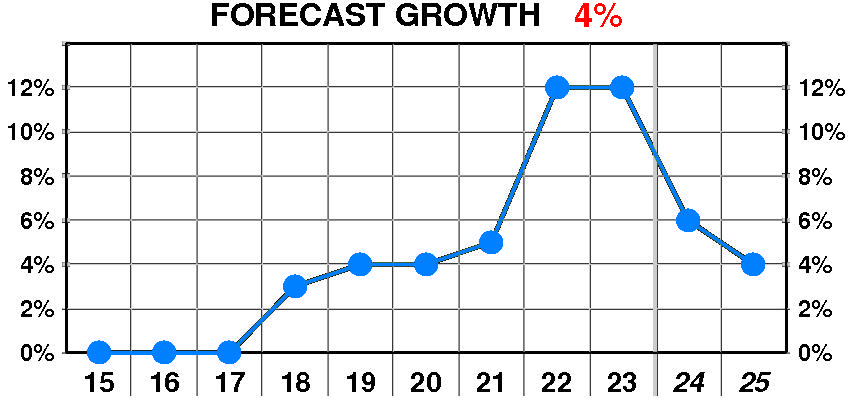
PTR's growth forecast is 4.0% — below our recent forecasts.
Forecasted growth enjoyed a dramatic, steady increase between 2018 and 2023. The current forecast is steady at the 2018 low of 3%.
PTR's cost of equity forecast is 5.8% — in line with recent levels.
Forecasted cost of equity suffered a dramatic, variable increase between 2015 and 2023. The current forecast is steady at the 2015 low of 3.9%.
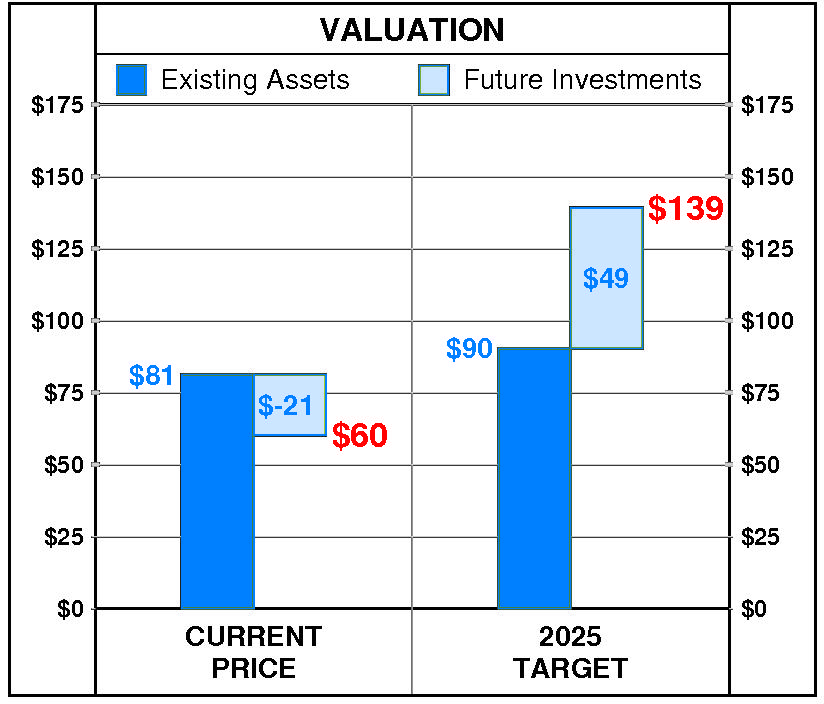
At Archer-Daniels-Midland's current price of $58.66, investors are placing a negative value of $-23 on its future investments. This view is not supported by the company's most recent performance that reflected a growth rate of 12.0% per year, and a return on equity of 13.7% versus a cost of equity of 7.3%.
PTR's 2025 Price Target of $139 is based on these forecasts and reflects an estimated value of existing assets of $89 and a value of future investments of $50.