![]()
BUSINESS
Abbott Laboratories, together with its subsidiaries, discovers, develops, manufactures, and sells health care products worldwide. It operates in four segments: Established Pharmaceutical Products, Diagnostic Products, Nutritional Products, and Medical Devices. The Established Pharmaceutical Products segment provides generic pharmaceuticals for the treatment of pancreatic exocrine insufficiency, irritable bowel syndrome or biliary spasm, intrahepatic cholestasis or depressive symptoms, gynecological disorder, hormone replacement therapy, dyslipidemia, hypertension, hypothyroidism, Meniere’s disease and vestibular vertigo, pain, fever, inflammation, and migraine, as well as provides anti-infective clarithromycin, influenza vaccine, and products to regulate physiological rhythm of the colon.
INVESTMENT RATING
ABT is expected to continue to be a major Value Builder reflecting capital returns that are forecasted to exceed the cost of capital.
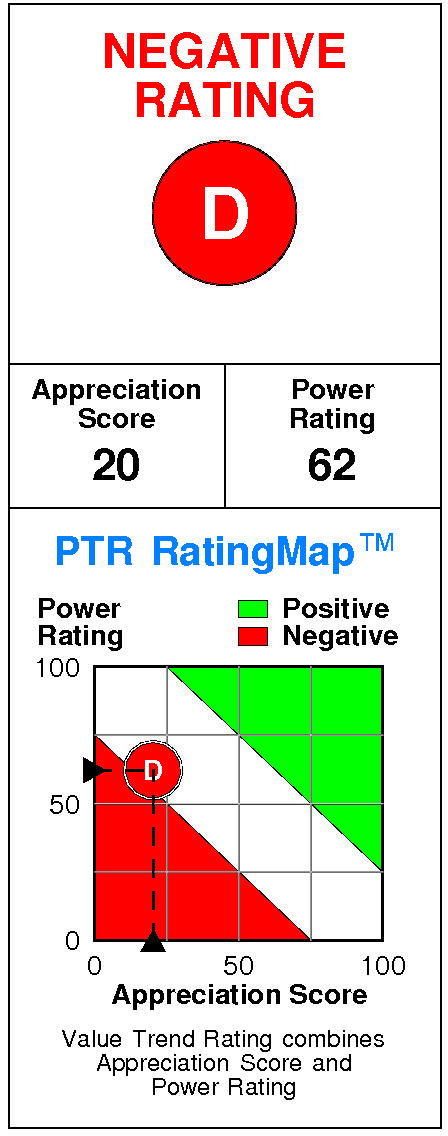
Abbott Laboratories has a current Value Trend Rating of D (Negative).
The Value Trend Rating reflects contradictory signals from PTR’s two proprietary measures of a stock’s attractiveness. Abbott Laboratories has a poor Appreciation Score of 20 but a slightly positive Power Rating of 62, and the Negative Value Trend Rating results.
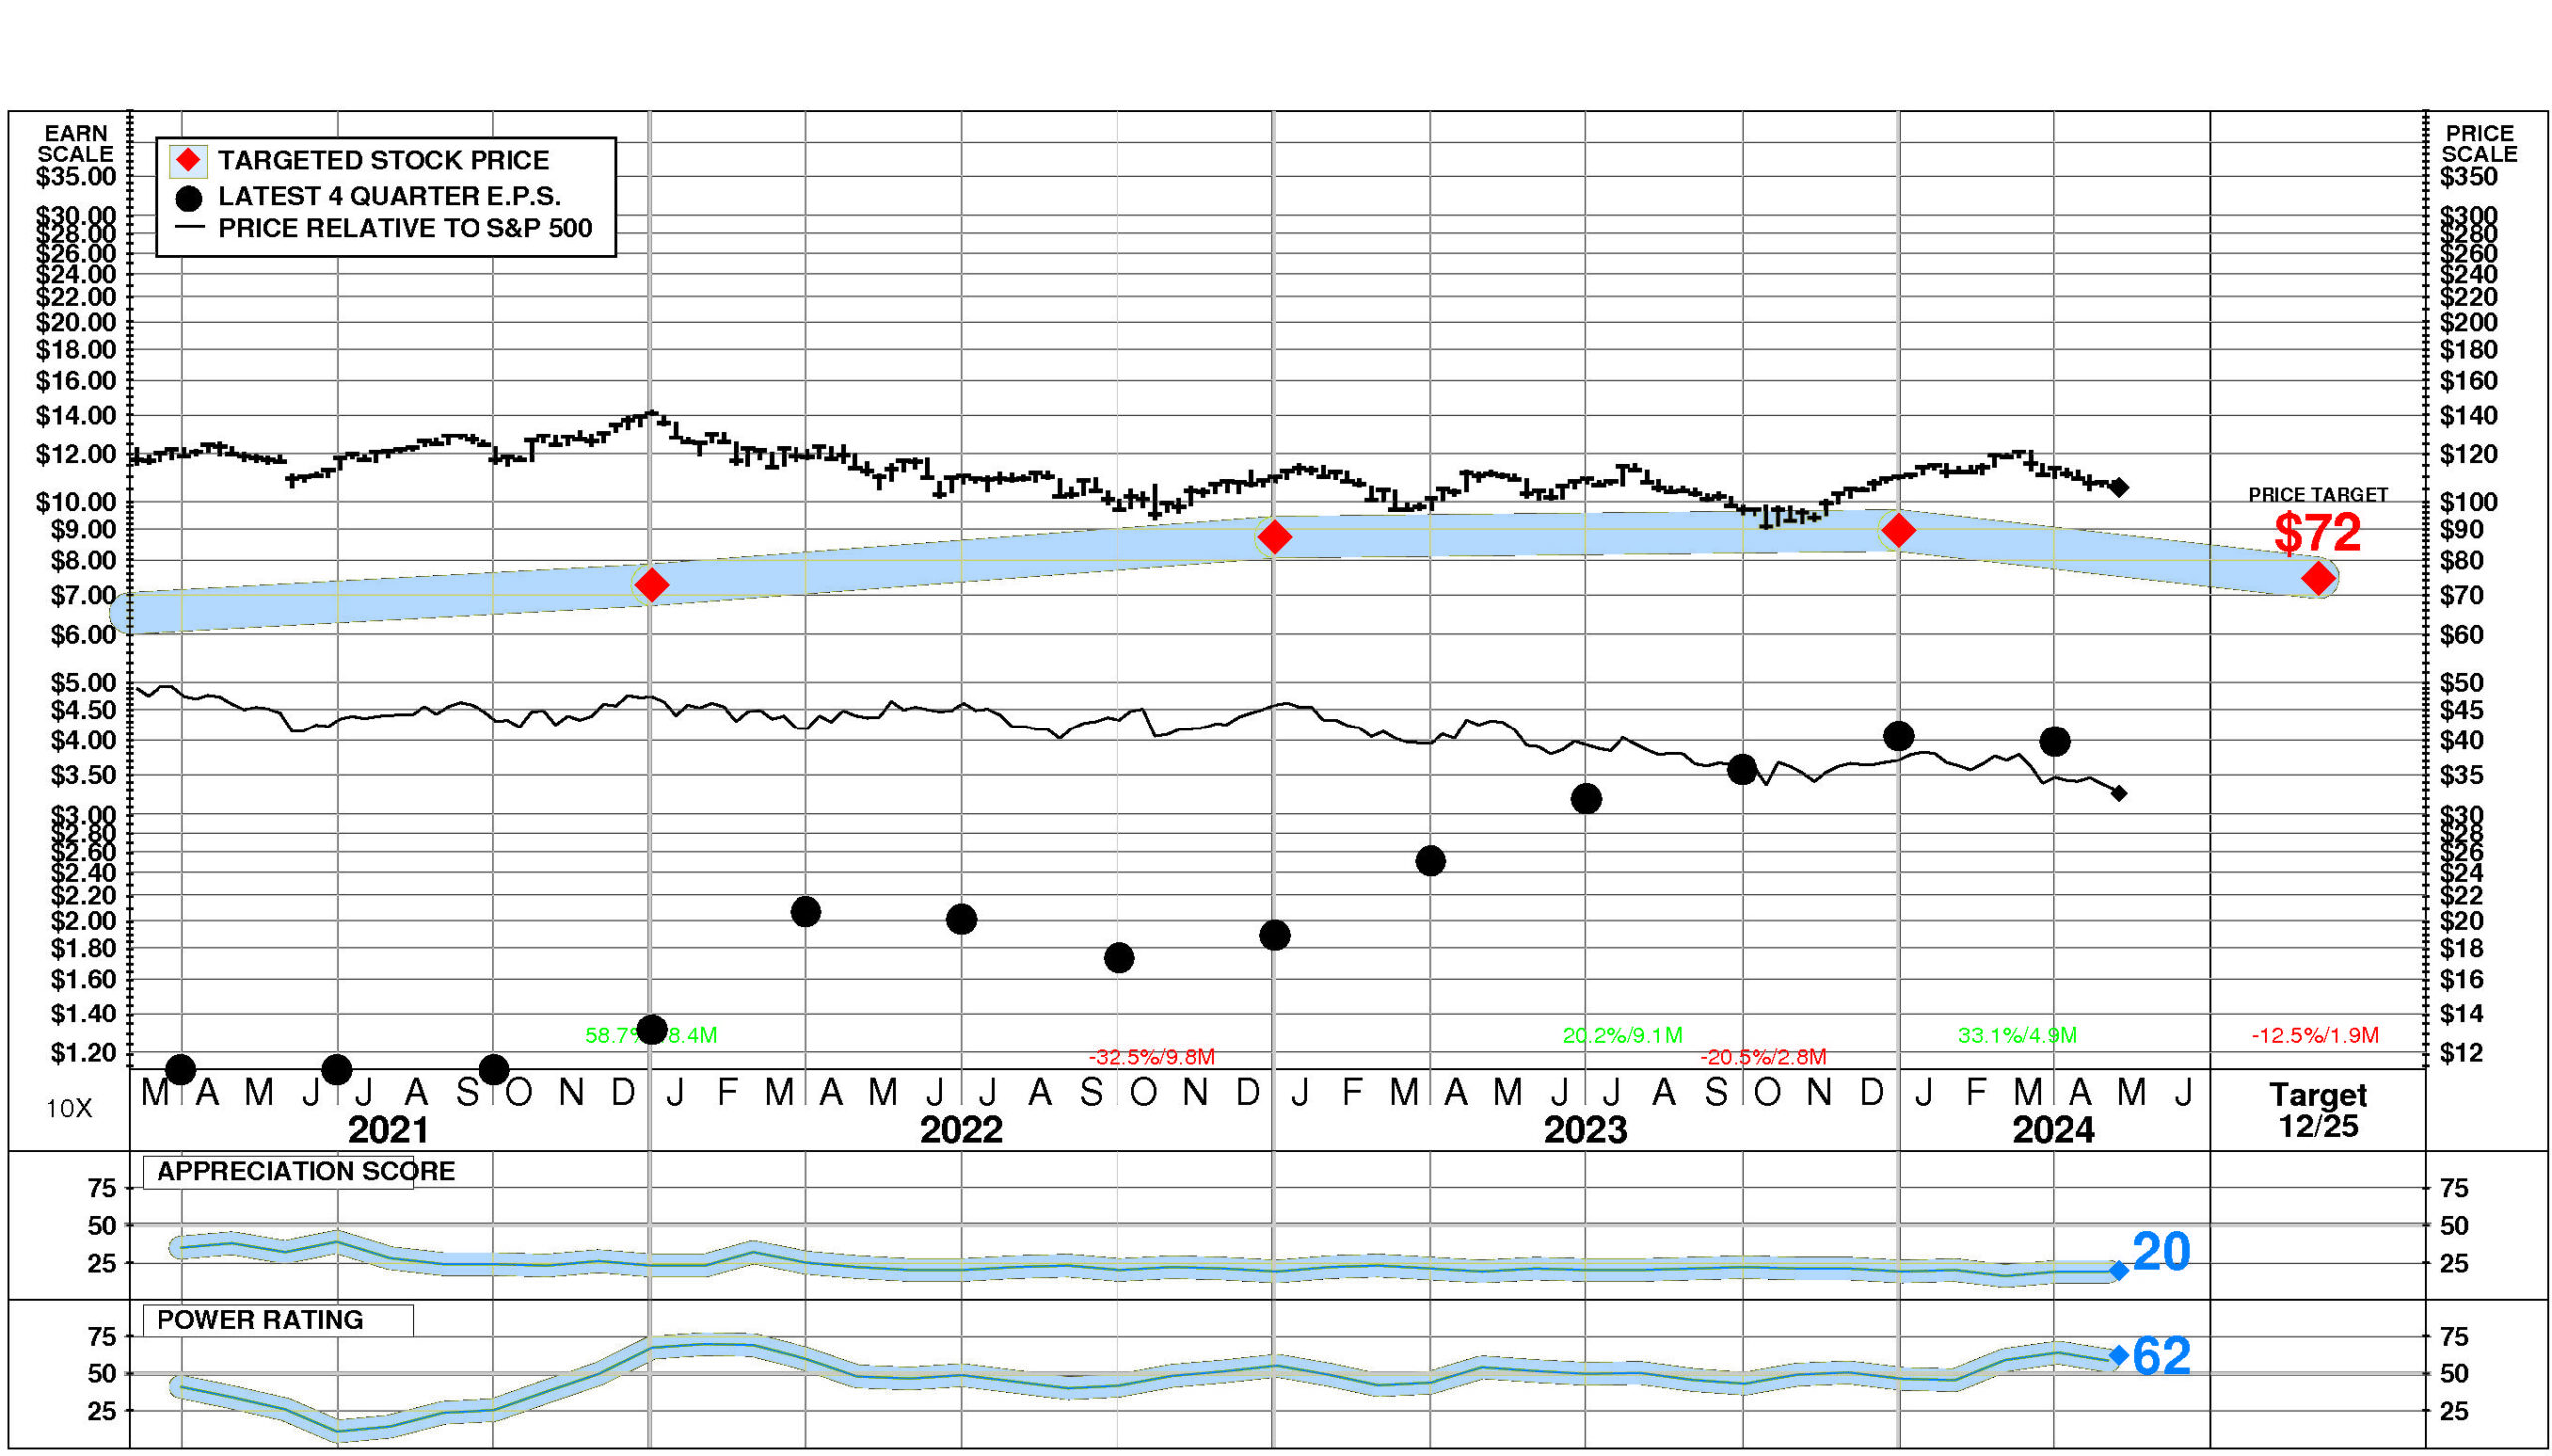
Abbott Laboratories’ stock is selling well above targeted value. The current stock price of $105.64 compares to targeted value 12 months forward of $75.
Abbott Laboratories’ low appreciation potential results in an appreciation score of 20 (80% of the universe has greater appreciation potential.)
Abbott Laboratories has a Power Rating of 62. (This slightly positive Power Rating indicates that ABT’s chances of achieving favorable investment performance over the near to intermediate term are only average.)
Factors contributing to this slightly positive Power Rating include: recent price action has been slightly favorable; and earnings estimate behavior for ABT has been slightly favorable recently. An offsetting factor is the Electromedical Apparatus comparison group is currently in an unfavorable position.
INVESTMENT PROFILE
ABT’s financial strength is high. Financial strength rating is 82.
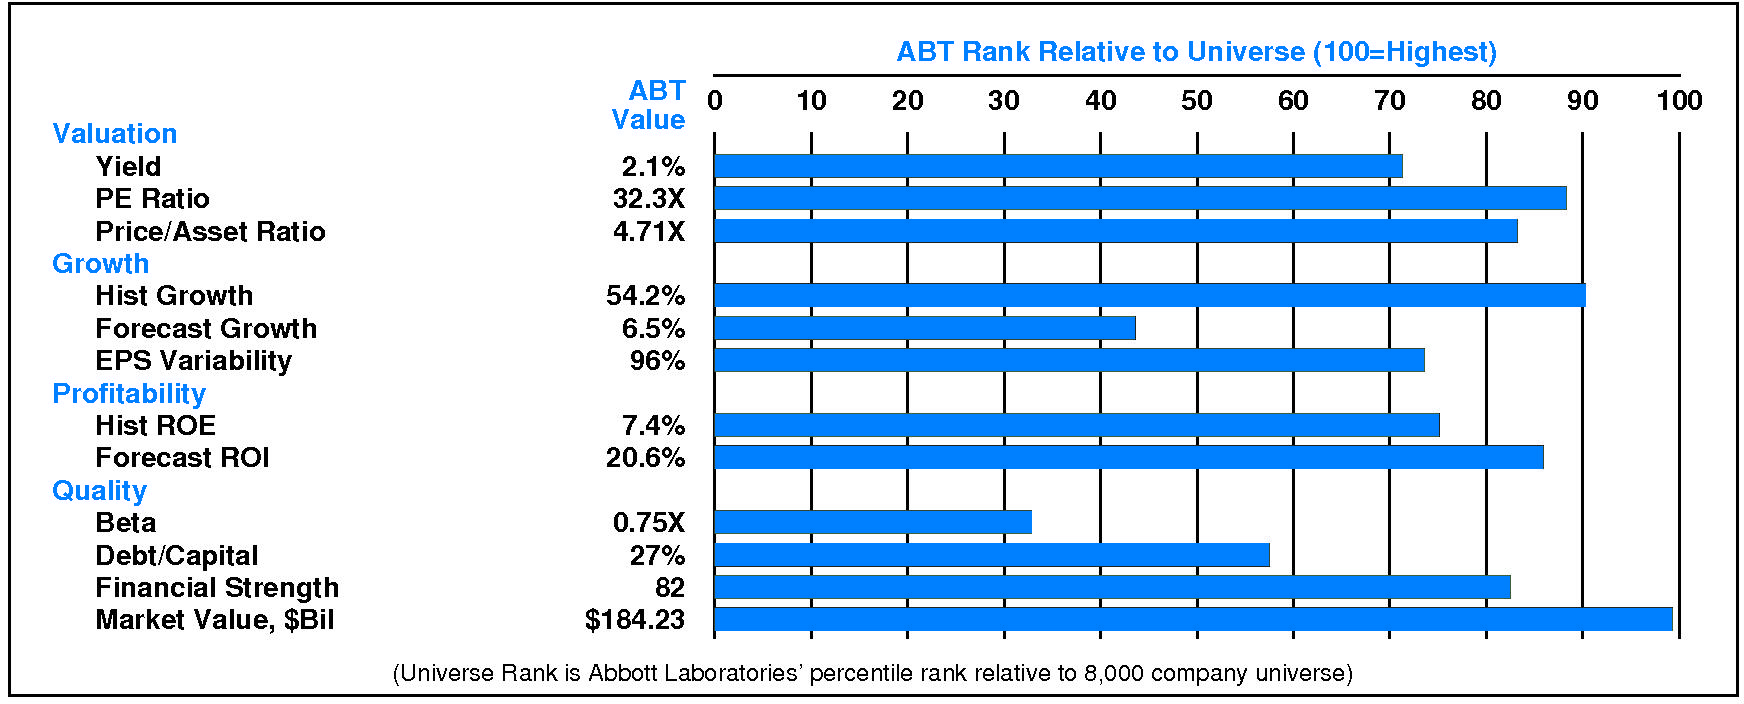
Relative to the S&P 500 Composite, Abbott Laboratories has neutral Growth/Value characteristics; its appeal is likely to be to investors neutral towards Income; the perception is that ABT is normal risk. Relative weaknesses include: low historical profitability, low expected growth, and high earnings variability. ABT’s valuation is moderate: moderate dividend yield, moderate P/E ratio, and moderate price/book ratio. ABT has unusually high market capitalization.
CURRENT SIGNALS
Abbott Laboratories’ current operations are eroding. Return on equity is falling, reflecting: falling asset utilization; declining pretax margin; falling tax keep rate; and falling leverage.
Abbott Laboratories’ current technical position is mixed. The stock price is in a 4.9 month up move. The stock has appreciated 33.1% from its prior low. The 200 day moving average is in a downtrend. The stock price is above its 200 day moving average.
ALERTS
Abbott Laboratories (NYSE: ABT) has recently experienced extremely important negative changes in investment behavior: the stock’s recent price decline challenged its longer term uptrend, and negative upside/downside volume developed.
The stock is currently rated D.
Abbott Laboratories (NYSE: ABT) stock declined slightly by -0.2% on 5/6/24. The stock closed at $105.64. However, below average trading volume at 67% of normal accompanied the decline. The stock has been strong relative to the market over the last nine months but has declined -1.8% during the last week.
CASH FLOW
In 2023, Abbott Laboratories experienced a very significant reduction in cash of -$2,891 million (-28%). Sources of cash were much lower than uses. Cash generated from 2023 EBITDA totaled +$10,036 million. Non-operating sources contributed +$508 million (+5% of EBITDA). Cash taxes consumed -$1,364 million (-14% of EBITDA). Re-investment in the business amounted to -$5,555 million (-55% of EBITDA). On a net basis, debt investors withdrew -$2,710 million (-27% of EBITDA) while equity investors received -$3,806 million (-38% of EBITDA).
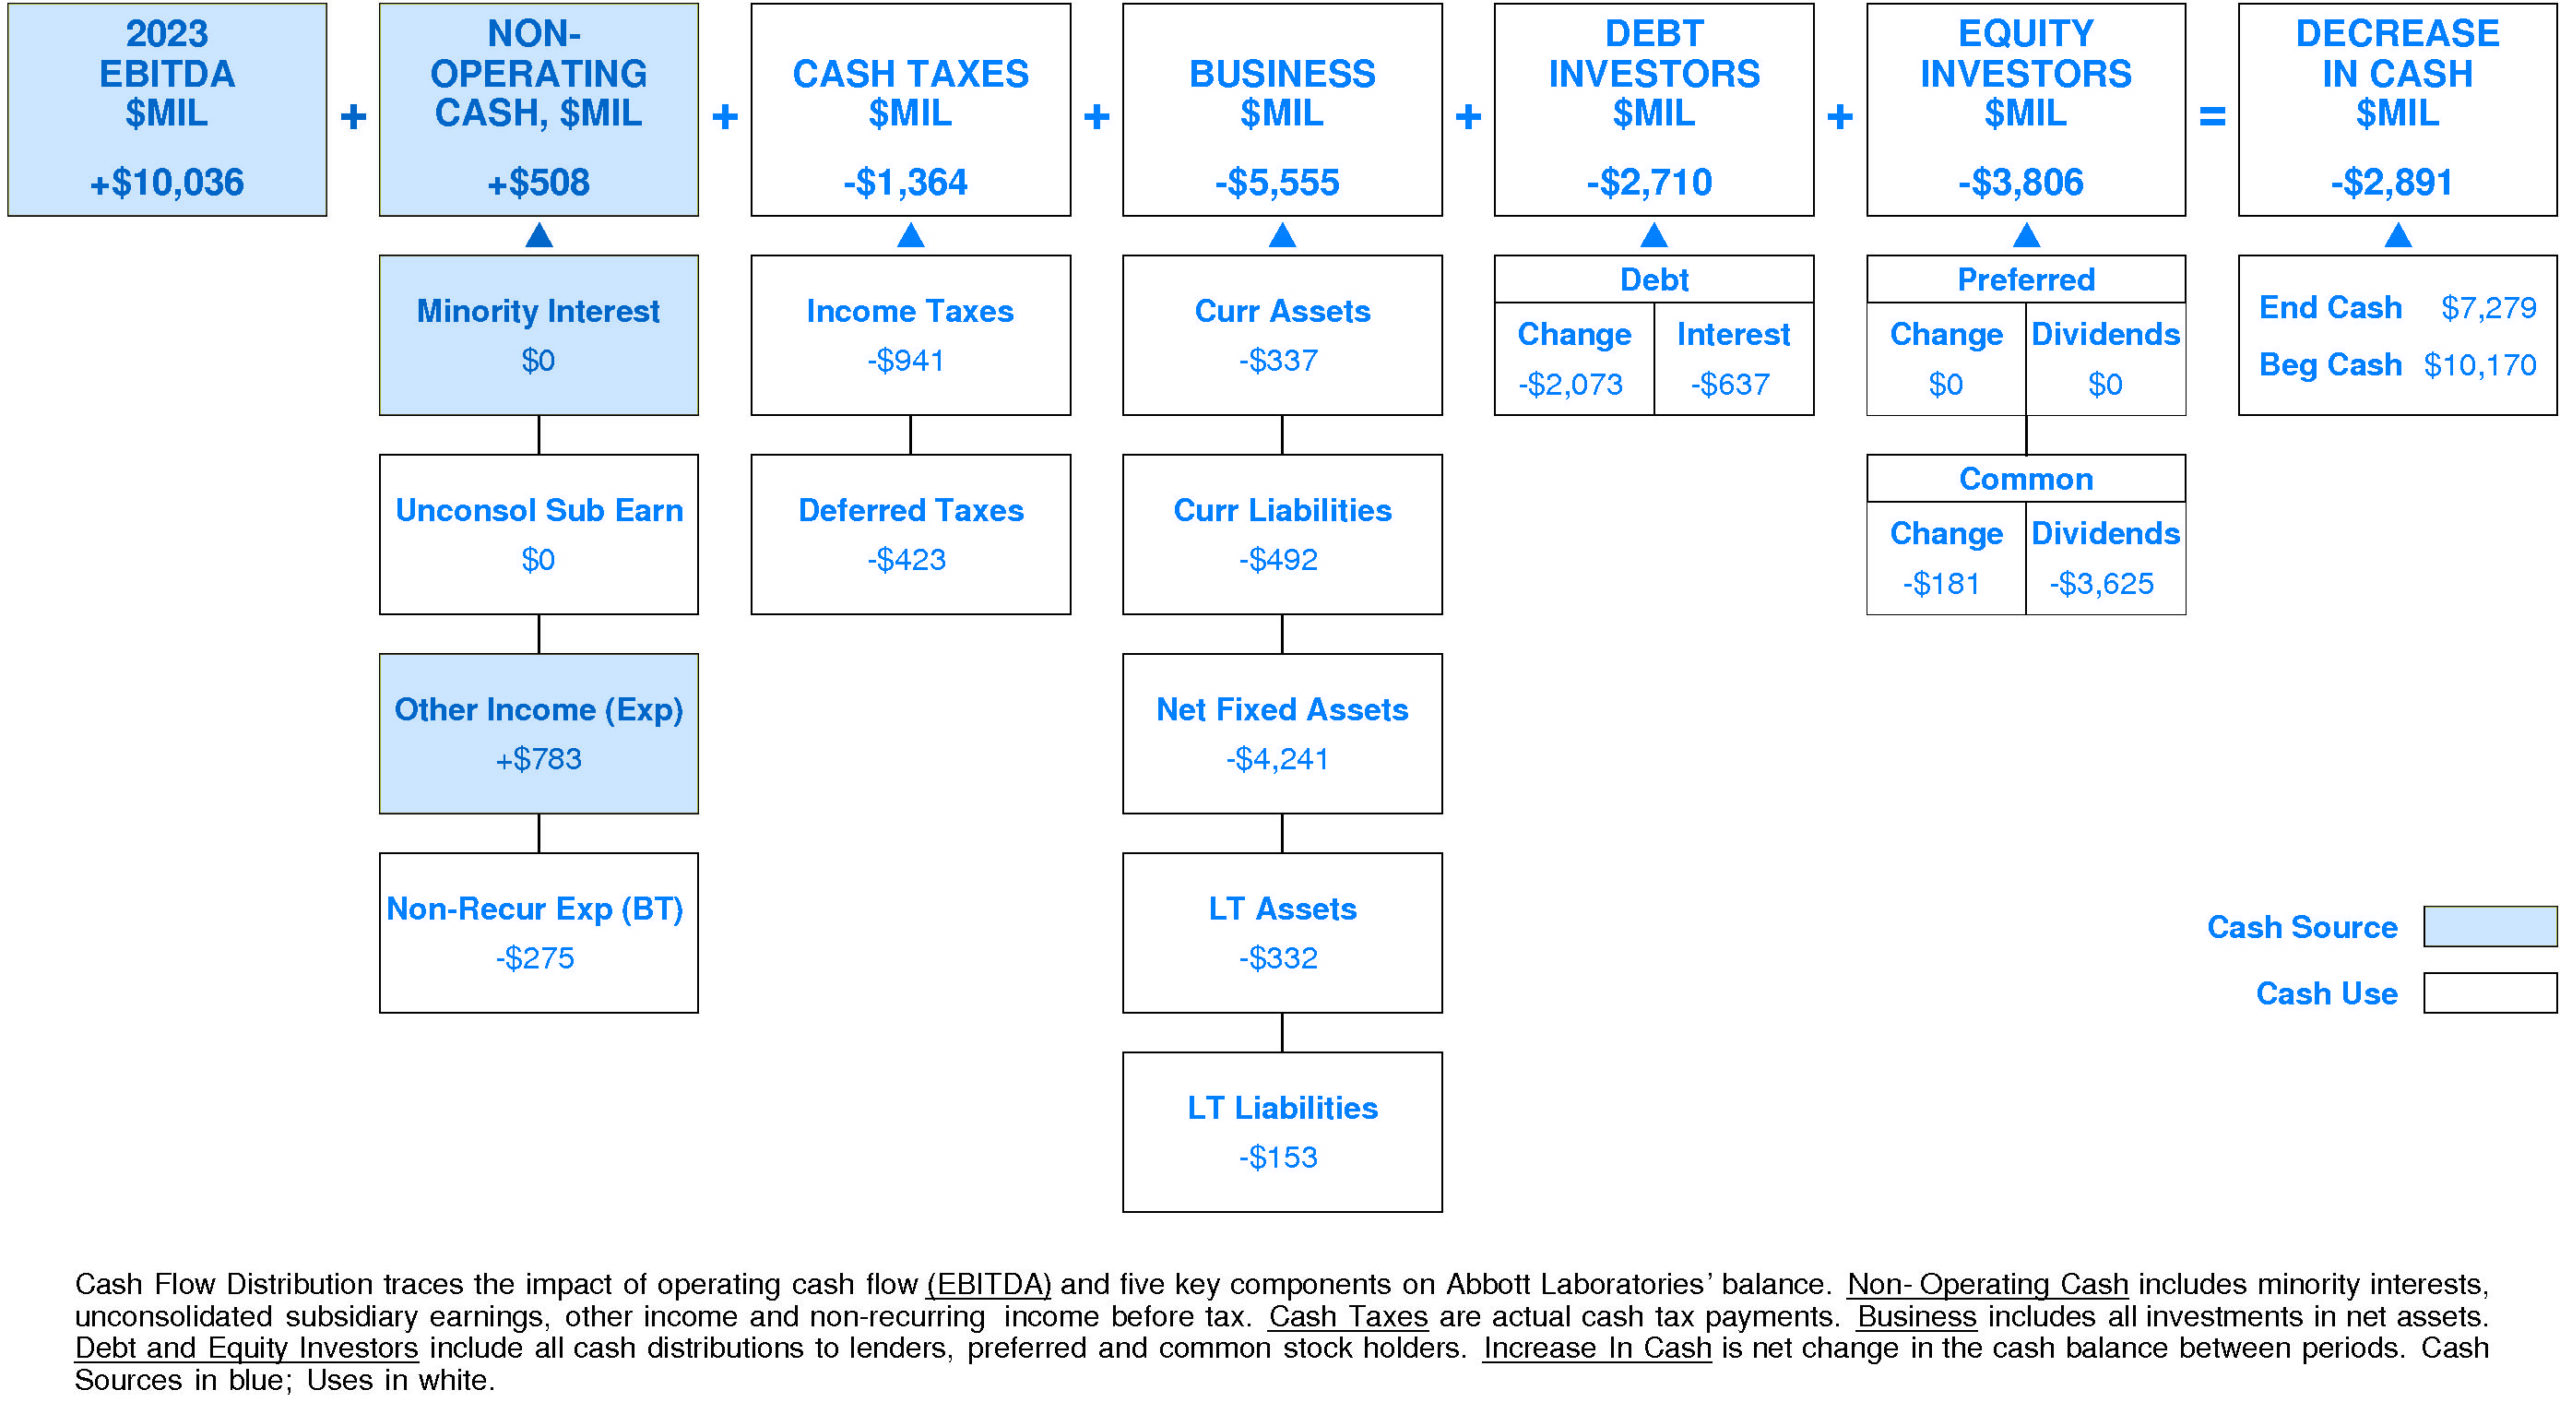
Abbott Laboratories’ Non-operating Income, %EBITDA has exhibited a volatile overall uptrend over the period. This improvement was accompanied by stability for the Abbott Laboratories Peer Group. In most years, Abbott Laboratories was in the third quartile and second quartile. Currently, Abbott Laboratories is above median at +5% of EBITDA (+$508 million).
Abbott Laboratories’ Cash Taxes, %EBITDA has exhibited little to no overall change over the period. This stability was accompanied by an uptrend for the Abbott Laboratories Peer Group. In most years, Abbott Laboratories was in the top quartile and second quartile. Currently, Abbott Laboratories is at median at -14% of EBITDA (-$1,364 million).
Abbott Laboratories’ Business Re-investment, %EBITDA has enjoyed a volatile overall uptrend over the period. This improvement was accompanied by stability for the Abbott Laboratories Peer Group. In most years, Abbott Laboratories was in the top quartile and second quartile. Currently, Abbott Laboratories is substantially below median at -55% of EBITDA (-$5,555 million).
Abbott Laboratories’ Debt Investors, %EBITDA has experienced a volatile overall downtrend over the period. This downtrend was accompanied by a similar trend for the Abbott Laboratories Peer Group. (Since 2020 Debt Investors, %EBITDA has decelerated.) In most years, Abbott Laboratories was in the second quartile and top quartile. Currently, Abbott Laboratories is lower quartile at -27% of EBITDA (-$2,710 million).
Abbott Laboratories’ Equity Investors, %EBITDA has exhibited a volatile overall uptrend over the period. This improvement was accompanied by stability for the Abbott Laboratories Peer Group. In most years, Abbott Laboratories was in the third quartile and second quartile. Currently, Abbott Laboratories is slightly above median at -38% of EBITDA (-$3,806 million).
Abbott Laboratories’ Change in Cash, %EBITDA has experienced a downtrend over the period. This downtrend was accompanied by stability for the Abbott Laboratories Peer Group. (Since 2020 Change in Cash, %EBITDA has accelerated very sharply.) In most years, Abbott Laboratories was in the top quartile and lower quartile. Currently, Abbott Laboratories is substantially below median at -29% of EBITDA (-$2,891 million).
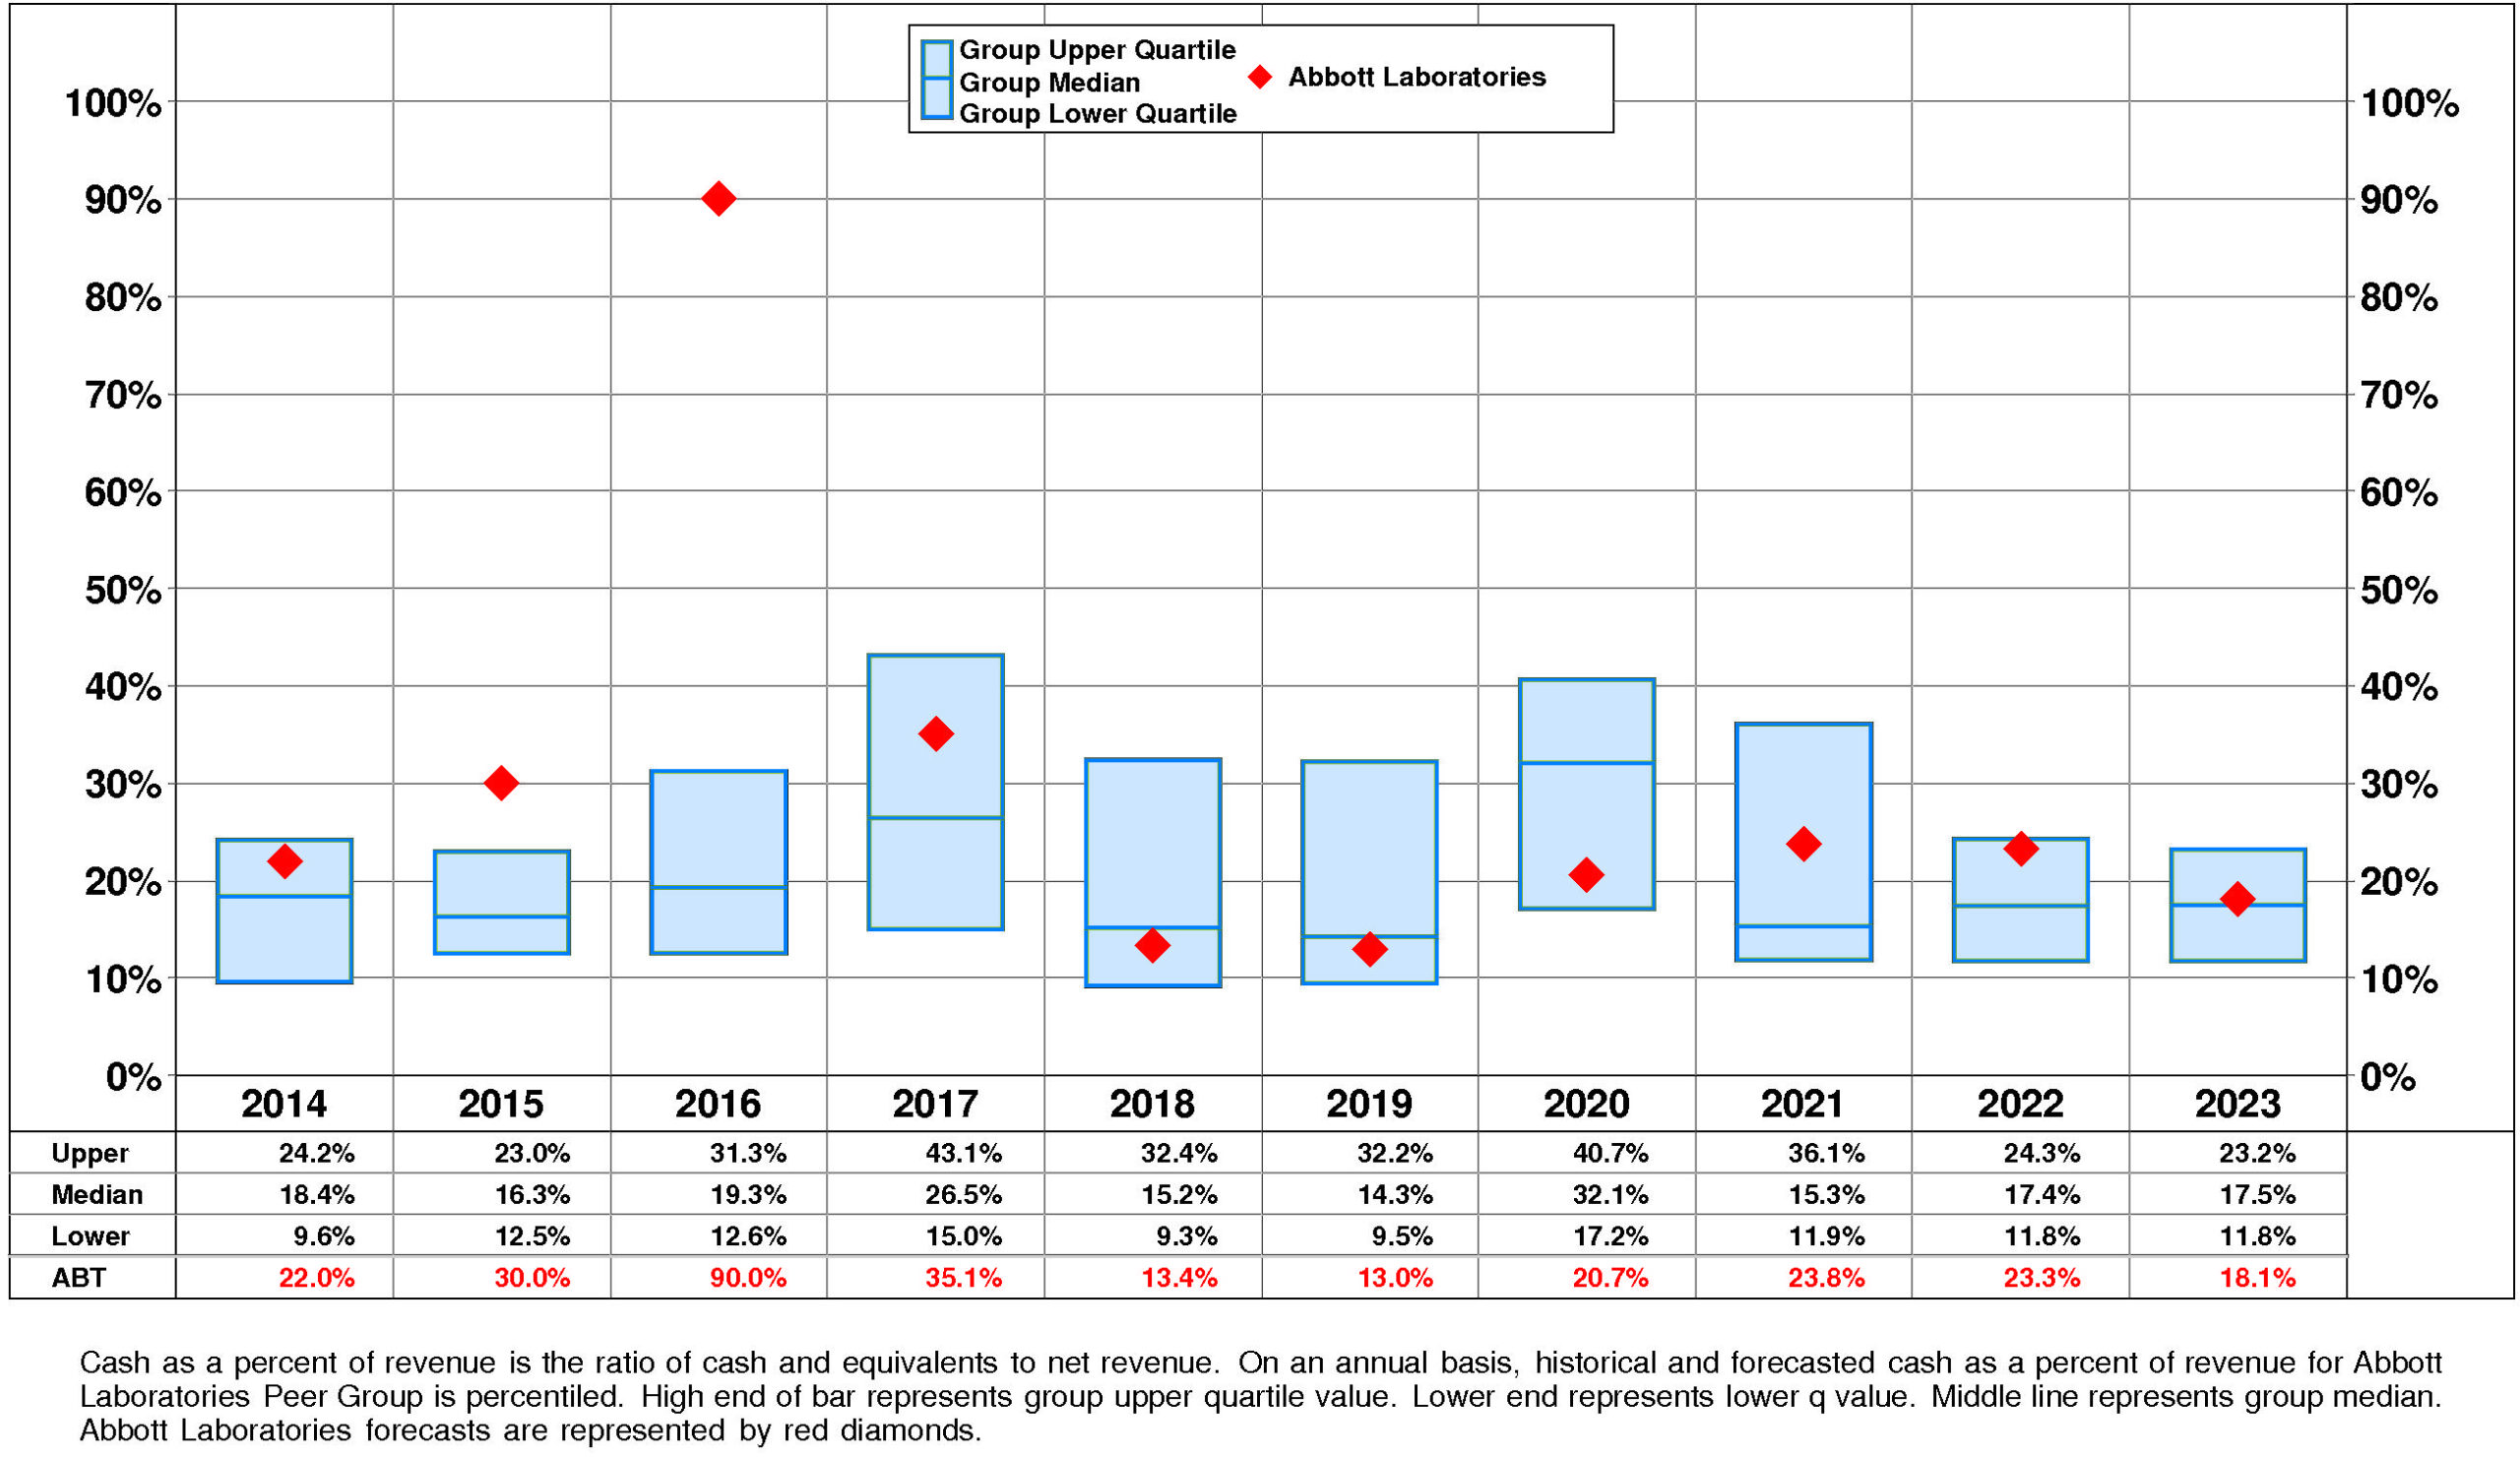
Abbott Laboratories’ Cash, %Revenue has suffered a volatile overall downtrend over the period. This downtrend was accompanied by stability for the Abbott Laboratories Peer Group. In most years, Abbott Laboratories was in the second quartile and top quartile. Currently, Abbott Laboratories is slightly above median at +18%.
PROFITABILITY
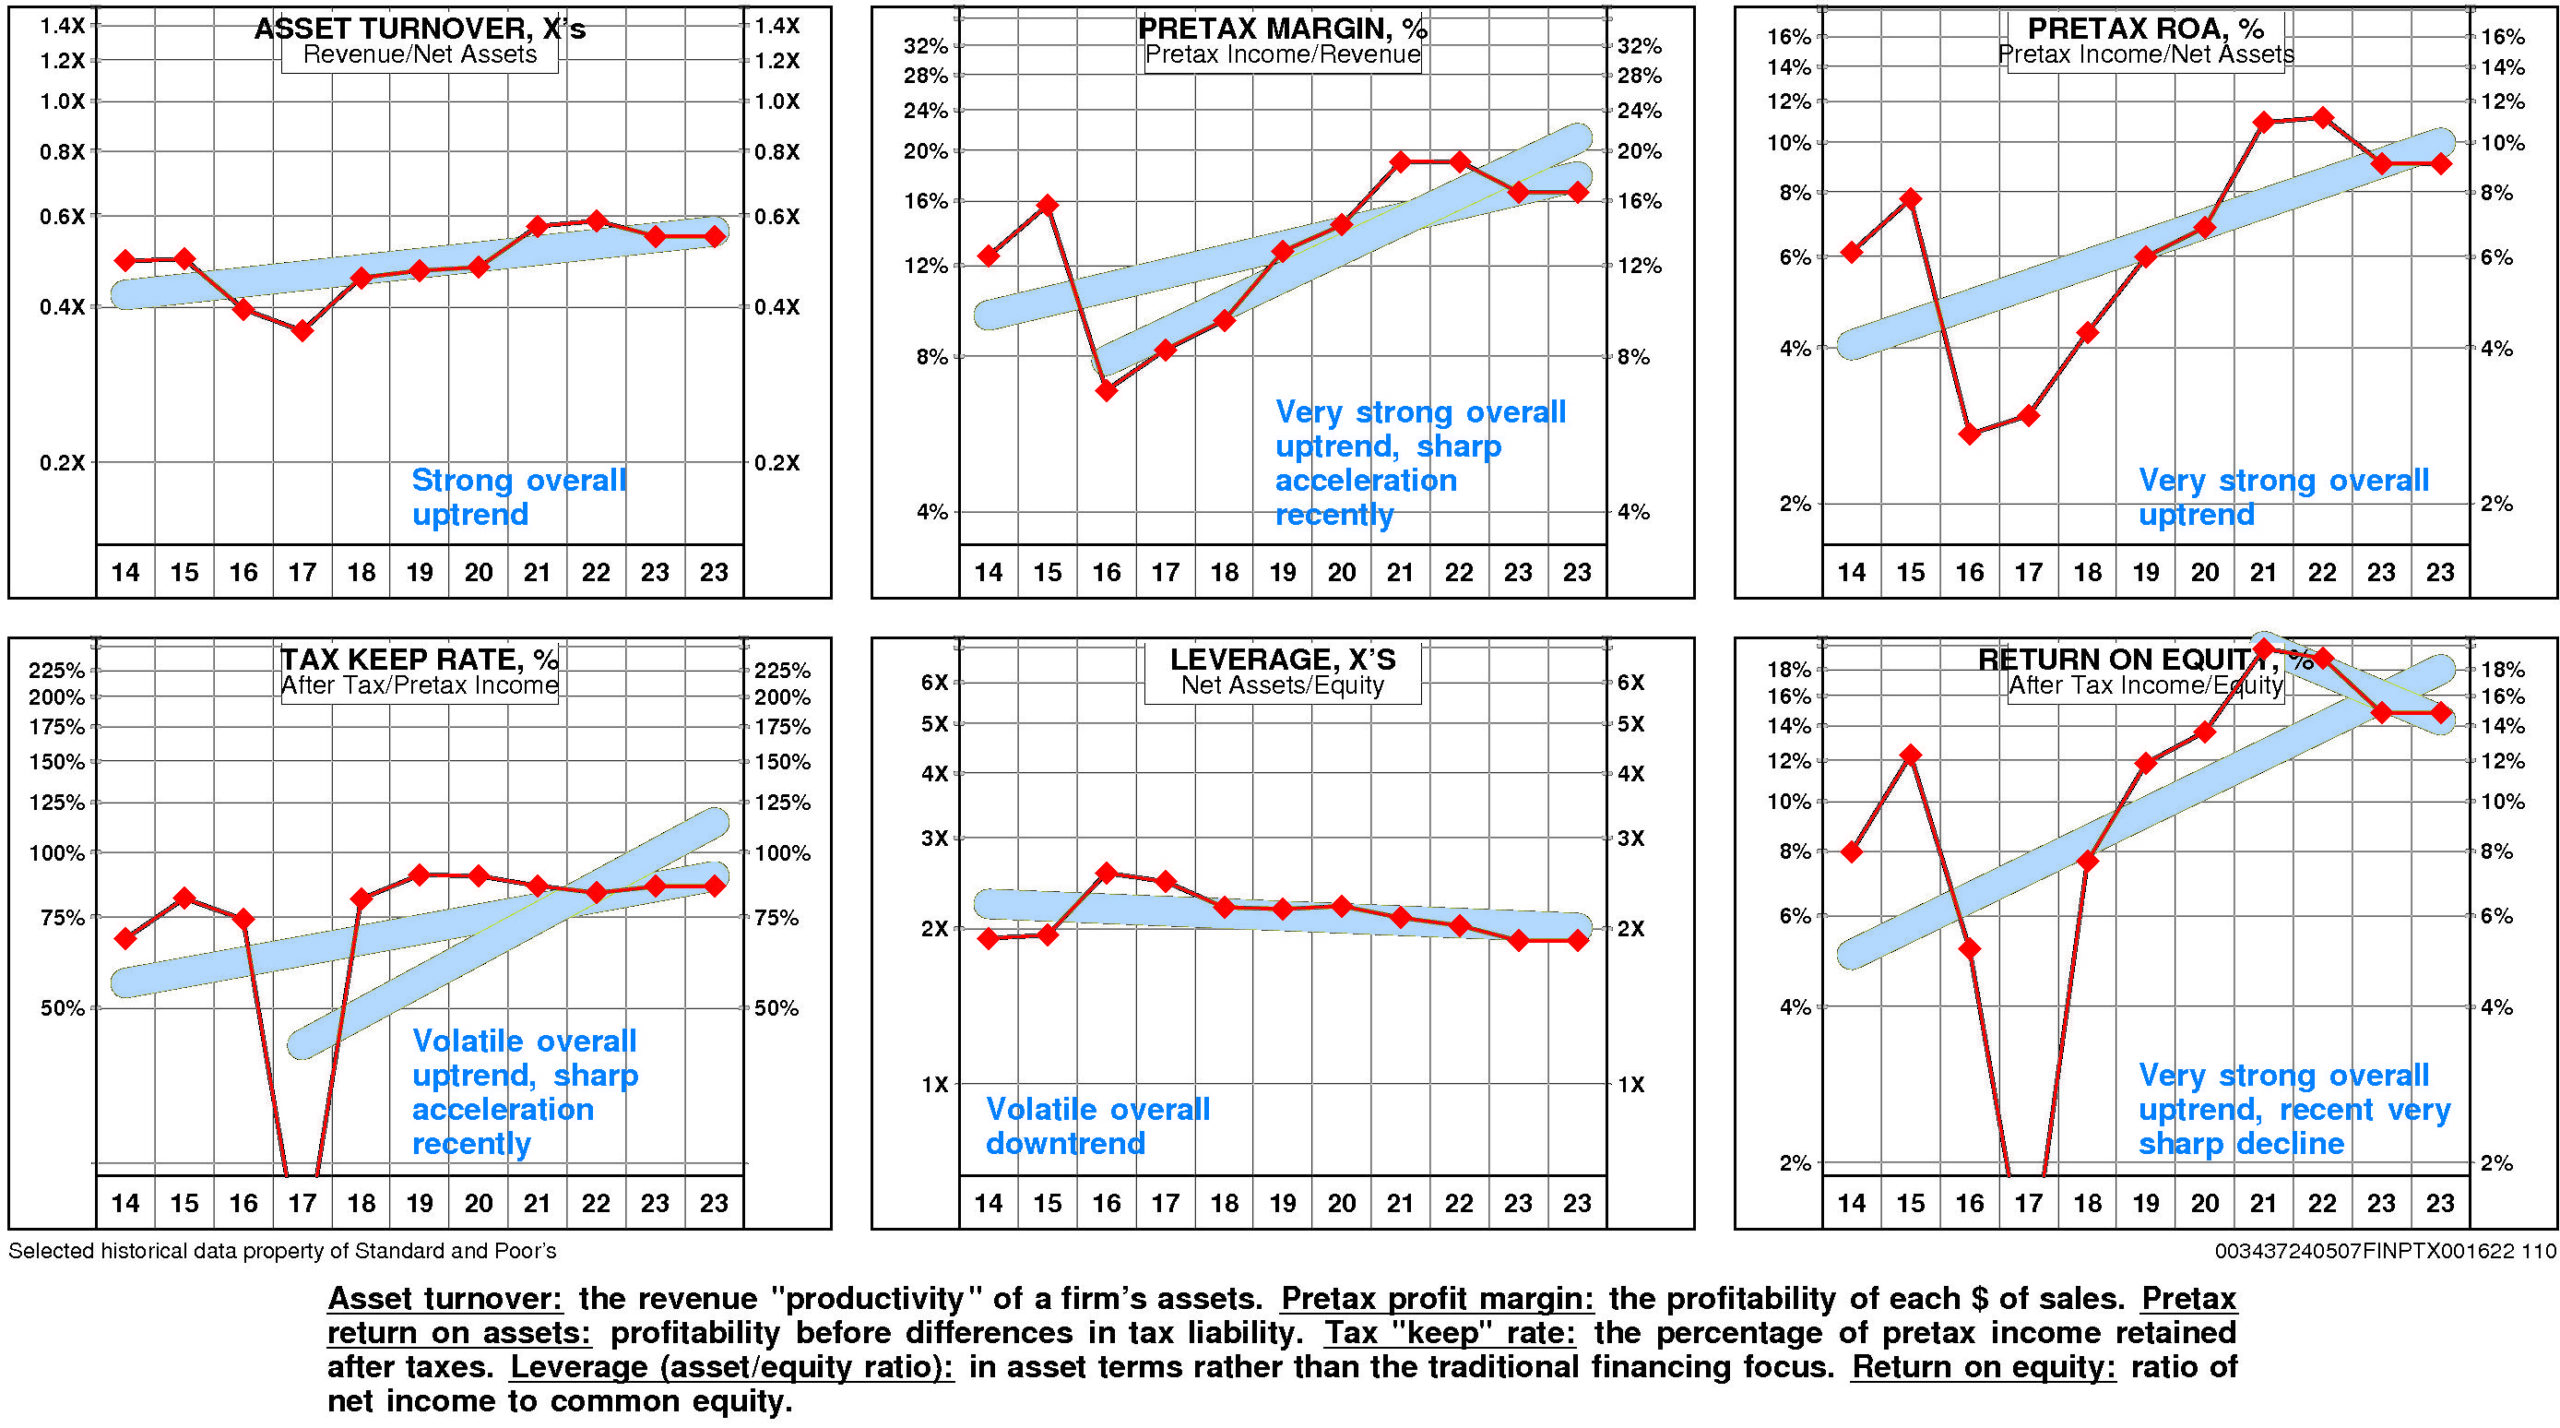
Abbott Laboratories’ return on equity has improved very significantly since 2014. The current level of 14.8% is 1.85X the low for the period and is -24.9% from the high.
This very significant improvement was due to very strong positive trend in pretax operating return supported by strong positive trend in non-operating factors.
The productivity of Abbott Laboratories’ assets rose over the full period 2014-2023: asset turnover has enjoyed a strong overall uptrend.
Reinforcing this trend, pretax margin enjoyed a very strong overall uptrend that sharply accelerated from the 2016 level.
Non-operating factors (income taxes and financial leverage) had a significant positive influence on return on equity.
Abbott Laboratories’ return on equity is above median (14.8%) for the four quarters ended December, 2023.
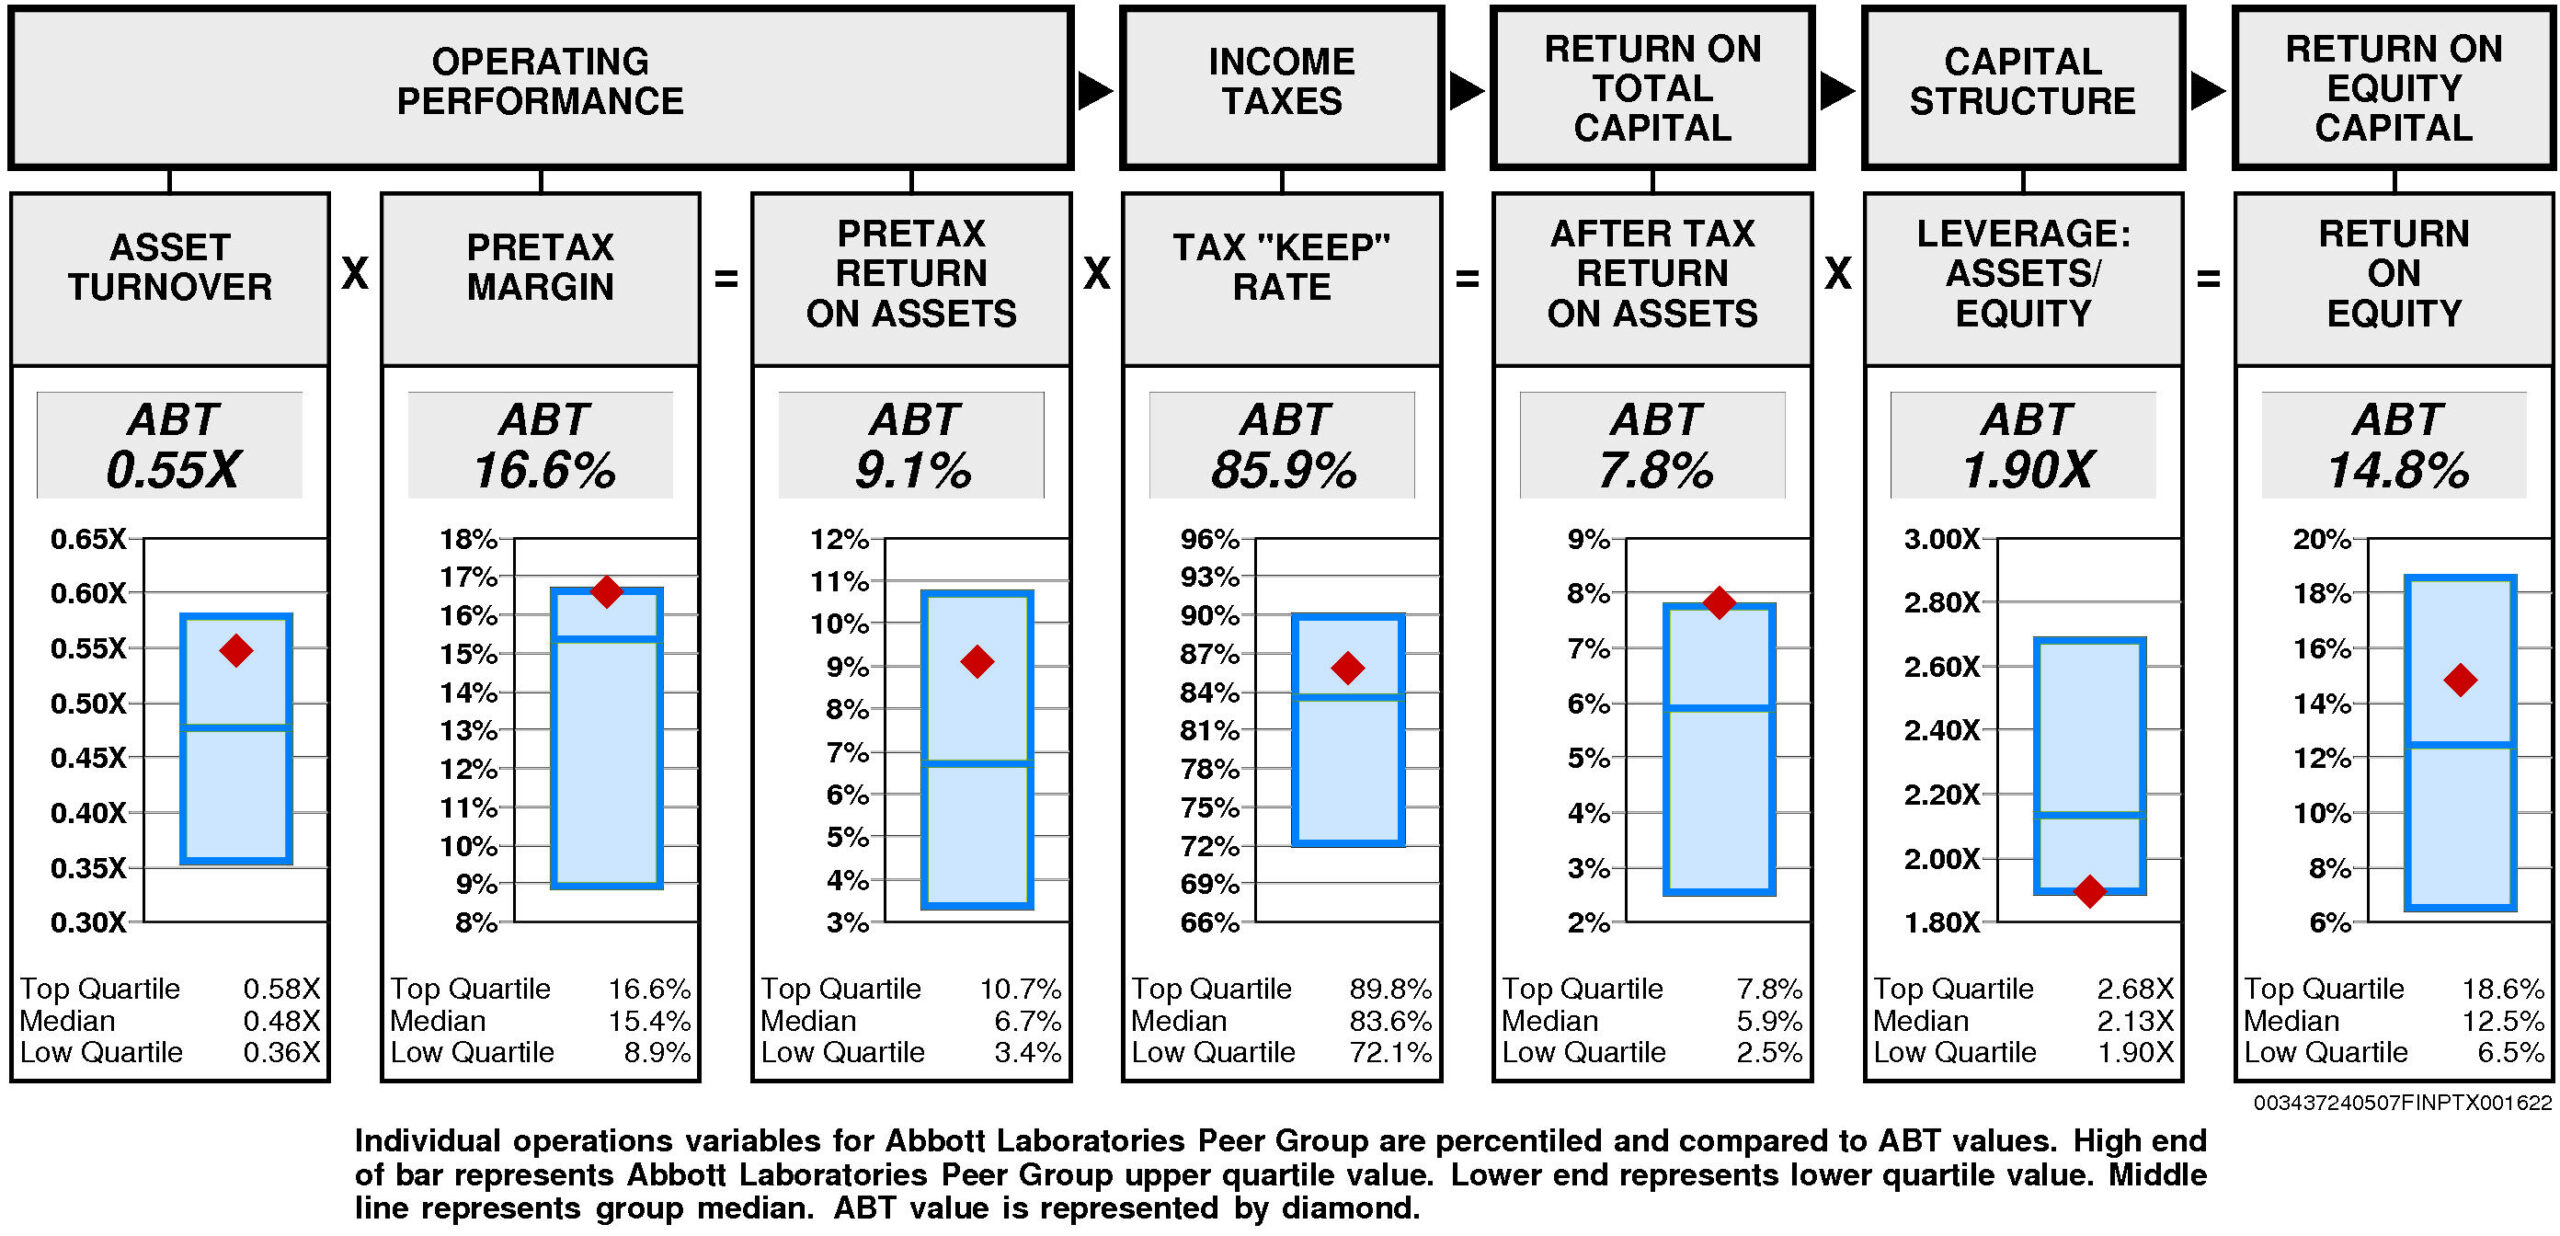
Operating performance (pretax return on assets) is above median (9.1%) reflecting asset turnover that is above median (0.55X) and pretax margin at the upper quartile (16.6%).
Tax “keep” rate (income tax management) is above median (85.9%) resulting in after tax return on assets that is at the upper quartile.
Financial leverage (leverage) is at the lower quartile (1.90X).
GROWTH RATES
There are no significant differences between Abbott Laboratories’ longer term growth and growth in recent years.
Abbott Laboratories’ historical income statement growth and balance sheet growth have diverged. Revenue growth has paralleled asset growth; earnings growth has exceeded equity growth.
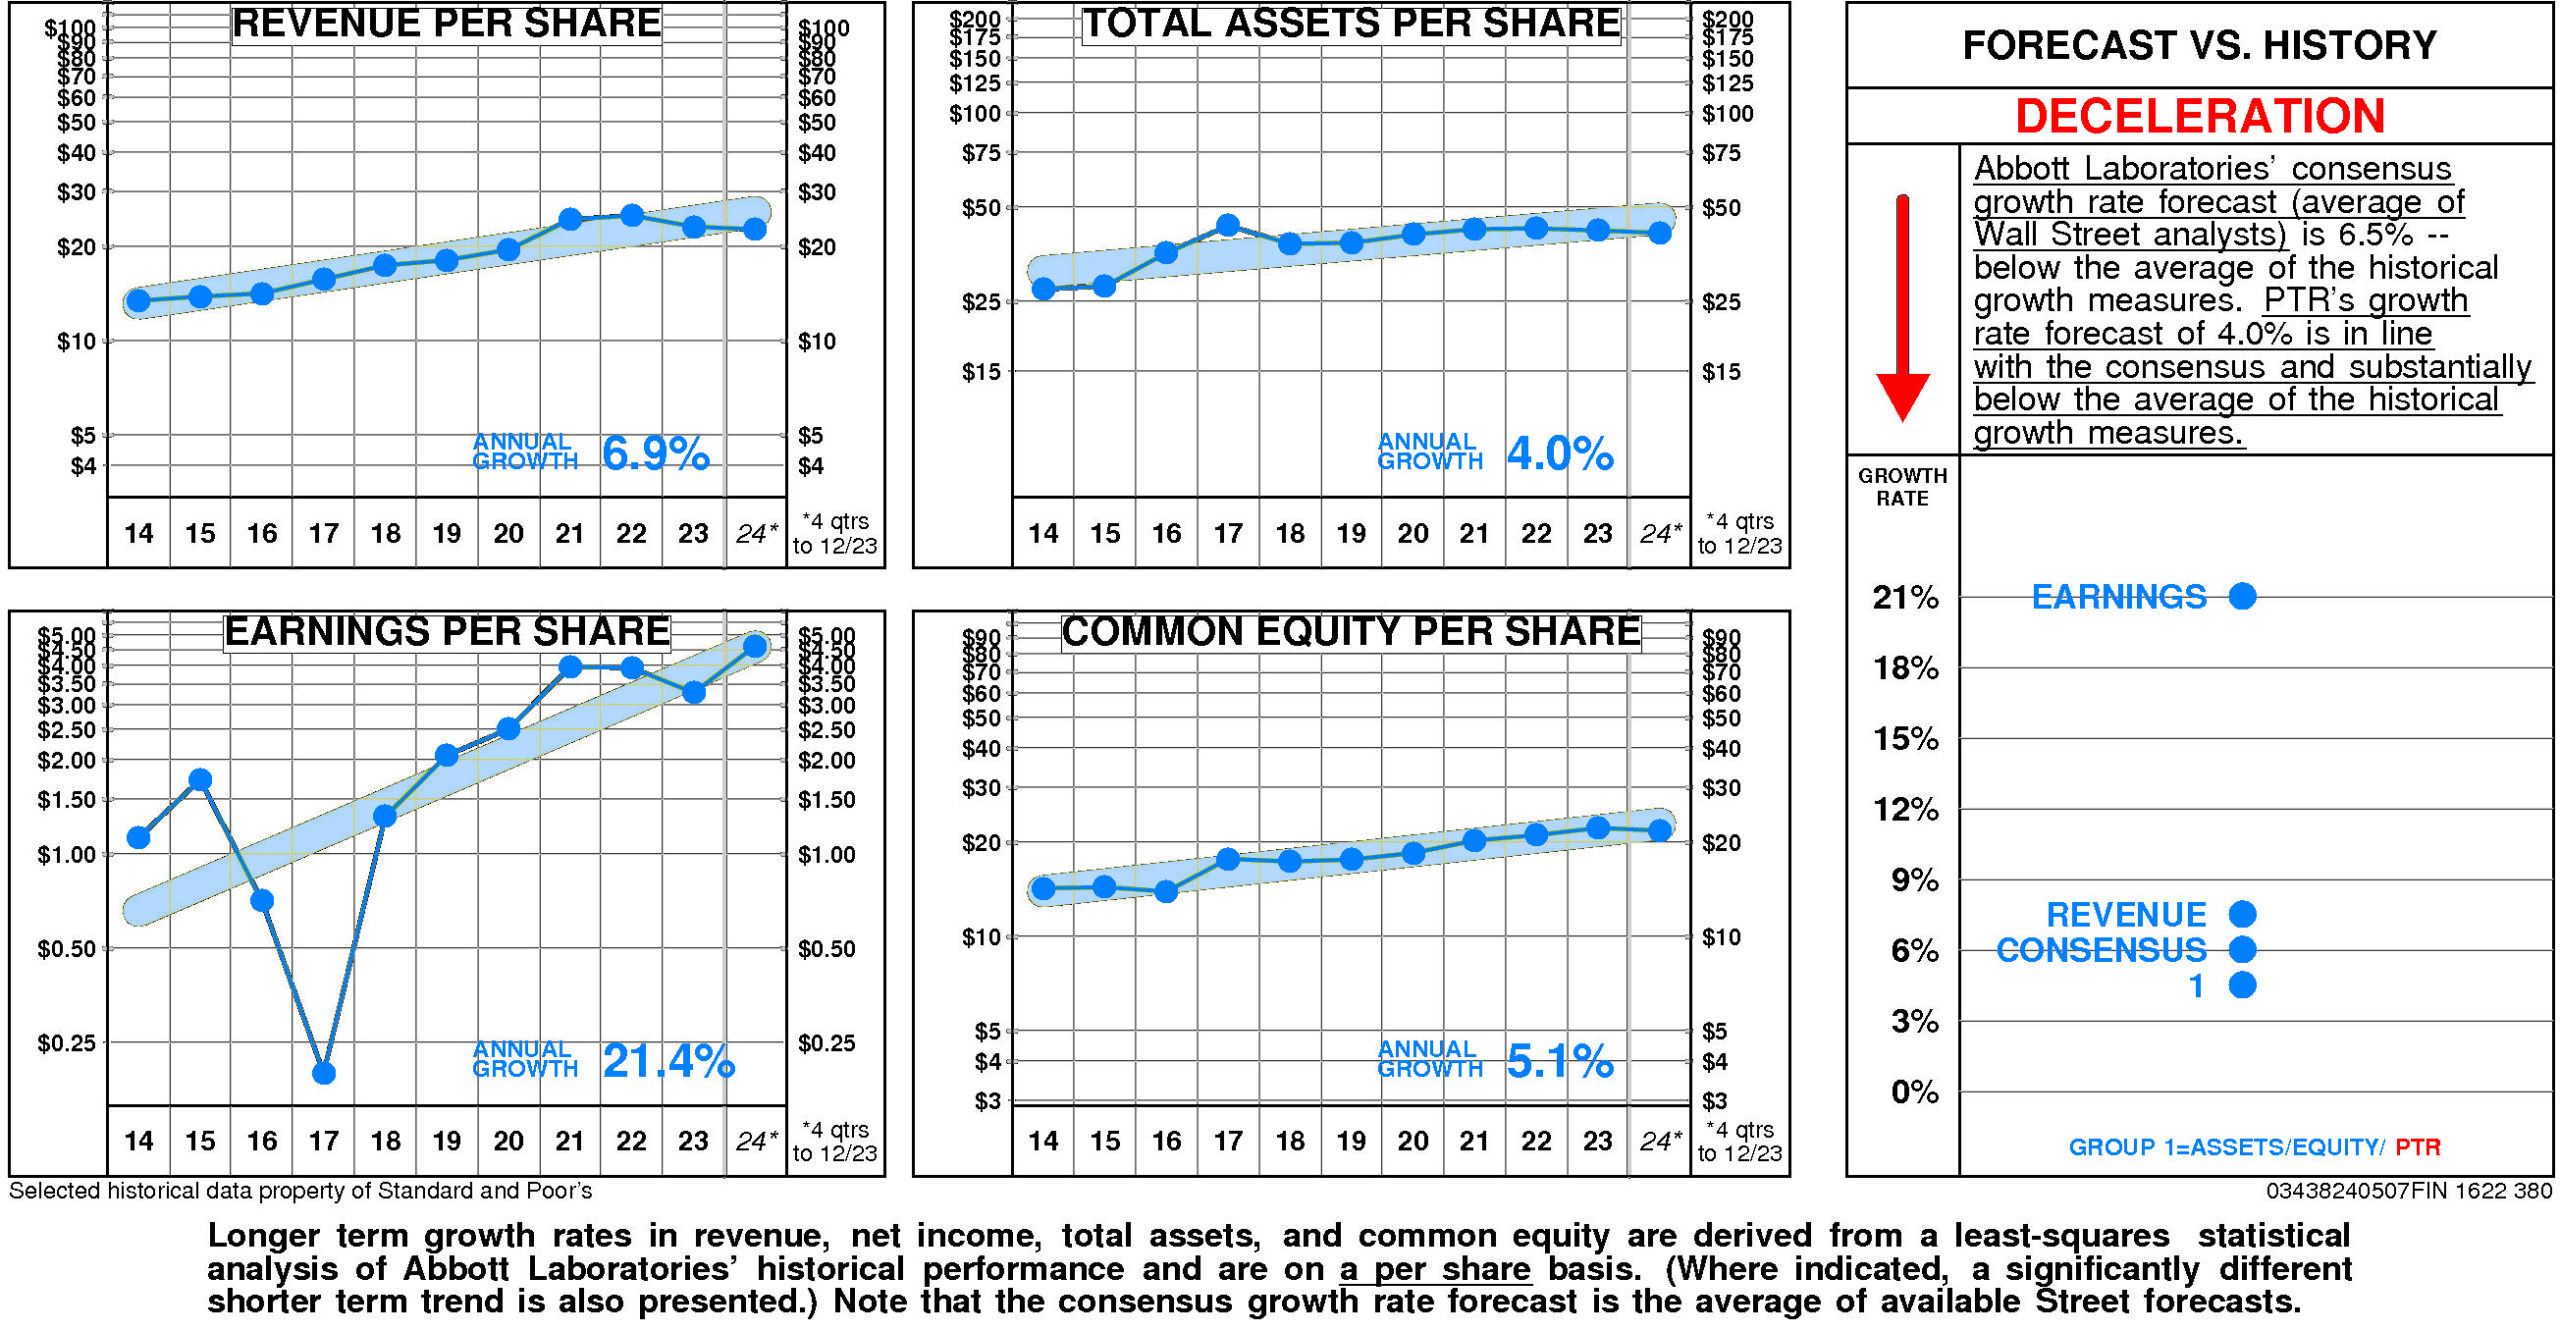
Annual revenue growth has been 6.9% per year.
Total asset growth has been 4.0% per year.
Annual E.P.S. growth has been 21.4% per year.
Equity growth has been 5.1% per year.
Abbott Laboratories’ consensus growth rate forecast (average of Wall Street analysts) is 6.5% — below the average of the historical growth measures.
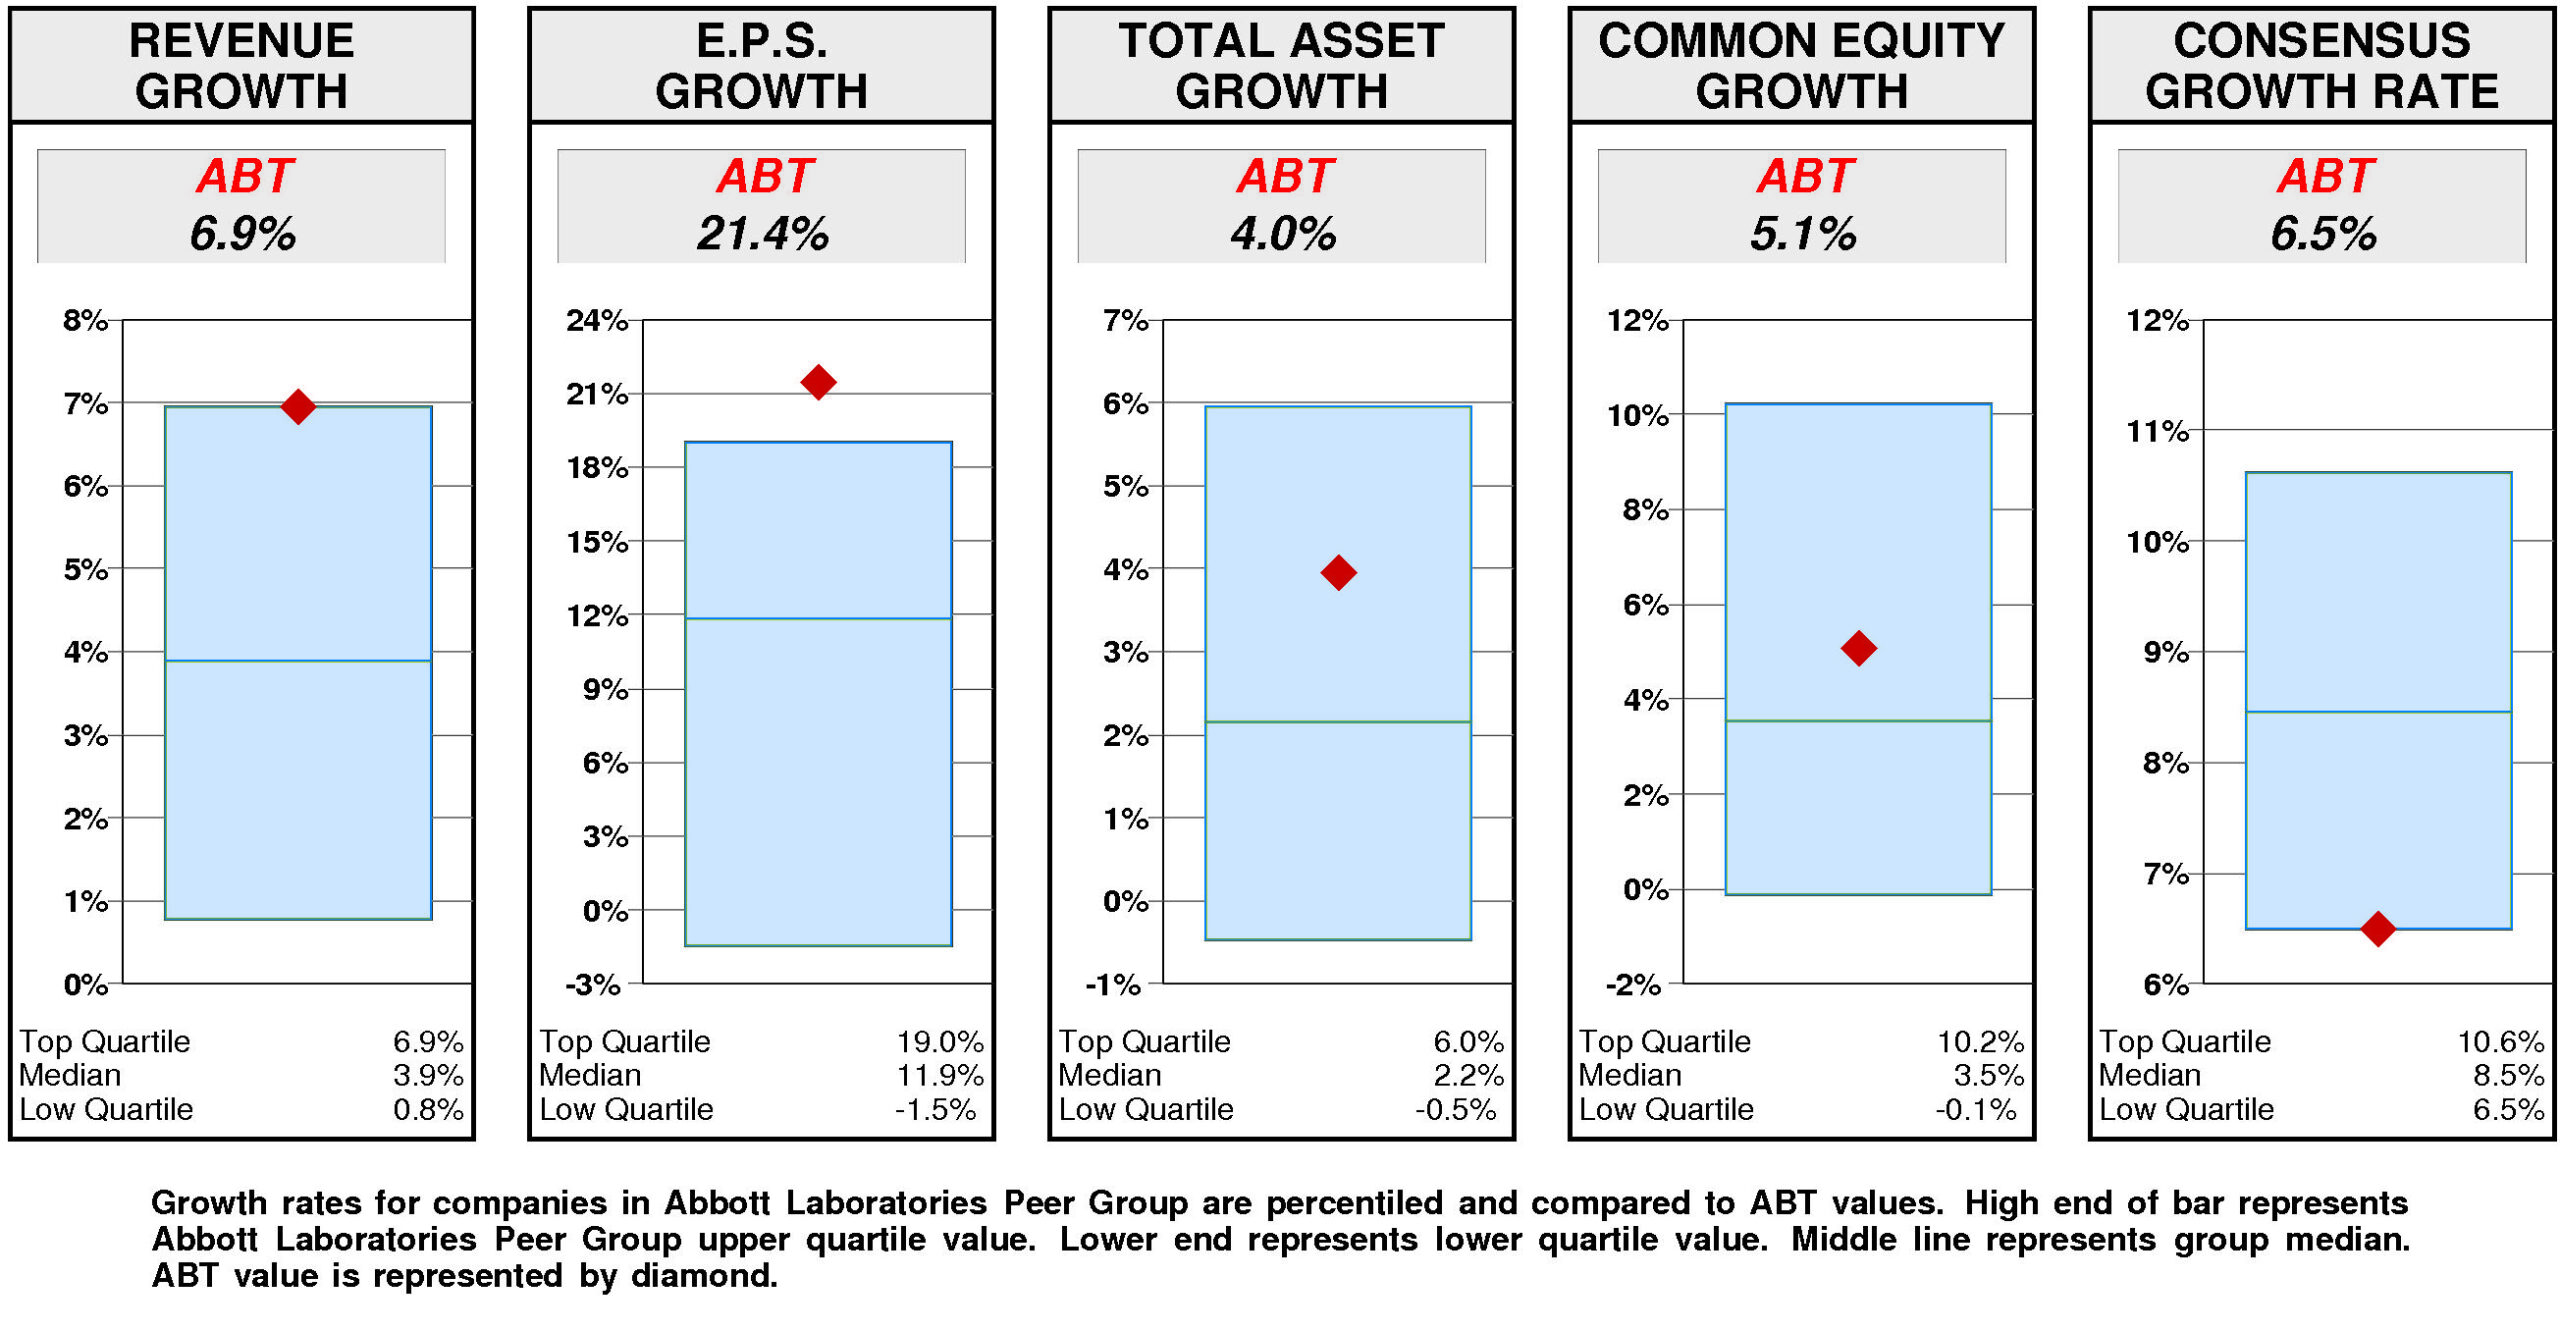
Relative to the Abbott Laboratories Peer Group, Abbott Laboratories’ historical growth measures are erratic. E.P.S. growth (21.4%) has been upper quartile. Revenue growth (6.9%) has been at the upper quartile. Equity growth (5.1%) has been slightly above median. Total asset growth (4.0%) has been above median.
Consensus growth forecast (6.5%) is at the lower quartile.
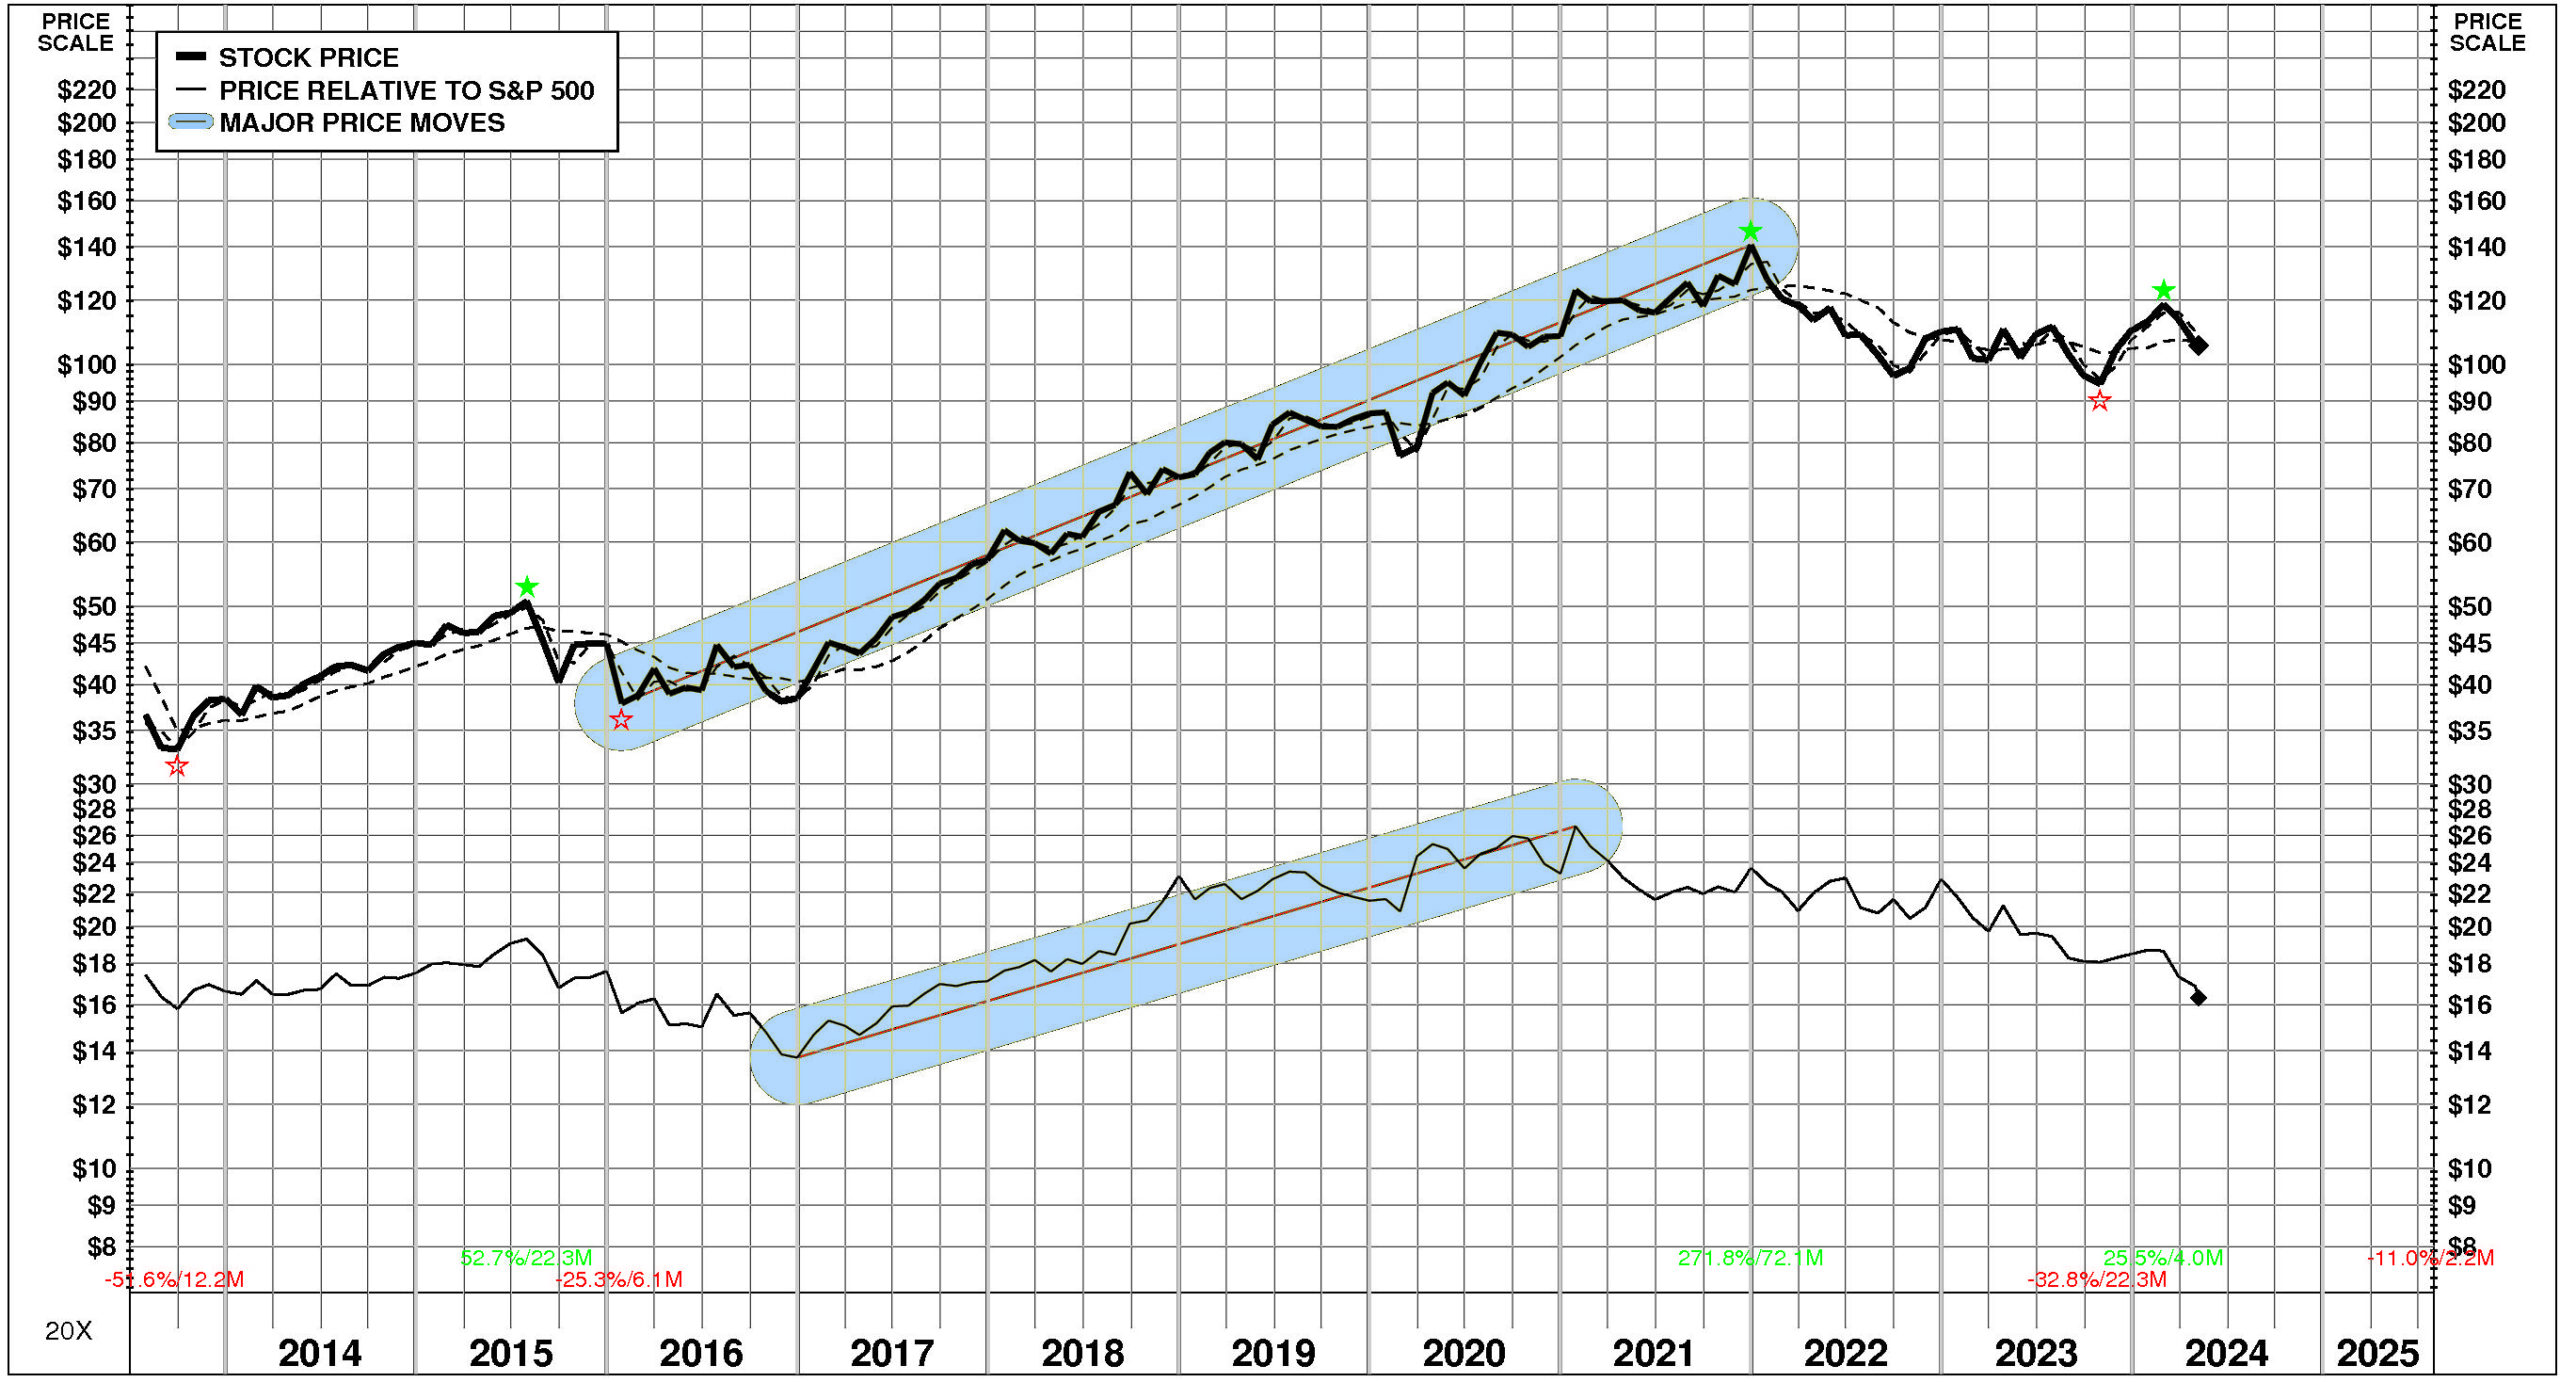
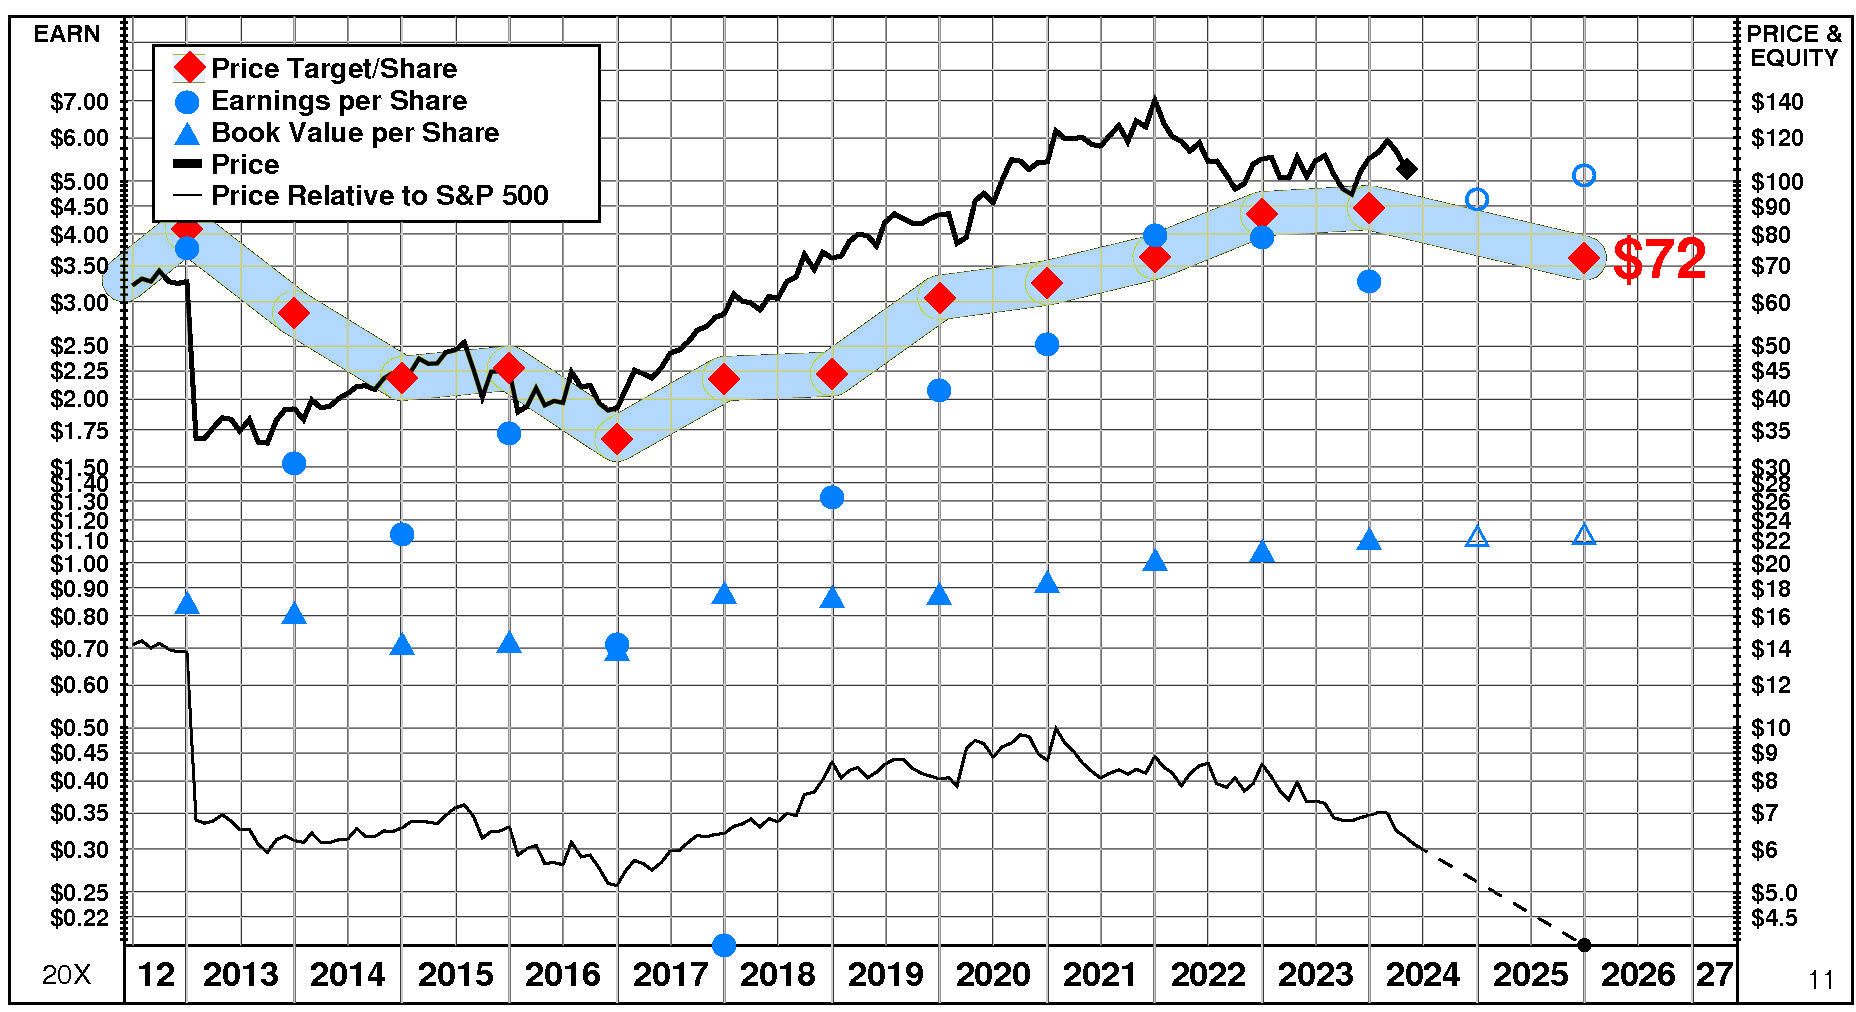
PRICE HISTORY
Over the full time period, Abbott Laboratories’ stock price performance has been in line with the market. Between July, 2013 and May, 2024, Abbott Laboratories’ stock price rose +188%; relative to the market, this was a -6% loss. Significant price move during the period: 1) January, 2016 – December, 2021: +272%.
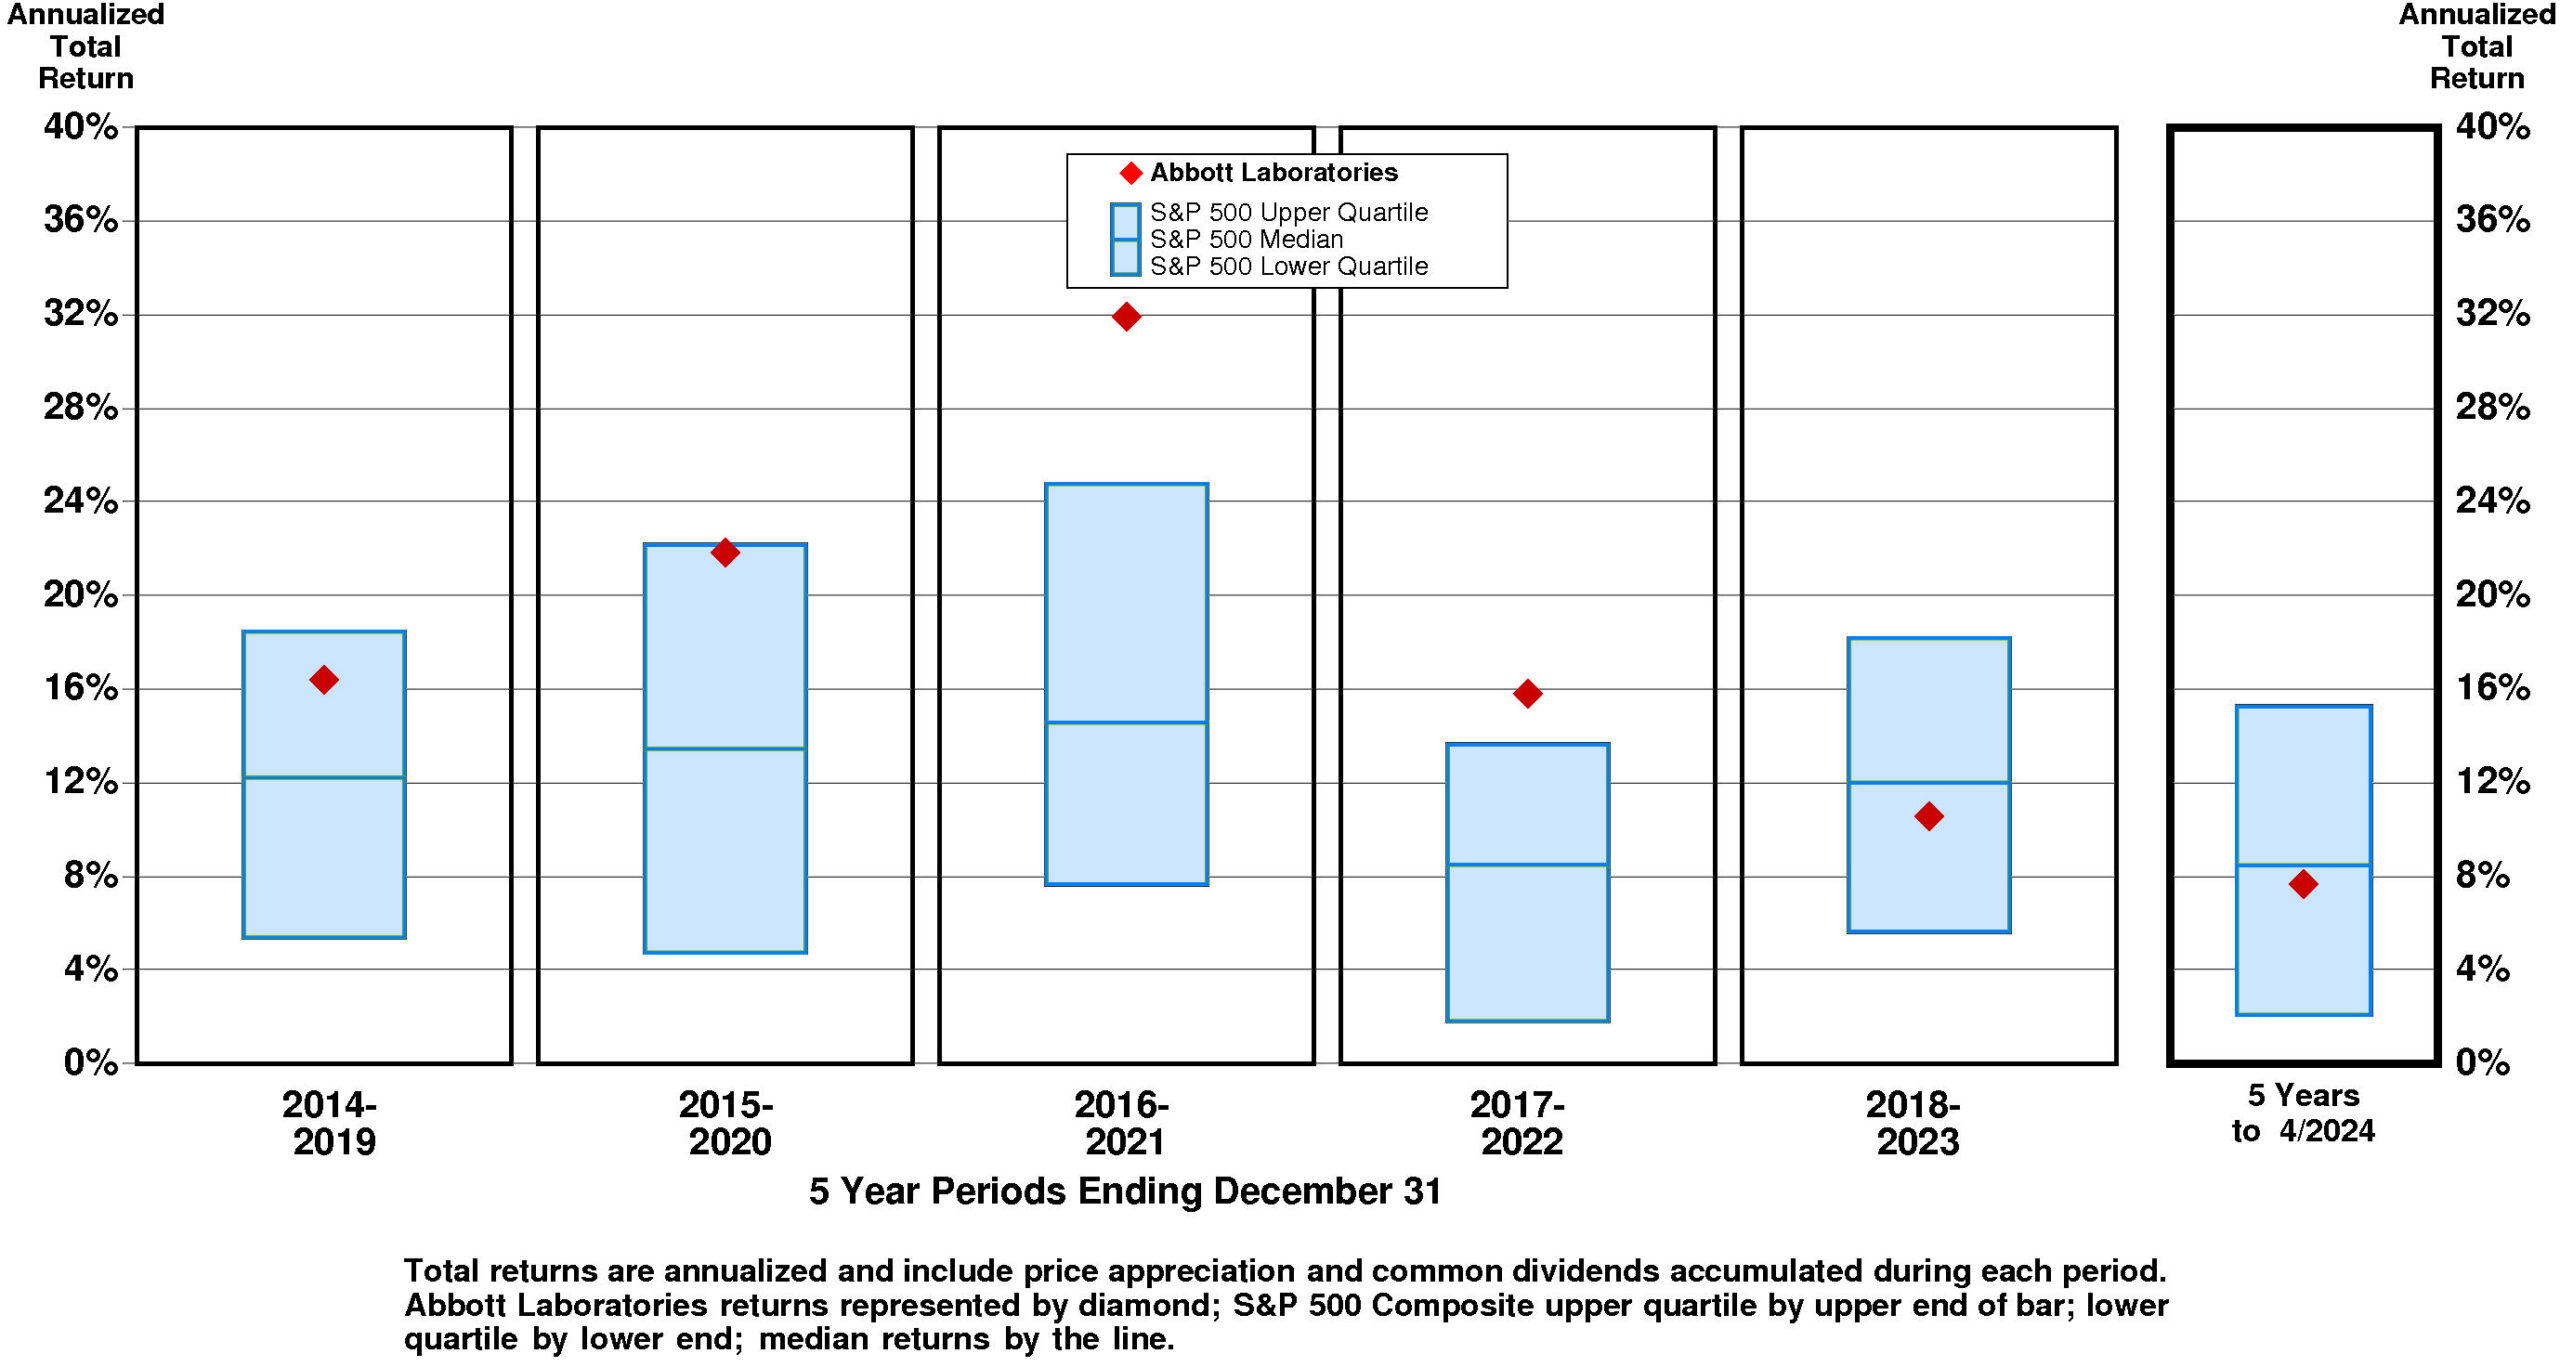
TOTAL INVESTMENT RETURNS
Current annual total return performance of -2.1% is substantially below median relative to the S&P 500 Composite.
In addition to being substantially below median relative to S&P 500 Composite, current annual total return performance through April, 2024 of -2.1% is below median relative to Abbott Laboratories Peer Group.
Current 5-year total return performance of 7.7% is slightly below median relative to the S&P 500 Composite.
Through April, 2024, with slightly below median current 5-year total return of 7.7% relative to S&P 500 Composite, Abbott Laboratories’ total return performance is below median relative to Abbott Laboratories Peer Group.
VALUATION BENCHMARKS
Relative to S&P 500 Composite, ABT’s overall valuation is high. The highest factor, the ratio of enterprise value/assets, is near the upper quartile. Price/equity ratio is above median. Ratio of enterprise value/revenue is above median. Price/earnings ratio is near the upper quartile. The lowest factor, the ratio of enterprise value/earnings before interest and taxes, is at the upper quartile.
Relative to Abbott Laboratories Peer Group, ABT’s overall valuation is quite high. The highest factor, the ratio of enterprise value/assets, is upper quartile. Price/equity ratio is upper quartile. Ratio of enterprise value/revenue is at the upper quartile. Price/earnings ratio is above median. The lowest factor, the ratio of enterprise value/earnings before interest and taxes, is at the upper quartile.
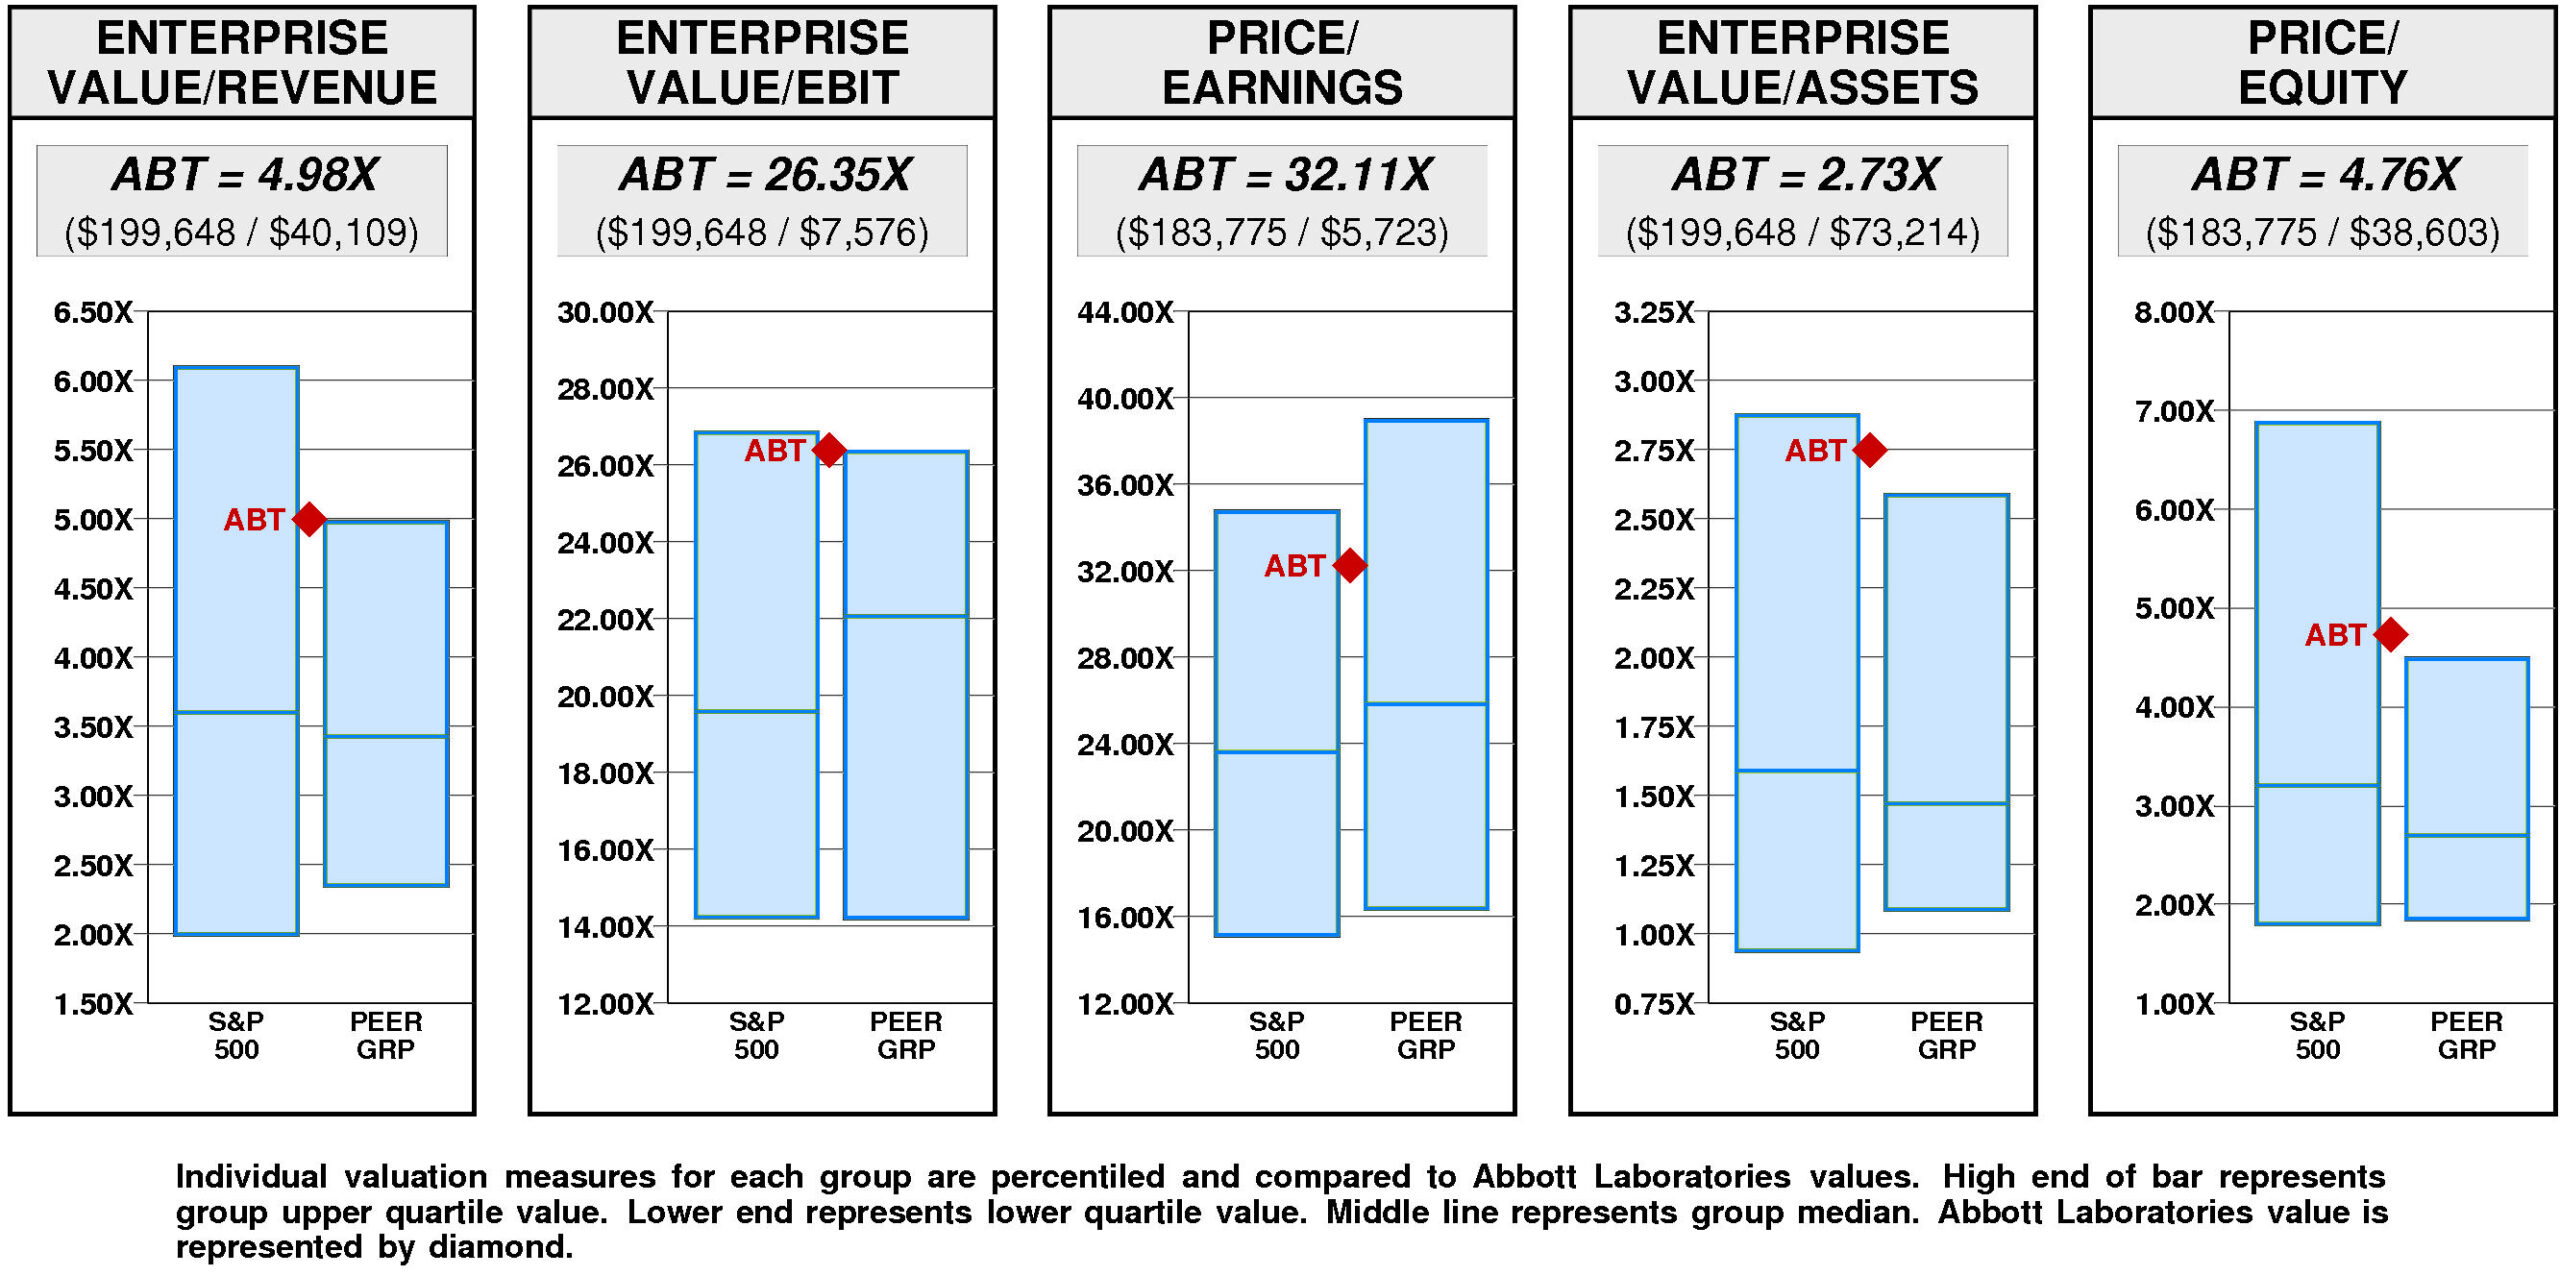
Abbott Laboratories has a major value gap compared to the median valuation. For ABT to achieve median valuation, its current ratio of enterprise value/revenue would have to fall from the current level of 4.98X to 3.43X. If ABT’s ratio of enterprise value/revenue were to fall to 3.43X, its stock price would be lower by $-36 to $70.
For ABT to fall to lower quartile valuation relative to the Abbott Laboratories Peer Group, its current ratio of enterprise value/revenue would have to fall from the current level of 4.98X to 2.35X. If ABT’s ratio of enterprise value/revenue were to fall to 2.35X, its stock price would decline by $-61 from the current level of $106.
VALUE TARGETS
ABT is expected to continue to be a major Value Builder reflecting capital returns that are forecasted to exceed the cost of capital.
Abbott Laboratories’ current Price Target of $72 represents a -32% change from the current price of $105.97.
Abbott Laboratories’ low appreciation potential results in an appreciation score of 20 (80% of the universe has greater appreciation potential.)
Notwithstanding this low Appreciation Score of 20, the moderately high Power Rating of 62 results in an Value Trend Rating of D.
Abbott Laboratories’ current Price Target is $72 (-19% from the 2023 Target of $89 and -32% from the 04/30/24 price of $105.97). This fall in the Target is the result of a +4% increase in the equity base and a -22% decrease in the price/equity multiple. The forecasted decline in growth has a very large negative impact on the price/equity multiple and the forecasted increase in cost of equity has a very large negative impact as well. Partially offsetting these Drivers, the forecasted increase in return on equity has a very large positive impact.
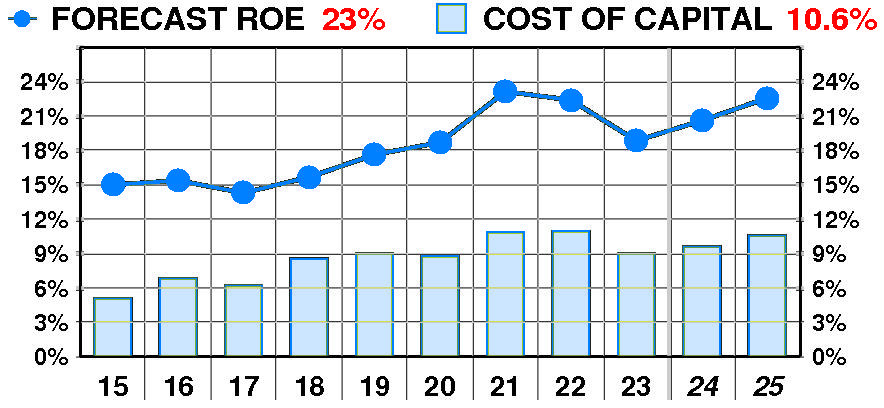
PTR’s return on equity forecast is 22.6% — slightly above our recent forecasts. Forecasted return on equity enjoyed a dramatic, variable increase between 2015 and 2023. The current forecast is well above the 2017 low of 14%.
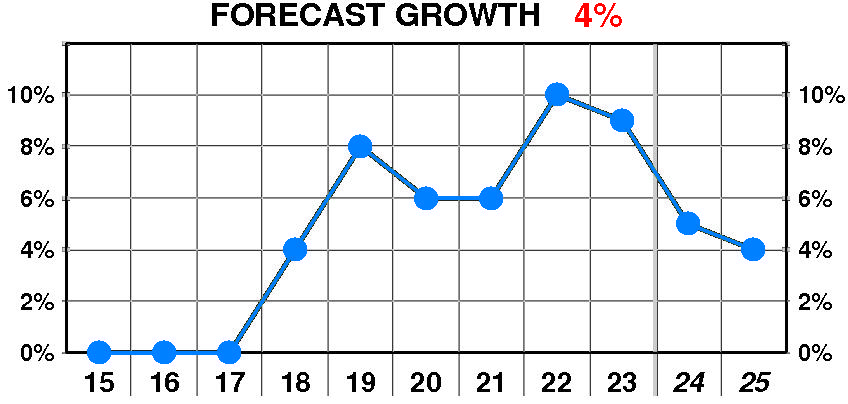
PTR’s growth forecast is 4.0% — below our recent forecasts. Forecasted growth enjoyed a dramatic, erratic increase between 2018 and 2023. The current forecast is below the 2019 peak of 8%.
PTR’s cost of equity forecast is 10.6% — in line with recent levels. Forecasted cost of equity suffered a dramatic, variable increase between 2015 and 2023. The current forecast is well above the 2015 low of 5.1%.
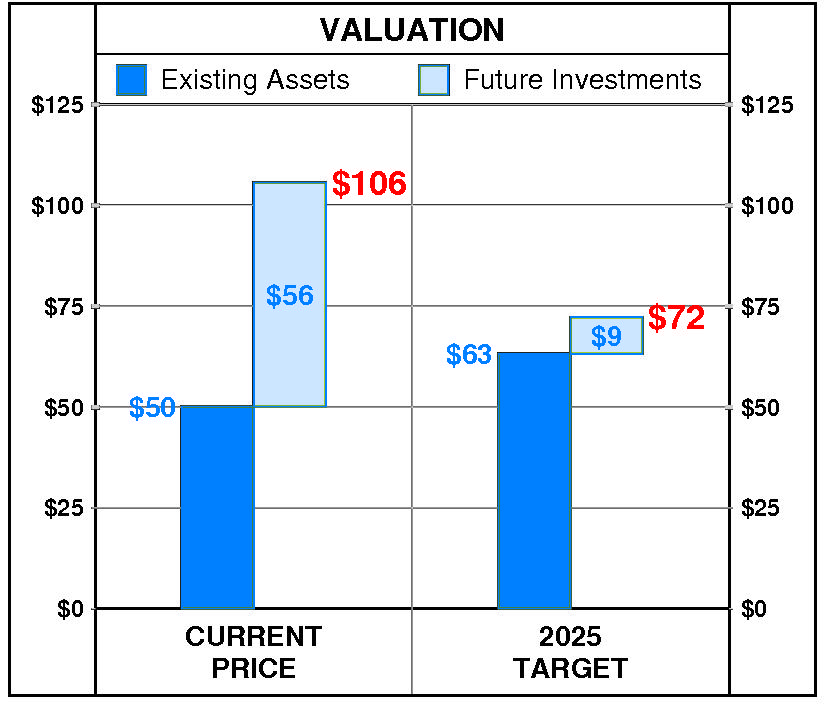
At Abbott Laboratories’ current price of $105.97, investors are placing a positive value of $56 on its future investments. This view is consistent with the company’s most recent performance that reflected a growth rate of 9.0% per year, and a return on equity of 18.9% versus a cost of equity of 9.0%.
PTR’s 2025 Price Target of $72 is based on these forecasts and reflects an estimated value of existing assets of $63 and a value of future investments of $9.
Be the first to comment