BUSINESS
Popular, Inc., through its subsidiaries, provides various retail, mortgage, and commercial banking products and services in Puerto Rico, the United States, and British Virgin Islands. The company provides savings, NOW, money market, and other interest-bearing demand accounts; non-interest bearing demand deposits; and certificates of deposit. It also offers commercial and industrial, commercial multi-family, commercial real estate, and residential mortgage loans; consumer loans, including personal loans, credit cards, automobile loans, home equity lines of credit, and other loans to individual borrowers; construction loans; and lease financing comprising automobile loans/leases. In addition, the company provides investment banking, auto and equipment leasing and financing, broker-dealer, and insurance services; debit cards; and online banking services.
INVESTMENT RATING
BPOP is expected to continue to be a Value Builder reflecting capital returns that are forecasted to be above the cost of capital.
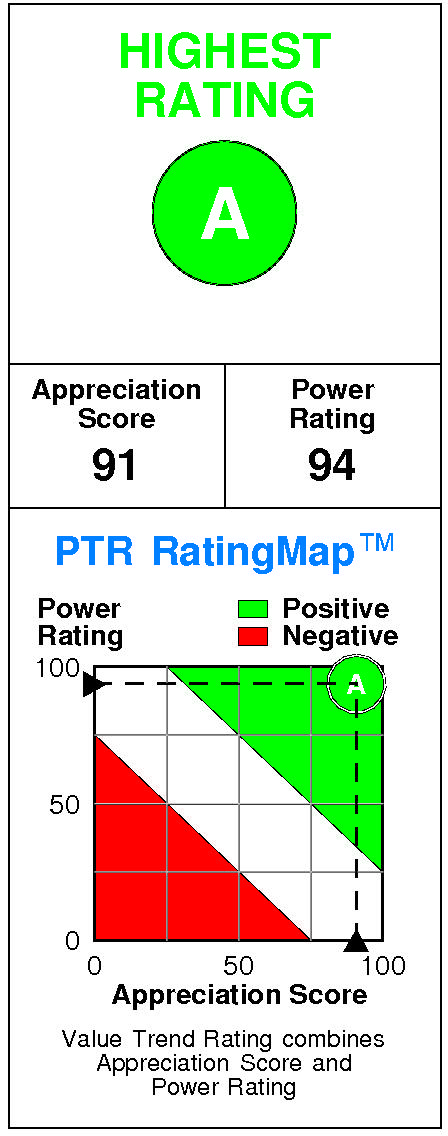
Popular has a current Value Trend Rating of A (Highest Rating).
This rating combines highly consistent signals from two proprietary PTR measures of a stock's attractiveness. Popular has a very high Appreciation Score of 91 and a very high Power Rating of 94, resulting in the Highest Value Trend Rating.
Popular's stock is selling well below targeted value.
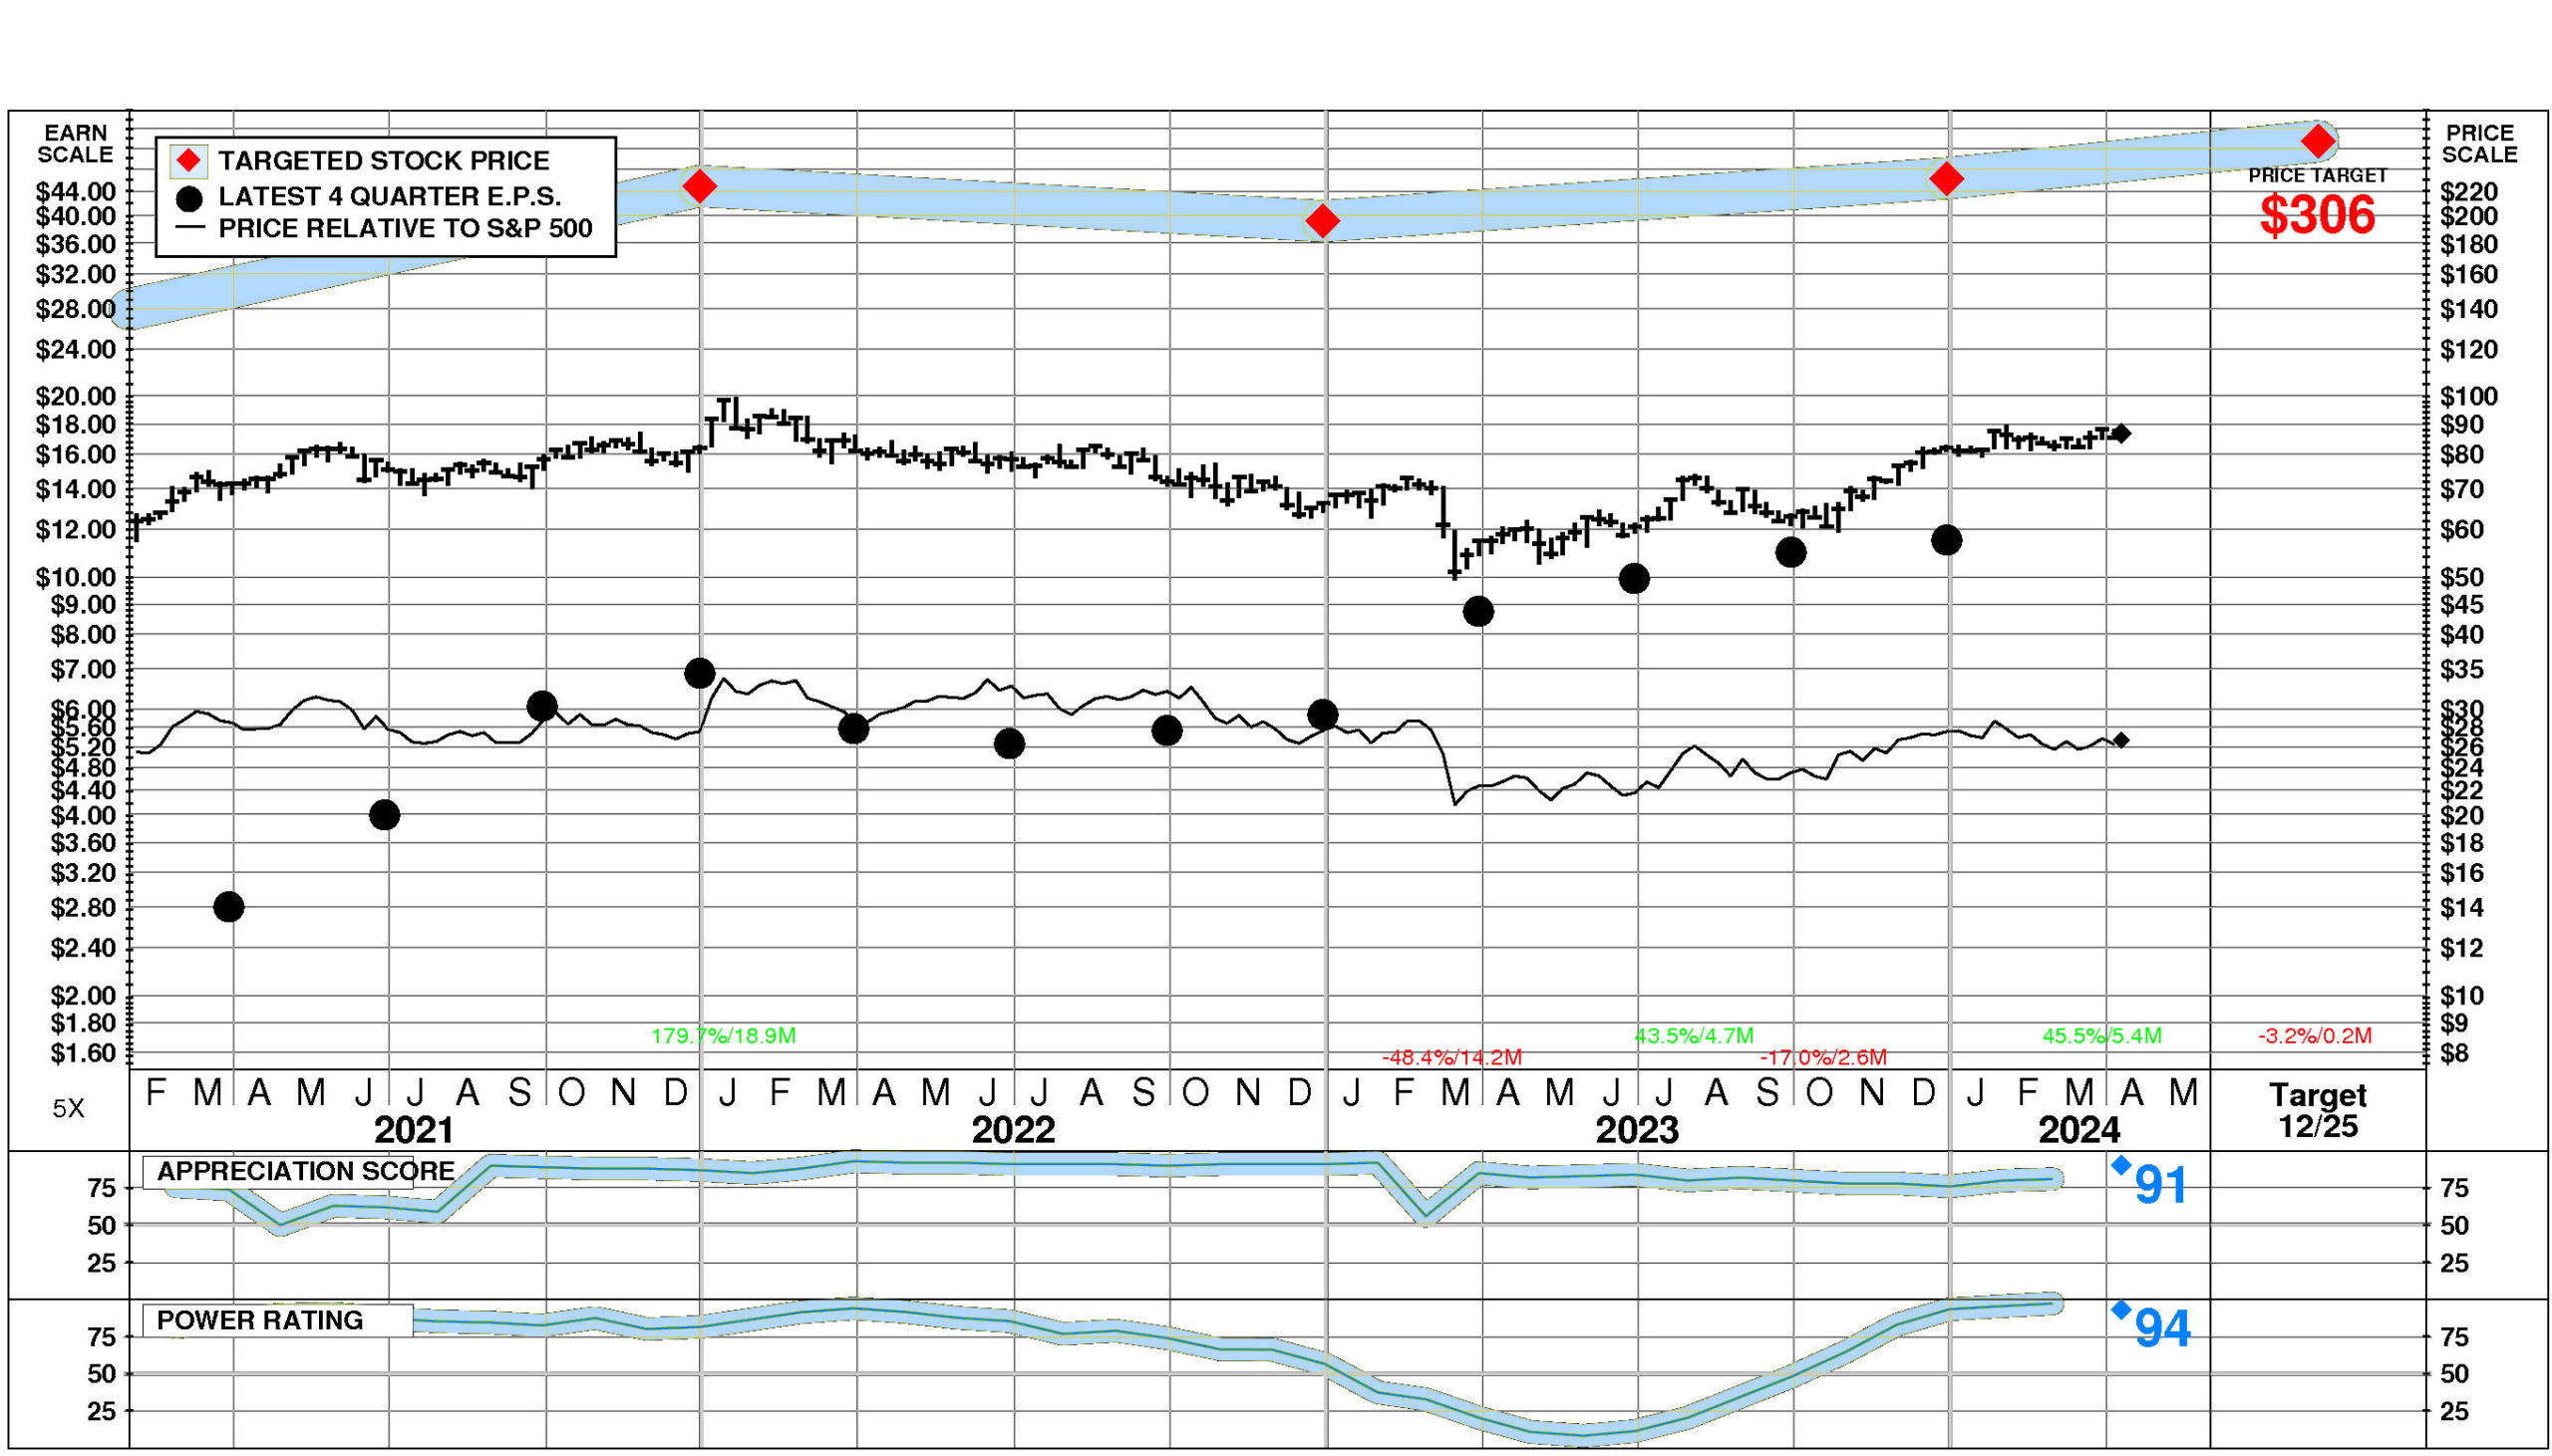
The current stock price of $86.86 compares to targeted value 12 months forward of $267.
Popular's very high appreciation potential results in an appreciation score of 91 (only 9% of the universe has greater appreciation potential.)
Popular has a Power Rating of 94.
(This very high Power Rating indicates that BPOP has a better chance of achieving attractive investment performance over the near to intermediate term than all but 6% of companies in the universe.)
Factors contributing to this very high Power Rating include: recent price action has been extremely favorable; the recent trend in BPOP's earnings estimates has been favorable; and the Commercial Banks comparison group is in a strong phase currently.
INVESTMENT PROFILE
Popular's financial strength is high. Financial strength rating is 73.
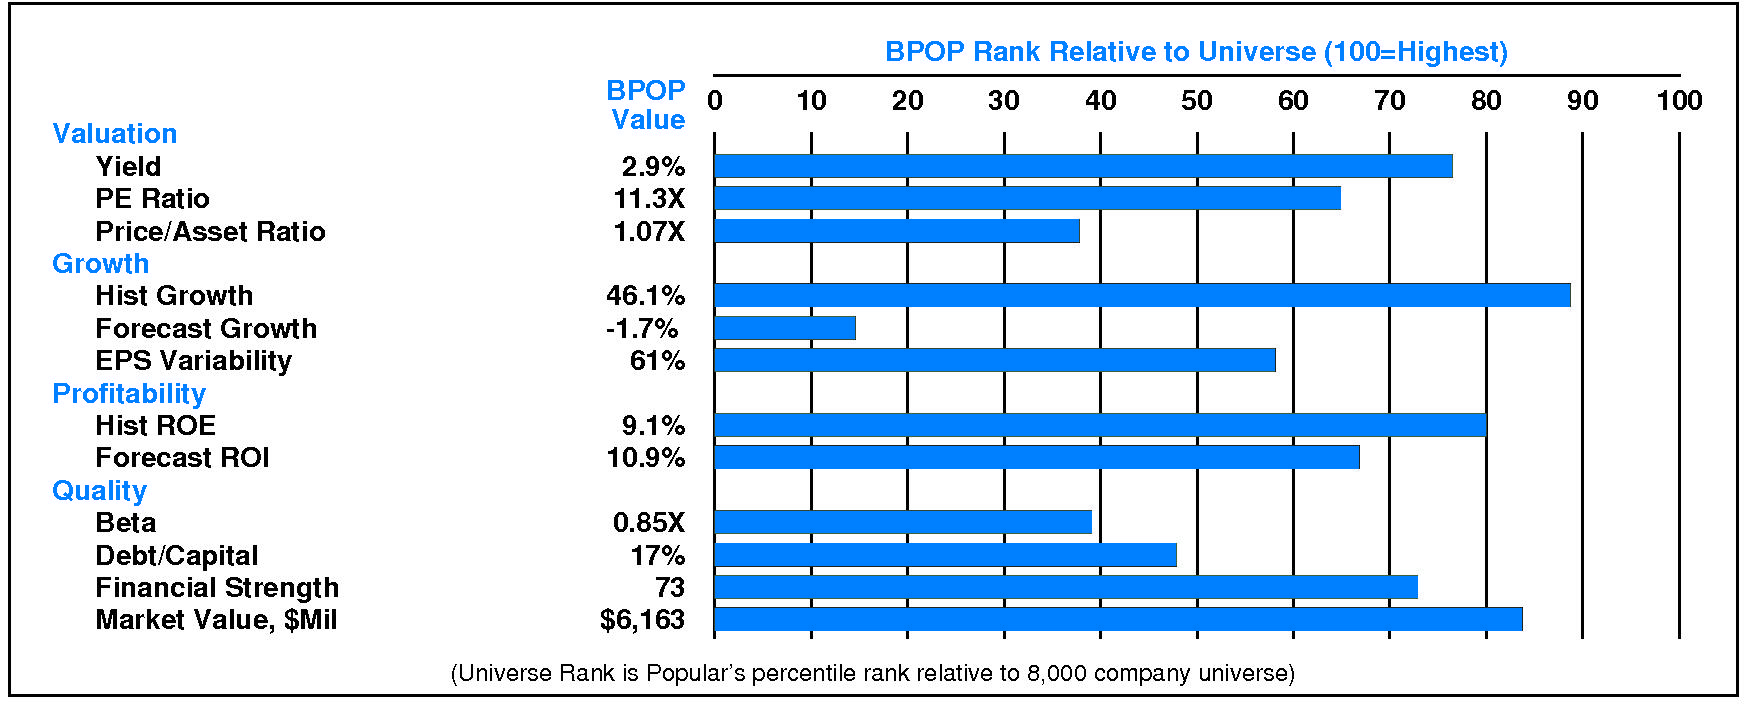
Relative to the S&P 500 Composite, Popular Inc has moderate Value characteristics; its appeal is likely to be to investors heavily oriented toward Income; the perception is that BPOP is normal risk.
Relative weaknesses include: low forecasted profitability, and low expected growth. Popular's valuation is low: high dividend yield, low P/E ratio, and low price/book ratio. BPOP has unusually low market capitalization.
CURRENT SIGNALS
Popular's current operations are eroding.
Return on equity is falling, reflecting: declining pretax margin; and falling leverage.
Popular's current technical position is very strong.
The stock price is in a 5.4 month up move. The stock has appreciated 45.5% from its prior low. The stock price is above its 200 day moving average which is in an uptrend. The stock has just risen above its 200 day moving average.
ALERTS
. Positive development: the stock's recent price rise disrupted its longer term downtrend. Negative development: its shorter term price trend turned down.
Recent minimal positive changes in fundamentals have benefitted Popular Inc (NASDAQ: BPOP): significant quarterly sales acceleration occurred.
The stock is currently rated A.
Popular Inc (NASDAQ: BPOP) stock closed at $86.86 on 4/9/24 after an increase of 1.1%. This advance was accompanied by normal trading volume. The stock has declined -0.6% during the last week but has been exceptionally strong relative to the market over the last nine months.
CASH FLOW
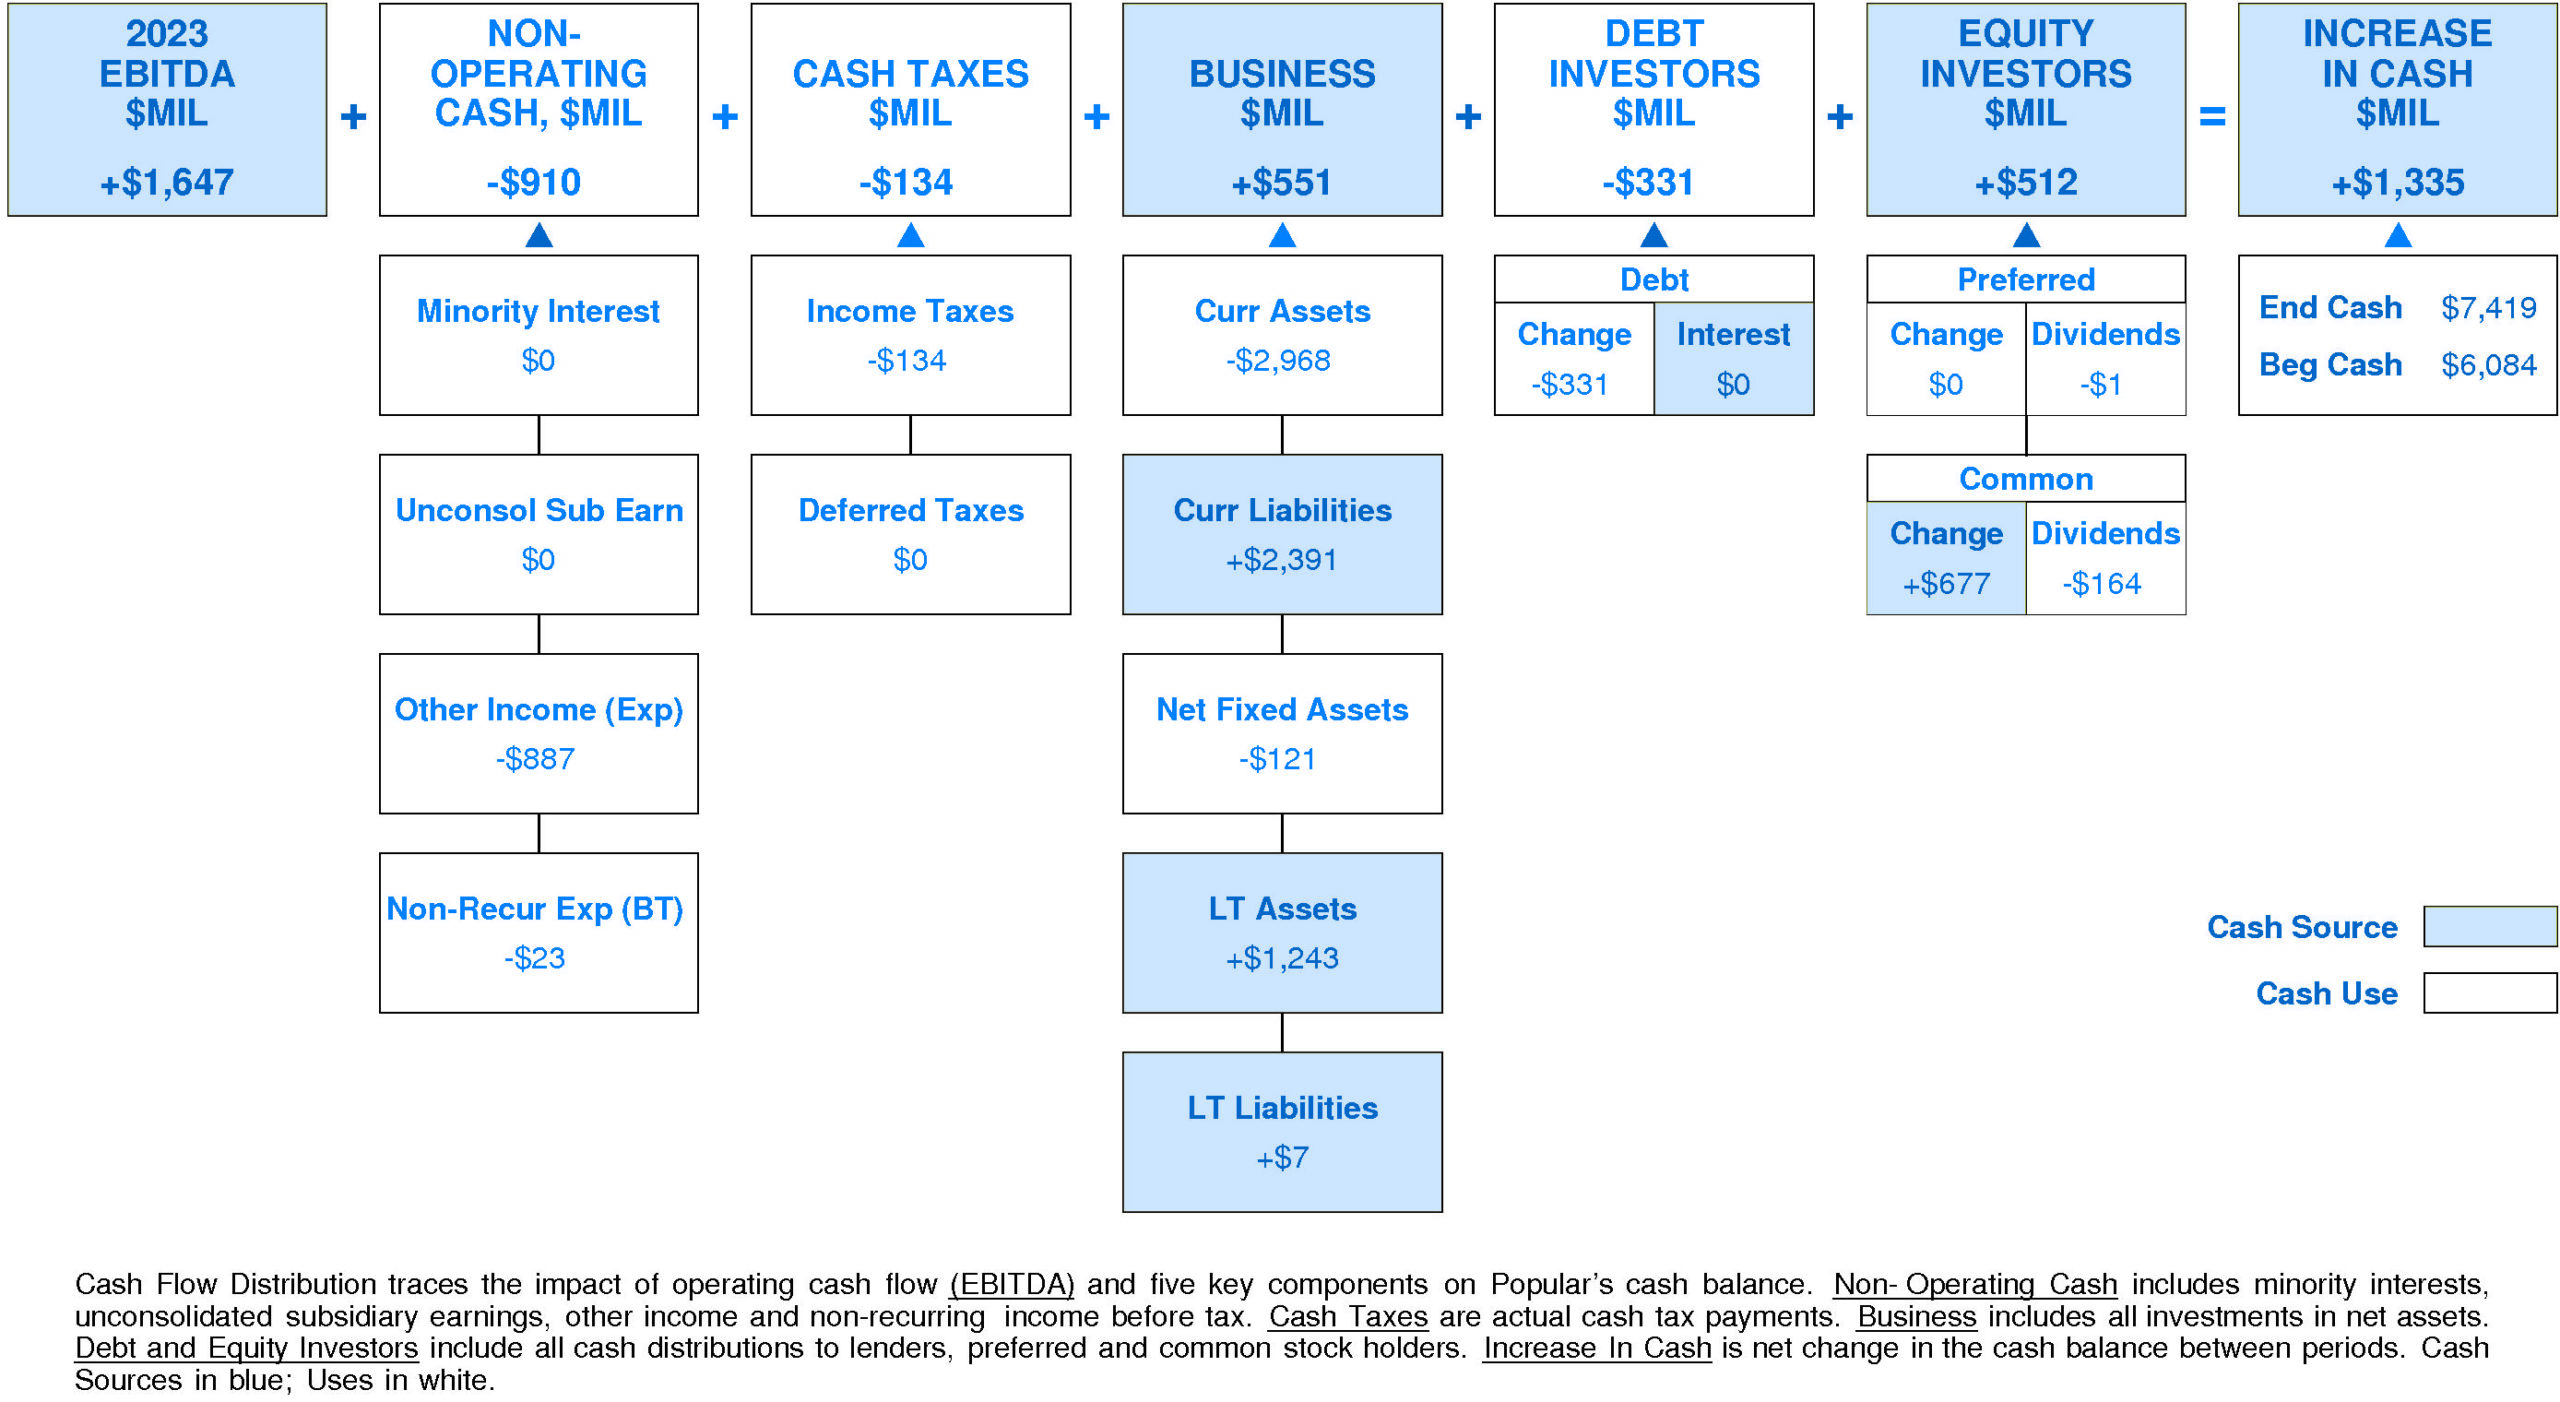
In 2023, Popular generated a significant increase in cash of +$1,335 million (+22%). Sources of cash were larger than uses.
Cash generated from 2023 EBITDA totaled +$1,647 million. Non-operating uses consumed -$910 million (-55% of EBITDA). Cash taxes consumed -$134 million (-8% of EBITDA). Withdrawal of investment from the business totaled +$551 million (+33% of EBITDA). On a net basis, debt investors received -$331 million (-20% of EBITDA) while equity investors supplied +$512 million (+31% of EBITDA).
Popular's Non-operating Income, %EBITDA has enjoyed a very strong overall uptrend over the period.
This improvement was accompanied by a similar trend for the Popular Peer Group. In most years, Popular was in the third quartile and lower quartile. Currently, Popular is lower quartile at -55% of EBITDA (-$910 million).
Popular's Cash Taxes, %EBITDA has experienced a downtrend over the period.
This downtrend was accompanied by stability for the Popular Peer Group. In most years, Popular was in the top quartile and second quartile. Currently, Popular is at the upper quartile at -8% of EBITDA (-$134 million).
Popular's Business Re-investment, %EBITDA has suffered a volatile overall downtrend over the period.
This downtrend was accompanied by a similar trend for the Popular Peer Group. In most years, Popular was in the top quartile and third quartile. Currently, Popular is upper quartile at +33% of EBITDA (+$551 million).
Popular's Debt Investors, %EBITDA has experienced a very strong overall uptrend over the period.
This improvement was accompanied by an opposite trend for the Popular Peer Group. In most years, Popular was in the lower quartile and third quartile. Currently, Popular is slightly above median at -20% of EBITDA (-$331 million).
Popular's Equity Investors, %EBITDA has suffered a volatile overall downtrend over the period.
This downtrend was accompanied by a similar trend for the Popular Peer Group. In most years, Popular was in the lower quartile and top quartile. Currently, Popular is at the upper quartile at +31% of EBITDA (+$512 million).
Popular's Change in Cash, %EBITDA has experienced a volatile overall downtrend over the period.
This downtrend was accompanied by an opposite trend for the Popular Peer Group. In most years, Popular was in the top quartile and lower quartile. Currently, Popular is at the upper quartile at +81% of EBITDA (+$1,335 million).
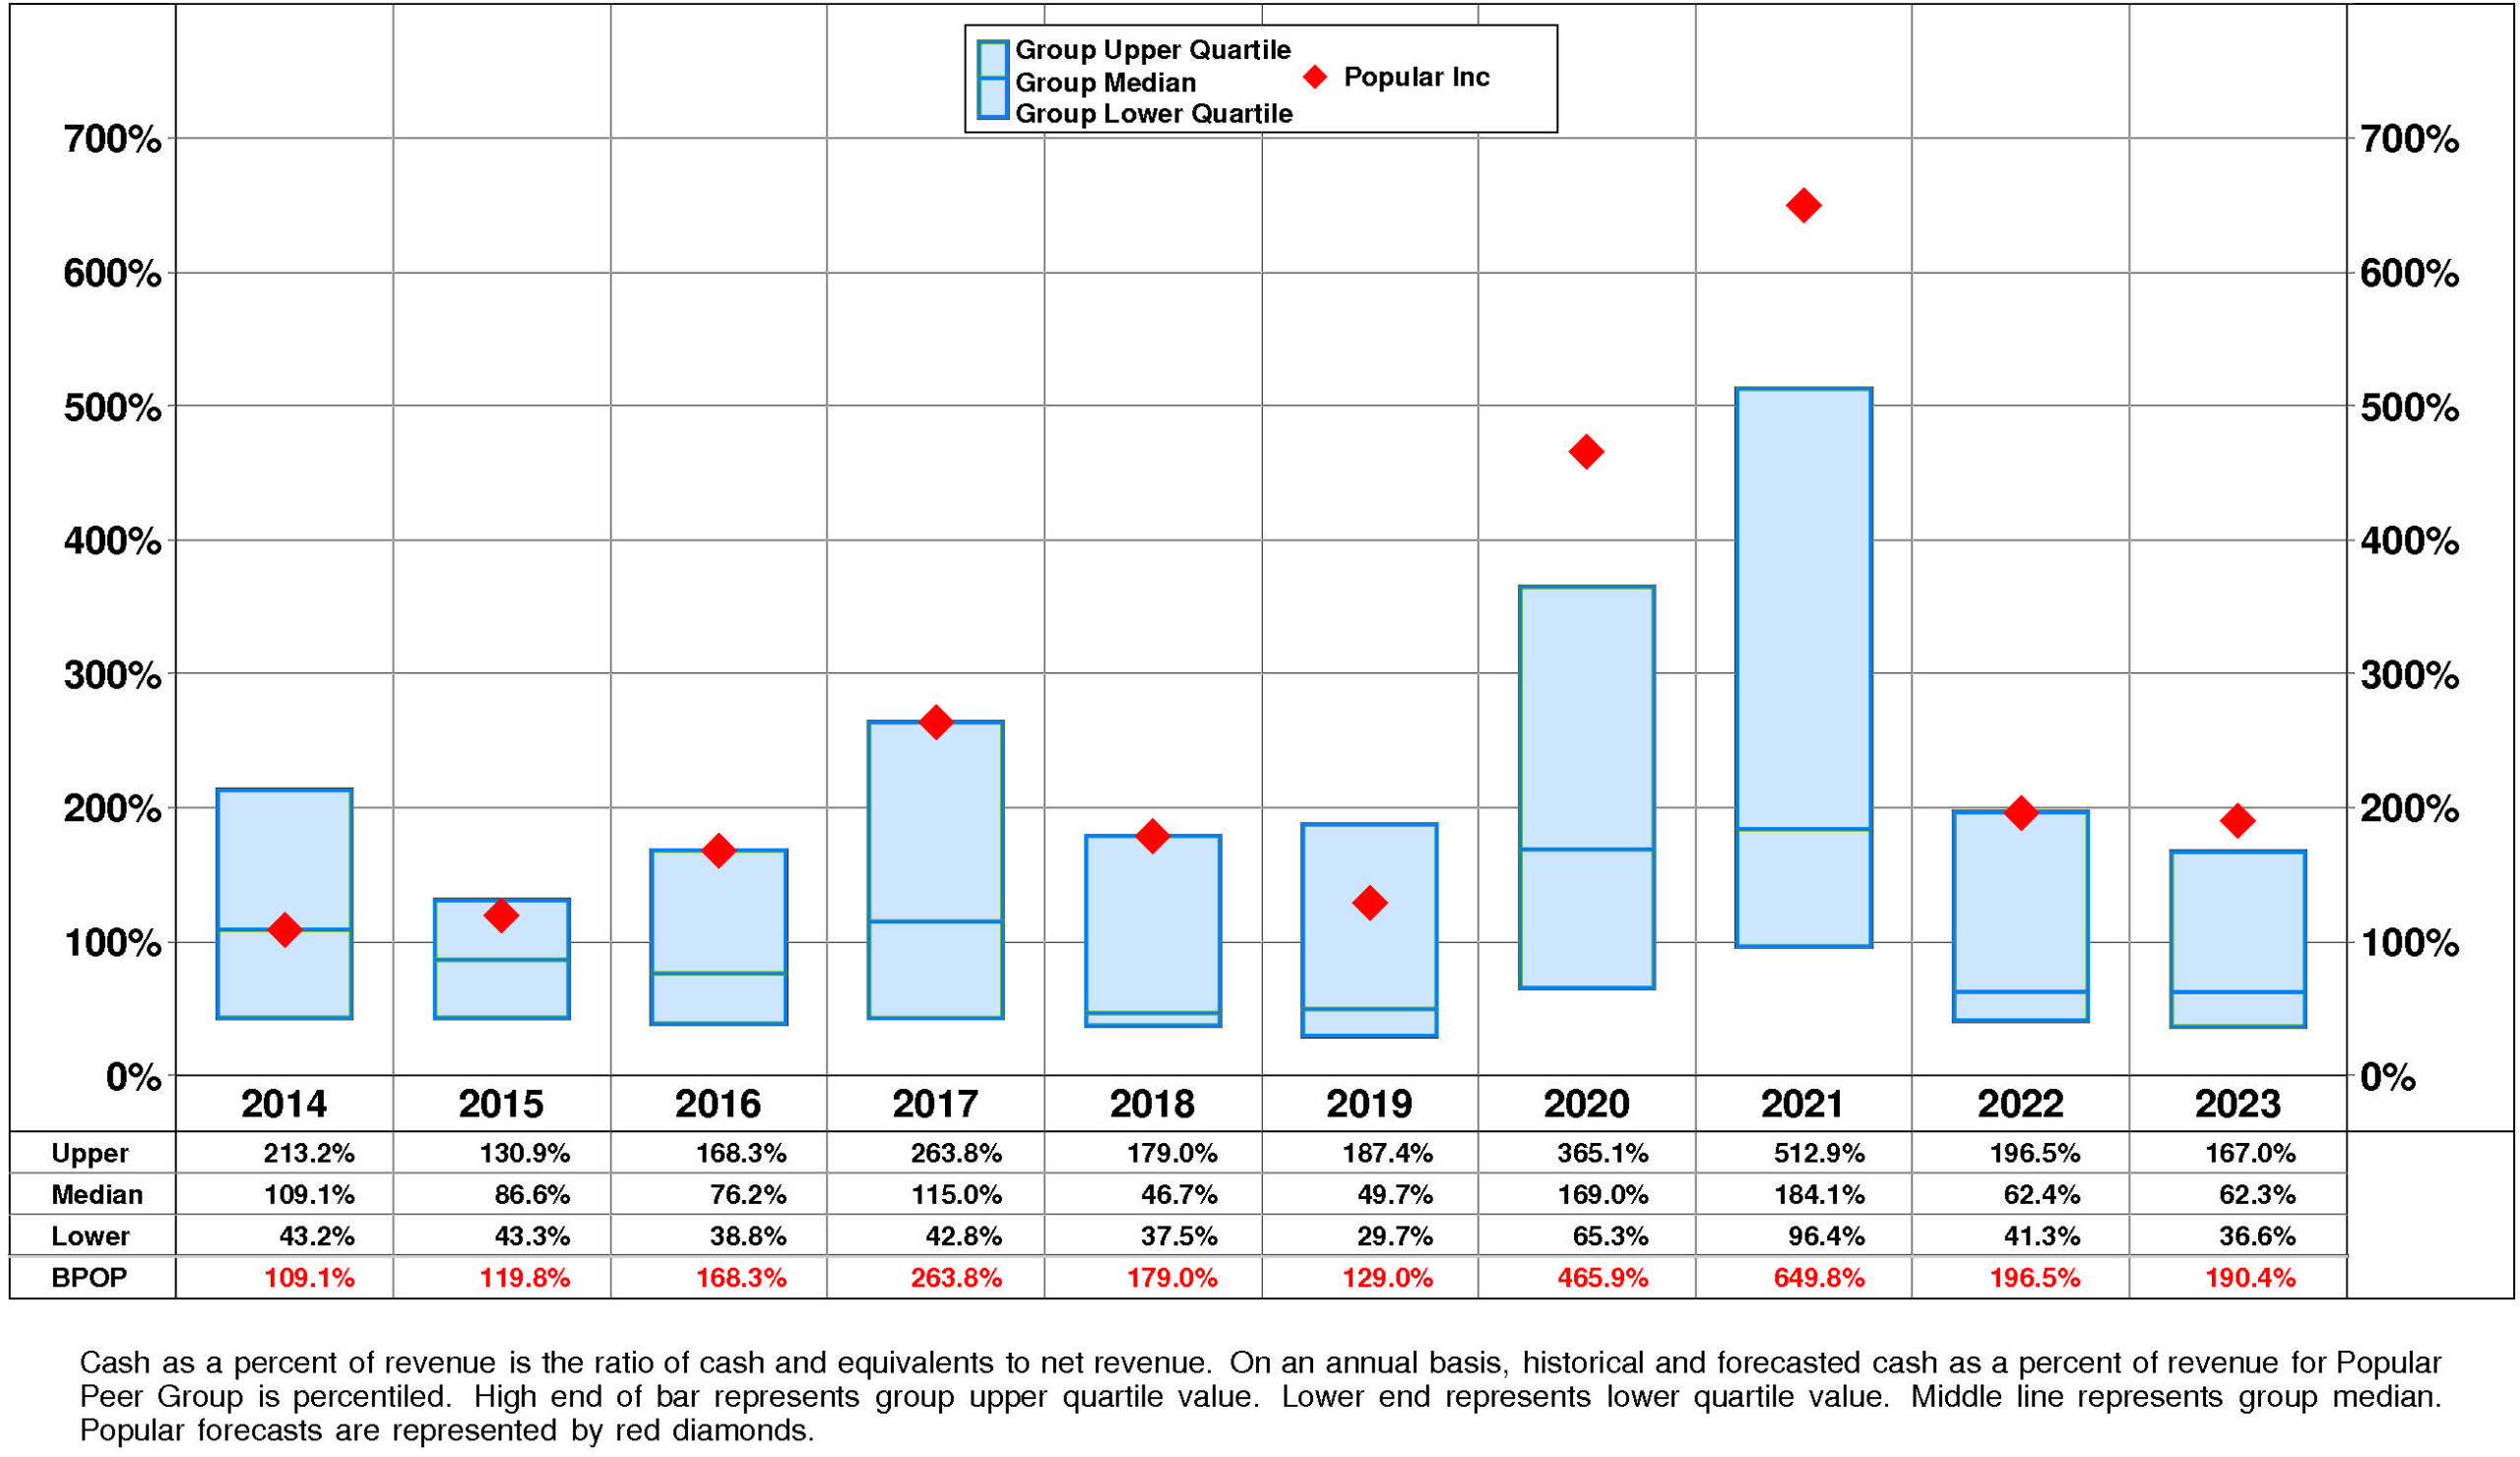
Popular's Cash, %Revenue has enjoyed a volatile overall uptrend over the period.
This improvement was accompanied by a similar trend for the Popular Peer Group. (Since 2021 Cash, %Revenue has experienced a very sharp decline.) In most years, Popular was in the top quartile. Currently, Popular is upper quartile at +190%.
PROFITABILITY
Popular's return on equity has improved very significantly since 2015. The current level of 10.6% is 2.52X the low for the period and is -40.3% from the high.
Popular's strong positive trend in pretax operating return significantly augmented by a very strong positive trend in non-operating factors is a significant analytical factor.
The productivity of Popular's assets declined over the full period 2014-2023: asset turnover has experienced a downtrend although it experienced a very sharp recovery after the 2021 low.
More than offsetting this trend, however, pretax margin enjoyed a volatile overall uptrend even as it experienced a very sharp decline after the 2021 high.
Non-operating factors (income taxes and financial leverage) had a very significant positive influence on return on equity.
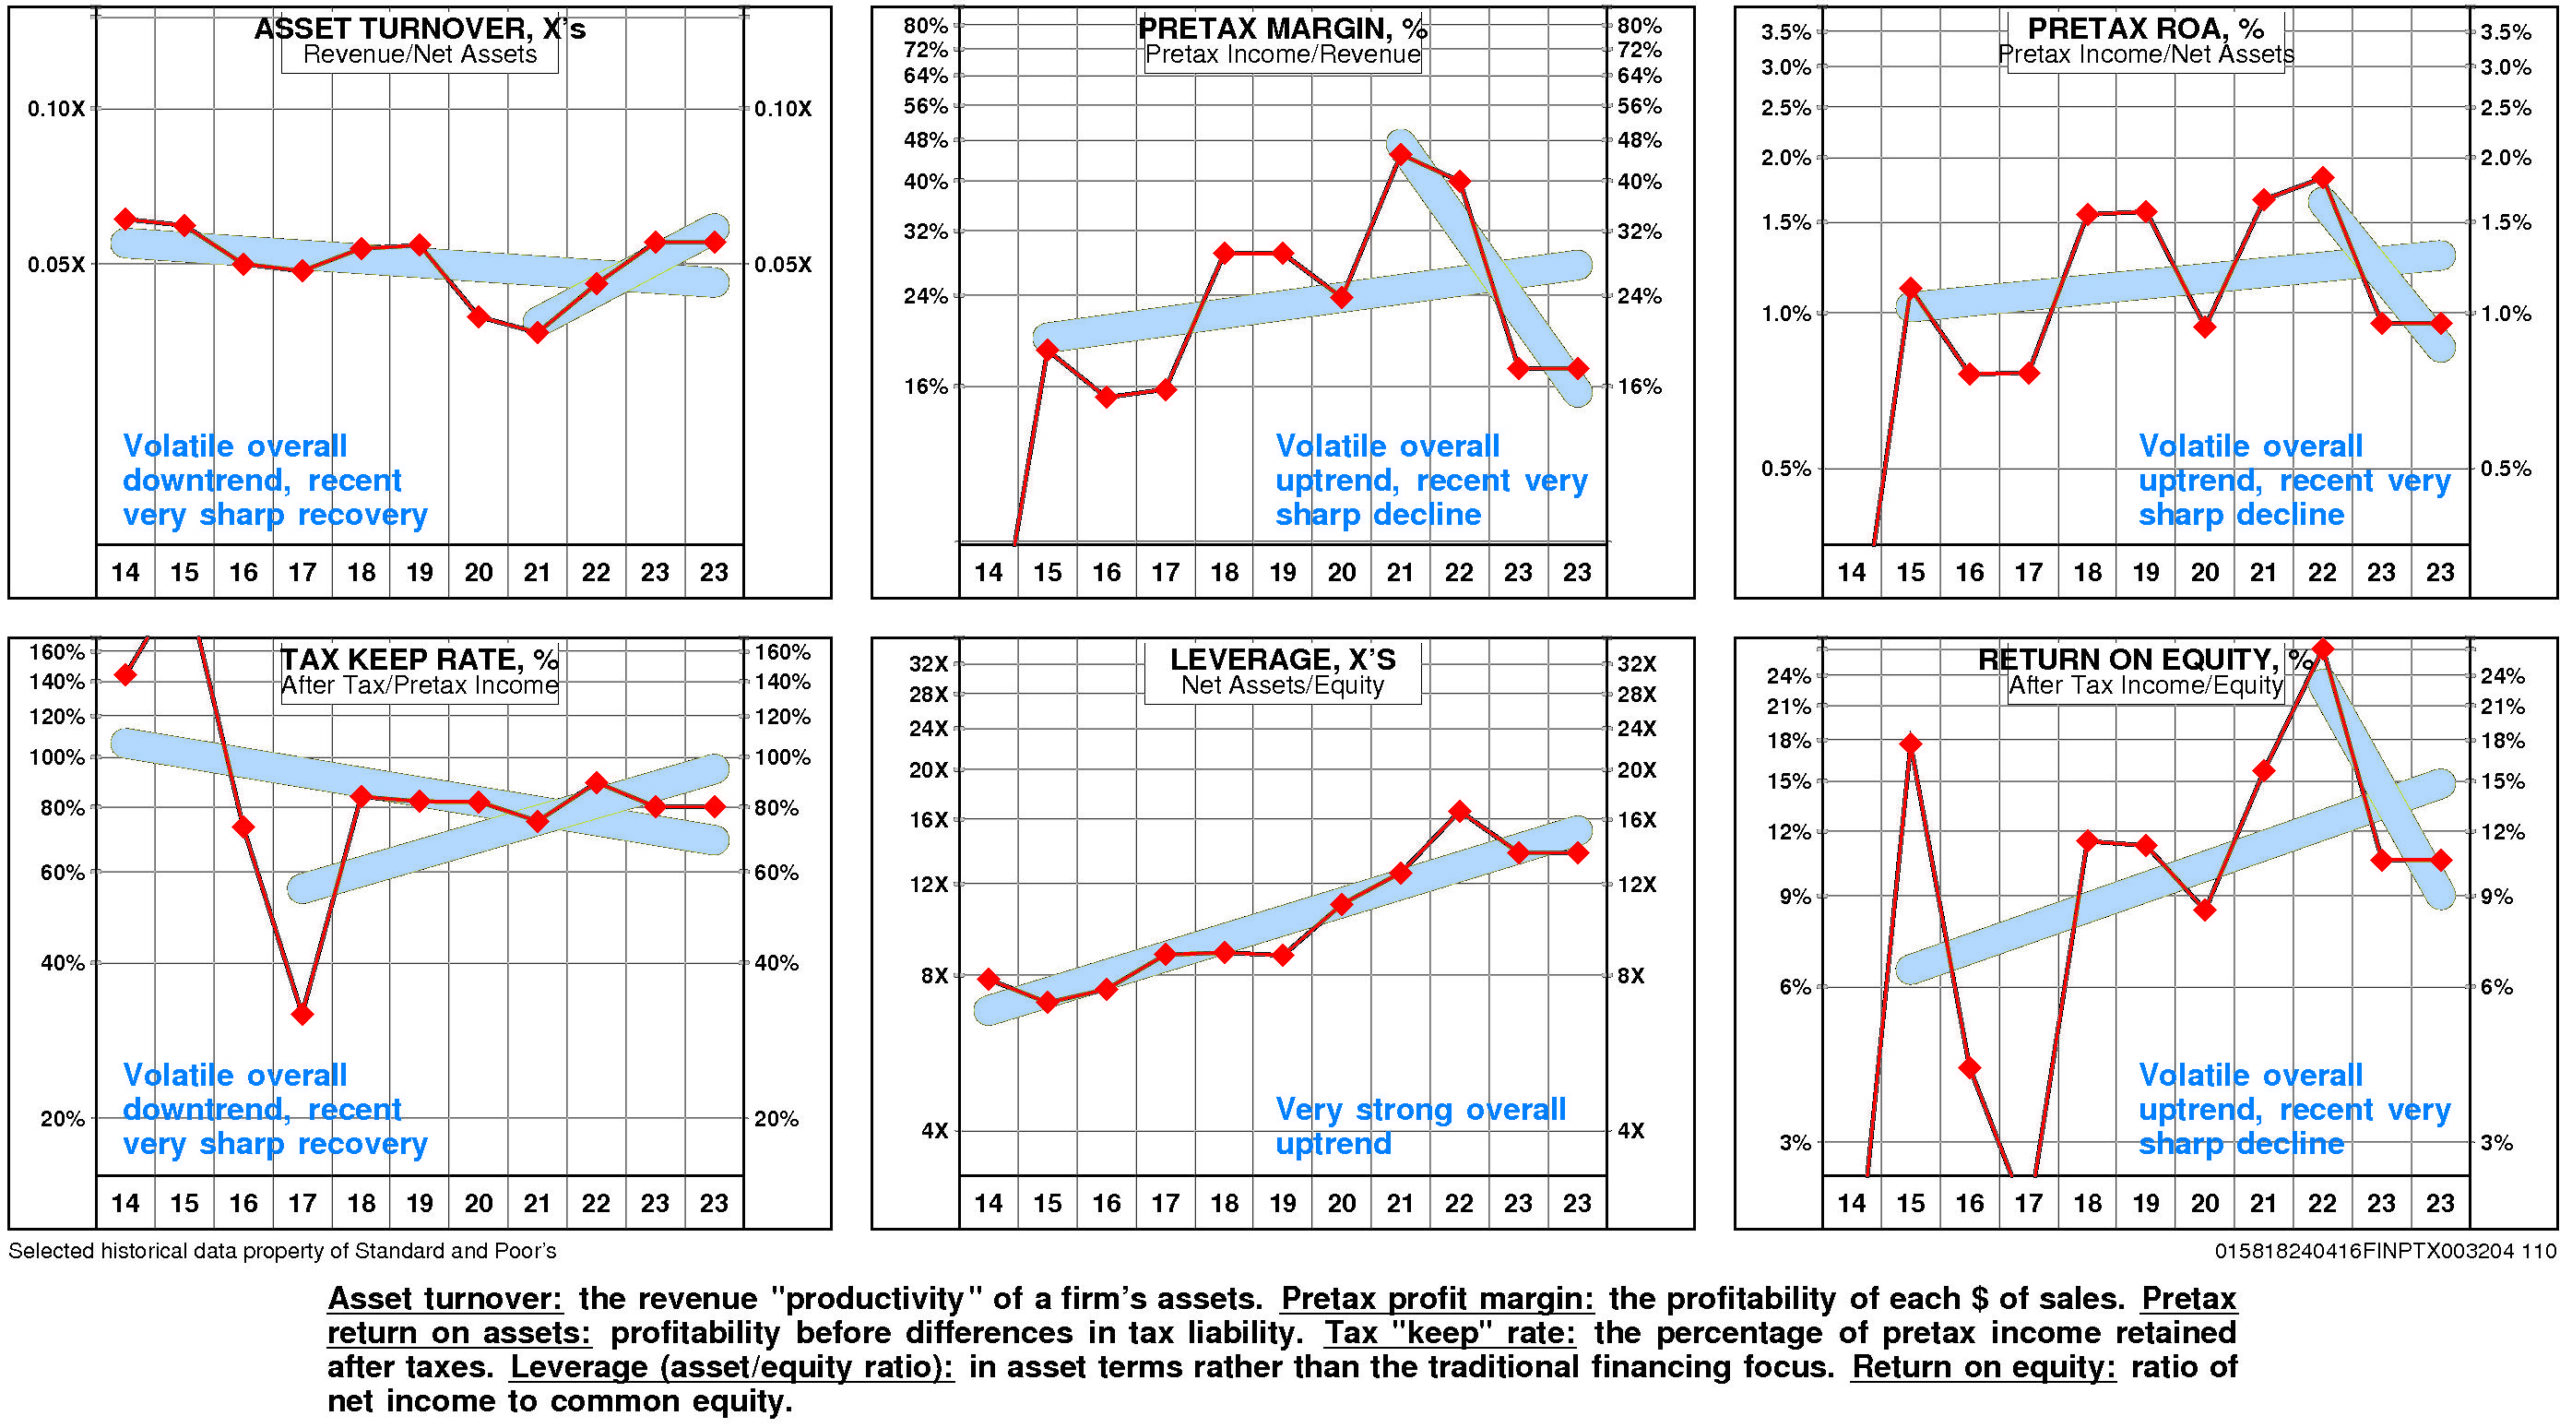
Popular's return on equity is at the lower quartile (10.6%) for the four quarters ended December, 2023.
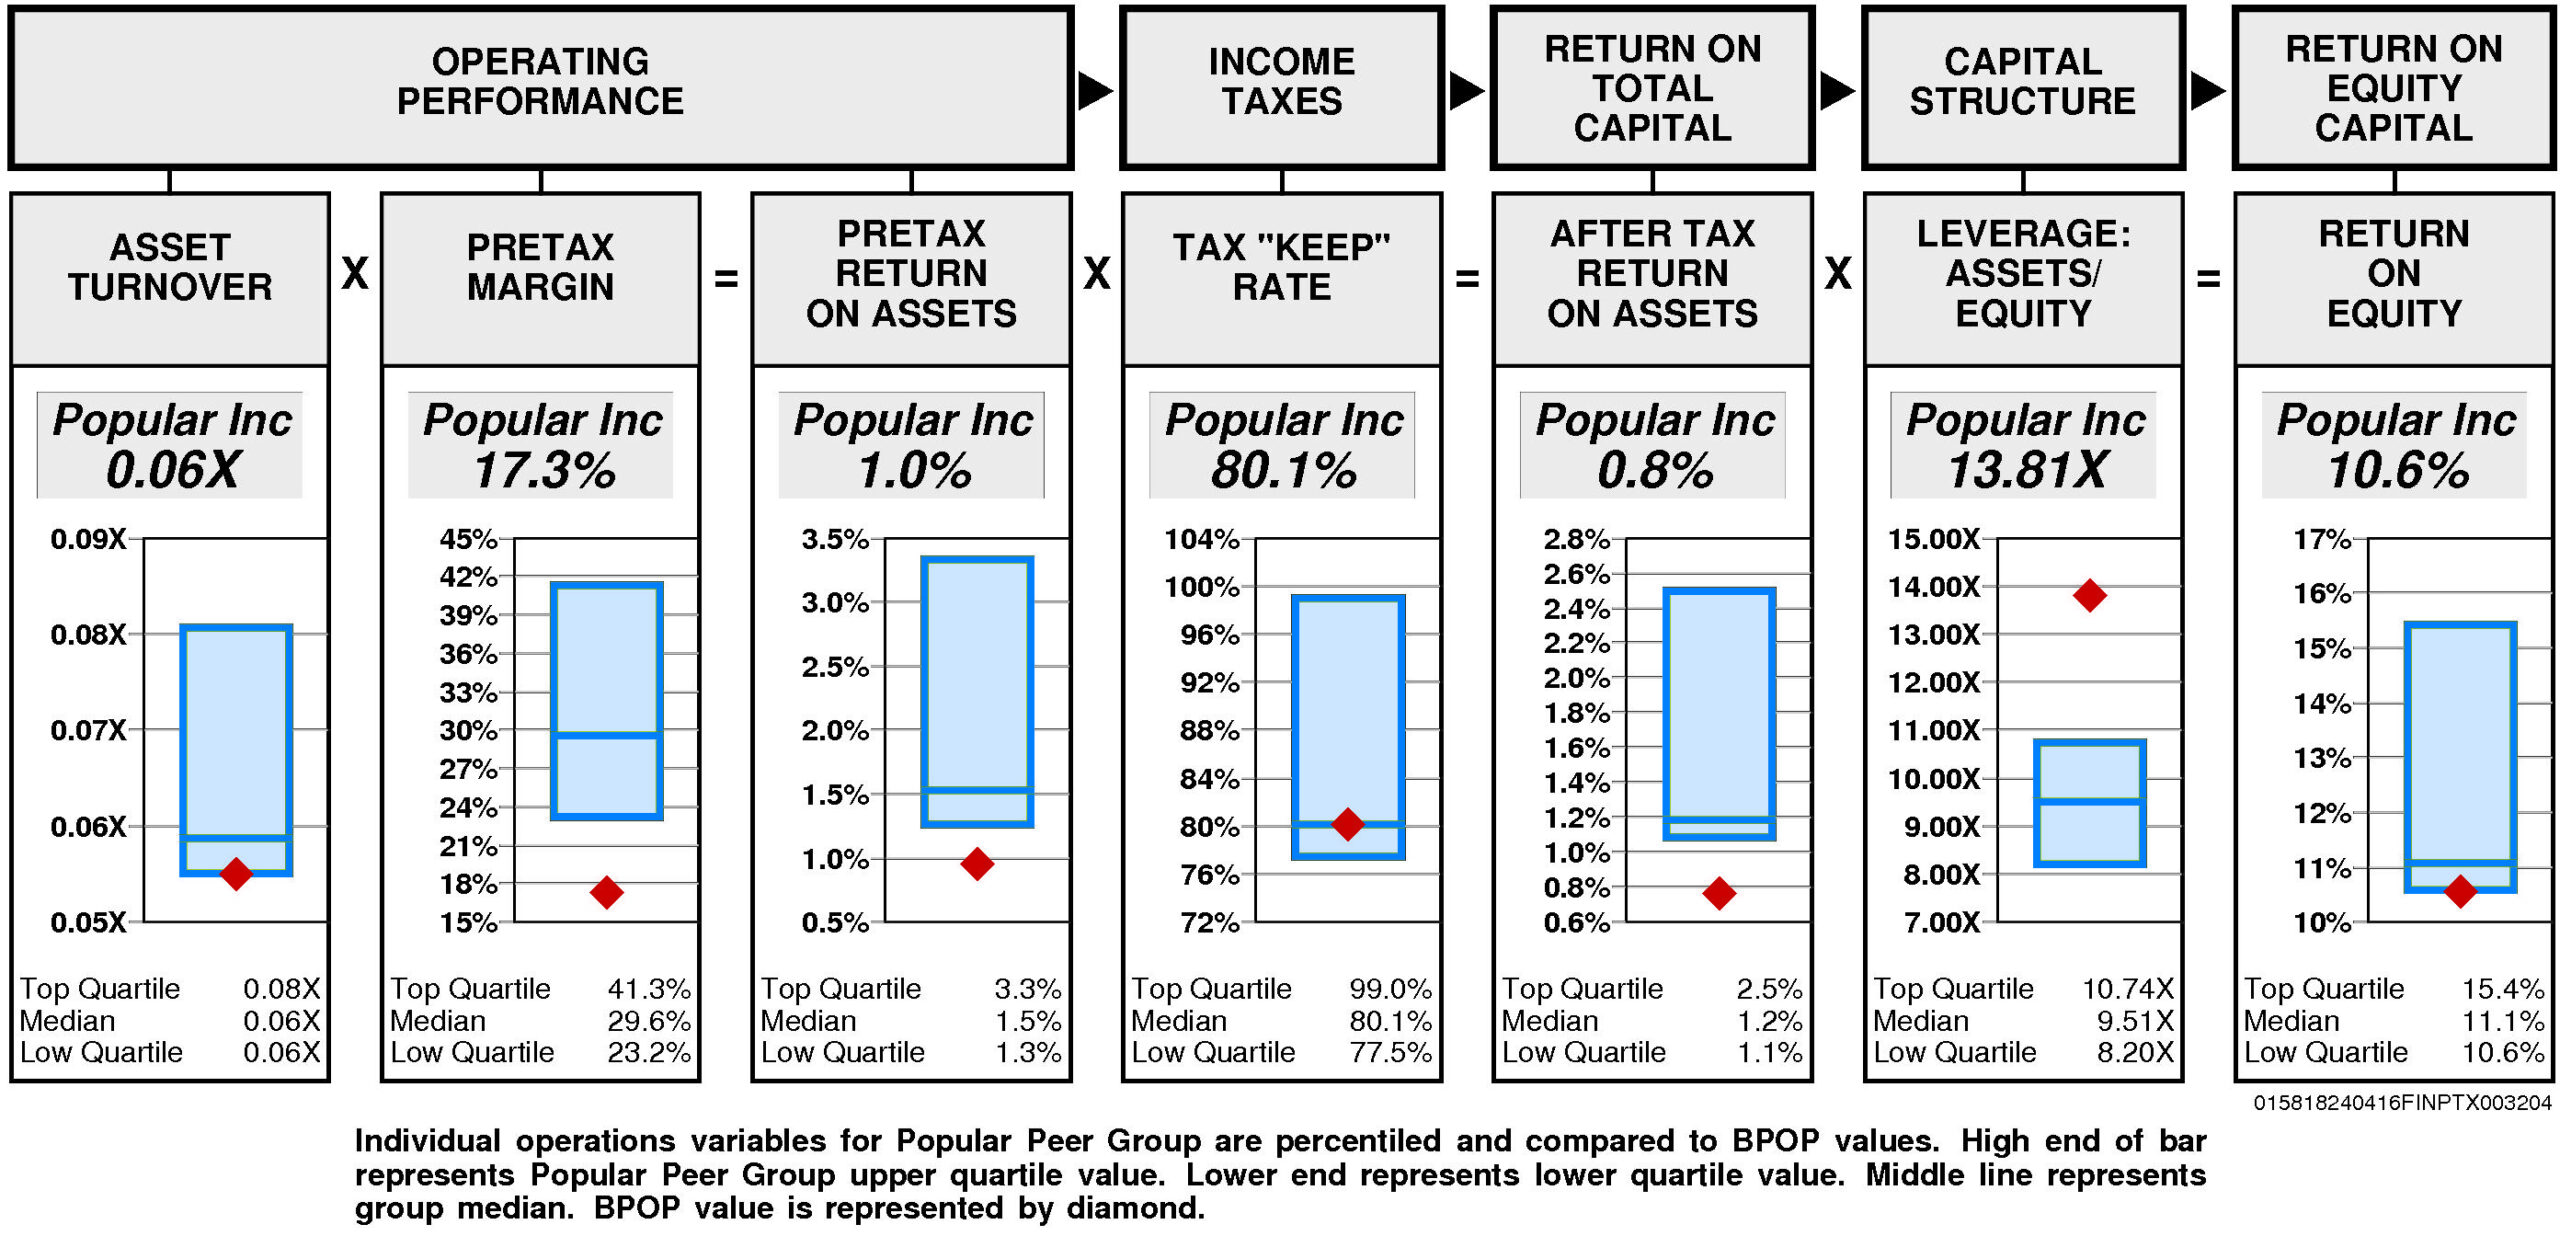
Operating performance (pretax return on assets) is lower quartile (1.0%) reflecting asset turnover that is at the lower quartile (0.06X) and lower quartile pretax margin (17.3%).
Tax “keep” rate (income tax management) is at median (80.1%) resulting in after tax return on assets that is lower quartile.
Financial leverage (leverage) is upper quartile (13.81X).
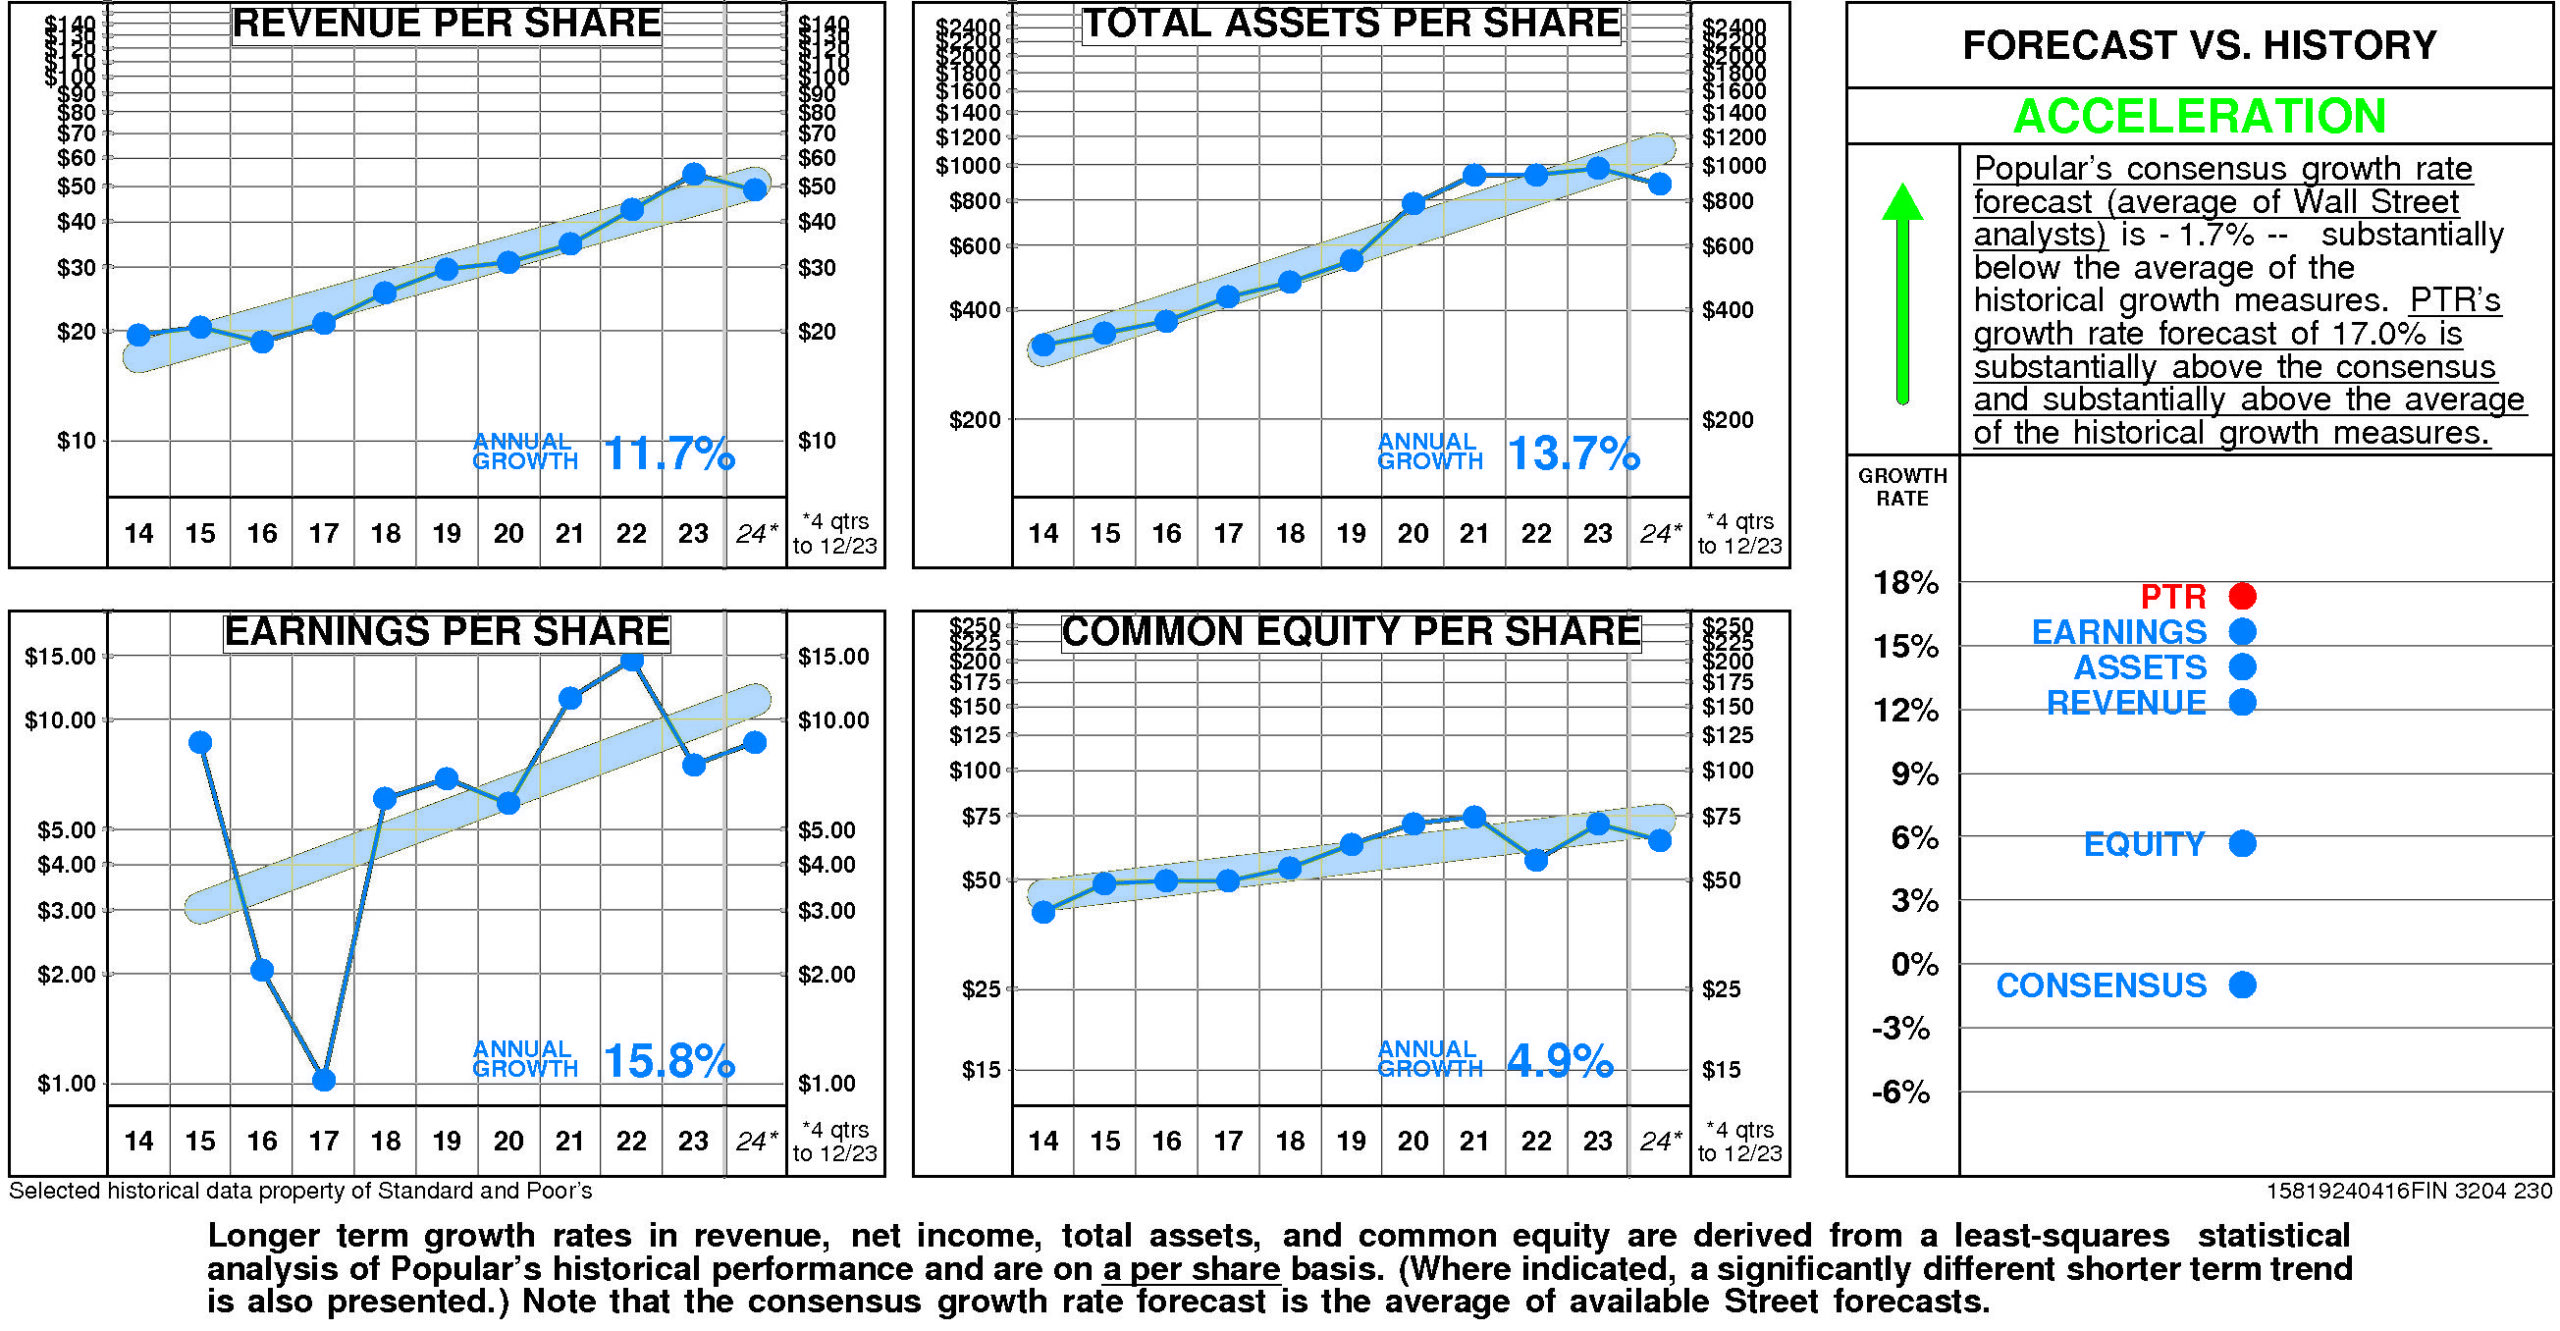
GROWTH RATES
There are no significant differences between Popular's longer term growth and growth in recent years.
Popular's historical income statement growth and balance sheet growth have diverged. Revenue growth has paralleled asset growth; earnings growth has exceeded equity growth.
Annual revenue growth
has been 11.7% per year.
Total asset growth
has been 13.7% per year.
Annual E.P.S. growth
has been 15.8% per year.
Equity growth
has been 4.9% per year.
Popular's consensus growth rate forecast (average of Wall Street analysts)
is -1.7% — substantially below the average of the historical growth measures.
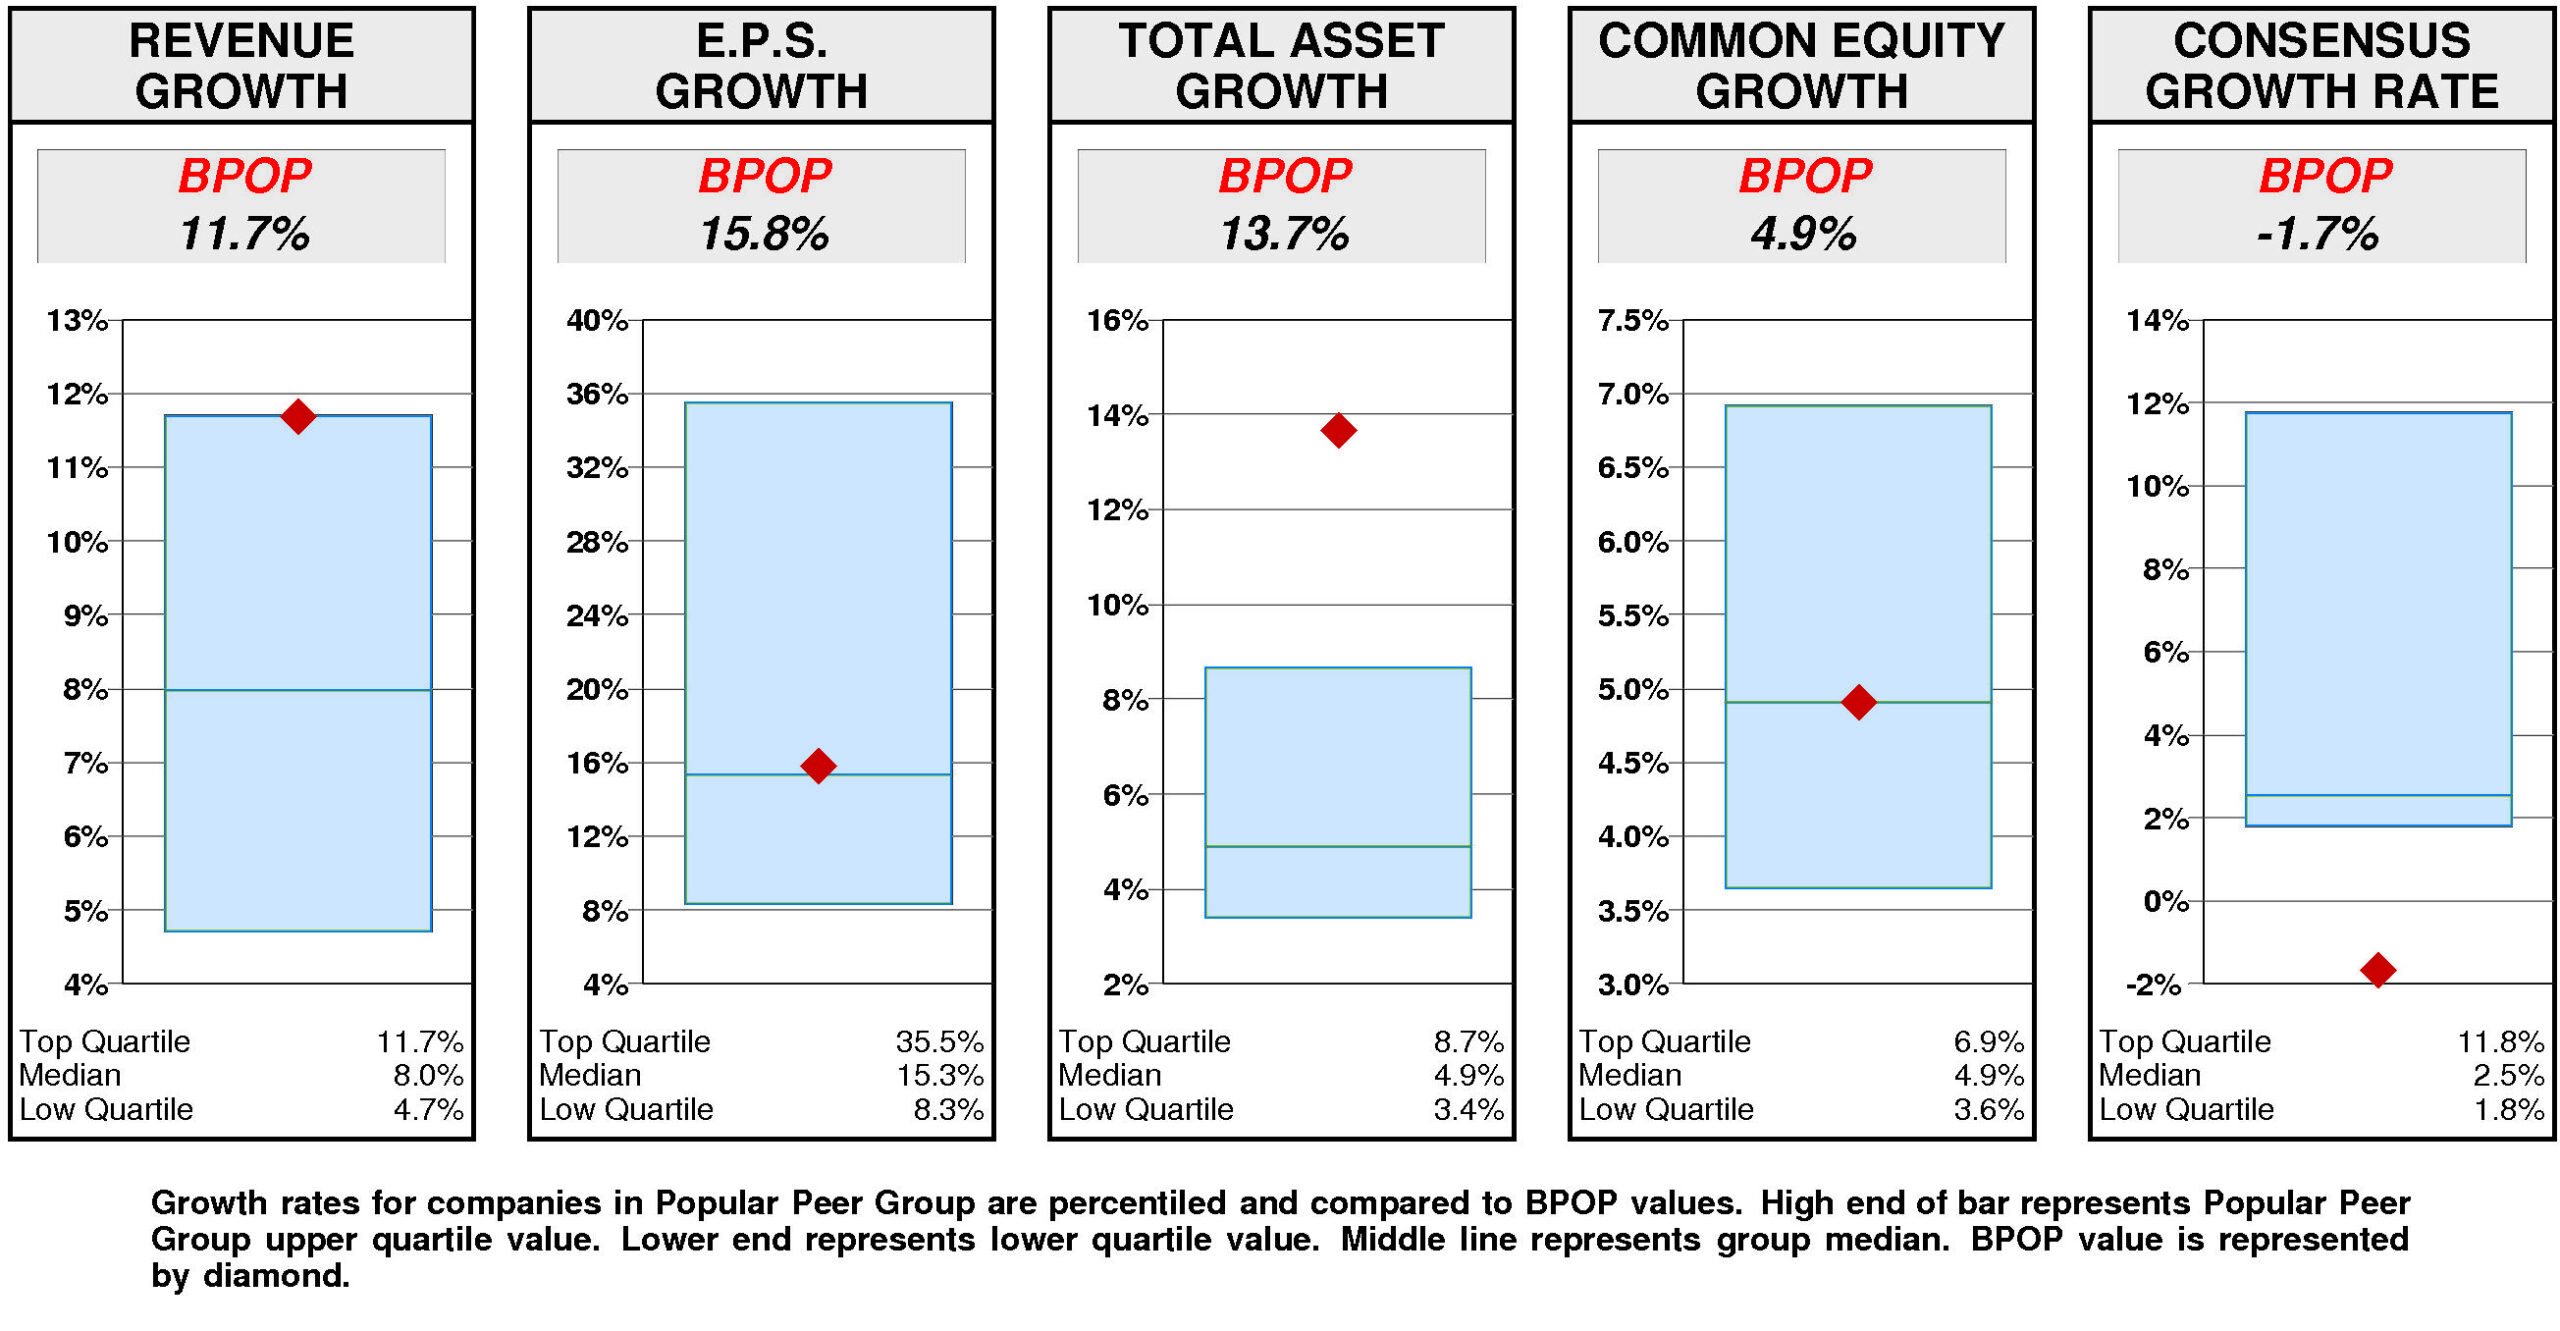
Relative to the Popular Peer Group, Popular's historical growth measures are erratic.
Total asset growth (13.7%) has been upper quartile. Revenue growth (11.7%) has been at the upper quartile. E.P.S. growth (15.8%) has been slightly above median. Equity growth (4.9%) has been at median.
Consensus growth forecast (-1.7%) is lower quartile.
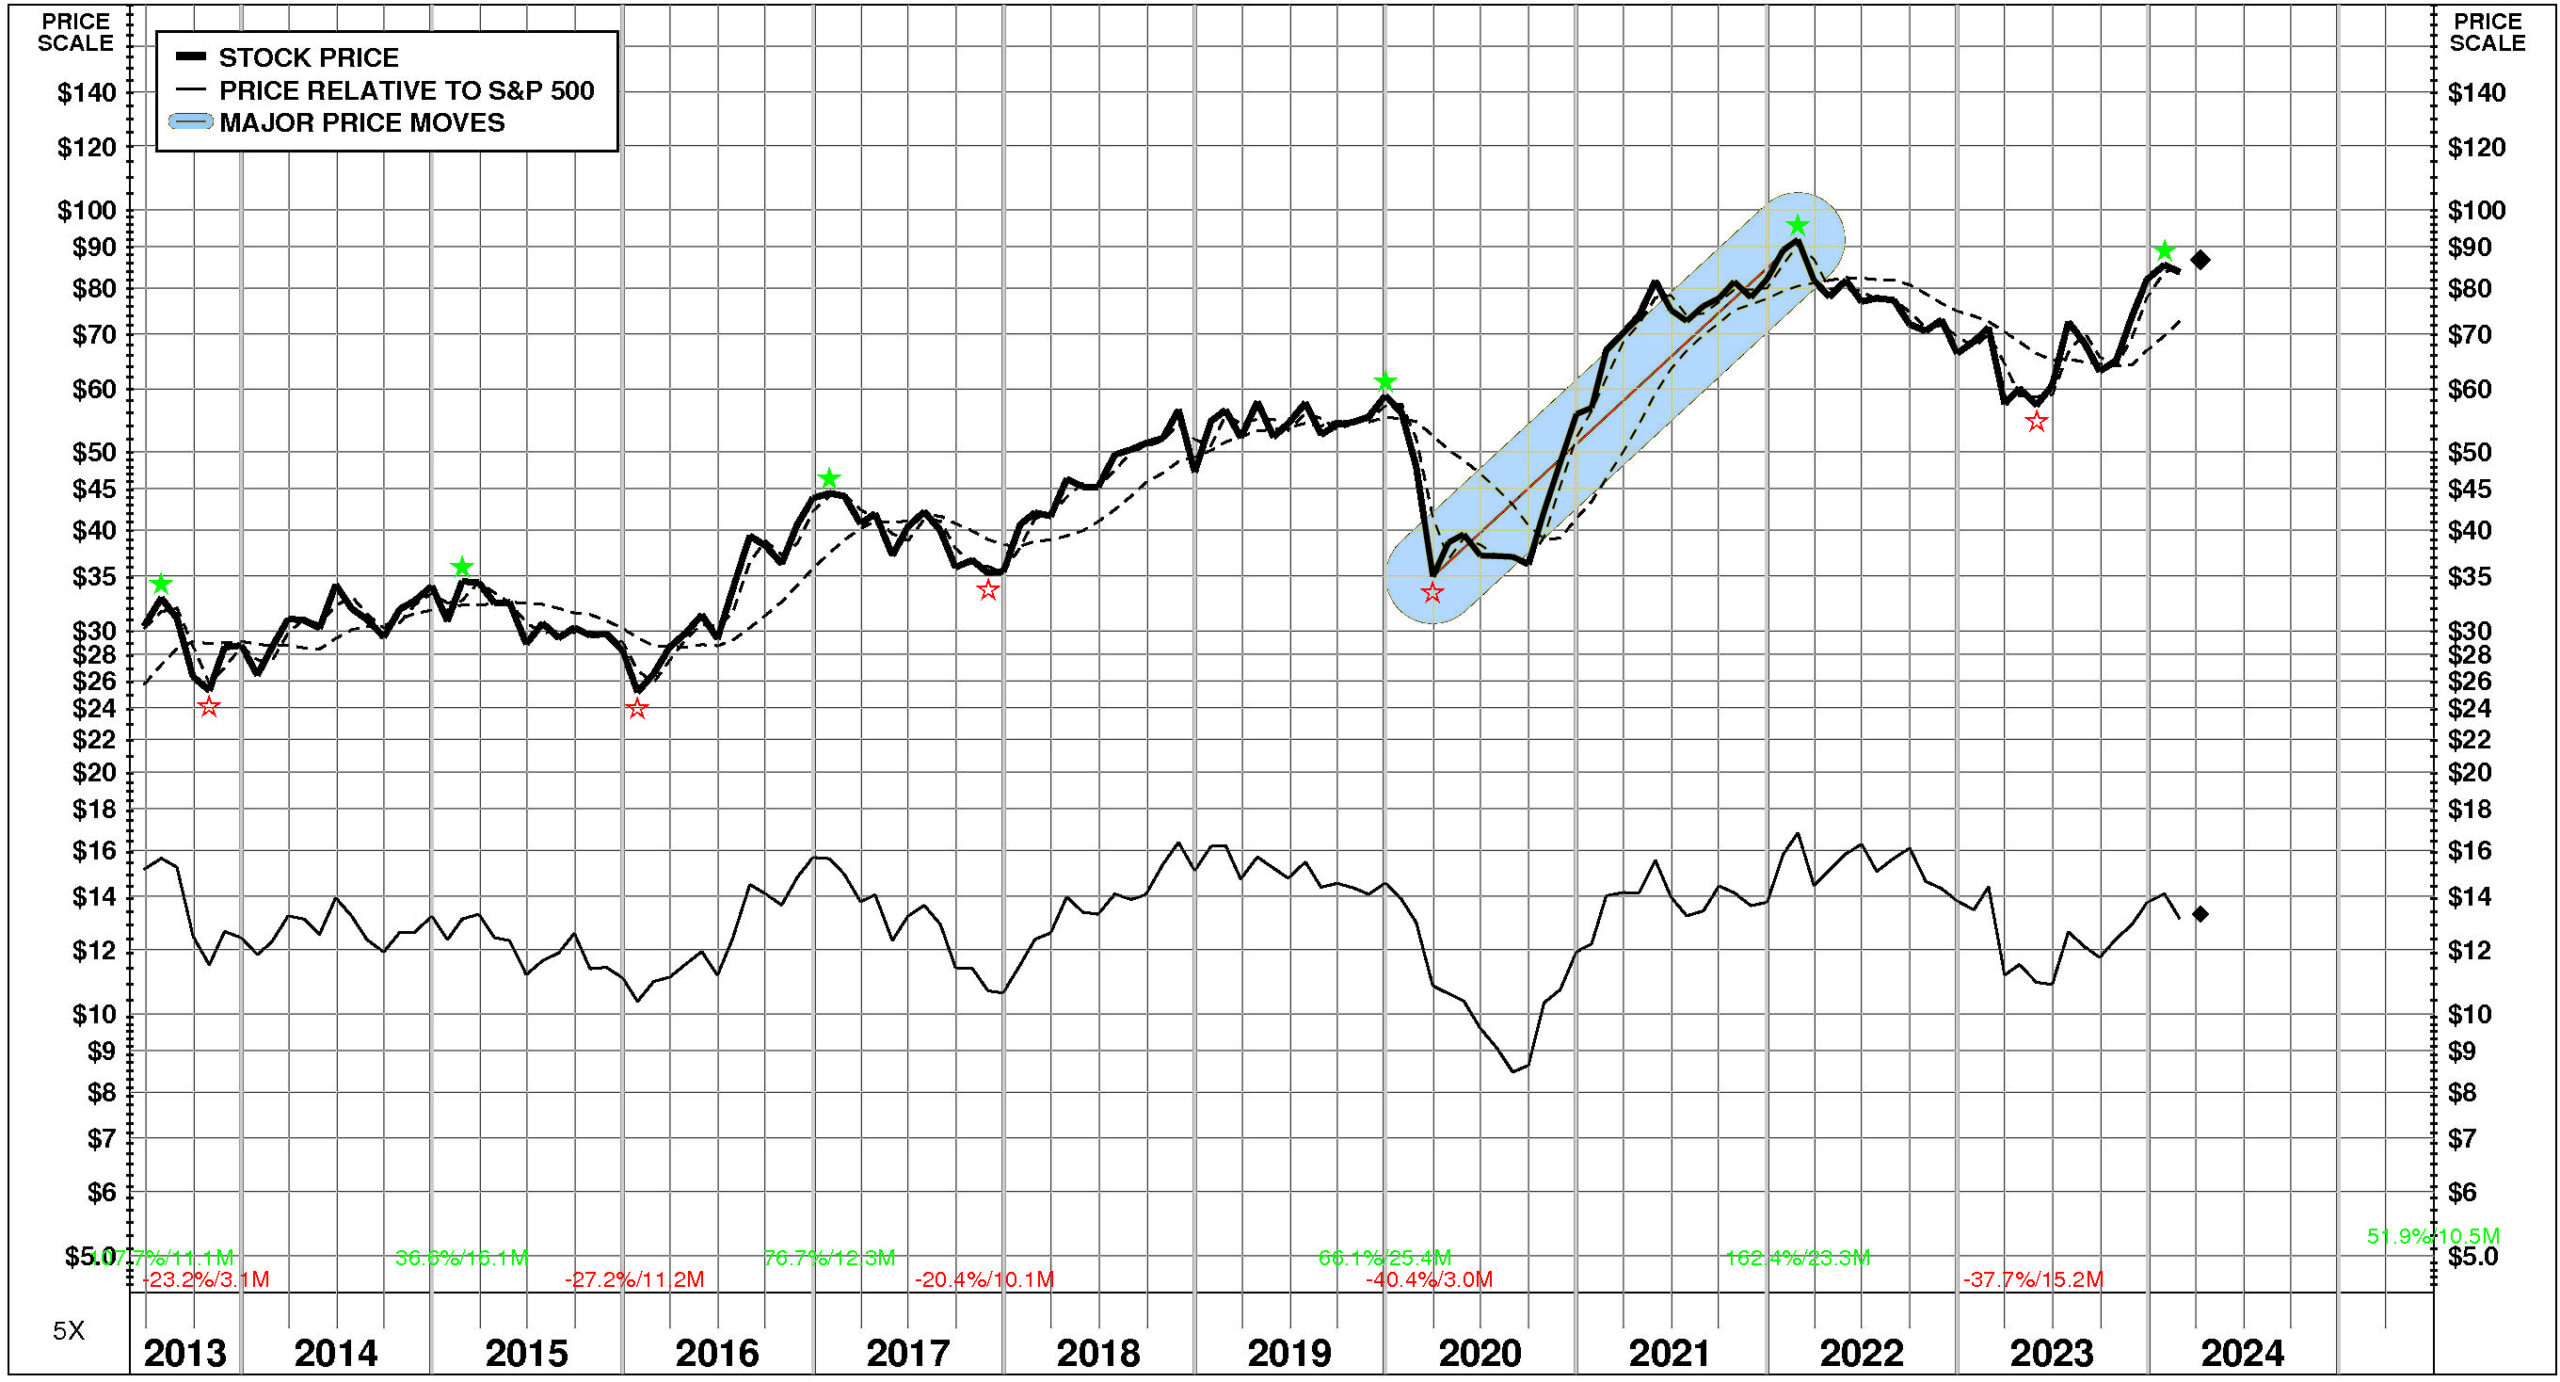
PRICE HISTORY
Over the full time period, Popular's stock price performance has been variable and slightly below market.
Between June, 2013 and April, 2024, Popular's stock price rose +186%; relative to the market, this was a -12% loss. Significant price move during the period: 1) March, 2020 – February, 2022: +162%.
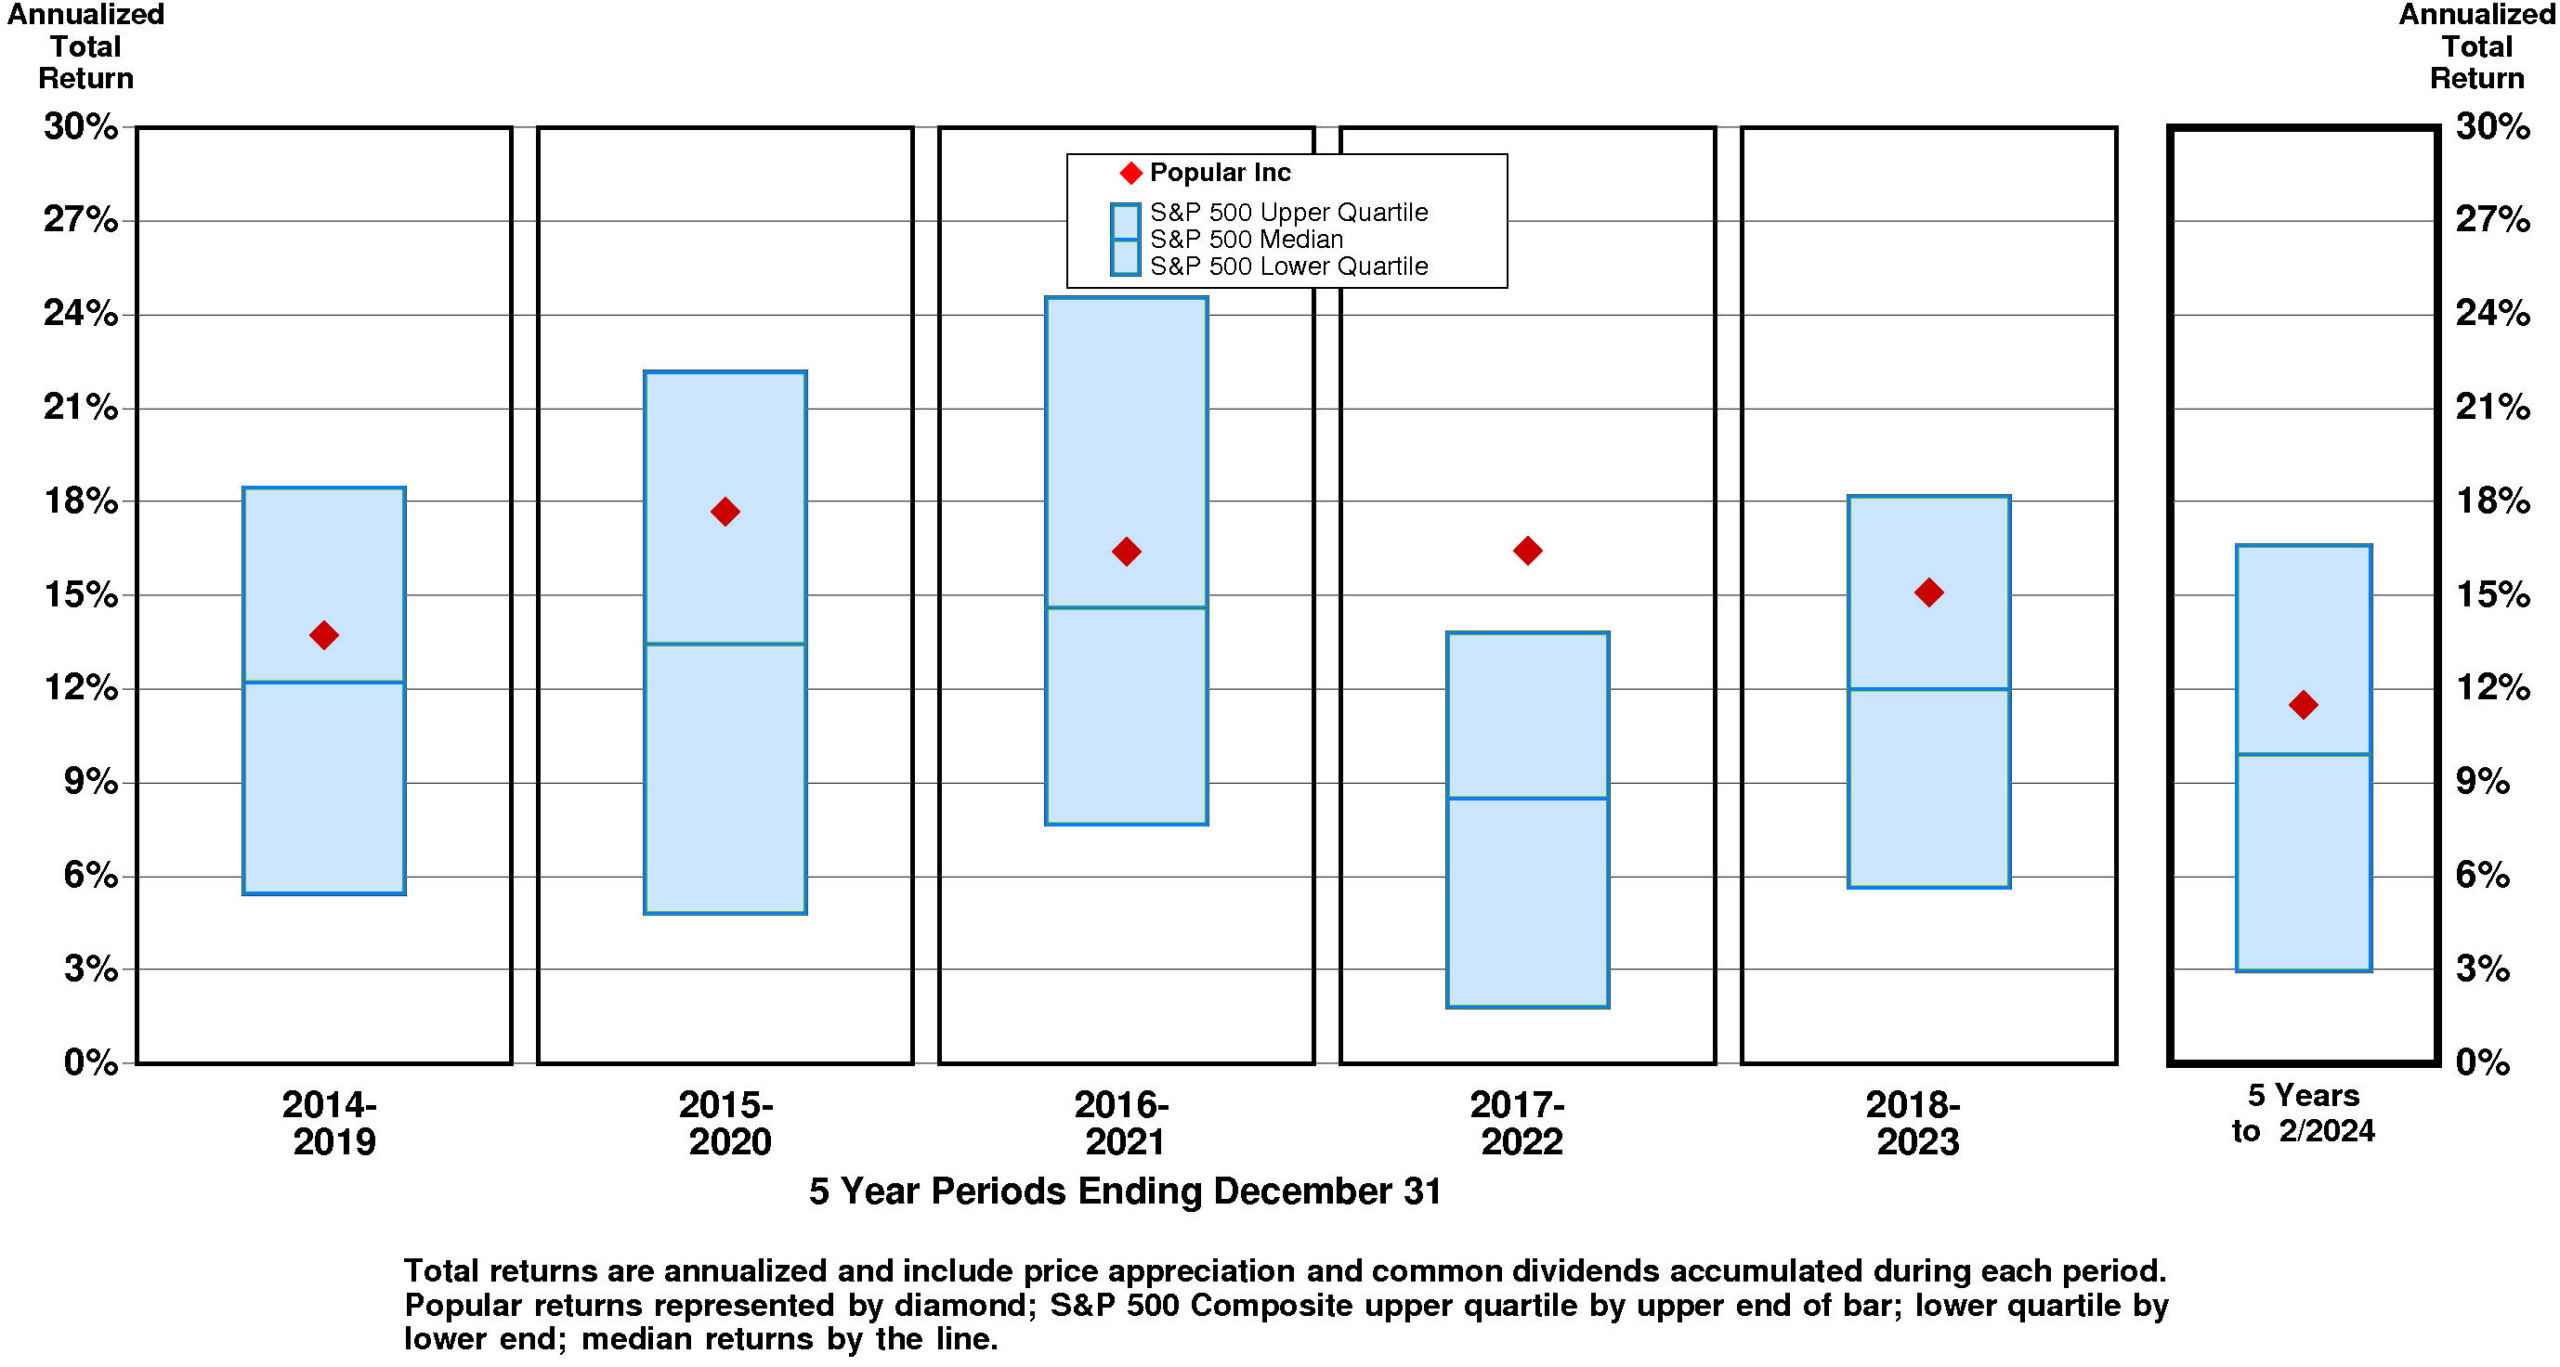
TOTAL INVESTMENT RETURNS
Current annual total return performance of 21.4% is above median relative to the S&P 500 Composite.
In addition to being above median relative to S&P 500 Composite, current annual total return performance through February, 2024 of 21.4% is above median relative to Popular Inc Peer Group.
Current 5-year total return performance of 11.5% is slightly above median relative to the S&P 500 Composite.
Through February, 2024, with slightly above median current 5-year total return of 11.5% relative to S&P 500 Composite, Popular's total return performance is above median relative to Popular Inc Peer Group.
VALUATION BENCHMARKS
Relative to S&P 500 Composite, BPOP's overall valuation is exceptionally low.
All five factors are lower quartile. The highest factor is the ratio of enterprise value/earnings before interest and taxes, followed by the ratio of enterprise value/revenue, then by the price/earnings ratio, then by the price/equity ratio. The lowest factor is the ratio of enterprise value/assets.
Relative to Popular Peer Group, BPOP's overall valuation is normal.
The highest factor, the price/equity ratio, is at the upper quartile. Price/earnings ratio is at the upper quartile. Ratio of enterprise value/earnings before interest and taxes is below median. Ratio of enterprise value/assets is lower quartile. The lowest factor, the ratio of enterprise value/revenue, is lower quartile.
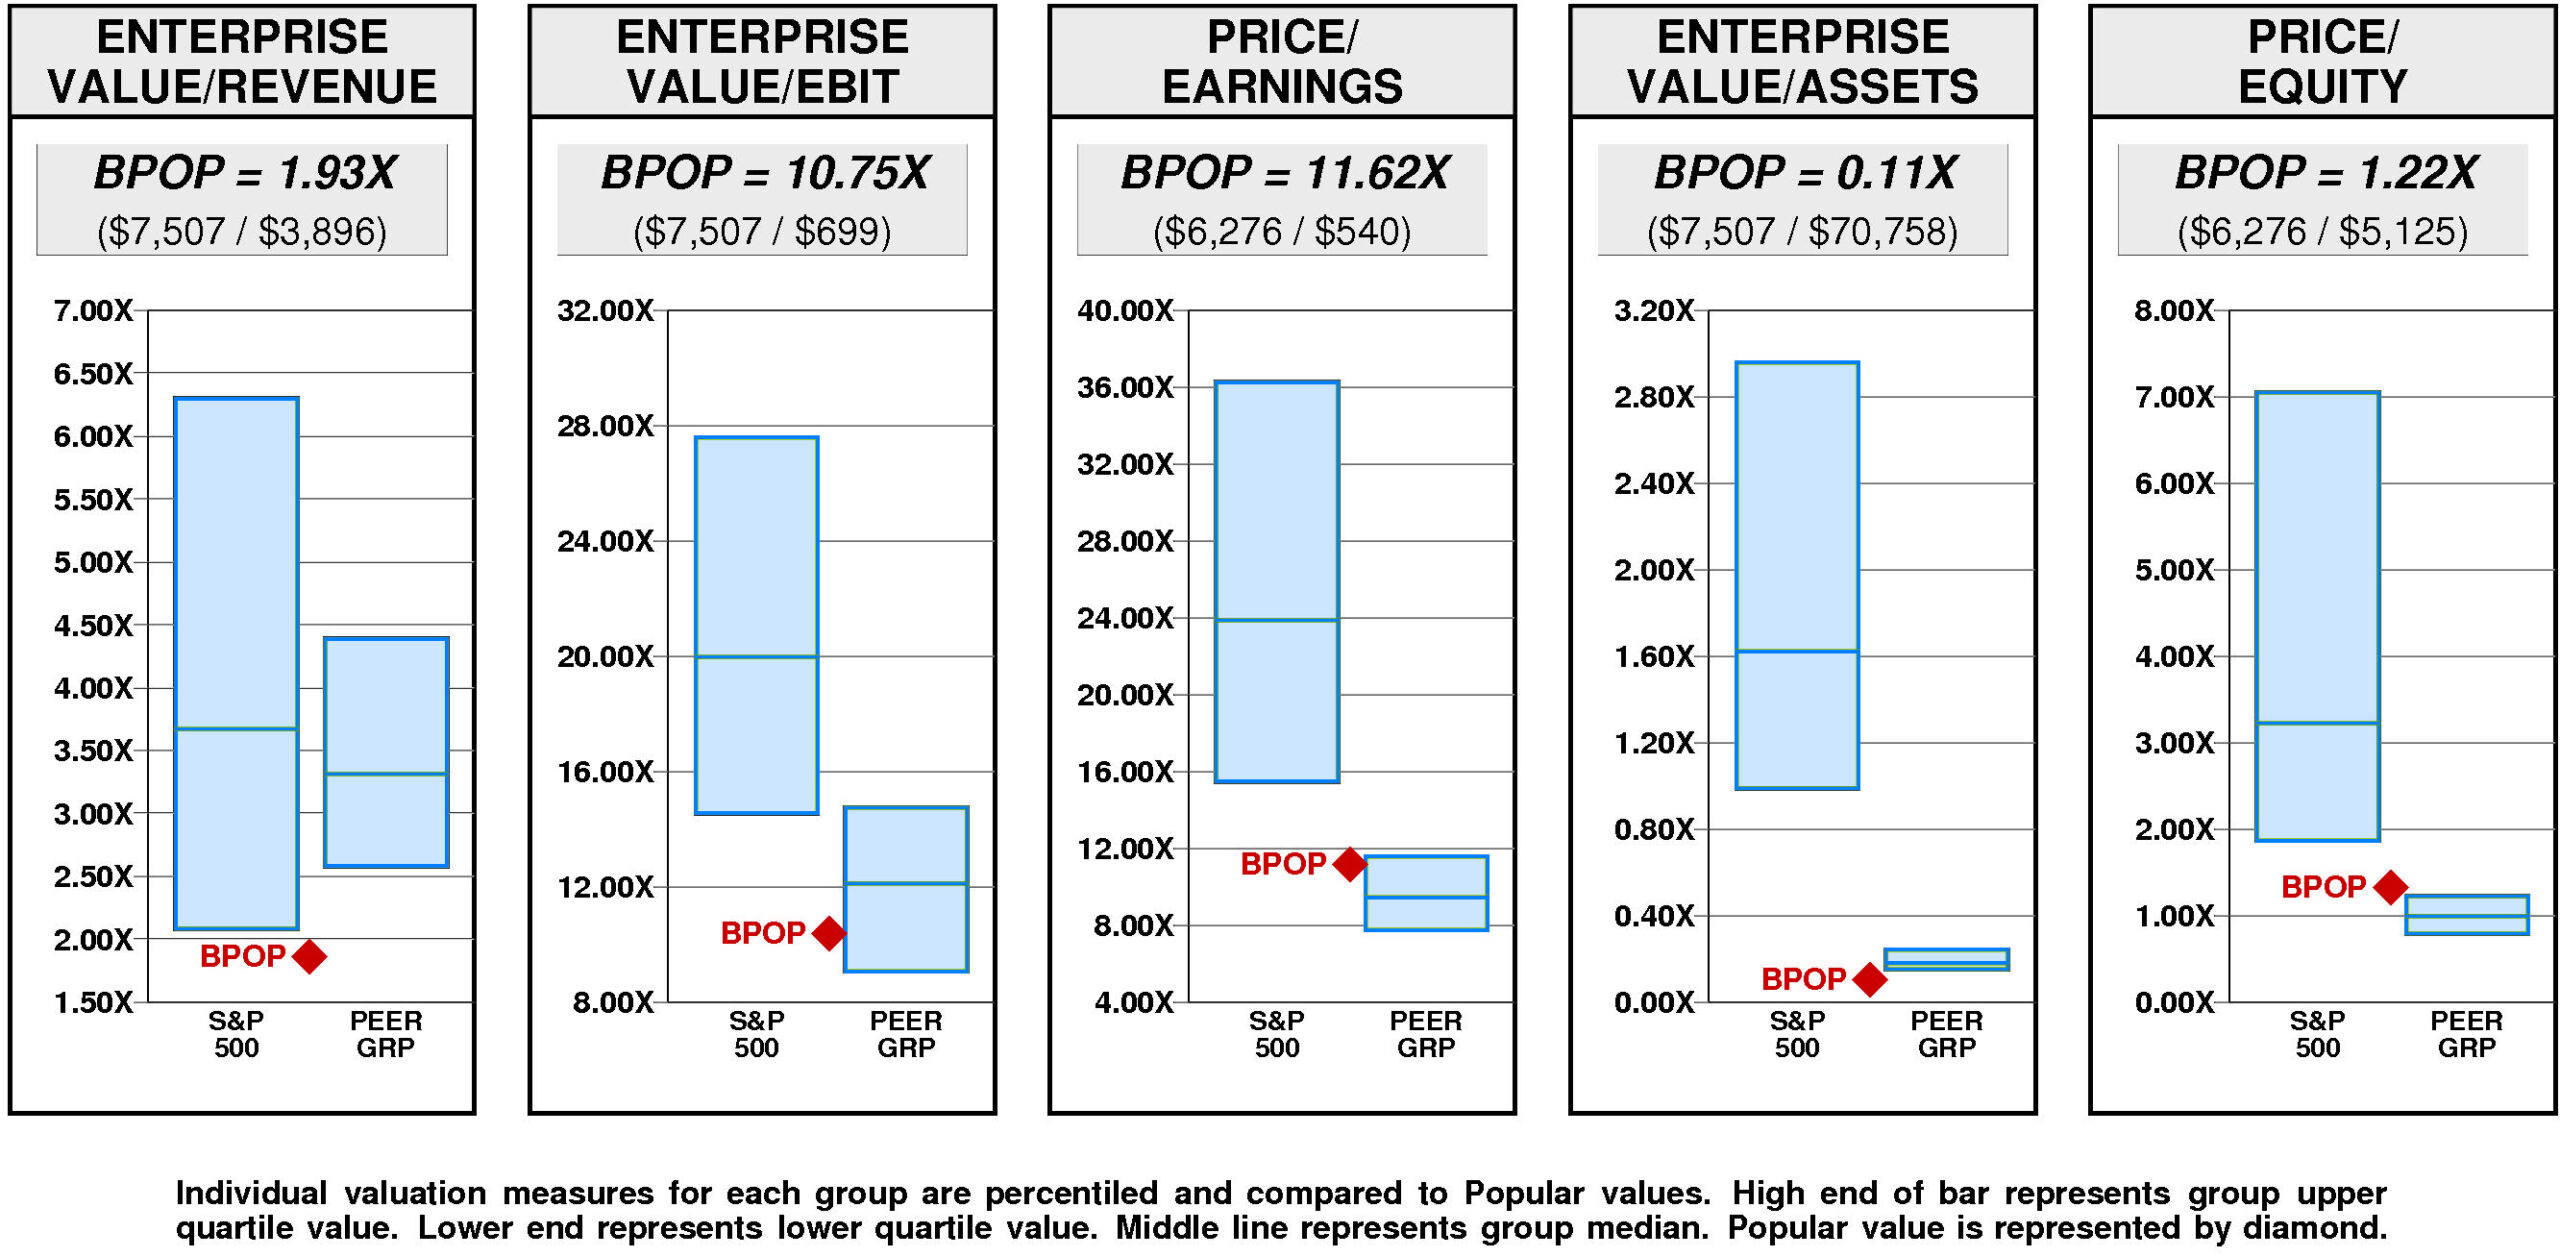
Popular has a major value gap compared to the median.
For BPOP to hit median valuation, its current ratio of enterprise value/revenue would have to rise from the current level of 1.93X to 3.31X. If BPOP's ratio of enterprise value/revenue were to rise to 3.31X, its stock price would be higher by $75 to $162.
For BPOP to achieve upper quartile valuation relative to the Popular Peer Group, its current ratio of enterprise value/revenue would have to rise from the current level of 1.93X to 4.39X. If BPOP's ratio of enterprise value/revenue were to rise to 4.39X, its stock price would increase by $133 from the current level of $87.
VALUE TARGETS
BPOP is expected to continue to be a Value Builder reflecting capital returns that are forecasted to be above the cost of capital.
Popular's current Price Target of $306 represents a +253% change from the current price of $86.86.
This very high appreciation potential results in an appreciation score of 91 (only 9% of the universe has greater appreciation potential.)
Reinforcing this high Appreciation Score of 91, the high Power Rating of 94 contributes to an Value Trend Rating of A.
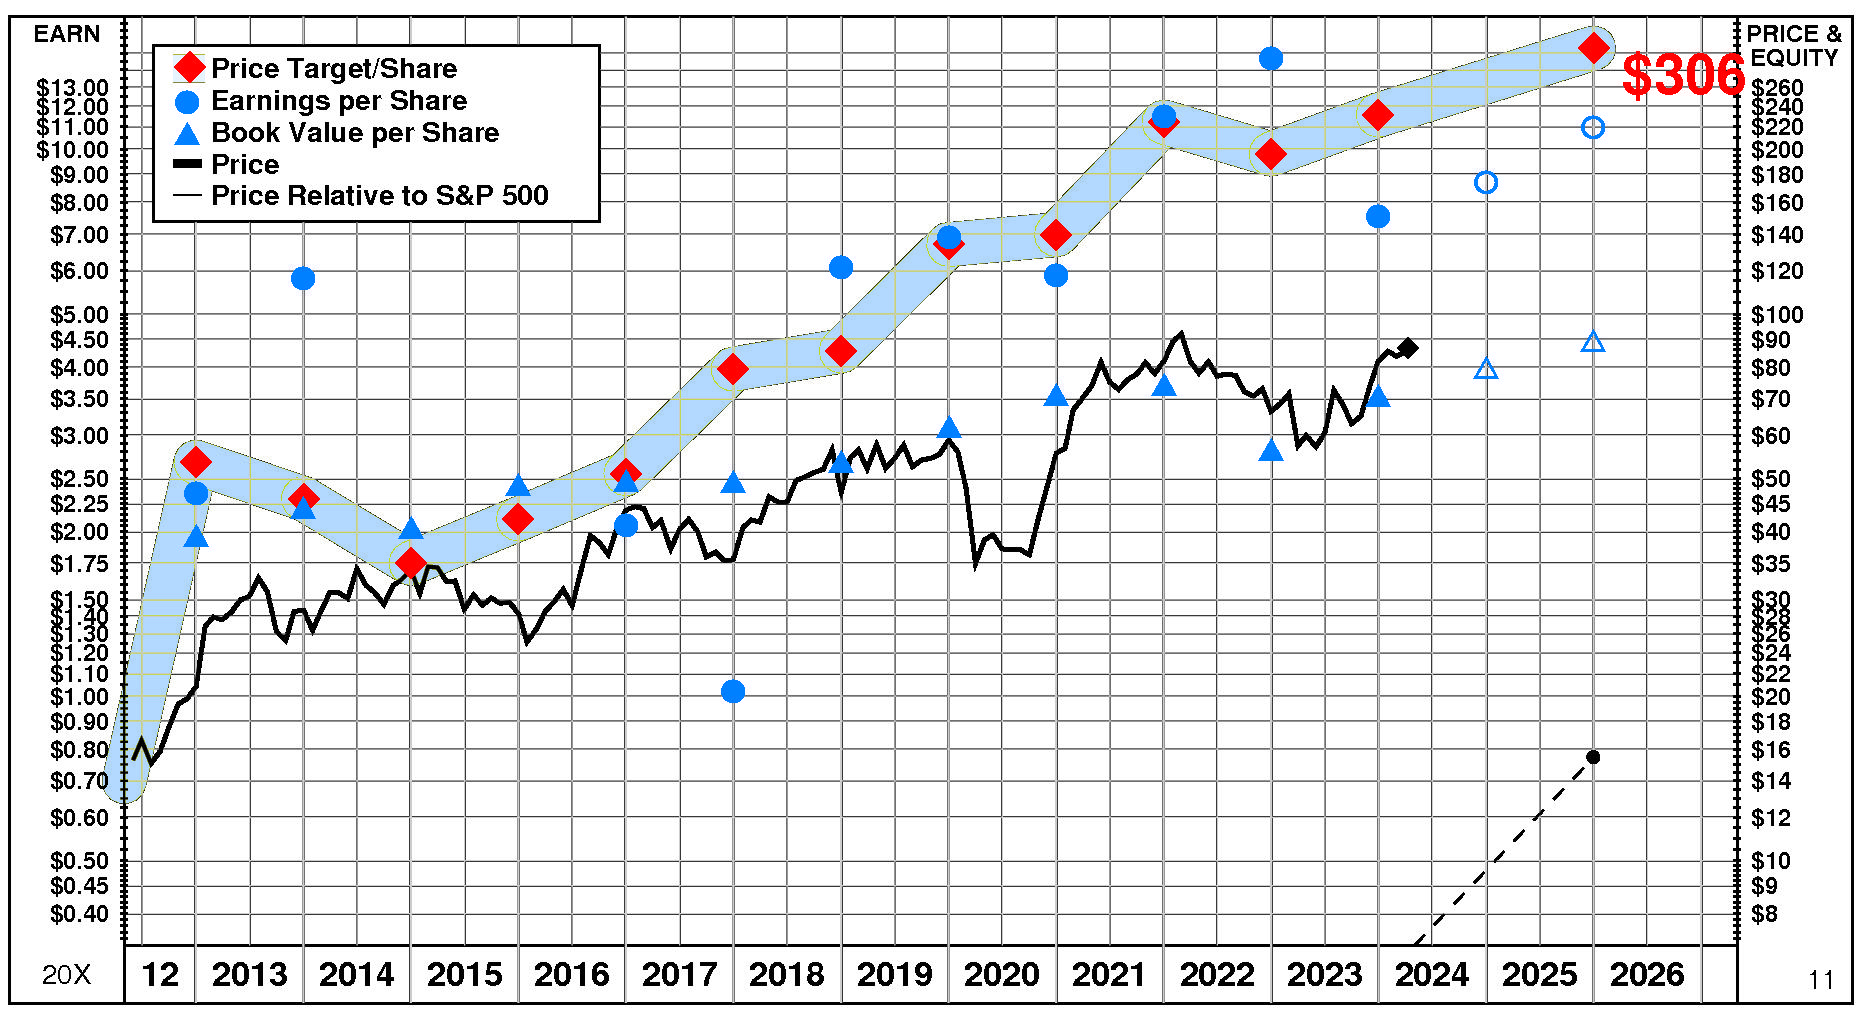
Popular's current Price Target is $306 (+33% from the 2023 Target of $231 and +253% from the 04/09/24 price of $86.86).
This dramatic rise in the Target is the result of a +27% increase in the equity base and a +4% increase in the price/equity multiple. One Driver has a positive impact on the price/equity multiple, one has a negative impact, and one has no effect. The forecasted increase in return on equity has a large positive impact on the price/equity multiple. The forecasted flat growth has no impact. The forecasted increase in cost of equity has a large negative impact.
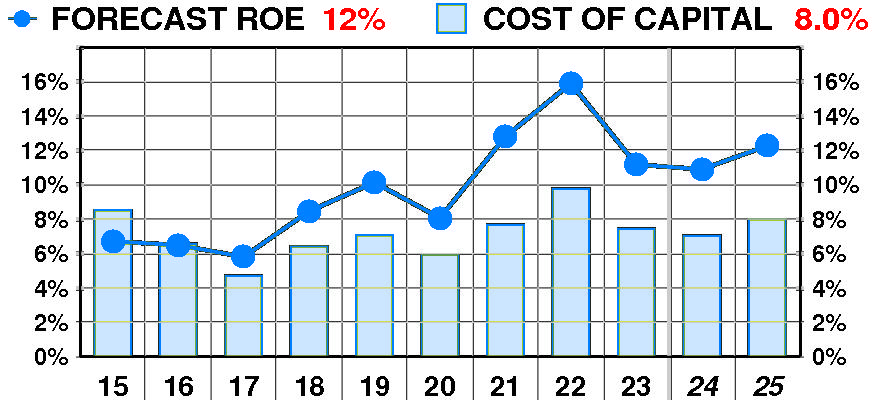
PTR's return on equity forecast is 12.3% — in line with our recent forecasts.
Forecasted return on equity enjoyed a dramatic, variable increase between 2015 and 2023. The current forecast is well above the 2017 low of 6%.
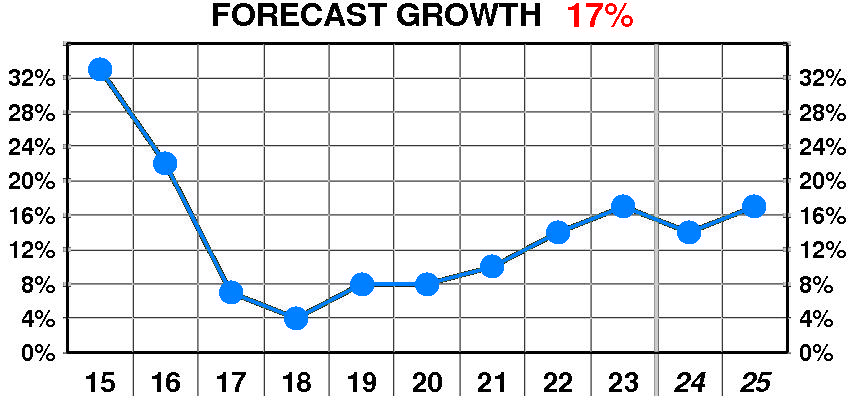
PTR's growth forecast is 17.0% — in line with our recent forecasts.
Forecasted growth suffered a dramatic, erratic decline between 2015 and 2023. The current forecast is significantly below the 2015 peak of 33%.
PTR's cost of equity forecast is 8.0% — in line with recent levels.
Forecasted cost of equity suffered a dramatic, erratic increase between 2015 and 2023. The current forecast is above the 2017 low of 4.7%.
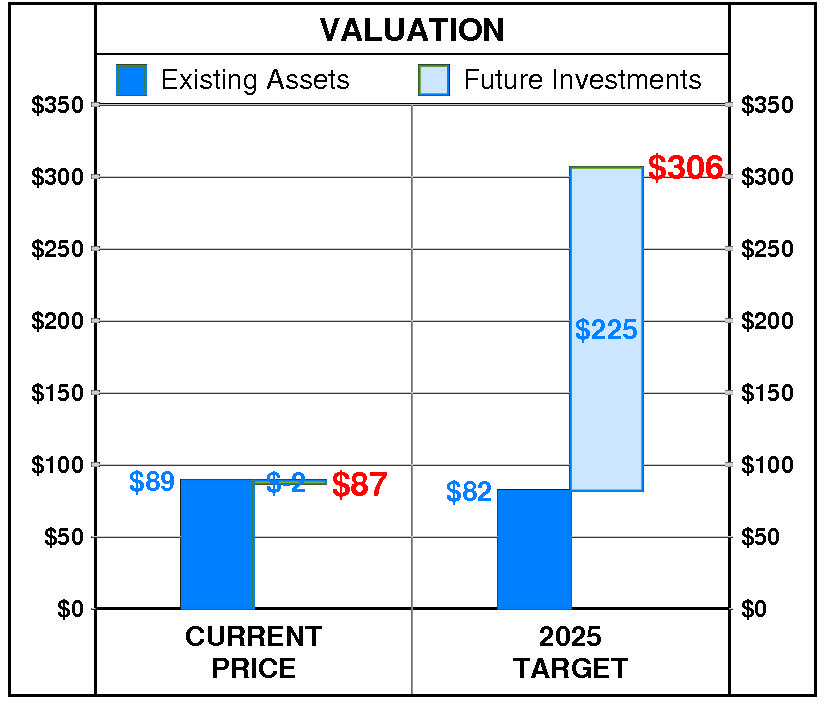
At Popular's current price of $86.86, investors are placing a negative value of $-2 on its future investments. This view is not supported by the company's most recent performance that reflected a growth rate of 17.0% per year, and a return on equity of 11.2% versus a cost of equity of 7.4%.
PTR's 2025 Price Target of $306 is based on these forecasts and reflects an estimated value of existing assets of $82 and a value of future investments of $225.