
BUSINESS
Genesco Inc. operates as a retailer and wholesaler of footwear, apparel, and accessories. The company operates through four segments: Journeys Group, Schuh Group, Johnston & Murphy Group, and Licensed Brands. The Journeys Group segment offers footwear and accessories through the Journeys, Journeys Kidz, and Little Burgundy retail chains, as well as through e-commerce and catalogs for young men, women, and children. The Schuh Group segment operates Schuh retail footwear stores that offer casual and athletic footwear, as well as sells footwear through e-commerce. The Johnston & Murphy Group segment is involved in the retail and e-commerce operations; and wholesale distribution of men's dress and casual footwear, apparel, and accessories, as well as women's footwear and accessories. The Licensed Brands segment markets footwear under the Levi's, Dockers, and G.H.
INVESTMENT RATING
With future capital returns forecasted to exceed the cost of capital, GCO is expected to continue to be a modest Value Builder.
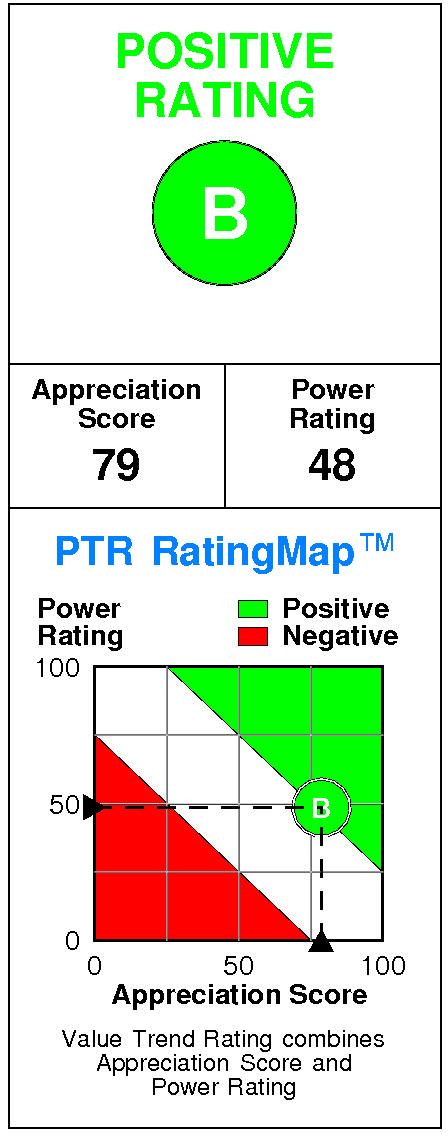
Genesco has a current Value Trend Rating of B (Positive).
With this rating, PTR's two proprietary measures of a stock's current attractiveness are providing inconsistent signals. Genesco has a good Appreciation Score of 79 but a neutral Power Rating of 48, resulting in the Positive Value Trend Rating.
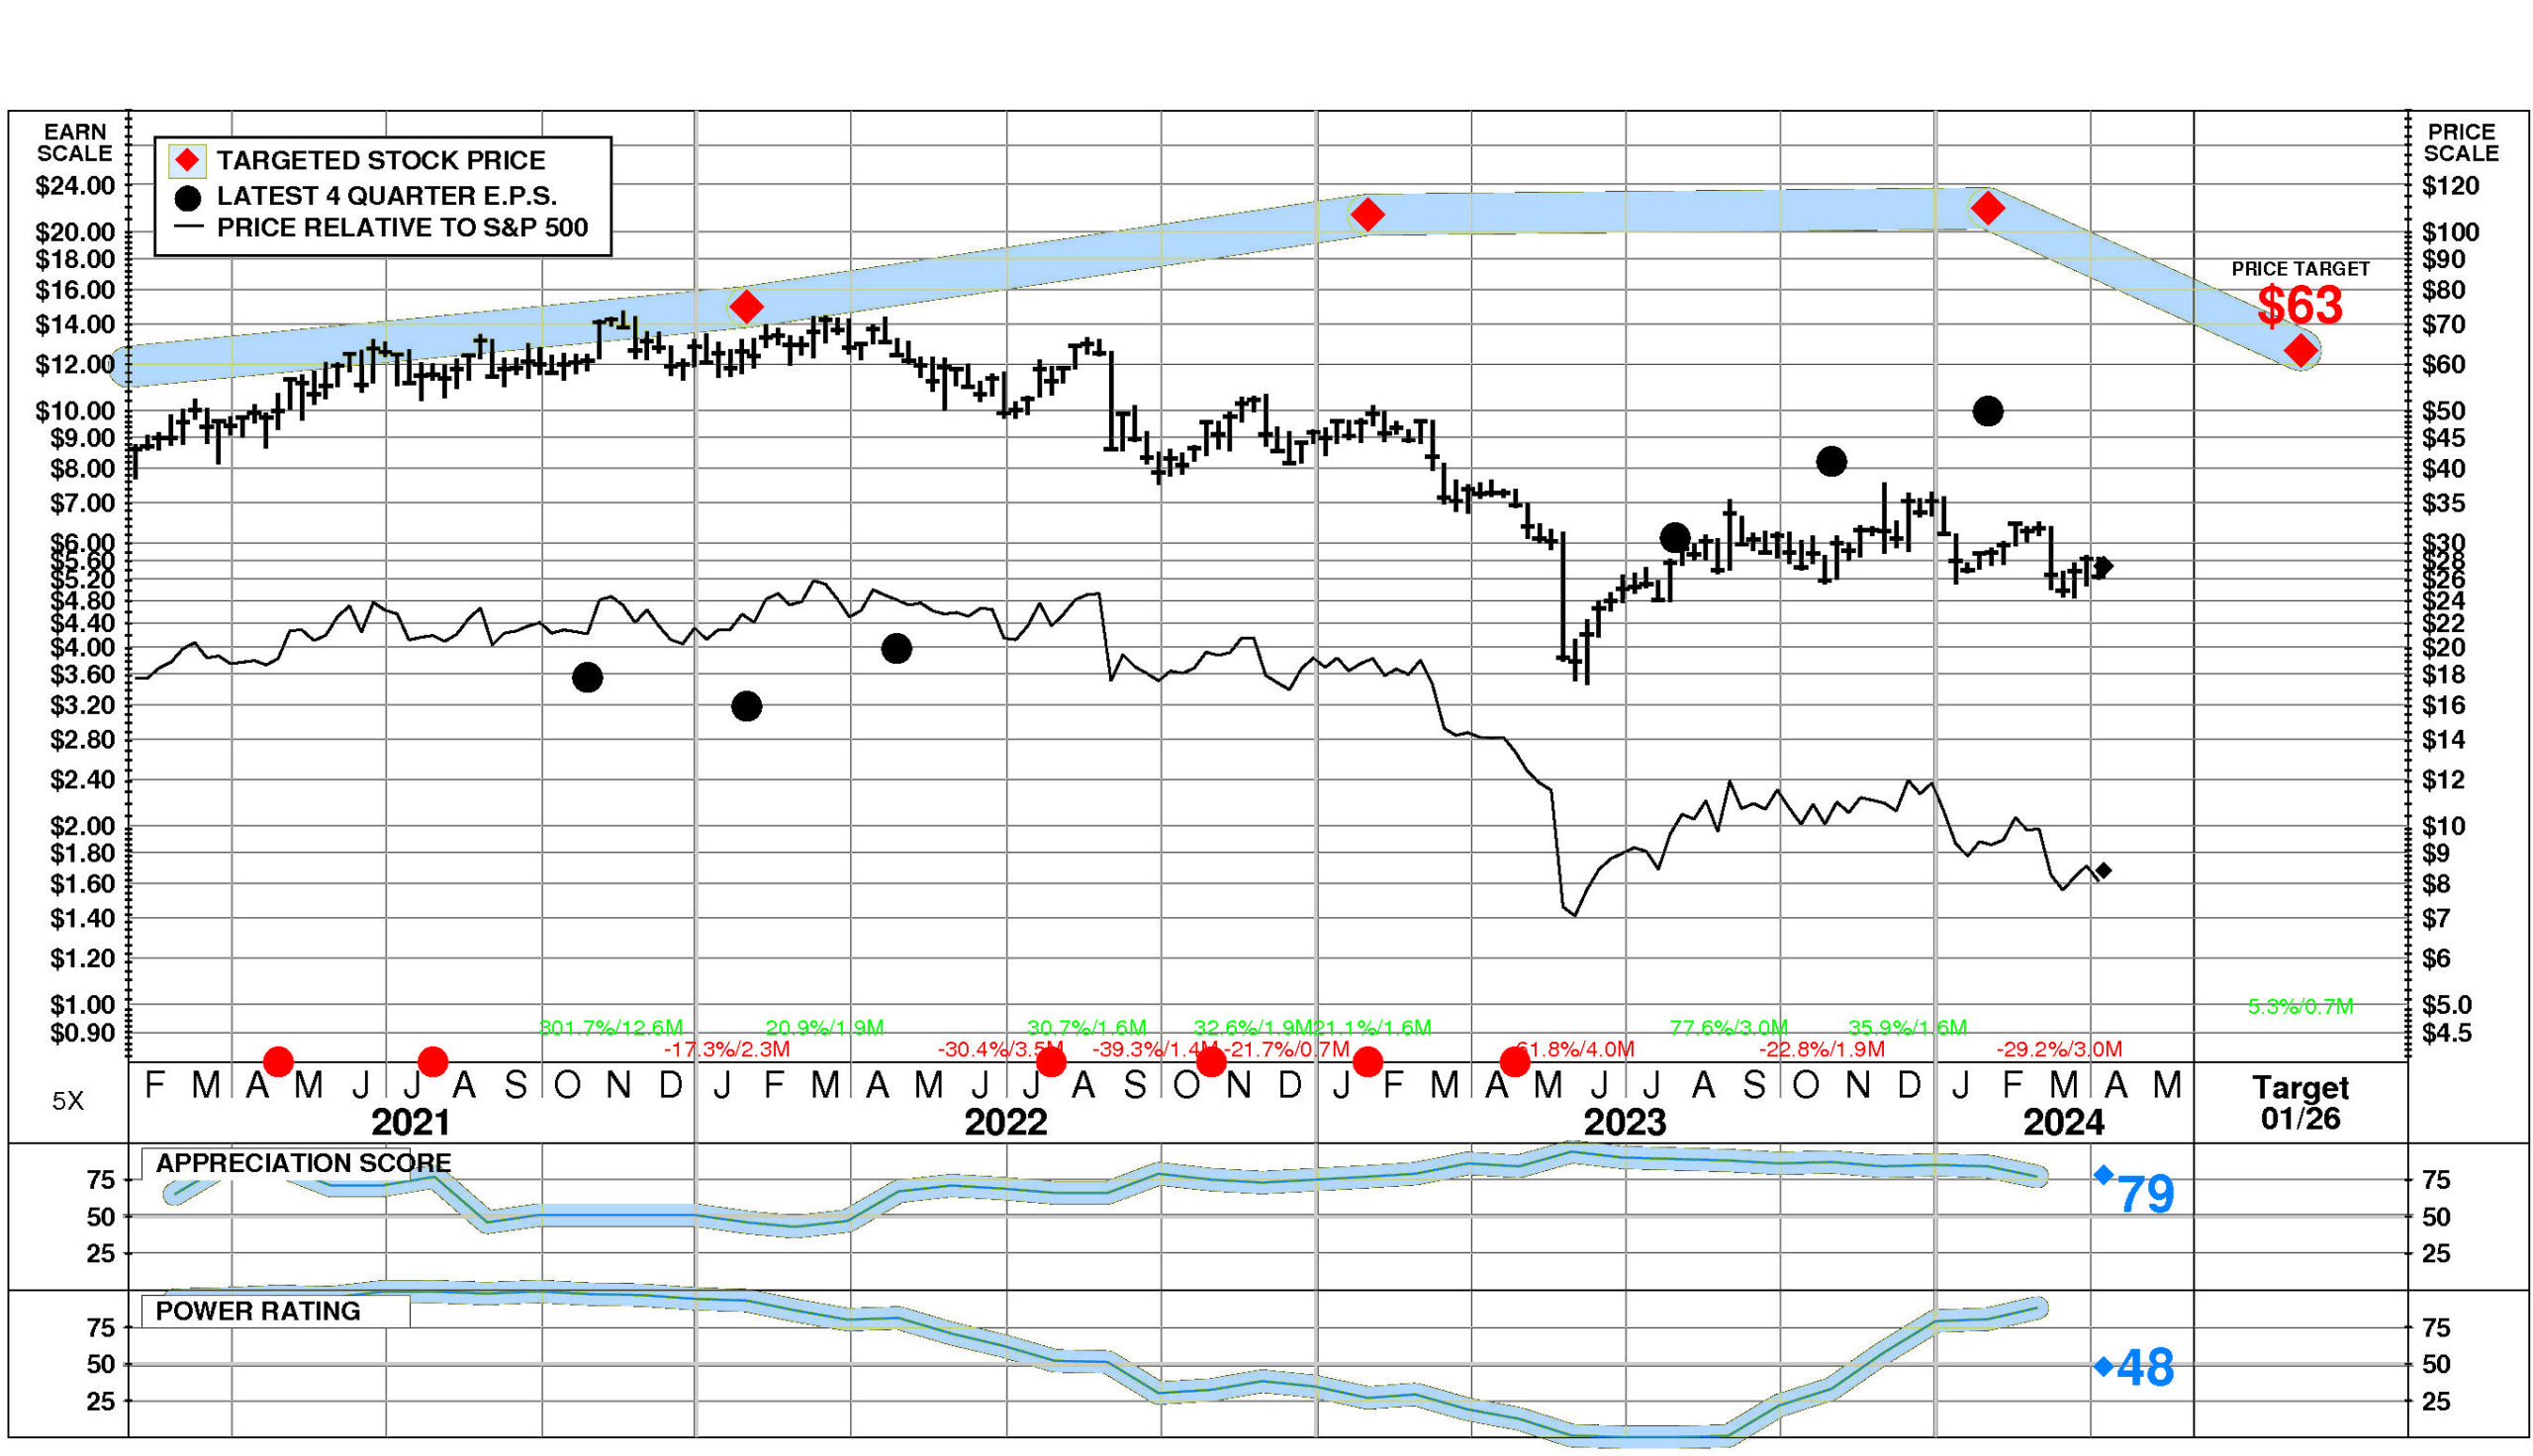
Genesco's stock is selling well below targeted value.
The current stock price of $27.39 compares to targeted value 12 months forward of $63.
Genesco's high appreciation potential results in an appreciation score of 79 (only 21% of the universe has greater appreciation potential.)
Genesco has a Power Rating of 48.
(This neutral Power Rating indicates that GCO's chances of enjoying favorable investment performance over the near to intermediate term are only average.)
Contributing to this neutral Power Rating: GCO's earnings estimates have fallen very significantly in recent months. Offsetting factors are recent price action has been neutral; and the Shoe Stores comparison group is in an extremely strong phase currently.
INVESTMENT PROFILE
Genesco's financial strength is low. Financial strength rating is 18.

Relative to the S&P 500 Composite, Genesco Inc. has slightly more Value than Growth characteristics; its appeal is likely to be to Capital Gain-oriented investors; the perception is that GCO is higher risk.
High expected growth is a positive for Genesco. Relative weaknesses include: low forecasted profitability, low historical profitability, low financial strength, and high stock price volatility. Genesco's valuation is high: low dividend yield, high P/E ratio, and low price/book ratio. GCO has unusually low market capitalization.
CURRENT SIGNALS
Genesco's current operations are eroding.
Return on equity is falling, reflecting: declining pretax margin; and falling leverage.
Genesco's current technical position is mixed.
The stock price is in a 3.0 month down move. The stock has declined 22.6% from its prior high. The 200 day moving average is in an uptrend. The stock price is below its 200 day moving average.
ALERTS
Genesco Inc. (NYSE: GCO) has recently experienced meaningful negative changes in investment behavior: its shorter term price trend turned down.
Positive development: significant quarterly earnings acceleration occurred. Negative development: the stock's power rating fell below 50.
The stock is currently rated B.
Genesco Inc. (NYSE: GCO) stock closed at $27.39 on 4/8/24 after a large increase of 4.3%. Moreover, above average trading volume at 122% of normal accompanied the advance. The stock has declined -2.7% during the last week and has performed in line with the market over the last nine months.
CASH FLOW
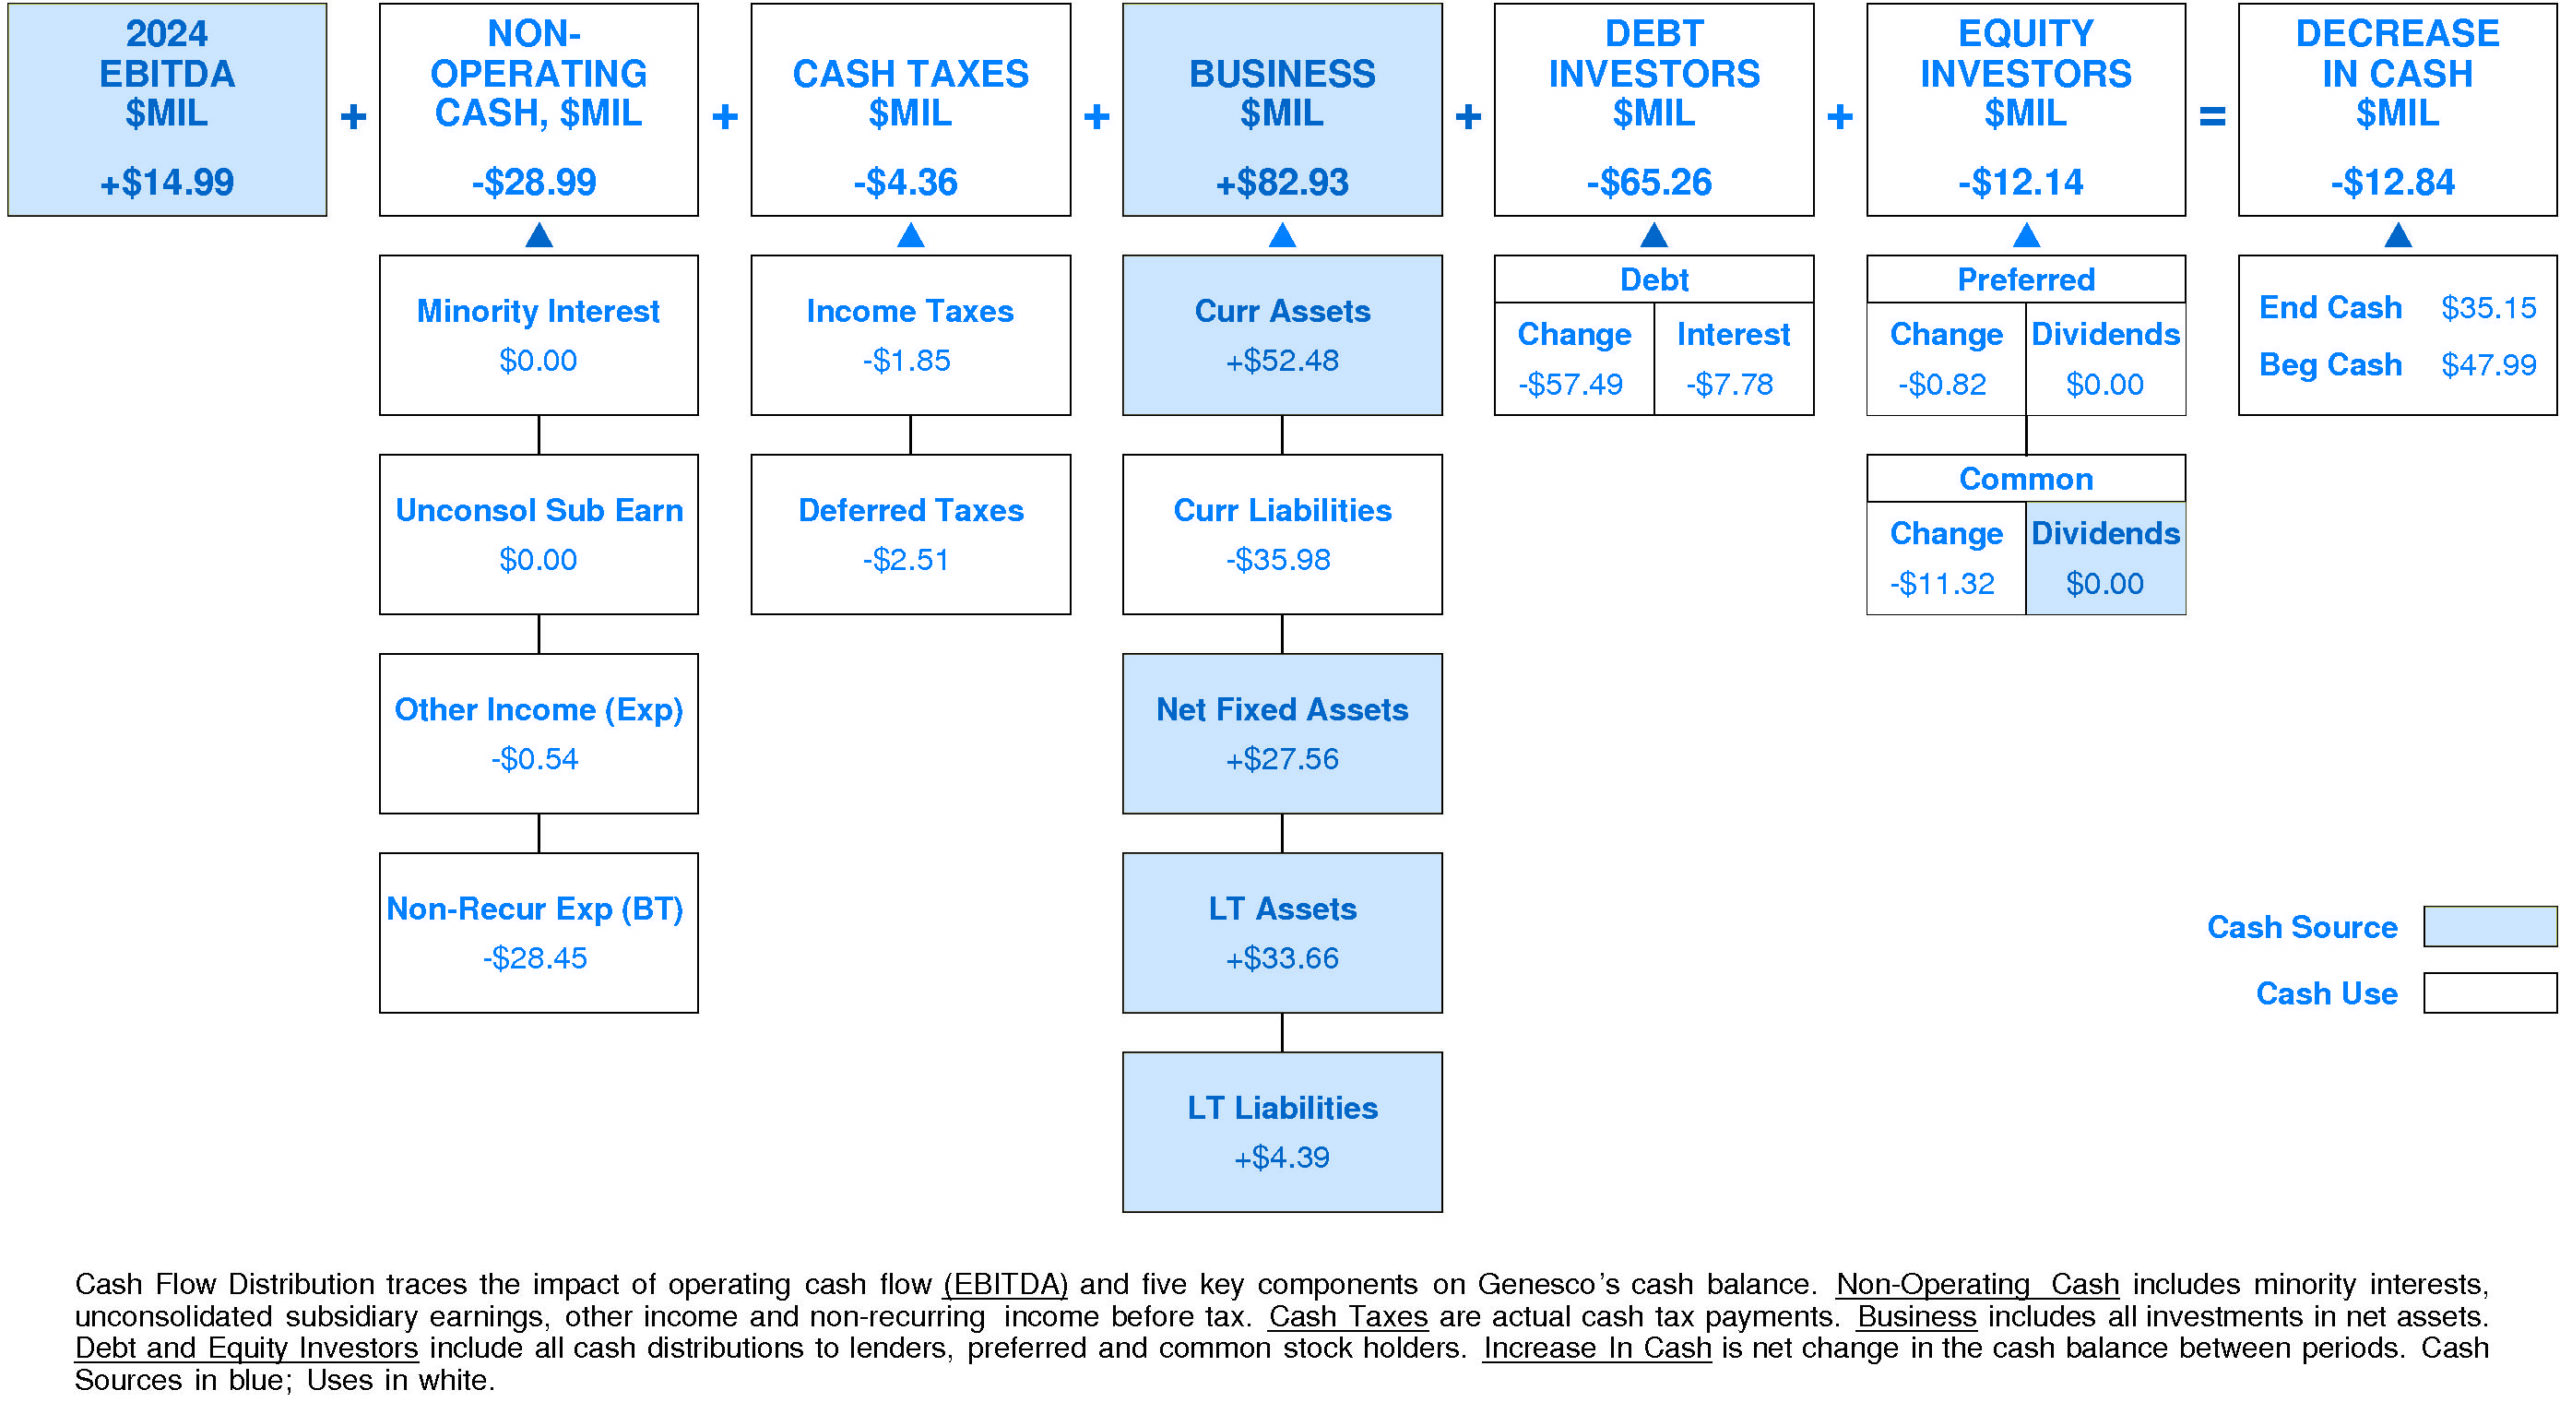
In 2024, Genesco experienced a very significant reduction in cash of -$12.84 million (-27%). Sources of cash were much lower than uses.
Cash generated from 2024 EBITDA totaled +$14.99 million. Non-operating uses consumed -$28.99 million (-193% of EBITDA). Cash taxes consumed -$4.36 million (-29% of EBITDA). Withdrawal of investment from the business totaled +$82.93 million (+553% of EBITDA). On a net basis, debt investors removed -$65.26 million (-435% of EBITDA) while equity investors withdrew -$12.14 million (-81% of EBITDA).
Genesco's Non-operating Income, %EBITDA has suffered a volatile overall downtrend over the period.
This downtrend was accompanied by a similar trend for the Genesco Peer Group. (Since 2022 Non-operating Income, %EBITDA has accelerated very sharply.) In most years, Genesco was in the second quartile and top quartile. Currently, Genesco is lower quartile at -193% of EBITDA (-$28.99 million).
Genesco's Cash Taxes, %EBITDA enjoyed a volatile overall uptrend over the period.
This improvement was accompanied by a similar trend for the Genesco Peer Group. In most years, Genesco was in the third quartile and lower quartile. Currently, Genesco is lower quartile at -29% of EBITDA (-$4.36 million).
Genesco's Business Re-investment, %EBITDA has enjoyed a volatile overall uptrend over the period.
This improvement was accompanied by an opposite trend for the Genesco Peer Group. In most years, Genesco was in the top quartile and third quartile. Currently, Genesco is upper quartile at +553% of EBITDA (+$82.93 million).
Genesco's Debt Investors, %EBITDA has experienced a volatile overall downtrend over the period.
This downtrend was accompanied by an opposite trend for the Genesco Peer Group. In most years, Genesco was in the top quartile and lower quartile. Currently, Genesco is lower quartile at -435% of EBITDA (-$65.26 million).
Genesco's Equity Investors, %EBITDA has suffered a volatile overall downtrend over the period.
This downtrend was accompanied by stability for the Genesco Peer Group. (Since 2021 Equity Investors, %EBITDA has accelerated very sharply.) In most years, Genesco was in the third quartile and lower quartile. Currently, Genesco is lower quartile at -81% of EBITDA (-$12.14 million).
Genesco's Change in Cash, %EBITDA has experienced a volatile overall downtrend over the period.
This downtrend was accompanied by stability for the Genesco Peer Group. In most years, Genesco was in the top quartile and lower quartile. Currently, Genesco is lower quartile at -86% of EBITDA (-$12.84 million).
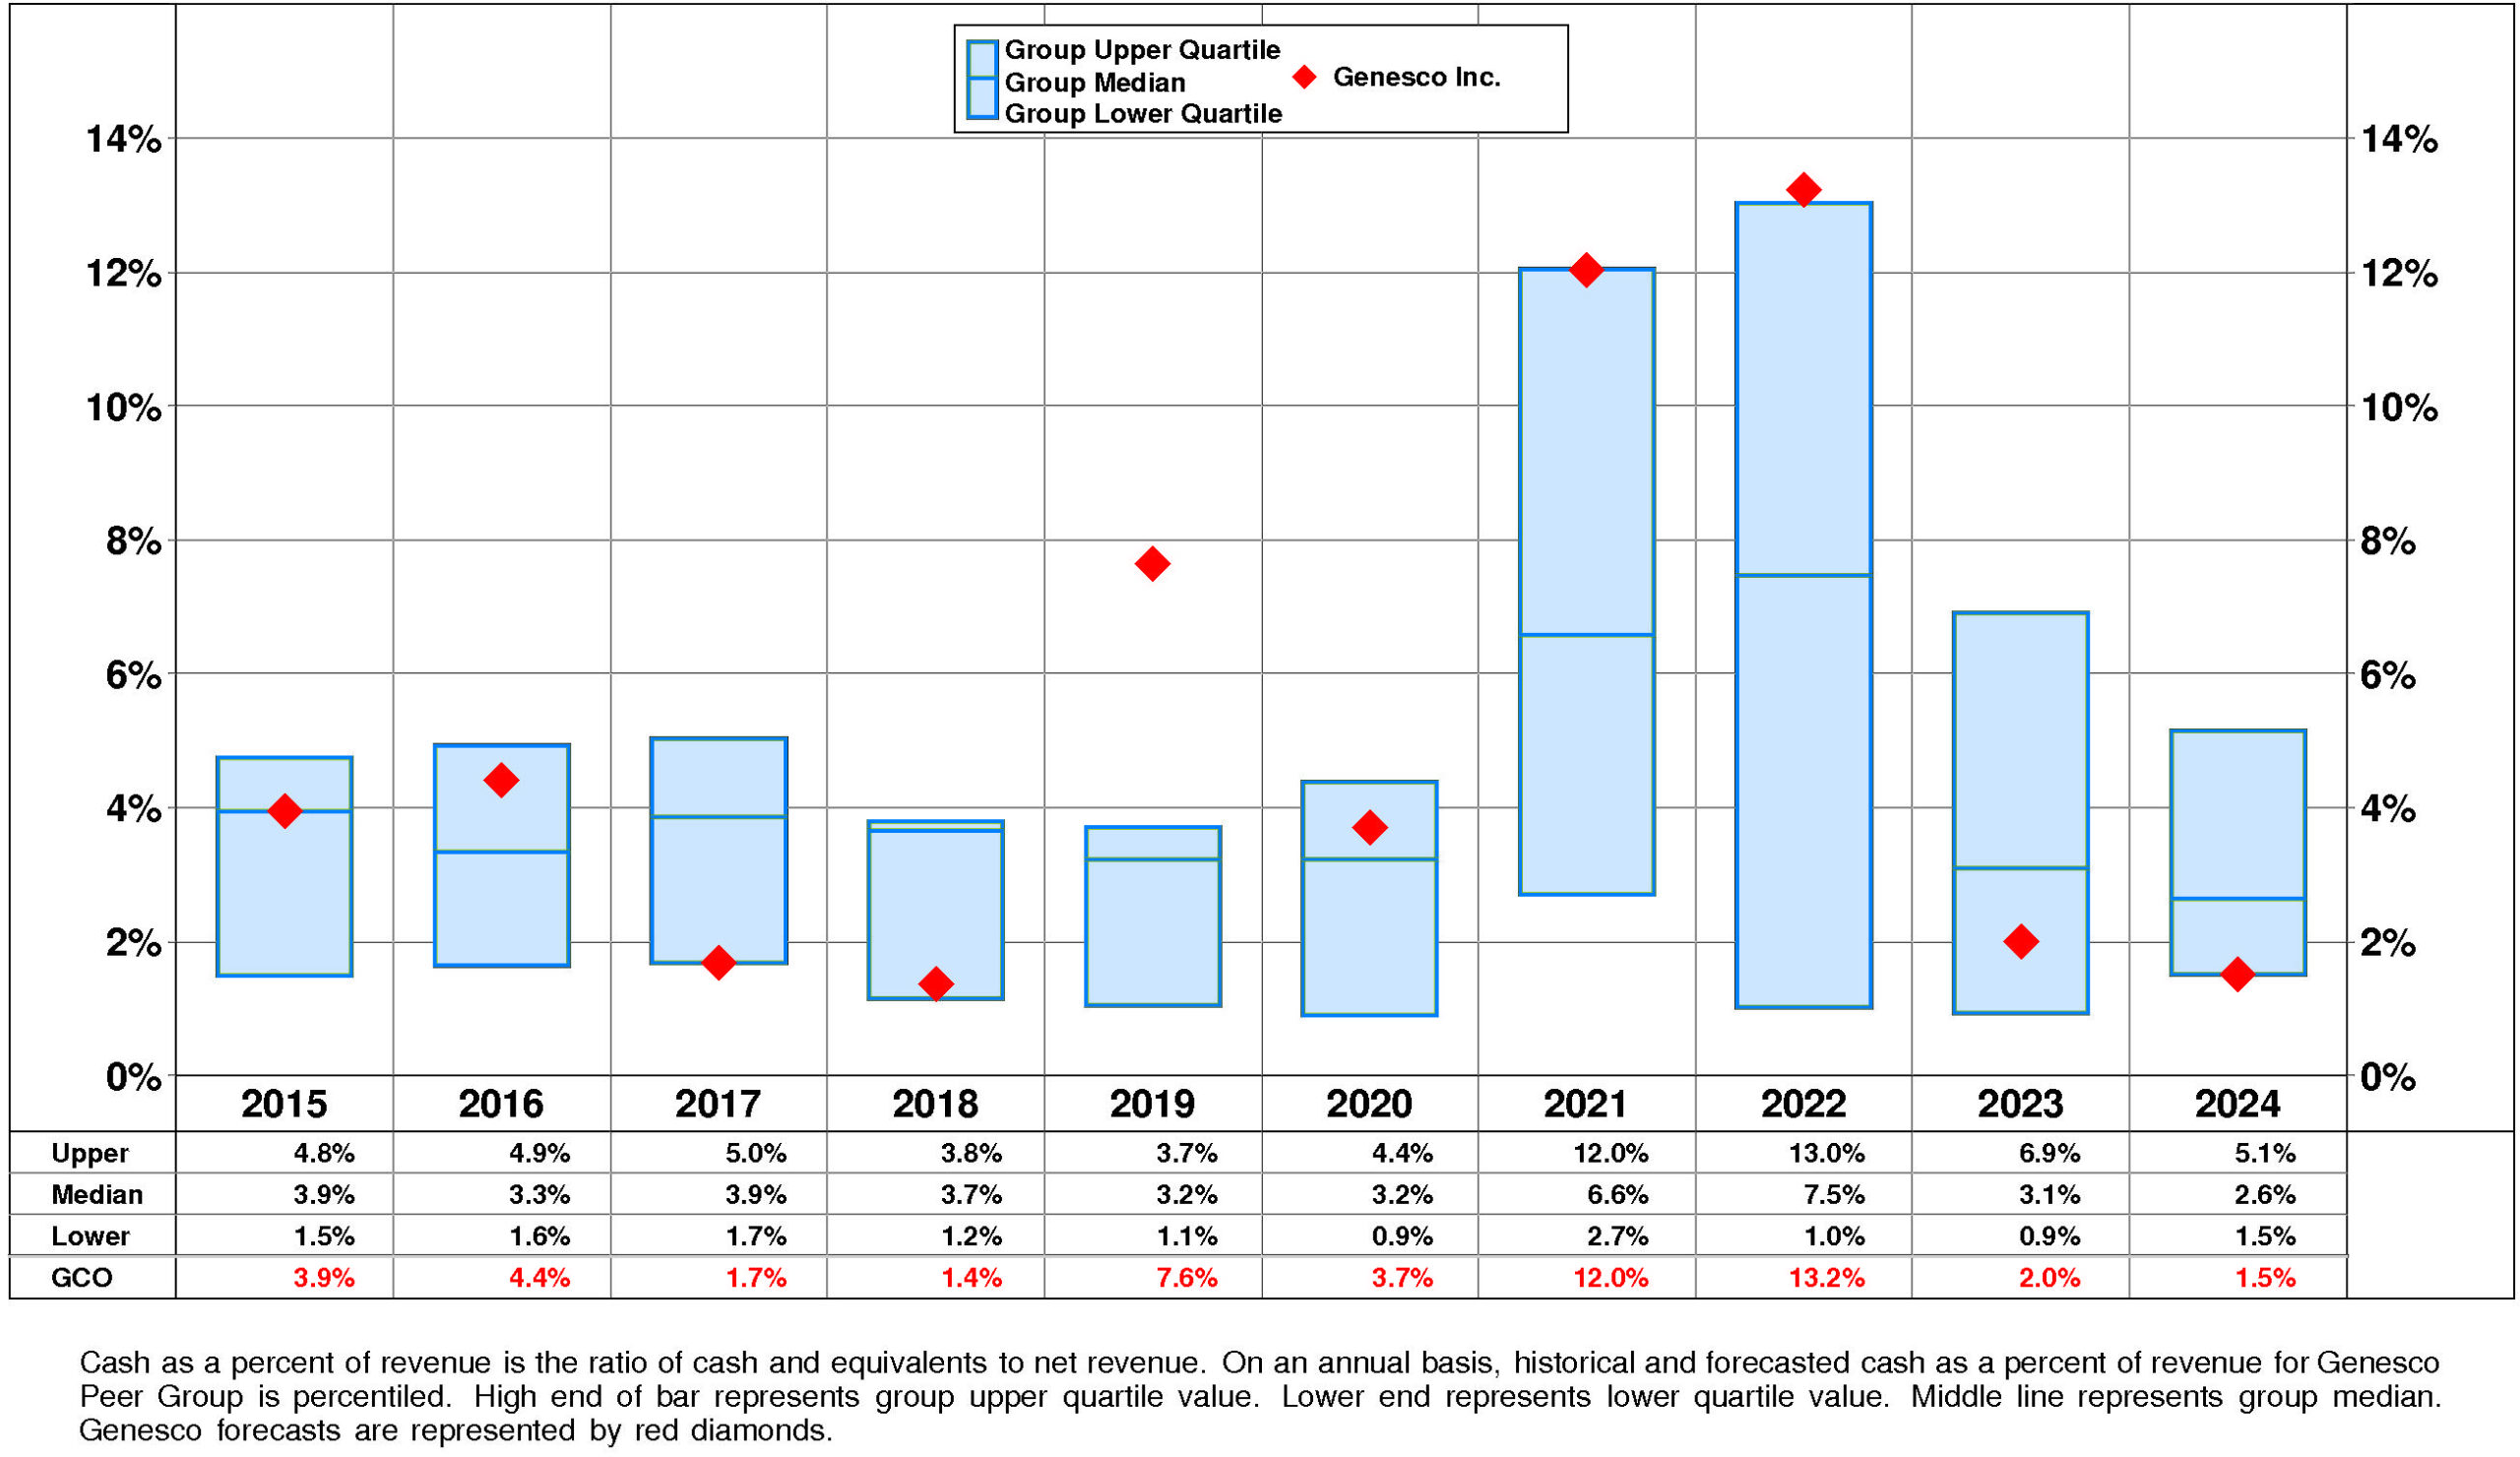
Genesco's Cash, %Revenue has exhibited little to no overall change over the period.
This stability was accompanied by stability for the Genesco Peer Group as well. (Since 2022 Cash, %Revenue has experienced a very sharp decline.) In most years, Genesco was in the third quartile and top quartile. Currently, Genesco is at the lower quartile at +2%.
PROFITABILITY
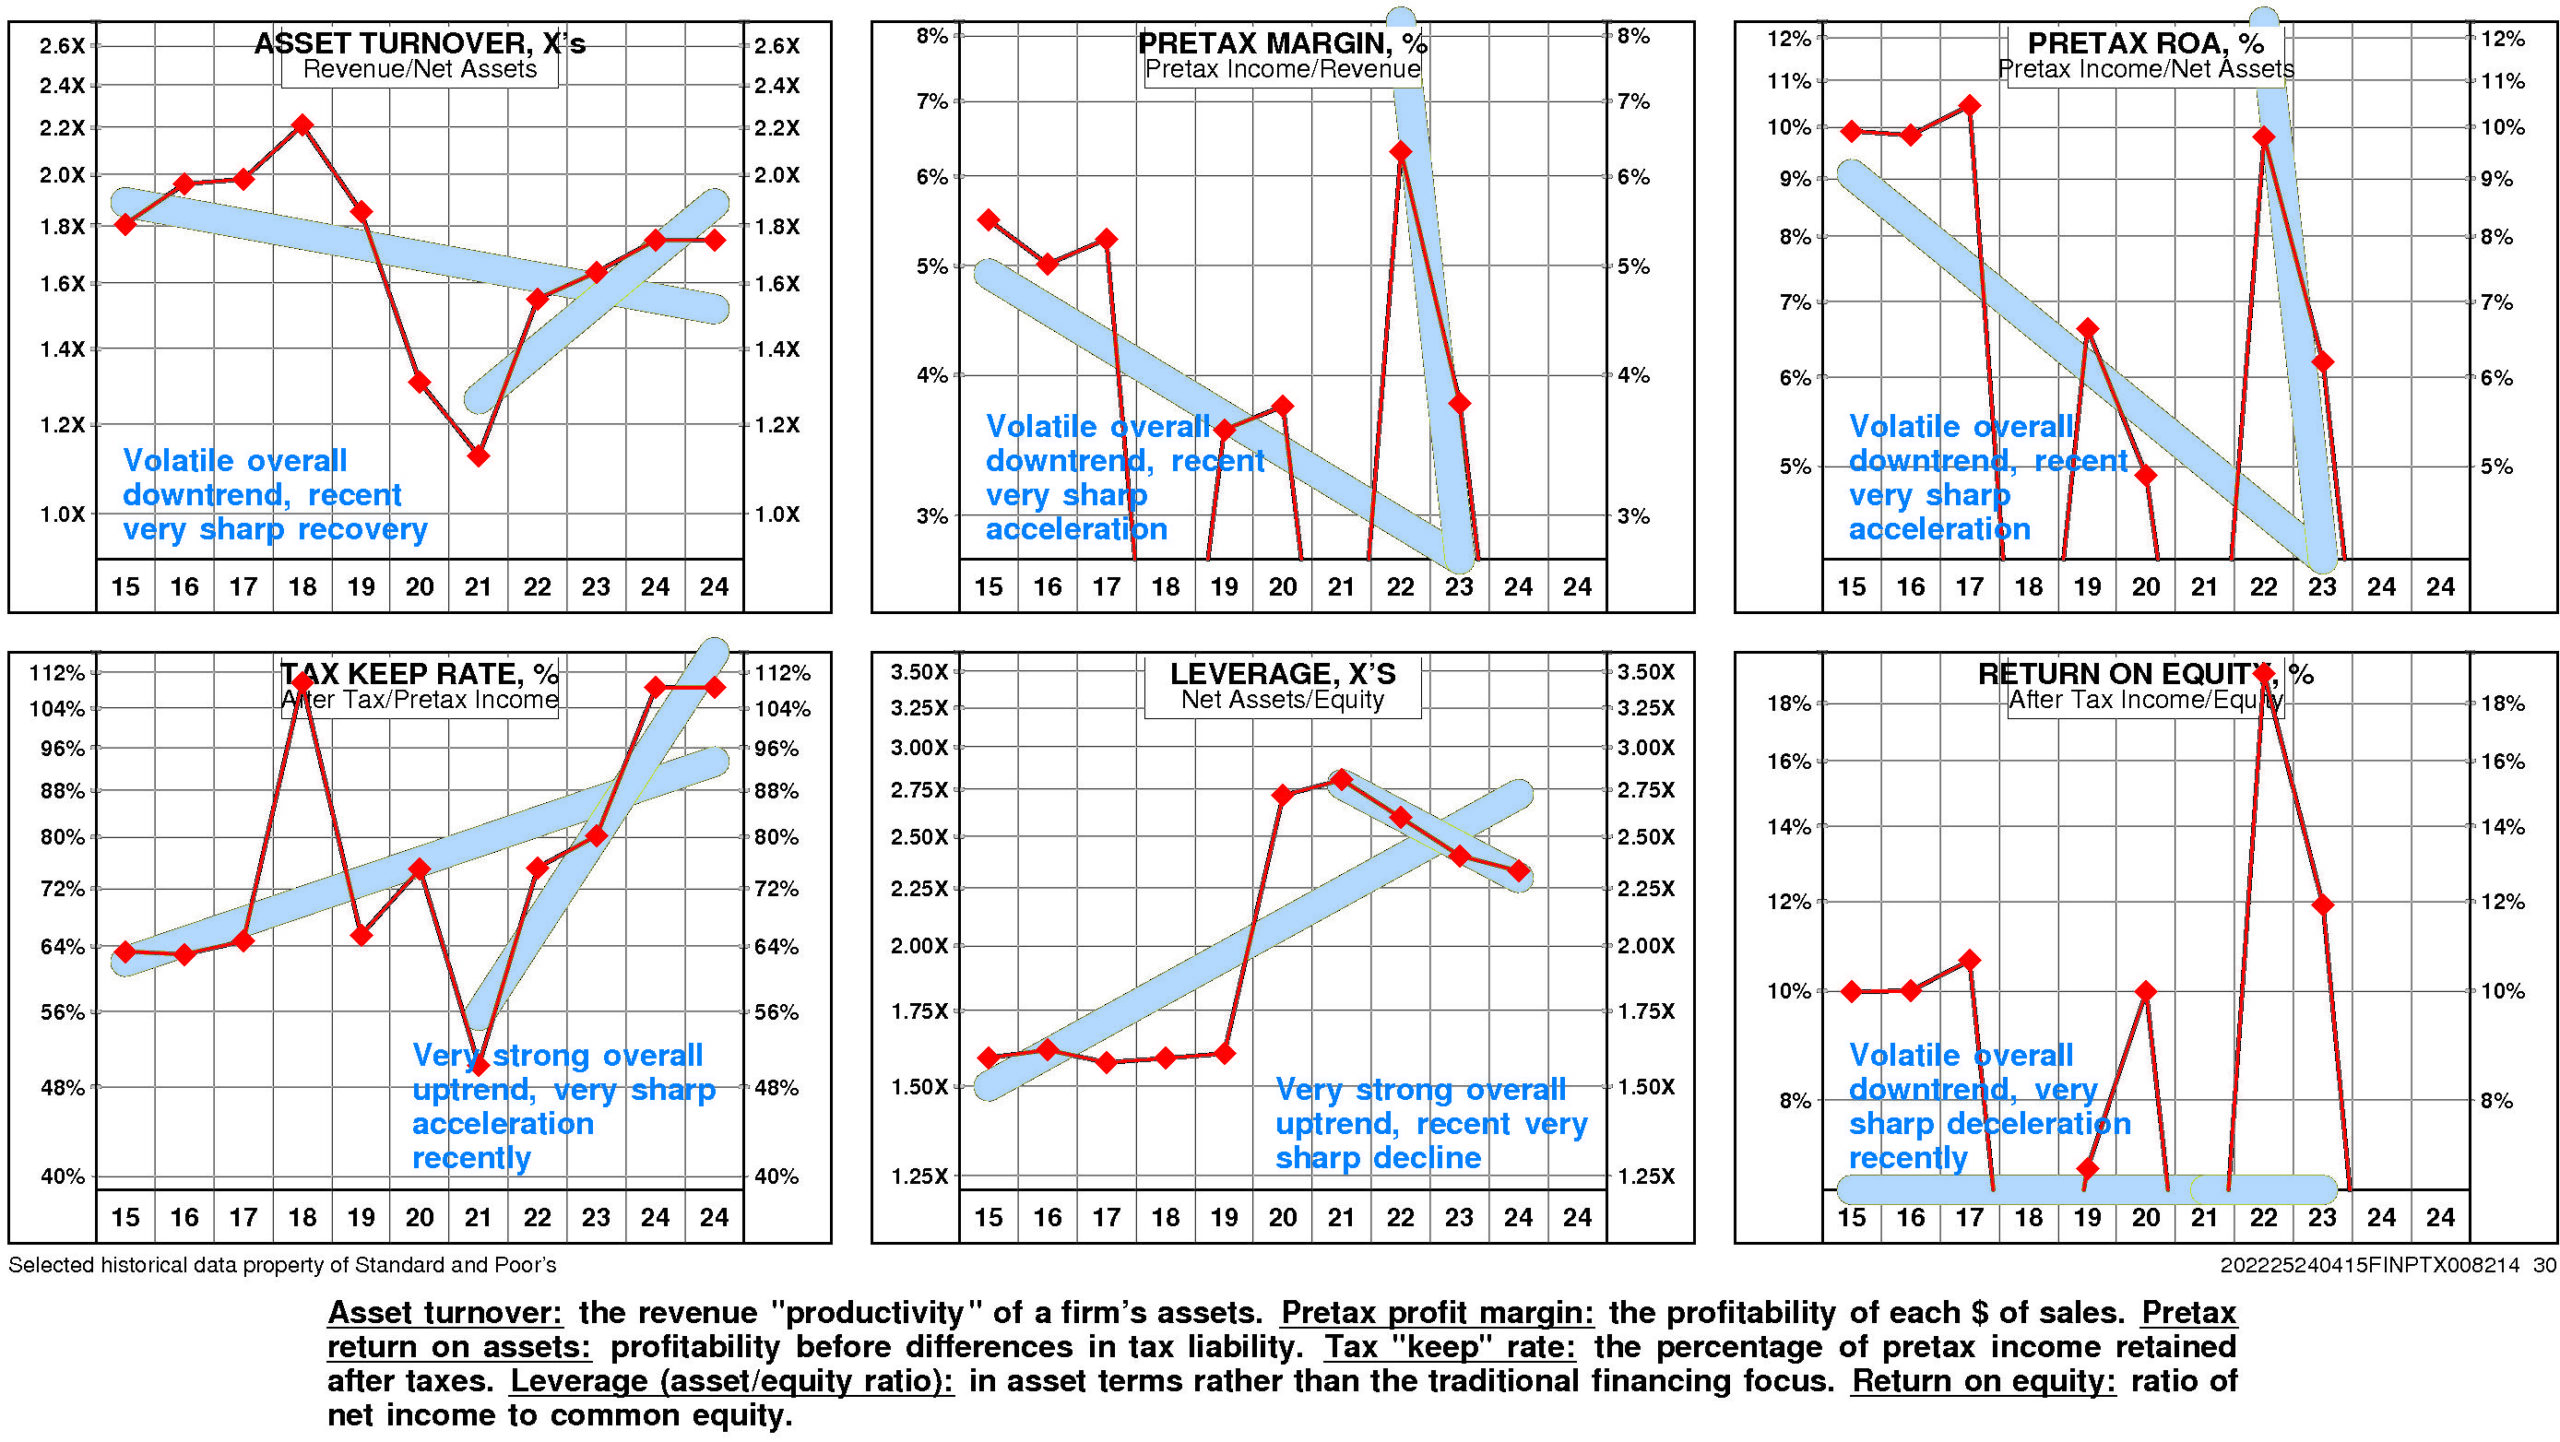
Genesco's return on equity has eroded very significantly since 2015.
A major analytical focus for GCO is a very strong negative trend in pretax operating return significantly offset by a very strong positive trend in non-operating factors.
The productivity of Genesco's assets declined over the full period 2015-2024: asset turnover has experienced a downtrend even as it experienced a very sharp recovery after the 2021 low.
Reinforcing this trend, pretax margin experienced a strong overall downtrend that accelerated very sharply from the 2022 level.
Non-operating factors (income taxes and financial leverage) had a very significant positive influence on return on equity.
Genesco's return on equity is unavailable for the four quarters ended January, 2024.
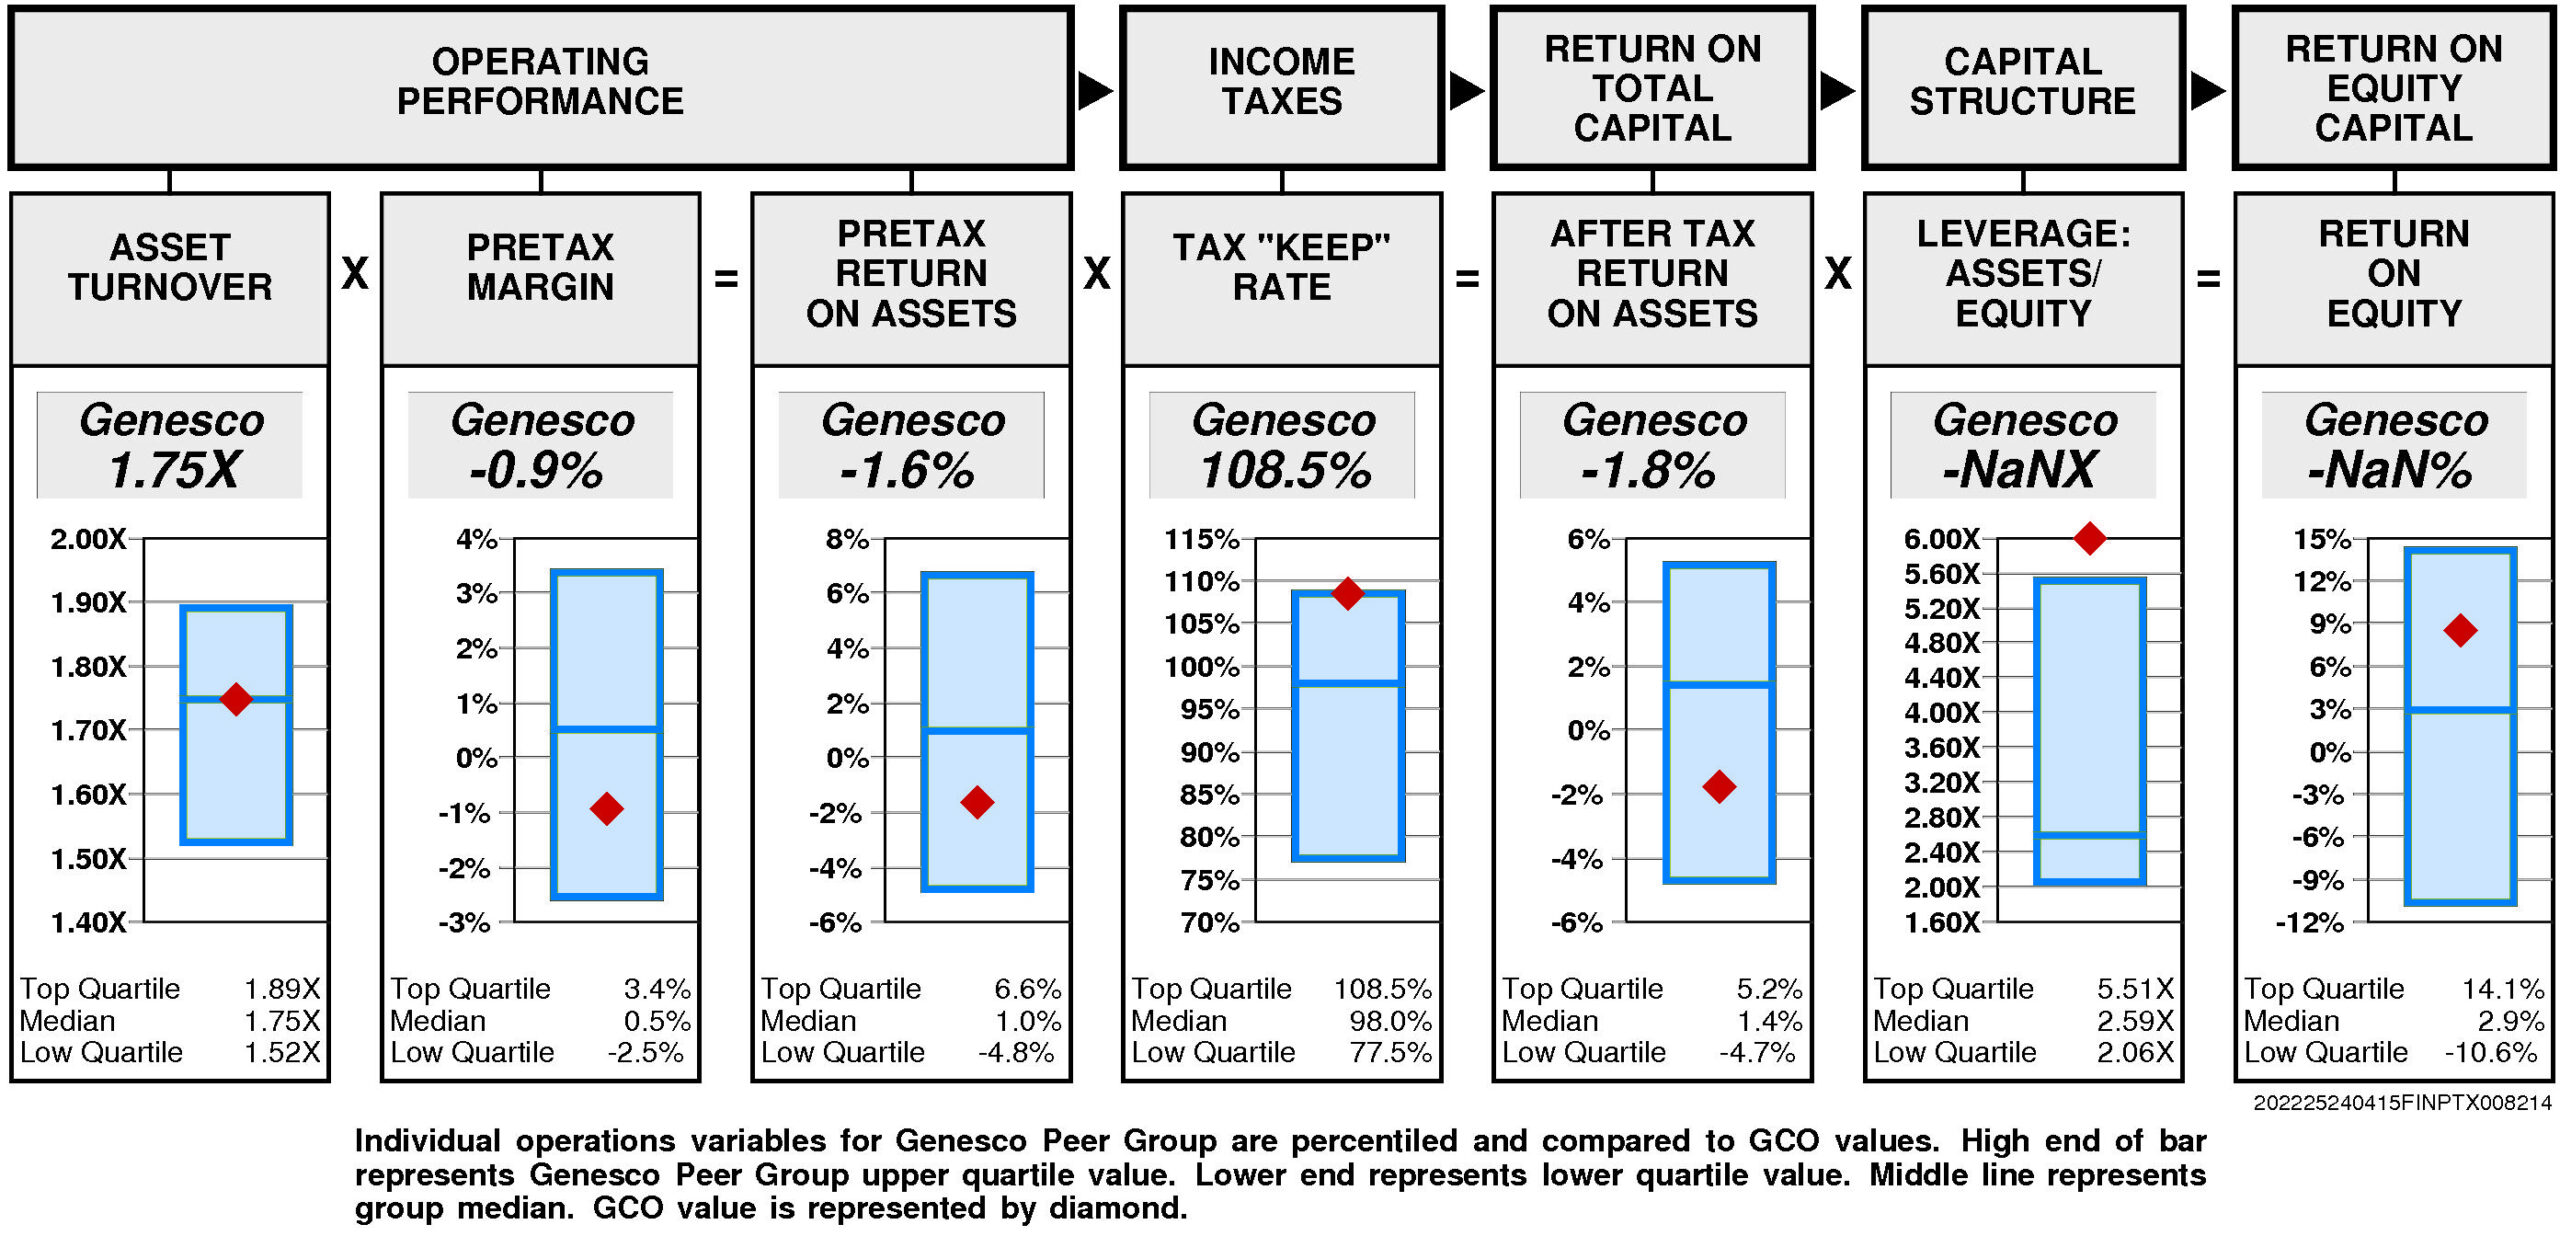
Operating performance (pretax return on assets) is below median (-1.6%) reflecting asset turnover that is at median (1.75X) and below median pretax margin (-0.9%).
Tax “keep” rate (income tax management) is at the upper quartile (108.5%) resulting in after tax return on assets that is below median.
Financial leverage (leverage) is unavailable .
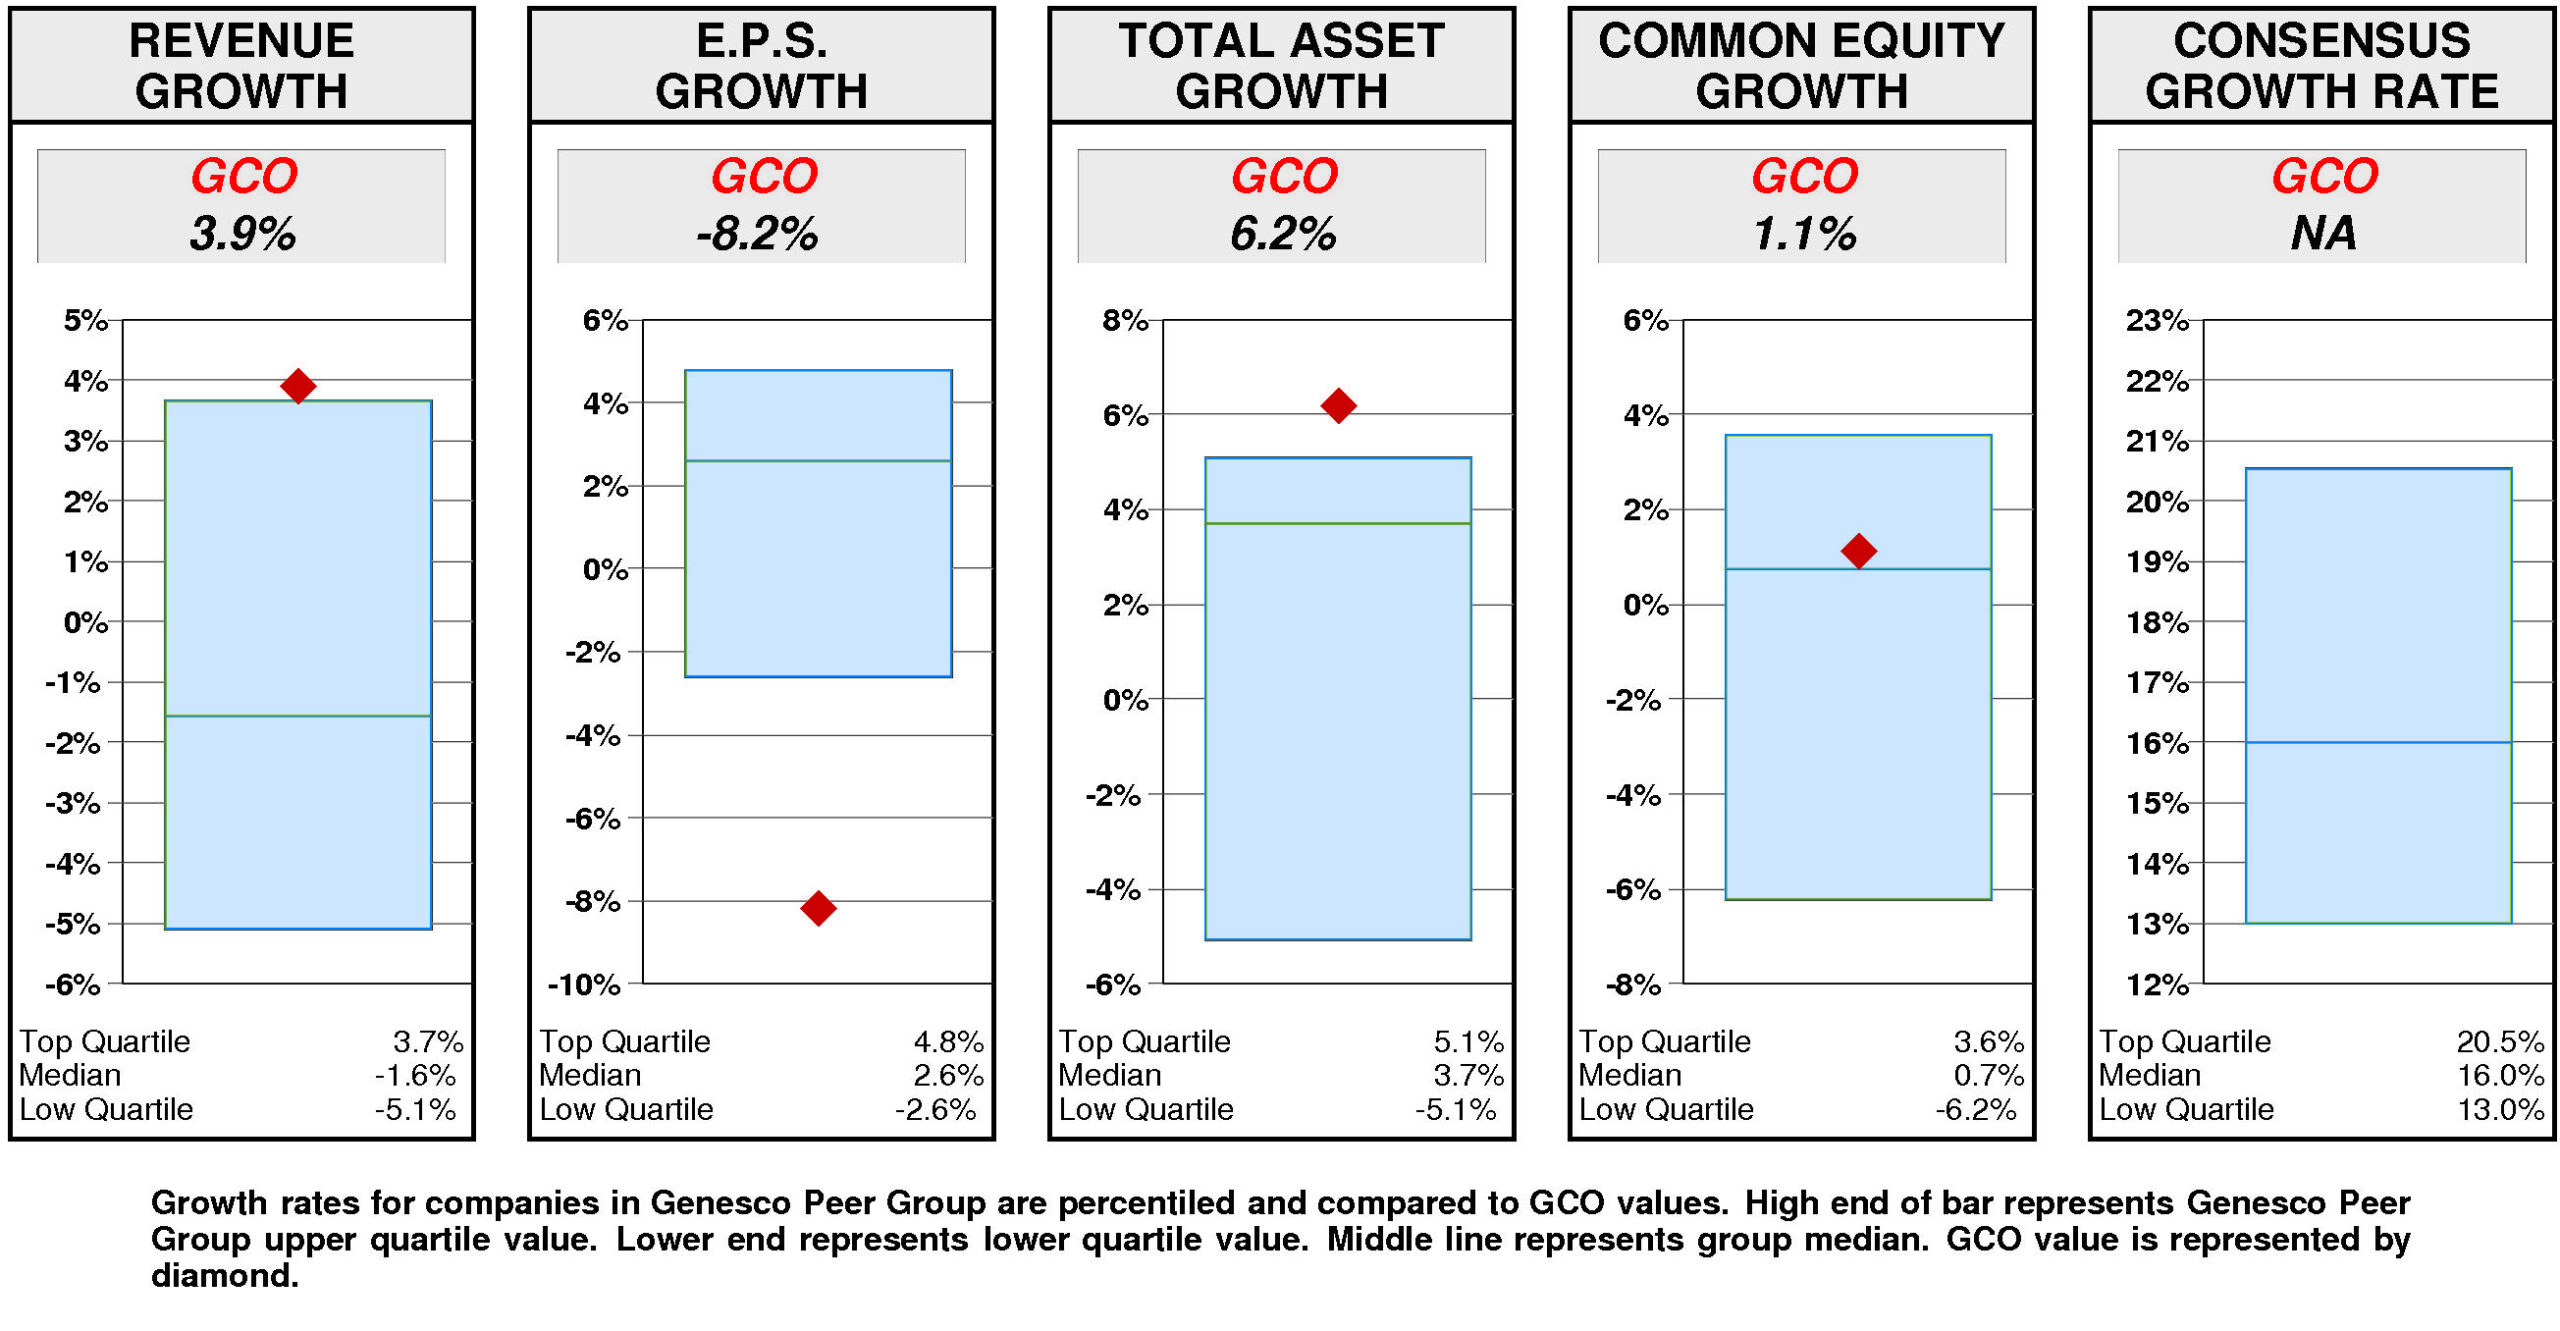
GROWTH RATES
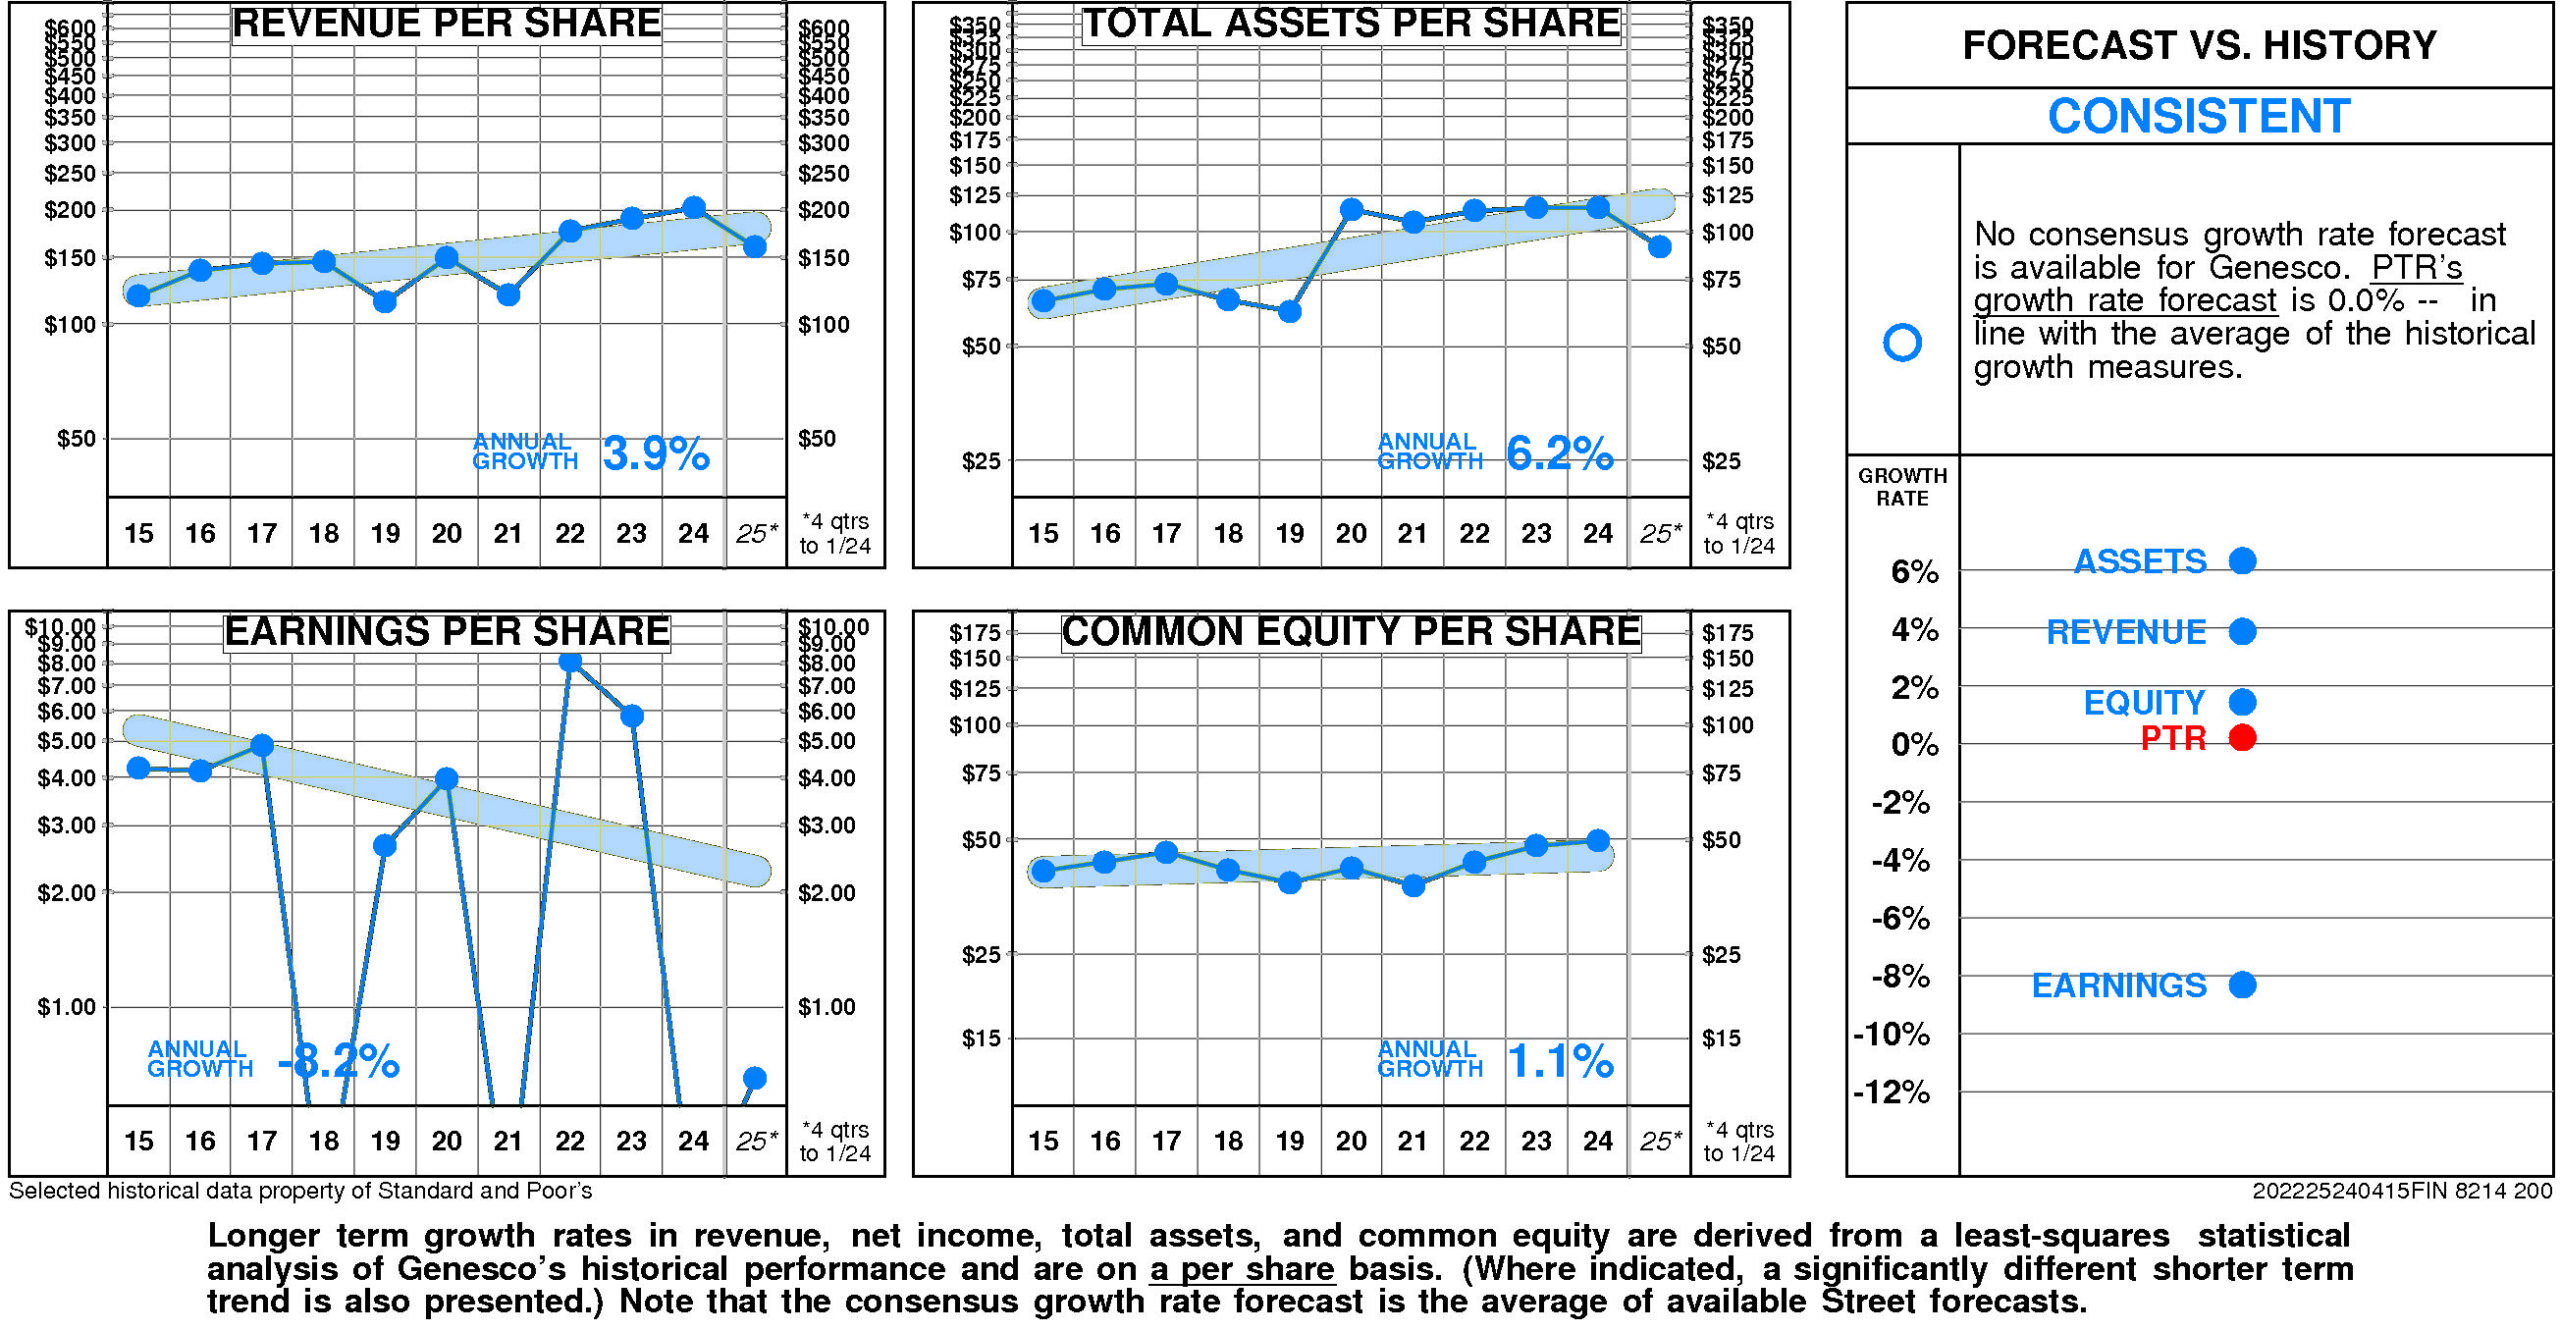
There are no significant differences between Genesco's longer term growth and growth in recent years.
Genesco's historical income statement growth and balance sheet growth have diverged. Revenue growth has paralleled asset growth; earnings growth has fallen short of equity growth.
Annual revenue growth
has been 3.9% per year.
Total asset growth
has been 6.2% per year.
Annual E.P.S. growth
has been -8.2% per year.
Equity growth
has been 1.1% per year.
No consensus growth rate forecast is available for Genesco.
Relative to the Genesco Peer Group, Genesco's historical growth measures are erratic.
Revenue growth (3.9%) has been upper quartile. Total asset growth (6.2%) has been upper quartile. Equity growth (1.1%) has been slightly above median. E.P.S. growth (-8.2%) has been lower quartile.
Consensus growth forecast is unavailable.
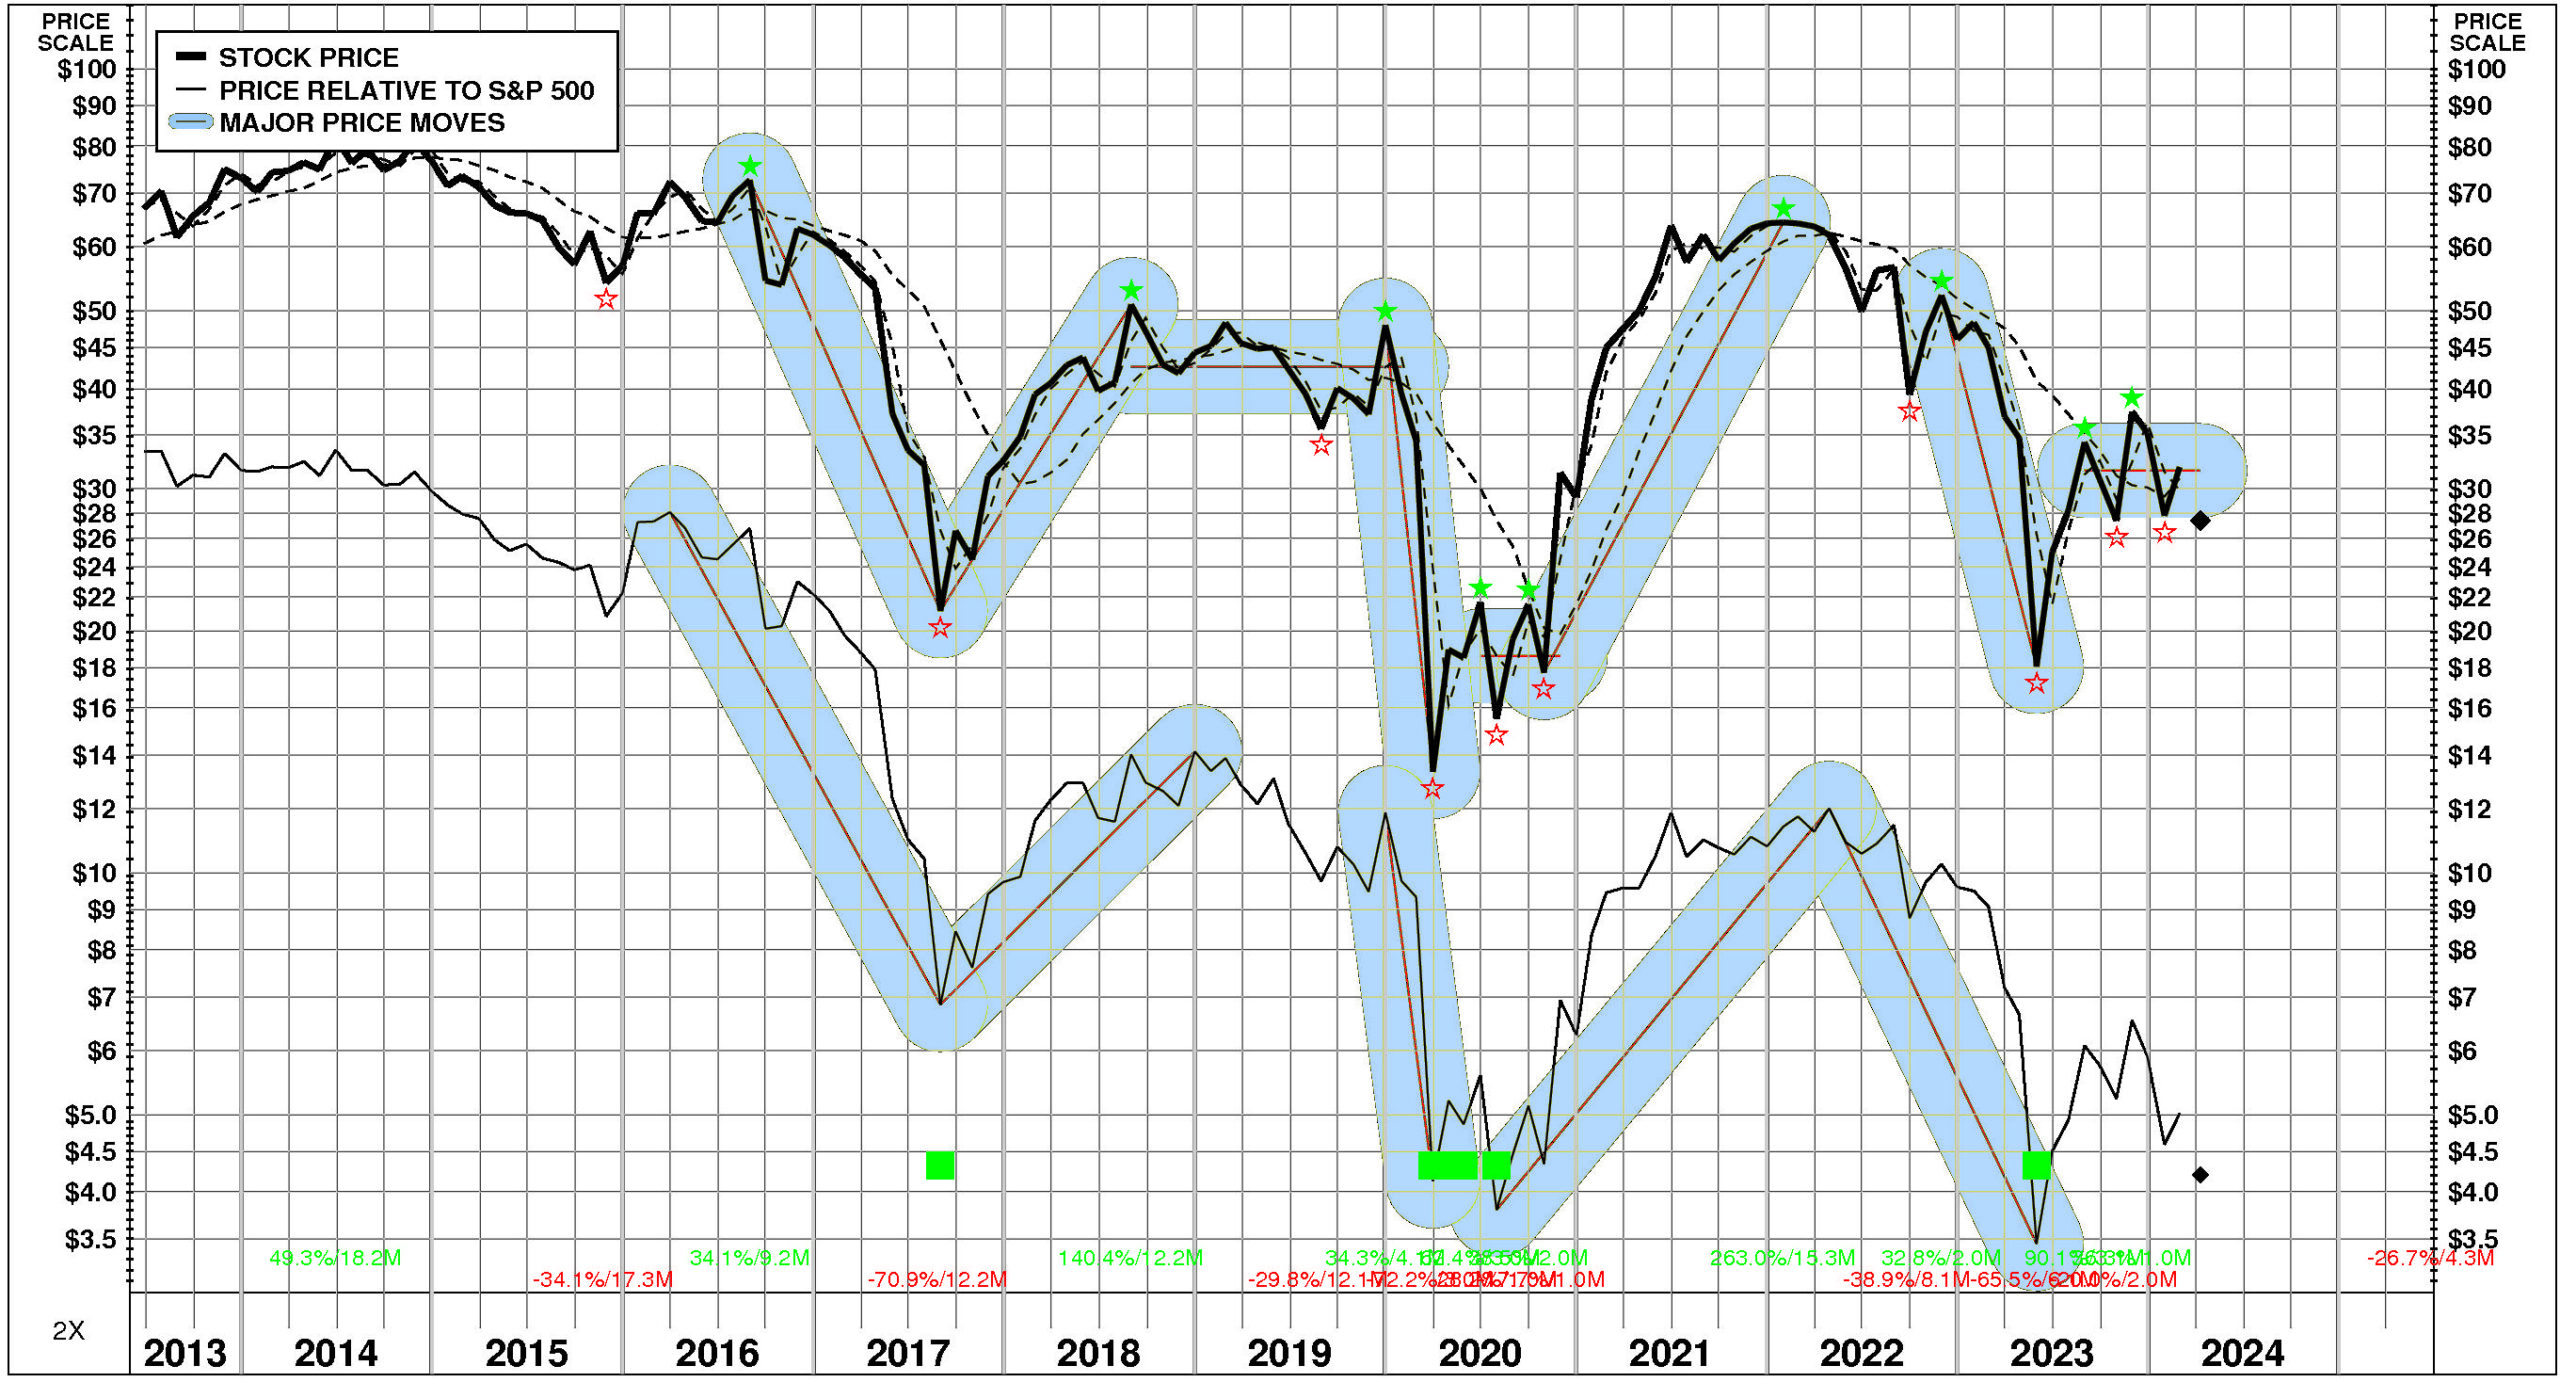
PRICE HISTORY
Over the full time period, Genesco's stock price performance has been volatile and significantly below market.
Between June, 2013 and April, 2024, Genesco's stock price fell -59%; relative to the market, this was a -87% loss. Significant price moves during the period: 1) November, 2022 – May, 2023: -65%; 2) October, 2020 – January, 2022: +263%; 3) December, 2019 – March, 2020: -72%; 4) August, 2017 – August, 2018: +140%; and 5) August, 2016 – August, 2017: -71%.
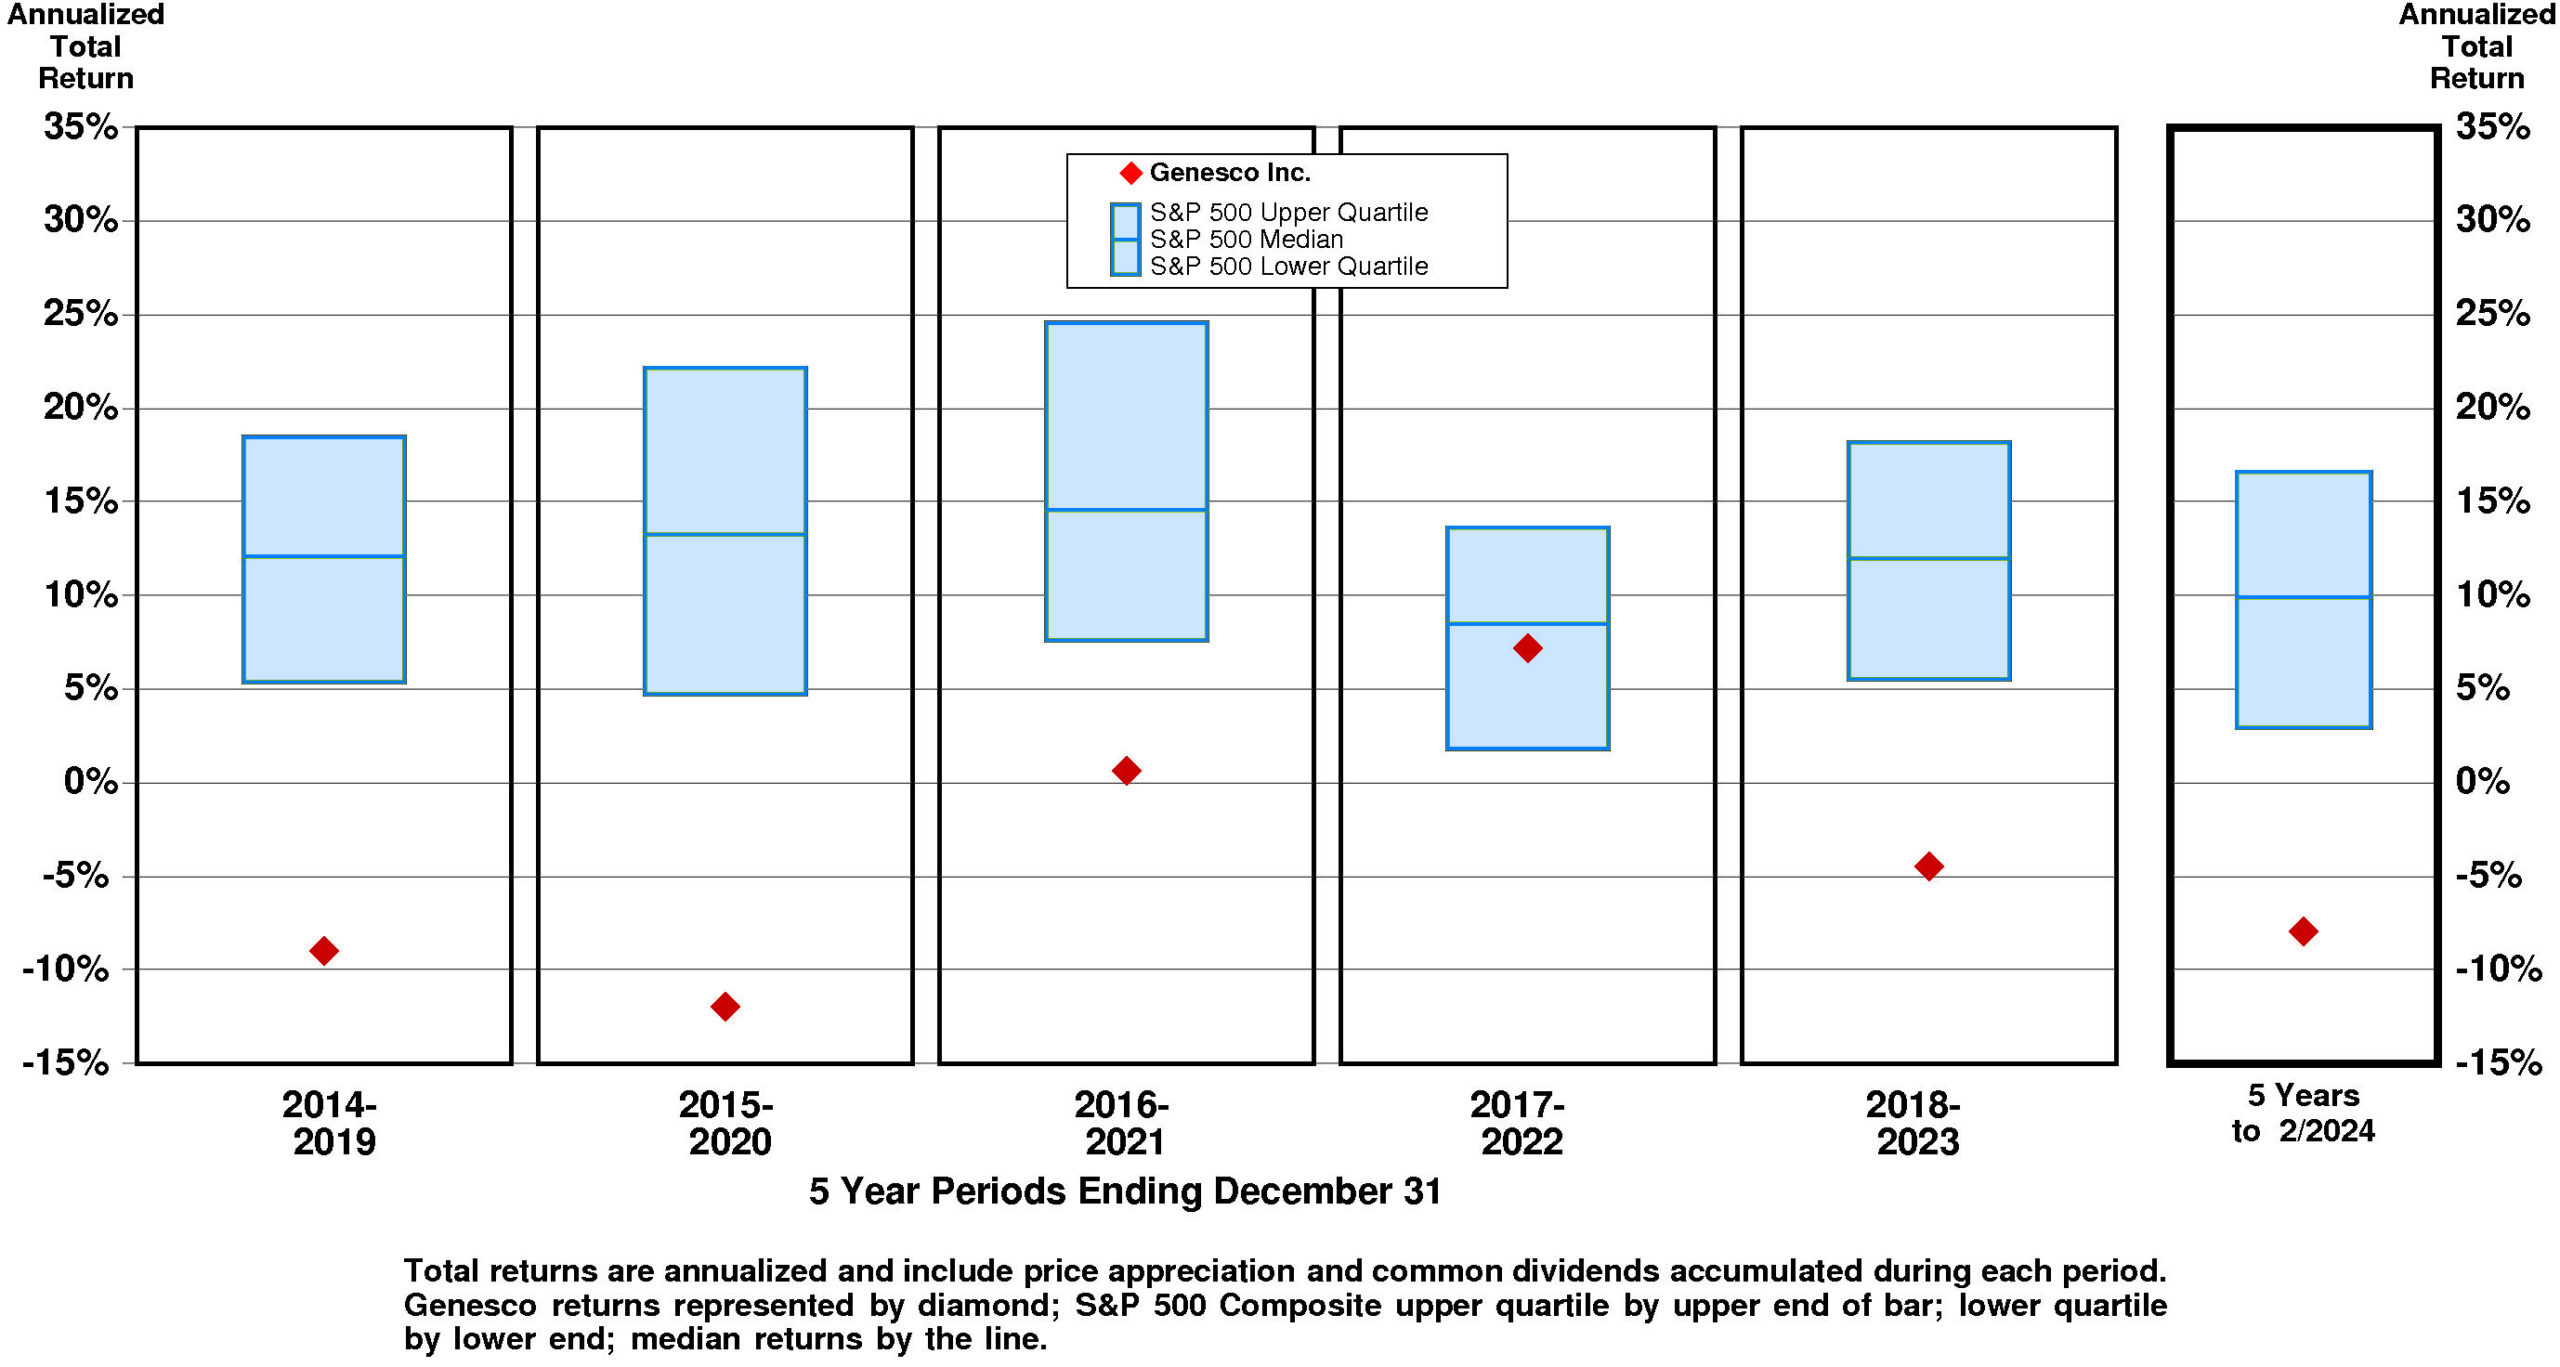
TOTAL INVESTMENT RETURNS
Current annual total return performance of -29.0% is lower quartile relative to the S&P 500 Composite.
In addition to being lower quartile relative to S&P 500 Composite, current annual total return performance through February, 2024 of -29.0% is lower quartile relative to Genesco Inc. Peer Group.
Current 5-year total return performance of -7.9% is lower quartile relative to the S&P 500 Composite.
Through February, 2024, with lower quartile current 5-year total return of -7.9% relative to S&P 500 Composite, Genesco's total return performance is substantially below median relative to Genesco Inc. Peer Group.
VALUATION BENCHMARKS
Relative to S&P 500 Composite, GCO's overall valuation is low.
Ratio of enterprise value/earnings before interest and taxes is upper quartile. Ratio of enterprise value/assets is lower quartile. Price/equity ratio is lower quartile. Ratio of enterprise value/revenue is lower quartile. Price/earnings ratio is unavailable.
Relative to Genesco Peer Group, GCO's overall valuation is normal.
Ratio of enterprise value/earnings before interest and taxes is upper quartile. Ratio of enterprise value/revenue is slightly below median. Ratio of enterprise value/assets is near the lower quartile. Price/equity ratio is lower quartile. Price/earnings ratio is unavailable.
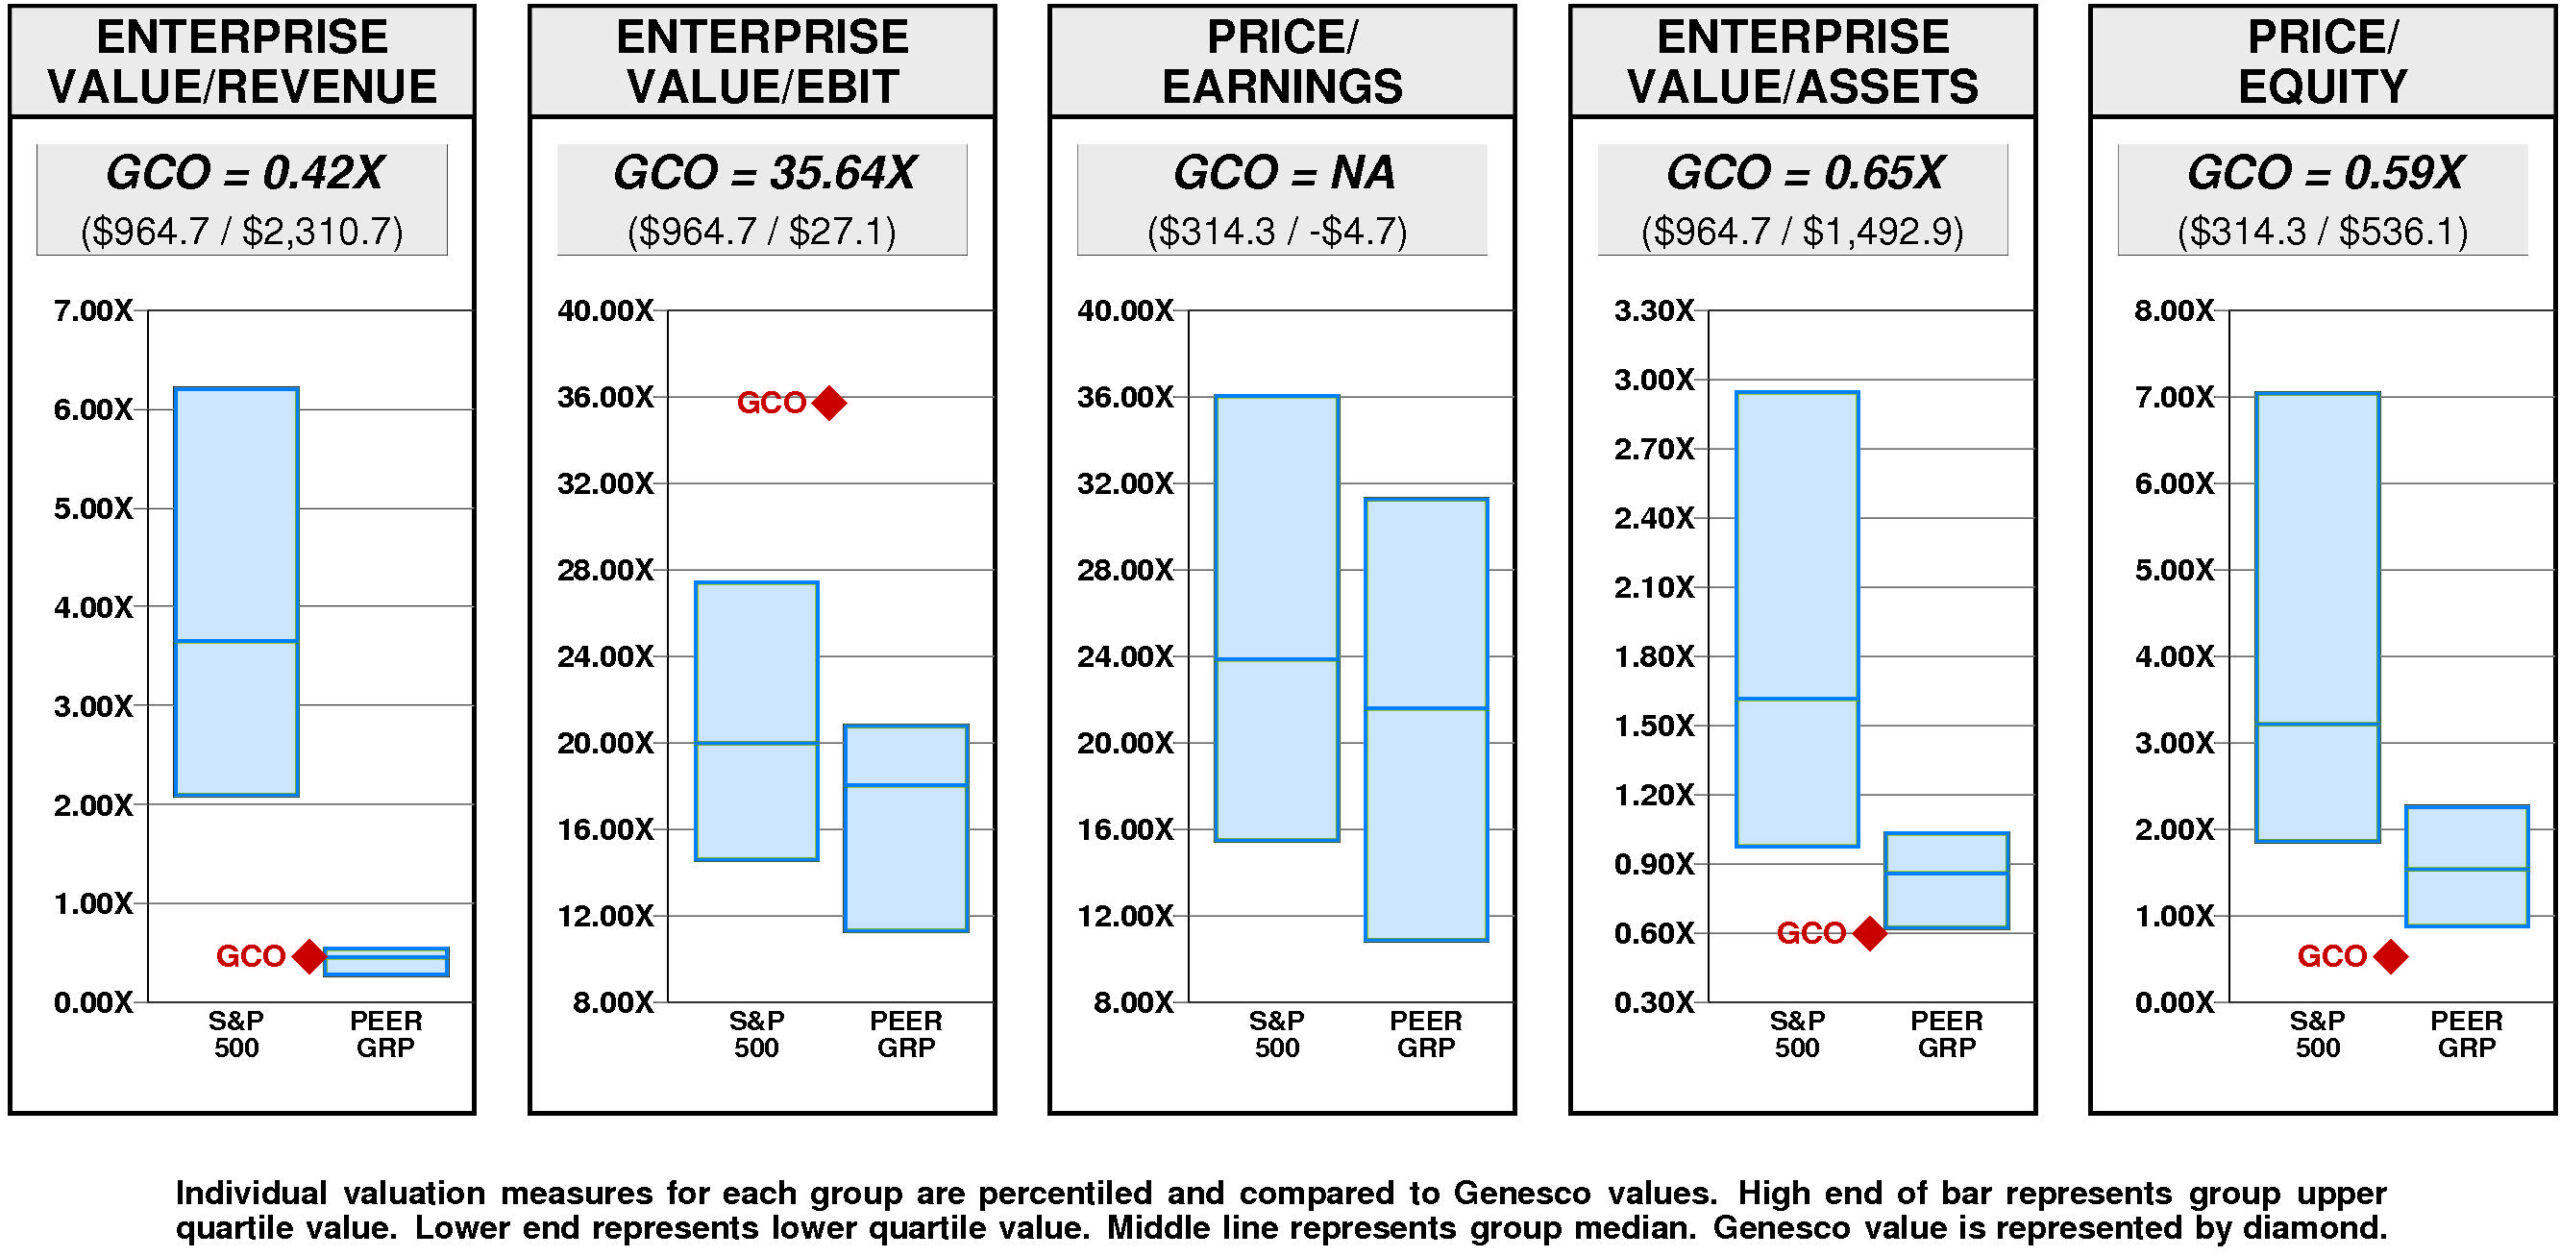
Genesco has a very large value gap compared to the median valuation.
For GCO to rise to median valuation, its current ratio of enterprise value/revenue would have to rise from the current level of 0.42X to 0.45X. If GCO's ratio of enterprise value/revenue were to rise to 0.45X, its stock price would be lower by $7 to $35.
For GCO to hit lower quartile valuation relative to the Genesco Peer Group, its current ratio of enterprise value/revenue would have to fall from the current level of 0.42X to 0.28X. If GCO's ratio of enterprise value/revenue were to fall to 0.28X, its stock price would decline by $-28 from the current level of $27.
VALUE TARGETS
With future capital returns forecasted to exceed the cost of capital, GCO is expected to continue to be a modest Value Builder.
Genesco's current Price Target of $63 represents a +131% change from the current price of $27.39.
This high appreciation potential results in an appreciation score of 79 (only 21% of the universe has greater appreciation potential.)
With this high Appreciation Score of 79, the neutral Power Rating of 48 results in an Value Trend Rating of B.
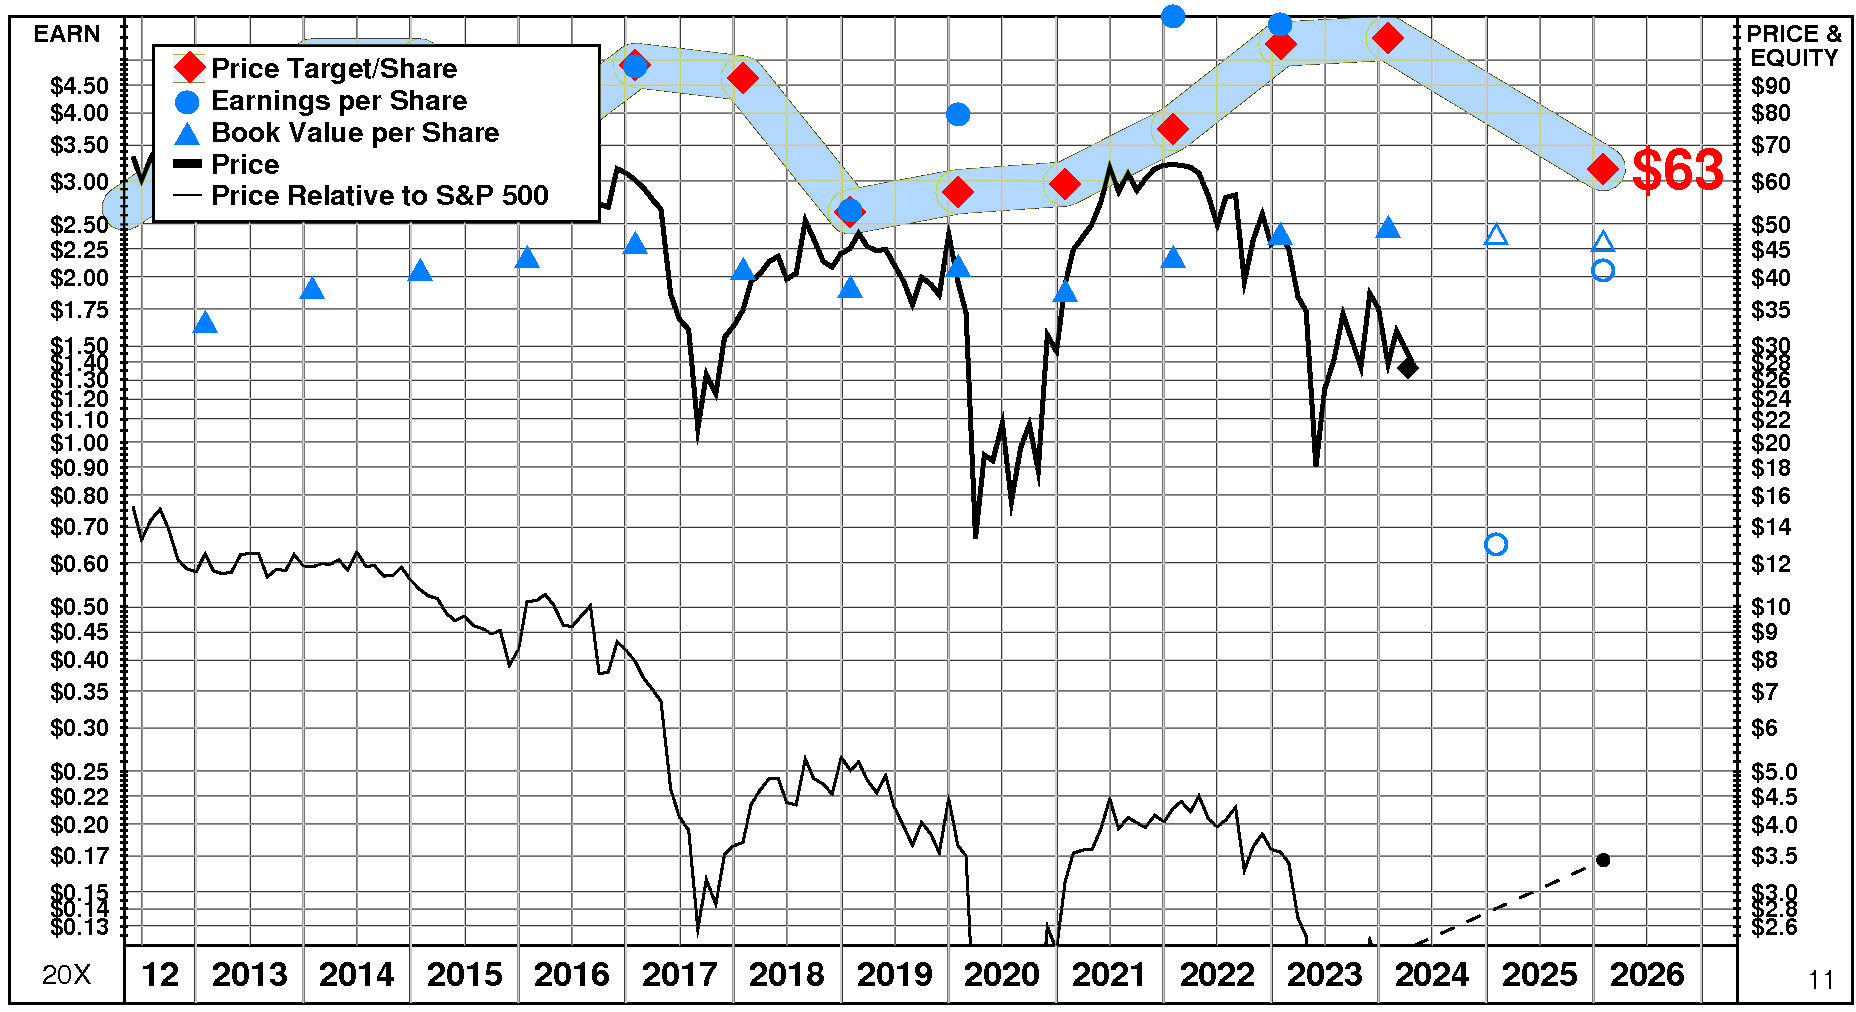
Genesco's current Price Target is $63 (-42% from the 2024 Target of $110 but +131% from the 04/08/24 price of $27.39).
This dramatic fall in the Target is the result of a -10% decrease in the equity base and a -36% decrease in the price/equity multiple. The forecasted decline in return on equity has a very large negative impact on the price/equity multiple and the forecasted decline in growth has a very large negative impact as well. Partially offsetting these Drivers, the forecasted decline in cost of equity has a huge positive impact.
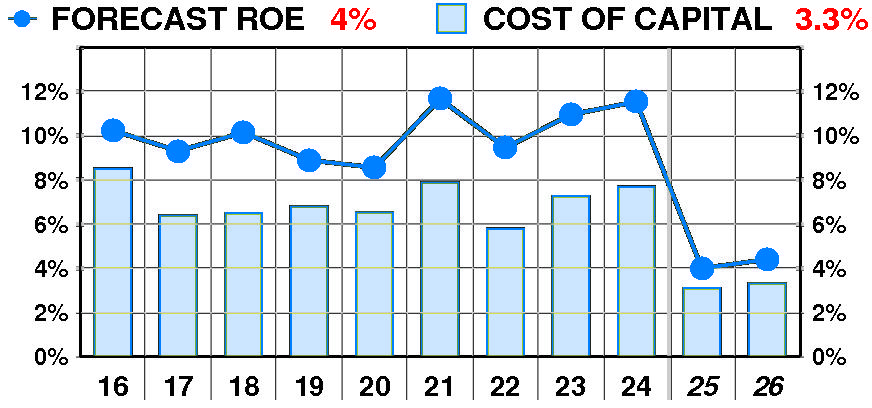
PTR's return on equity forecast is 4.4% — below our recent forecasts.
Forecasted return on equity exhibited a modest, erratic increase between 2016 and 2024. The current forecast is well below the 2021 peak of 12%.
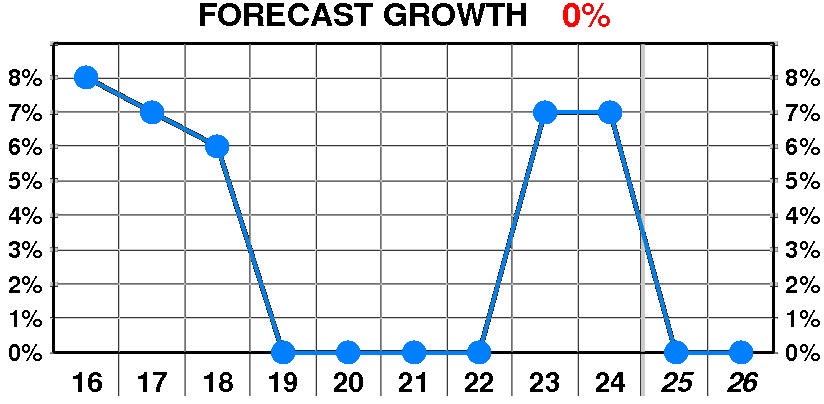
PTR's growth forecast is 0.0% — in line with our recent forecasts.
Forecasted growth erratic but little changed between 2016 and 2024. The current forecast is well below the 2016 peak of 8%.
PTR's cost of equity forecast is 3.3% — slightly below recent levels.
Forecasted cost of equity erratic but little changed between 2016 and 2024. The current forecast is well below the 2016 peak of 8.5%.
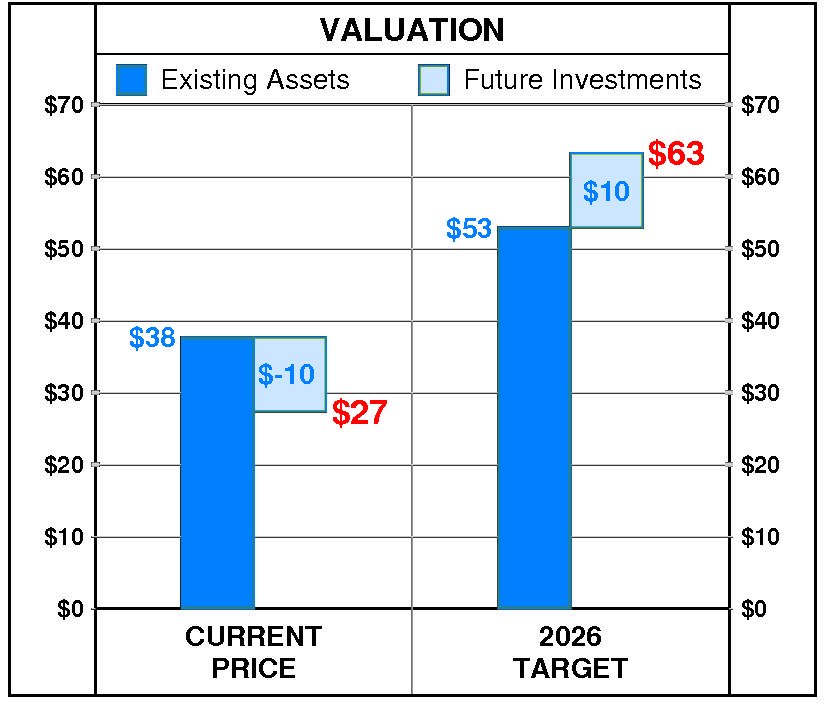
At Genesco's current price of $27.39, investors are placing a negative value of $-10 on its future investments. This view is not supported by the company's most recent performance that reflected a growth rate of 7.0% per year, and a return on equity of 11.5% versus a cost of equity of 7.7%.
PTR's 2026 Price Target of $63 is based on these forecasts and reflects an estimated value of existing assets of $53 and a value of future investments of $10.