BUSINESS
First Financial Northwest, Inc. operates as the bank holding company for First Financial Northwest Bank that provides commercial banking services in Washington. The company offers a range of deposit products, including noninterest bearing accounts, interest-bearing demand accounts, money market accounts, statement savings accounts, and certificates of deposit. Its loan products comprise one-to-four family residential loans; multifamily and commercial real estate loans; construction/land loans for the construction of single-family residences, condominiums, townhouses, multifamily properties, and residential developments; business loans; and consumer loans, such as home equity loans and savings account loans. The company also provides wealth management services; and online banking platform, as well as debit cards and ATMs.
INVESTMENT RATING

Reflecting future returns on capital that are forecasted to be in line with the cost of capital, FFNW is expected to continue to be Value Creation neutral.
First Financial Northwest has a current Value Trend Rating of C (High Neutral).
The Value Trend Rating reflects very contradictory signals from PTR's two proprietary measures of a stock's attractiveness. First Financial Northwest has a poor Appreciation Score of 28 but a very high Power Rating of 93, producing the High Neutral Value Trend Rating.
First Financial Northwest's stock is selling above targeted value.
The current stock price of $20.48 compares to targeted value 12 months forward of $16.
This low appreciation potential results in an appreciation score of 28 (72% of the universe has greater appreciation potential.)
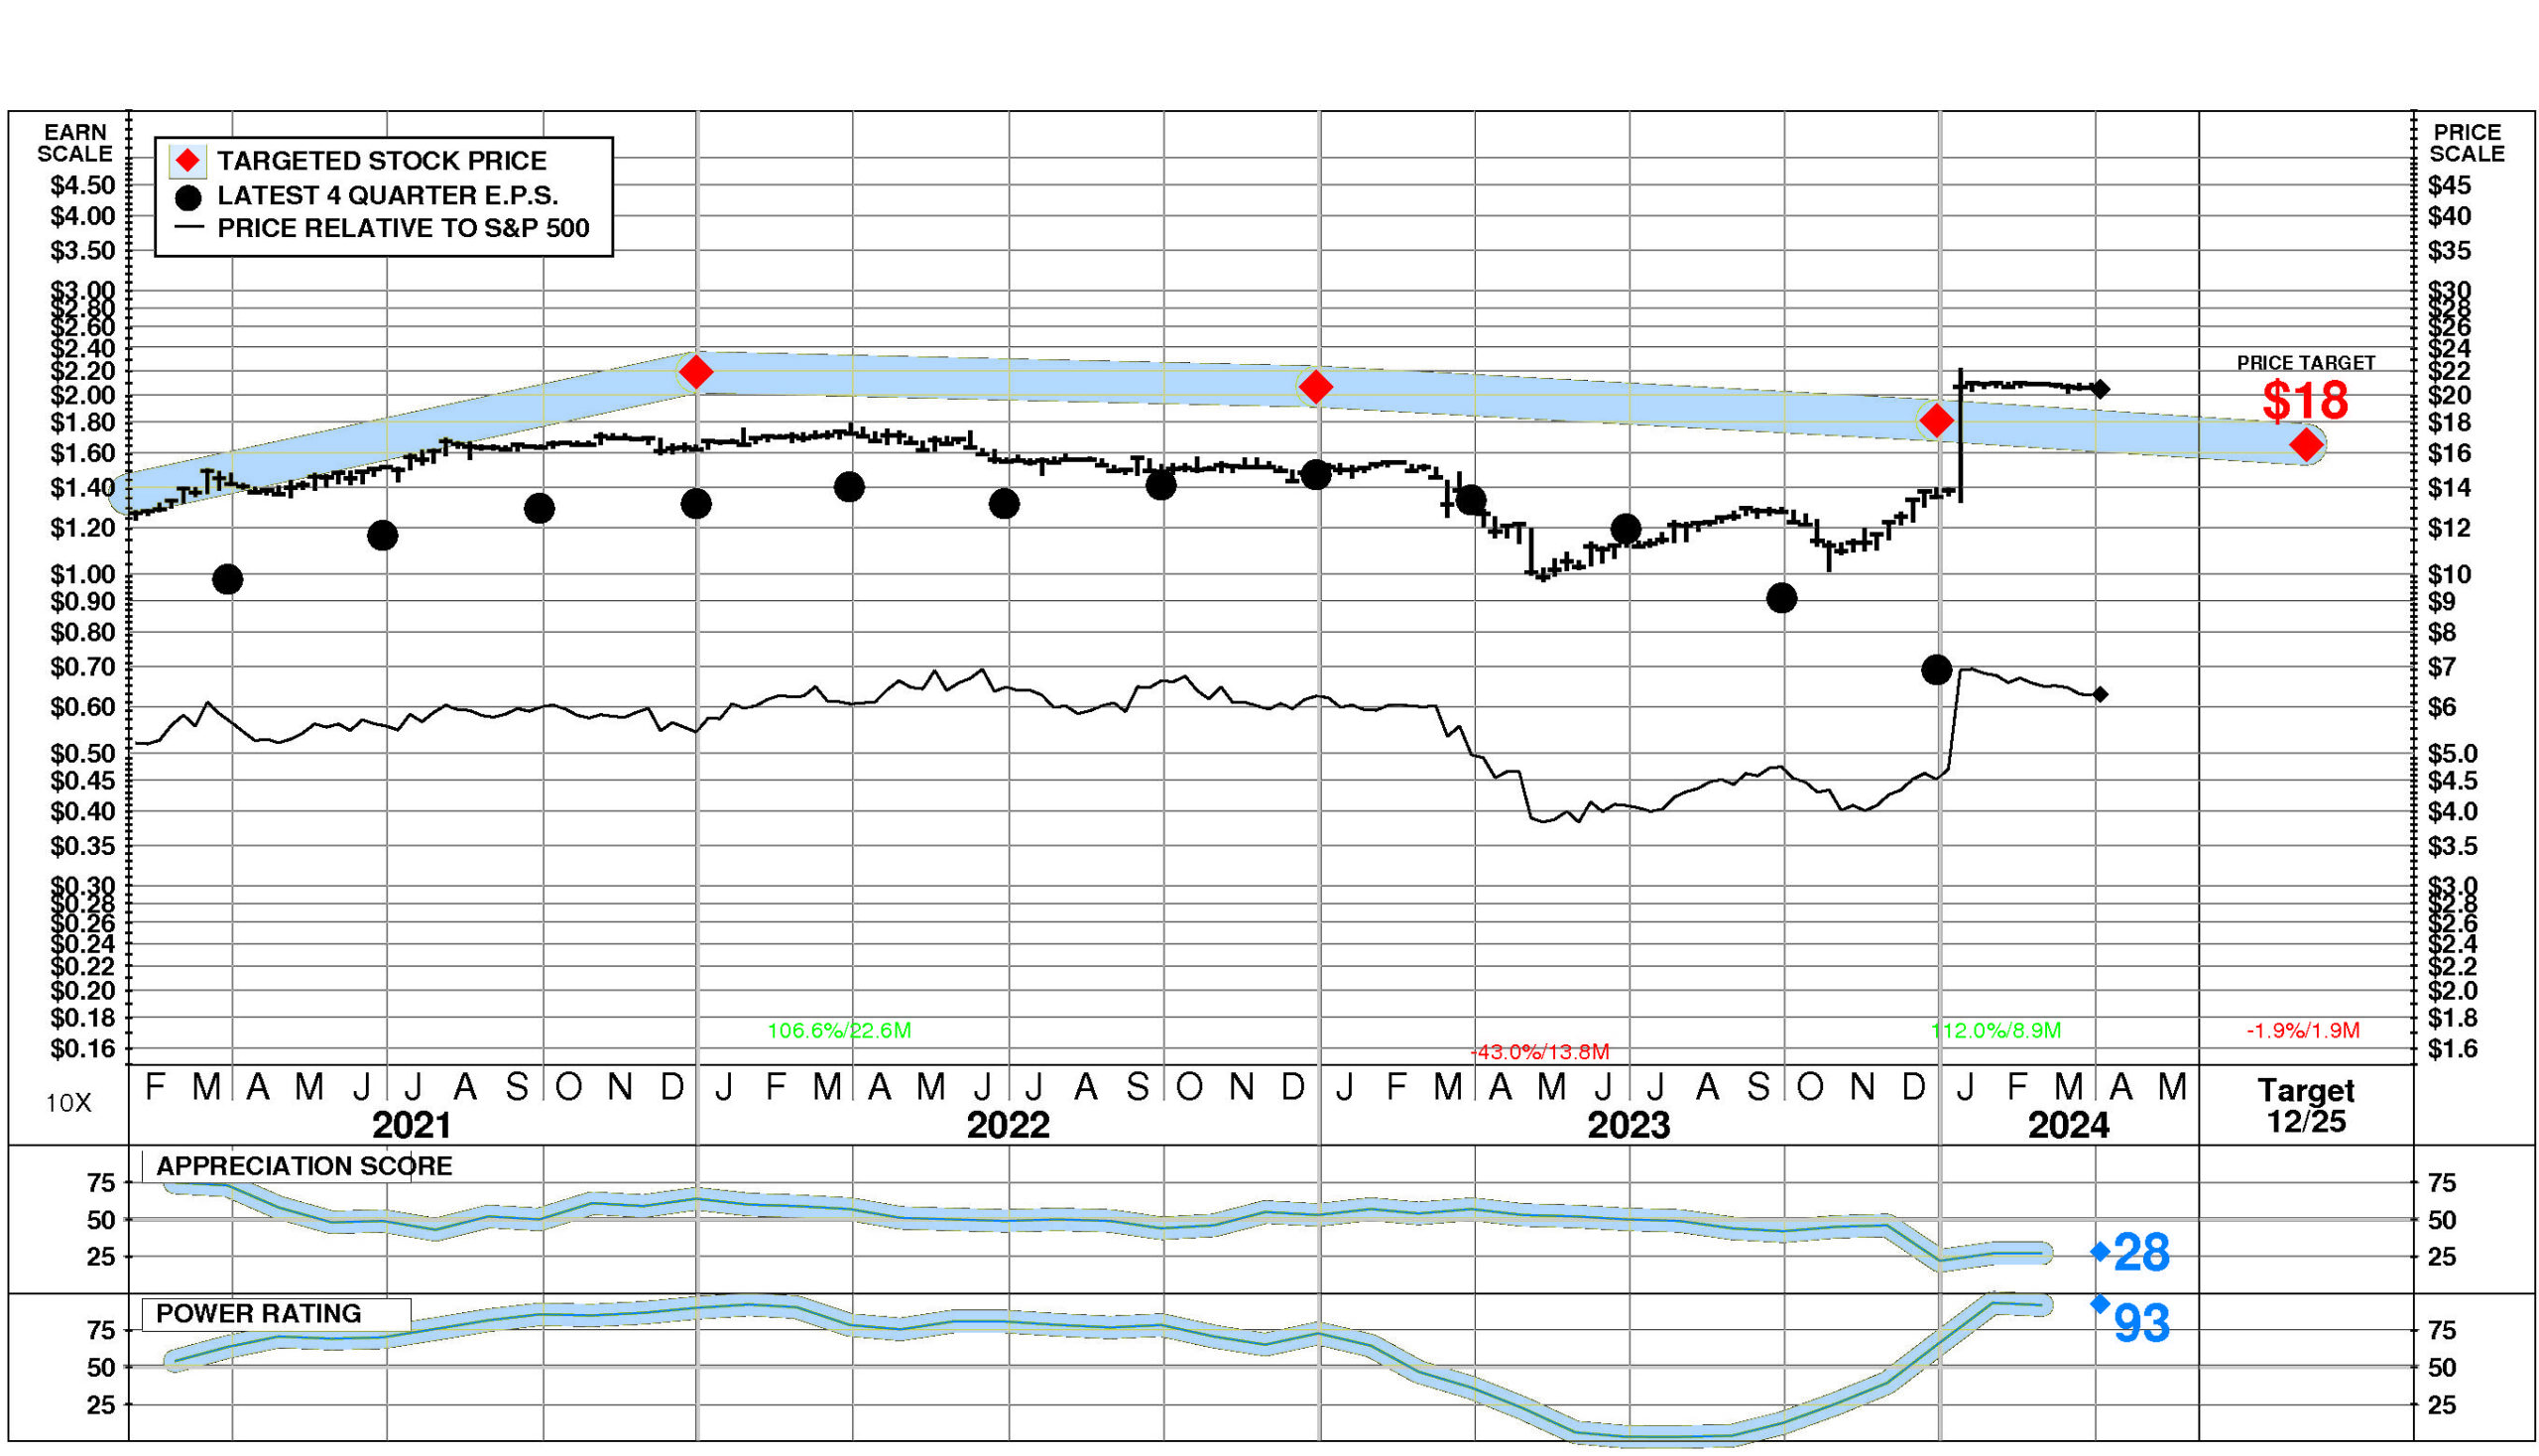
First Financial Northwest has a Power Rating of 93.
(This very high Power Rating indicates that FFNW has a better chance of achieving attractive investment performance over the near to intermediate term than all but 7% of companies in the universe.)
Factors contributing to this very high Power Rating include: recent price action has been extremely favorable; and the Commercial Banks comparison group is in a strong phase currently. An offsetting factor is FFNW's earnings estimates have fallen very significantly in recent months.
INVESTMENT PROFILE
FFNW's financial strength is high. Financial strength rating is 76.
Relative to the S&P 500 Composite, First Financial Northwest Inc has significant Value characteristics; its appeal is likely to be to Income-oriented investors; the perception is that FFNW is lower risk.
Relative weaknesses include: low forecasted profitability, and low historical profitability. FFNW's valuation is moderate: moderate dividend yield, high P/E ratio, and low price/book ratio. FFNW has unusually low market capitalization.
CURRENT SIGNALS
First Financial Northwest's current operations are eroding.
Return on equity is falling, reflecting: declining pretax margin; falling tax keep rate; and falling leverage.
First Financial Northwest's current technical position is very strong.
The stock price is in a 8.9 month up move. The stock has appreciated 112.0% from its prior low. The stock price is above its 200 day moving average which is in an uptrend.
ALERTS
First Financial Northwest Inc (NASDAQ: FFNW) has recently experienced meaningful negative changes in investment behavior: negative upside/downside volume developed. First Financial Northwest Inc (NASDAQ: FFNW) has recently experienced minimal negative changes in fundamentals: significant quarterly earnings deceleration occurred. The stock is currently rated C. First Financial Northwest Inc (NASDAQ: FFNW) stock closed at $20.48 on 4/3/24 after a slight decline of -0.4%. However, unusually low trading volume at 62% of normal accompanied the decline. The stock is unchanged during the last week and has been exceptionally strong relative to the market over the last nine months.CASH FLOW
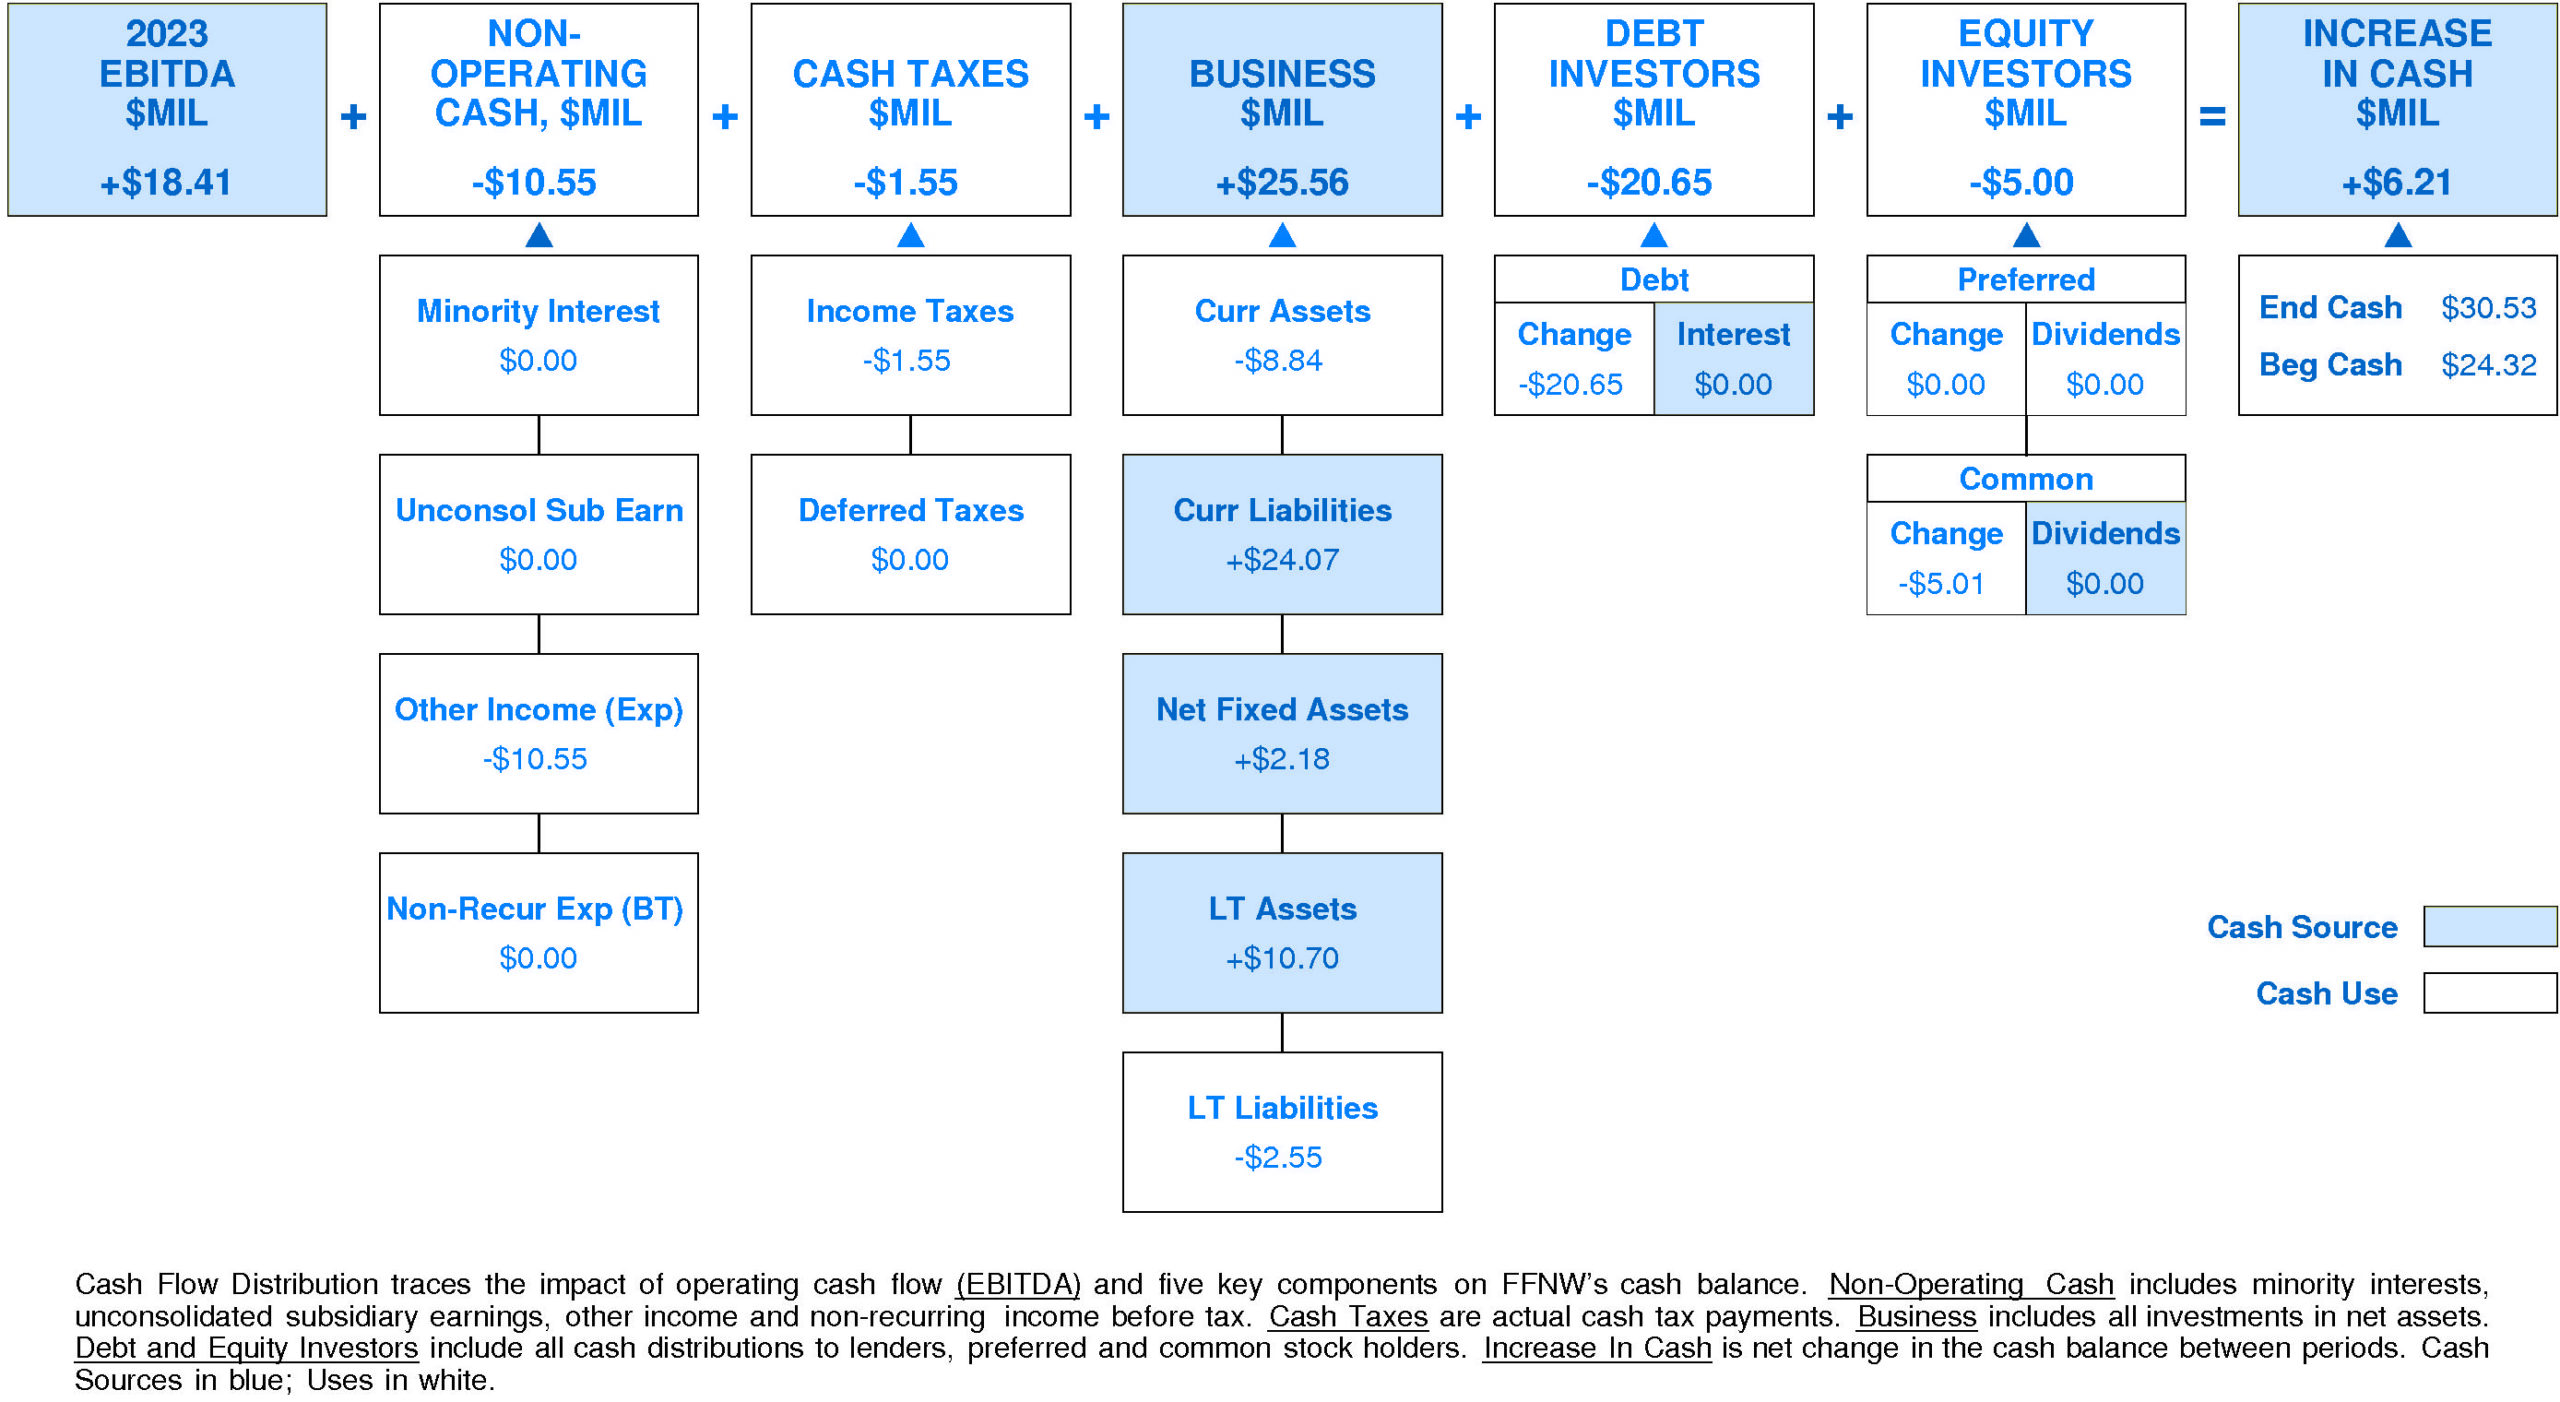
In 2023, First Financial Northwest generated a very significant increase in cash of +$6.21 million (+26%). Sources of cash were much larger than uses.
Cash generated from 2023 EBITDA totaled +$18.41 million. Non-operating uses consumed -$10.55 million (-57% of EBITDA). Cash taxes consumed -$1.55 million (-8% of EBITDA). Withdrawal of investment from the business totaled +$25.56 million (+139% of EBITDA). On a net basis, debt investors pulled out -$20.65 million (-112% of EBITDA) while equity investors withdrew -$5.00 million (-27% of EBITDA).
FFNW's Non-operating Income, %EBITDA has suffered a strong overall downtrend over the period.
This downtrend was accompanied by stability for the First Financial Northwest Peer Group. (Since 2021 Non-operating Income, %EBITDA has accelerated very sharply.) In most years, First Financial Northwest was in the top quartile and second quartile. Currently, First Financial Northwest is lower quartile at -57% of EBITDA (-$10.55 million).
FFNW's Cash Taxes, %EBITDA has exhibited a minor overall uptrend over the period.
This improvement was accompanied by a similar trend for the First Financial Northwest Peer Group. In most years, First Financial Northwest was in the top quartile and second quartile. Currently, First Financial Northwest is upper quartile at -8% of EBITDA (-$1.55 million).
FFNW's Business Re-investment, %EBITDA has enjoyed a volatile overall uptrend over the period.
This improvement was accompanied by a similar trend for the First Financial Northwest Peer Group. In most years, First Financial Northwest was in the top quartile and second quartile. Currently, First Financial Northwest is at the upper quartile at +139% of EBITDA (+$25.56 million).
FFNW's Debt Investors, %EBITDA has experienced a volatile overall downtrend over the period.
This downtrend was accompanied by a similar trend for the First Financial Northwest Peer Group. In most years, First Financial Northwest was in the top quartile and lower quartile. Currently, First Financial Northwest is substantially below median at -112% of EBITDA (-$20.65 million).
FFNW's Equity Investors, %EBITDA has enjoyed a volatile overall uptrend over the period.
This improvement was accompanied by an opposite trend for the First Financial Northwest Peer Group. (Since 2020 Equity Investors, %EBITDA has decelerated.) In most years, First Financial Northwest was in the lower quartile and second quartile. Currently, First Financial Northwest is lower quartile at -27% of EBITDA (-$5.00 million).
FFNW's Change in Cash, %EBITDA has exhibited little to no overall change over the period.
This stability was accompanied by a downtrend for the First Financial Northwest Peer Group. In most years, First Financial Northwest was in the second quartile and lower quartile. Currently, First Financial Northwest is slightly above median at +34% of EBITDA (+$6.21 million).
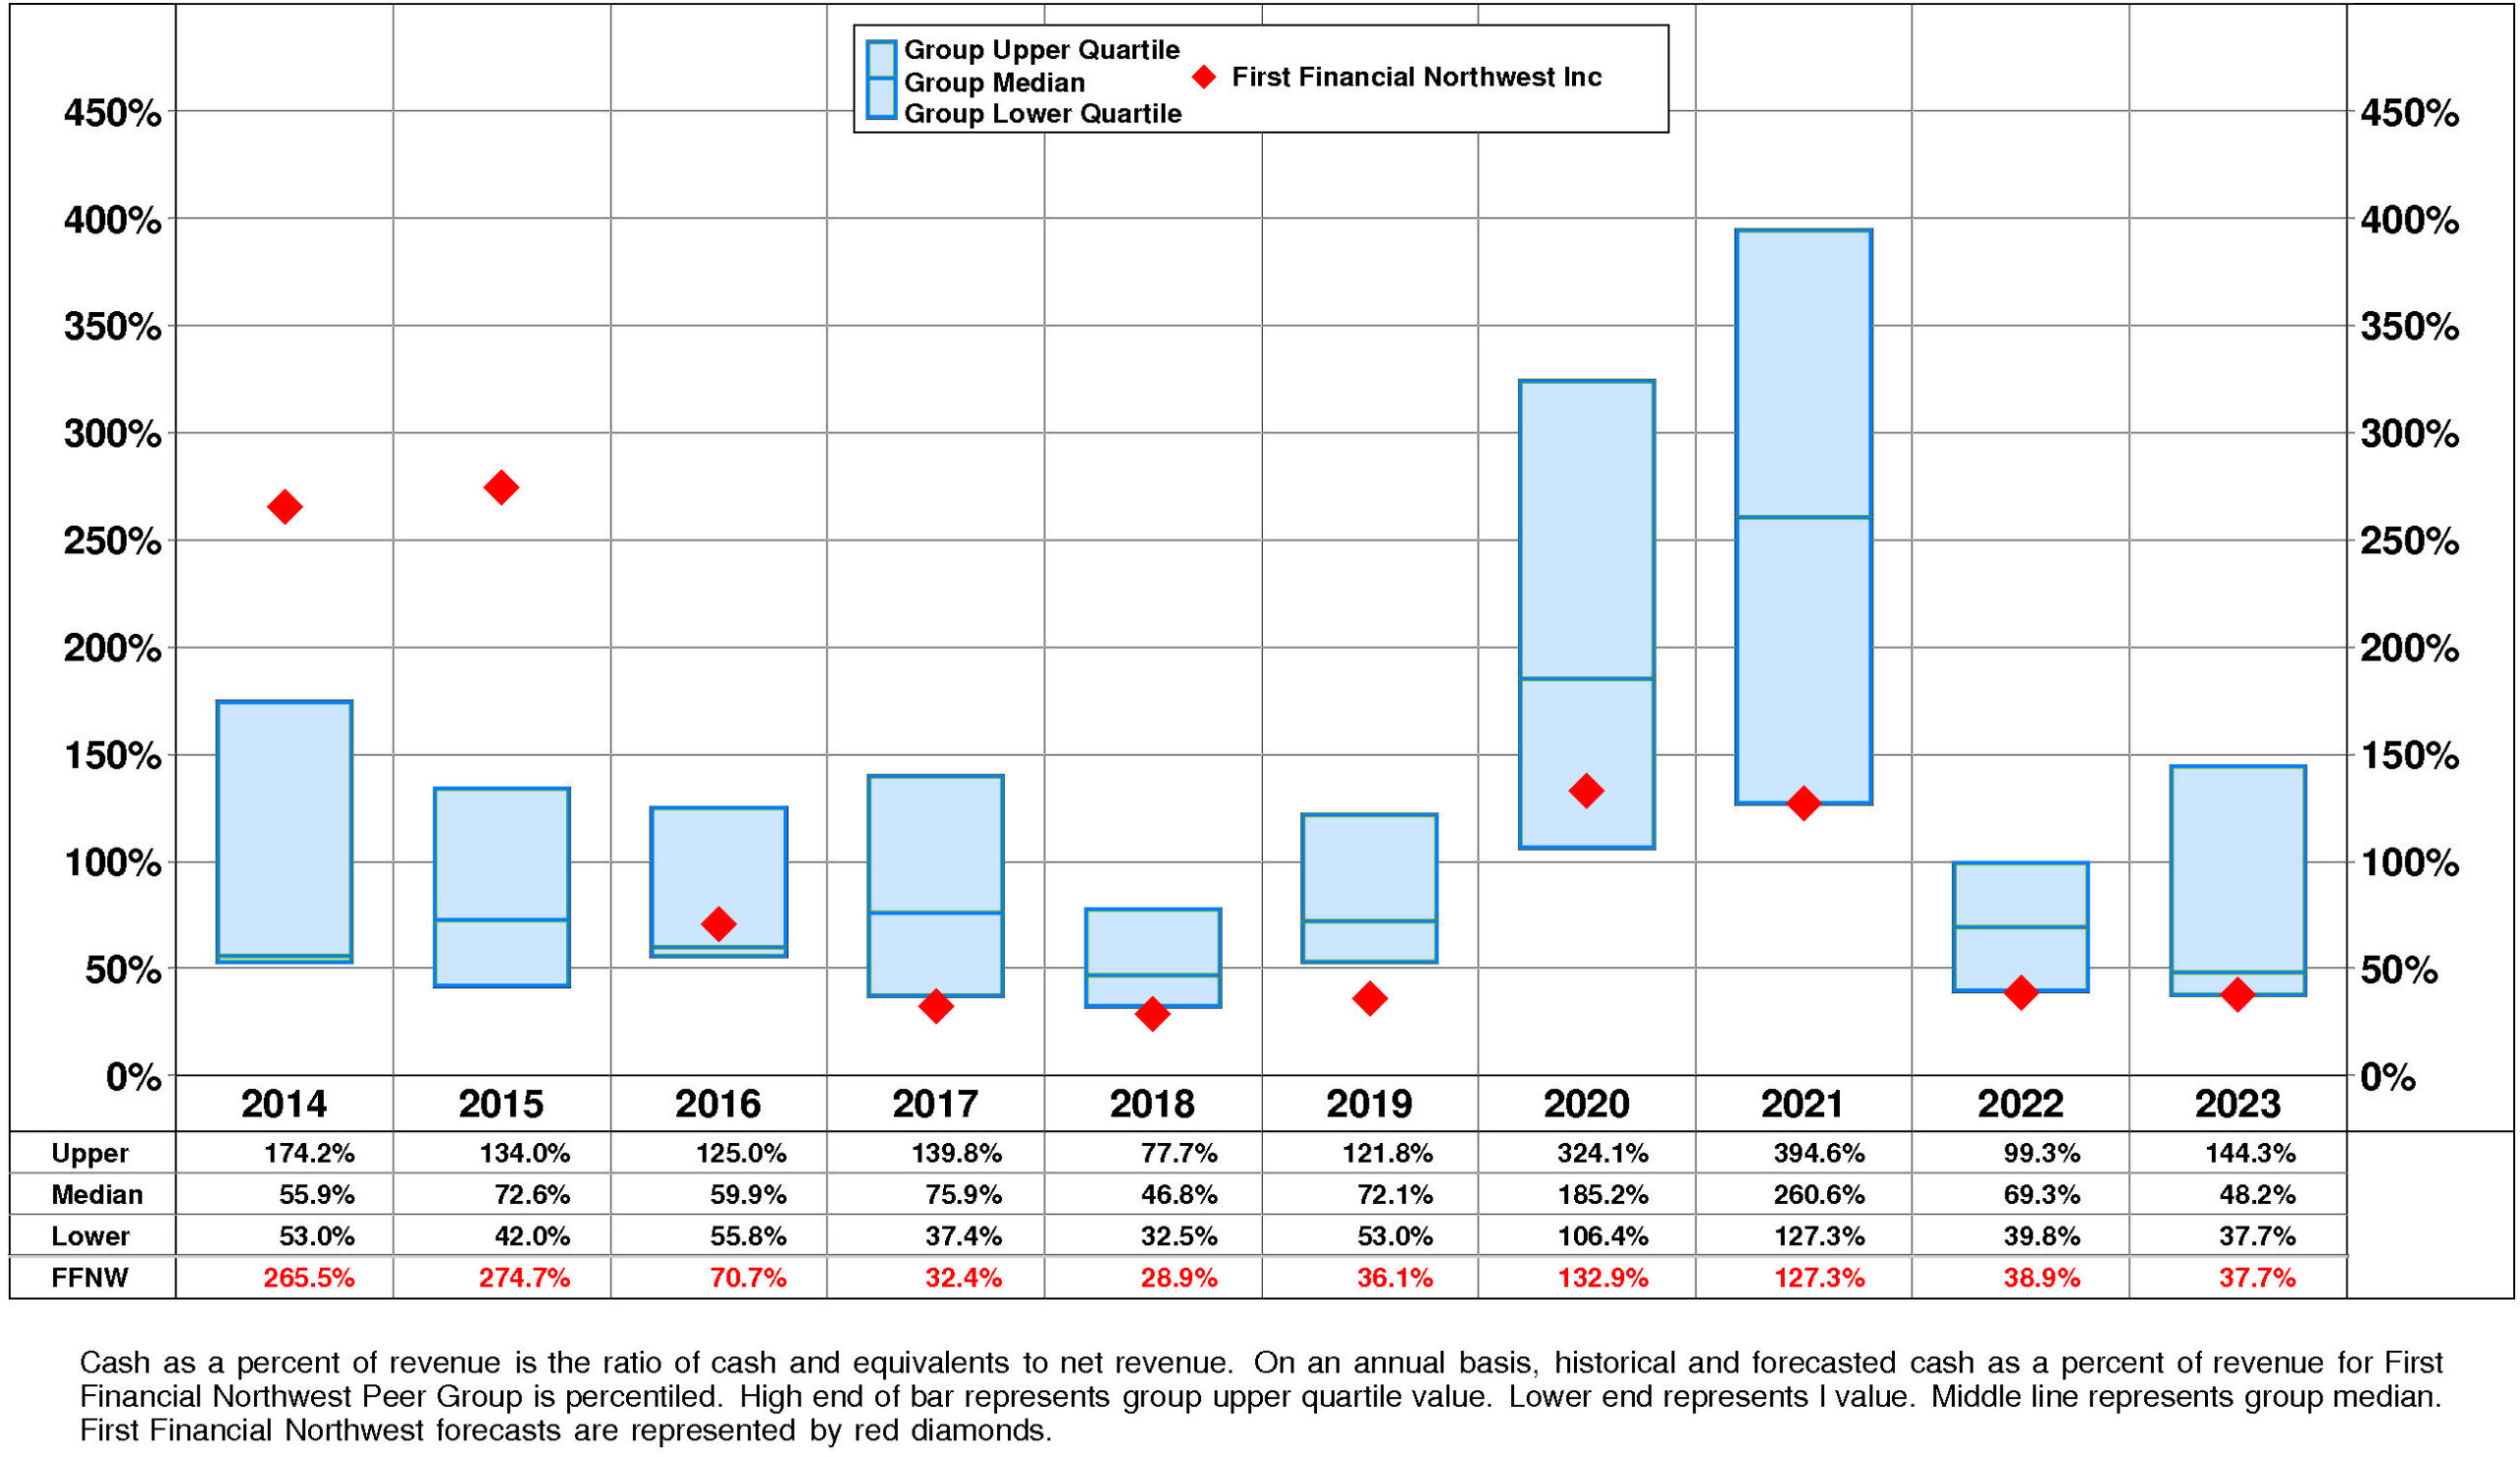
FFNW's Cash, %Revenue has suffered a very strong overall downtrend over the period.
This downtrend was accompanied by an opposite trend for the First Financial Northwest Peer Group. (Since 2020 Cash, %Revenue has accelerated very sharply.) In most years, First Financial Northwest was in the lower quartile and top quartile. Currently, First Financial Northwest is at the lower quartile at +38%.
PROFITABILITY
FFNW's return on equity has eroded significantly since 2014. The current level of 3.9% is at the low for the period and is -33.8% from the high.
FFNW's very strong negative trend in pretax operating return significantly offset by a very strong positive trend in non-operating factors is a significant analytical factor.
The productivity of FFNW's assets rose over the full period 2014-2023: asset turnover has exhibited a minor overall uptrend.
More than offsetting this trend, however, pretax margin experienced a very strong overall downtrend that accelerated very sharply from the 2021 level.
Non-operating factors (income taxes and financial leverage) had a very significant positive influence on return on equity.
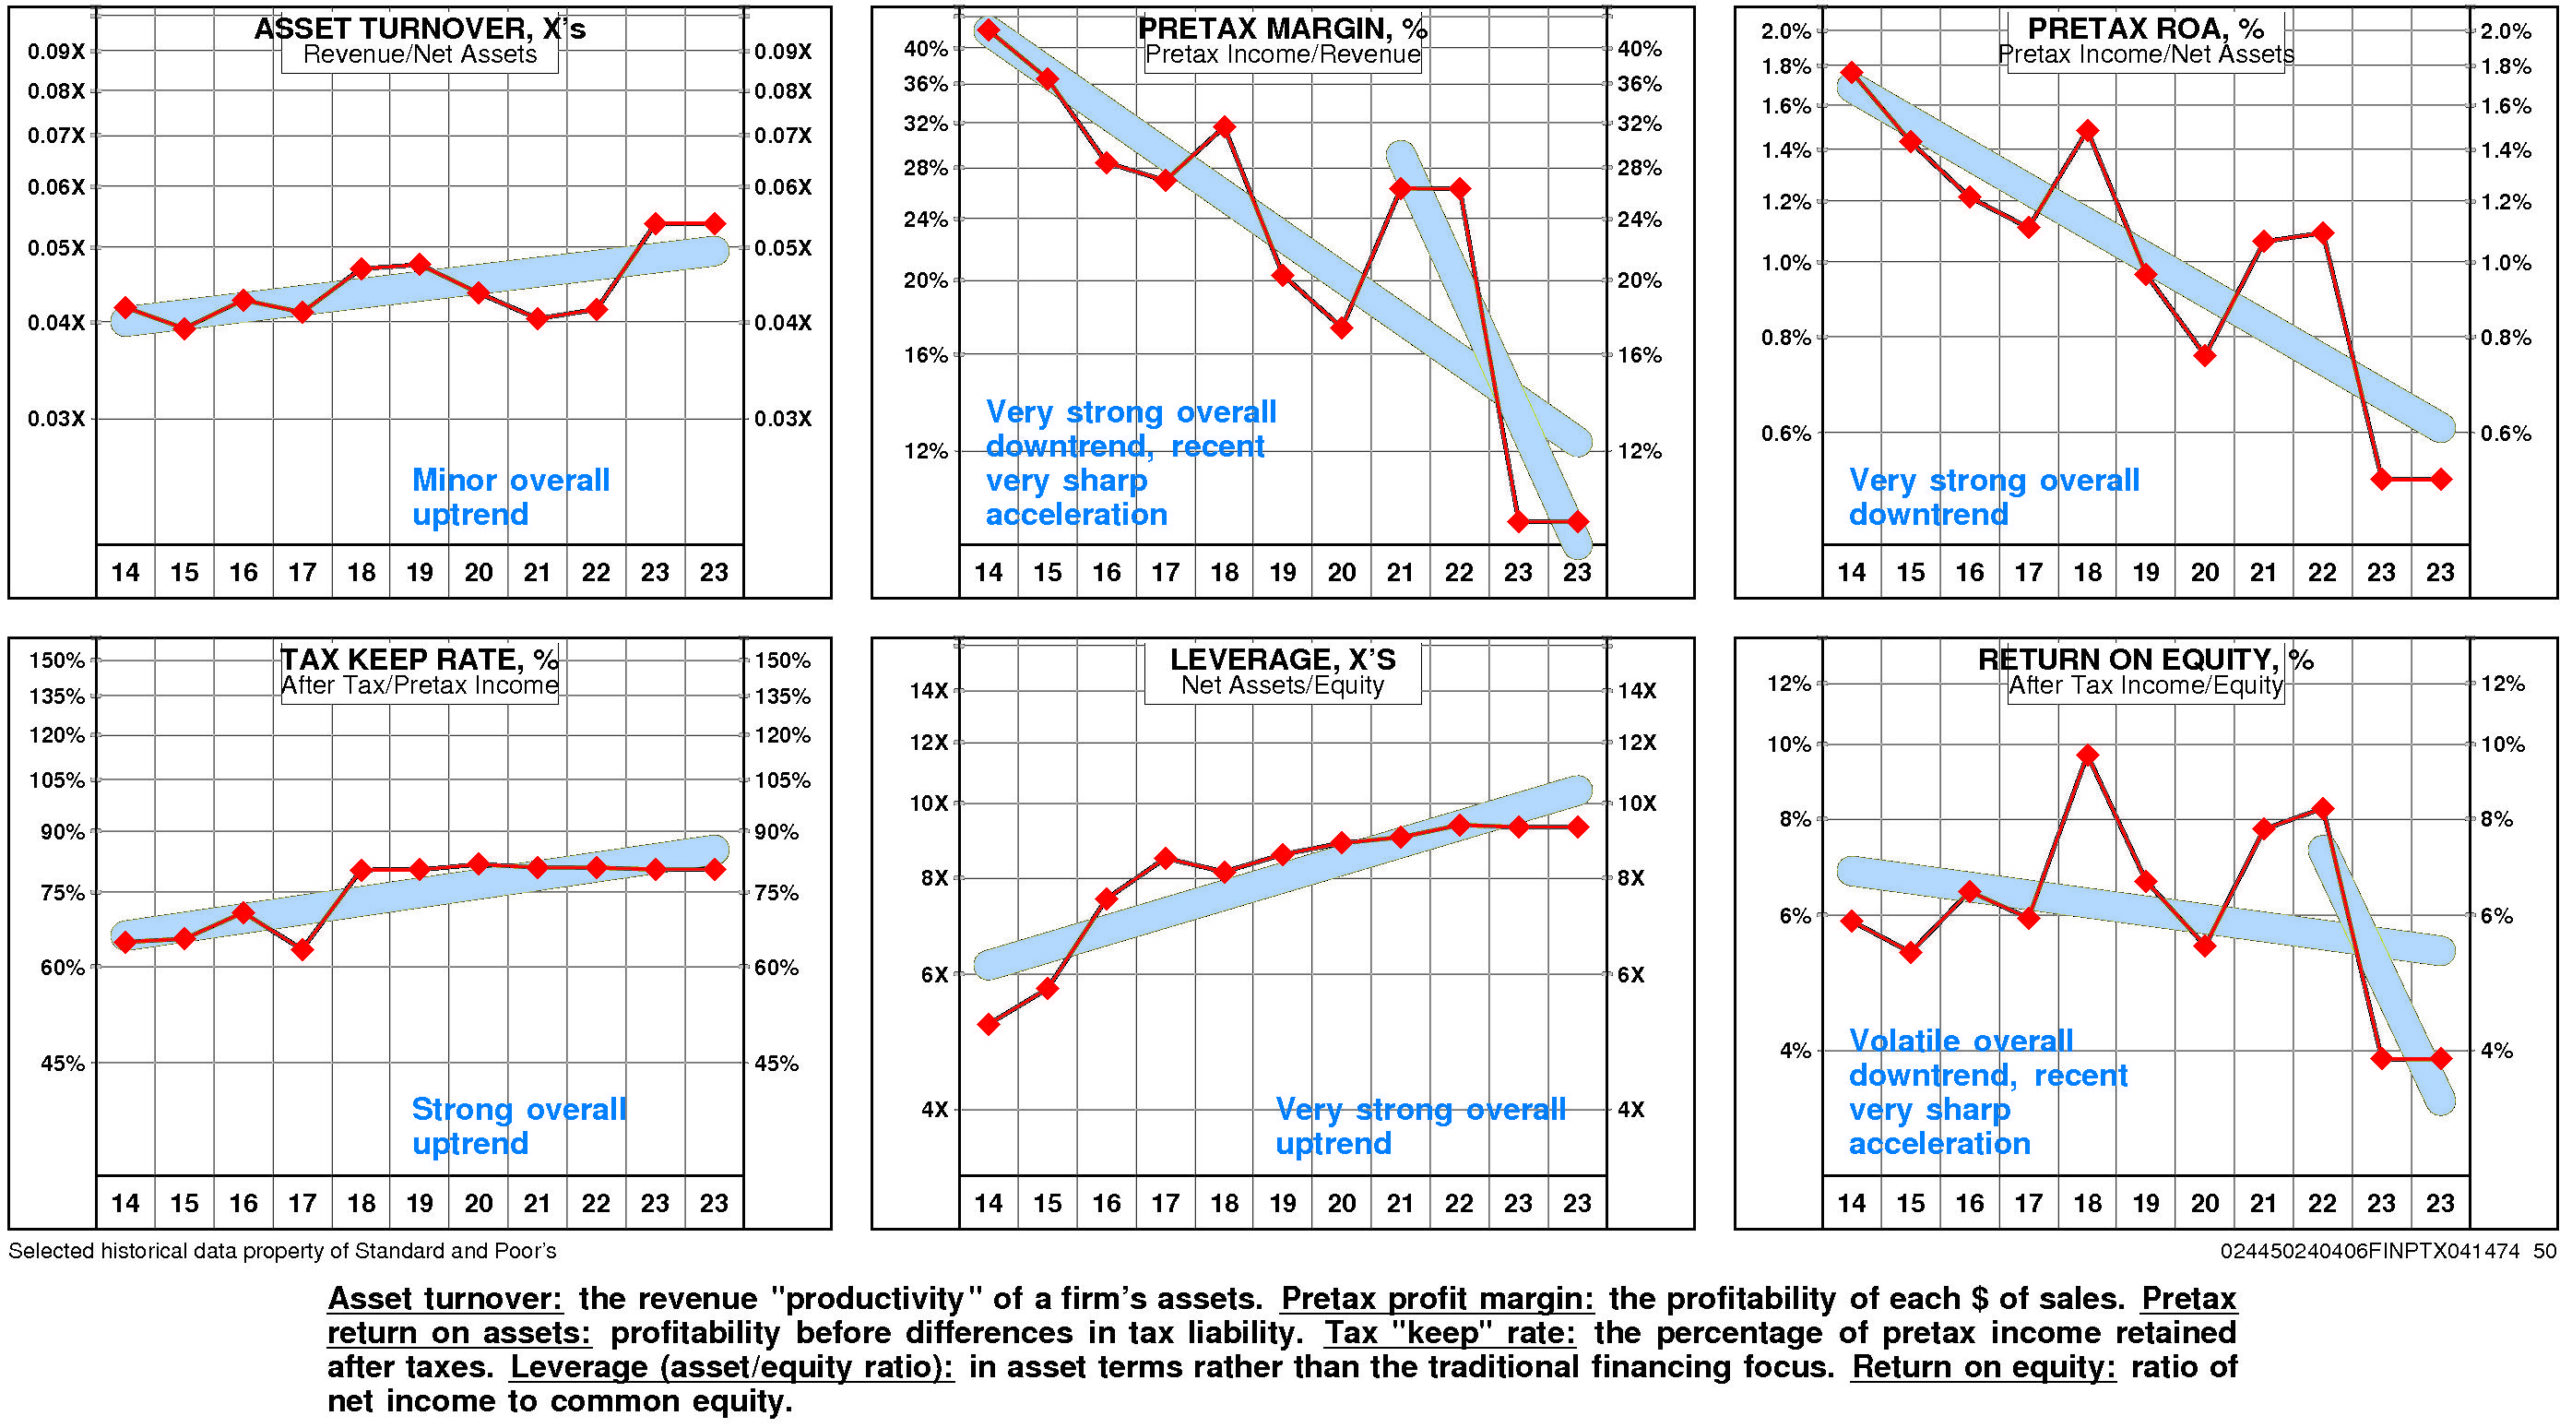
FFNW's return on equity is lower quartile (3.9%) for the four quarters ended December, 2023.
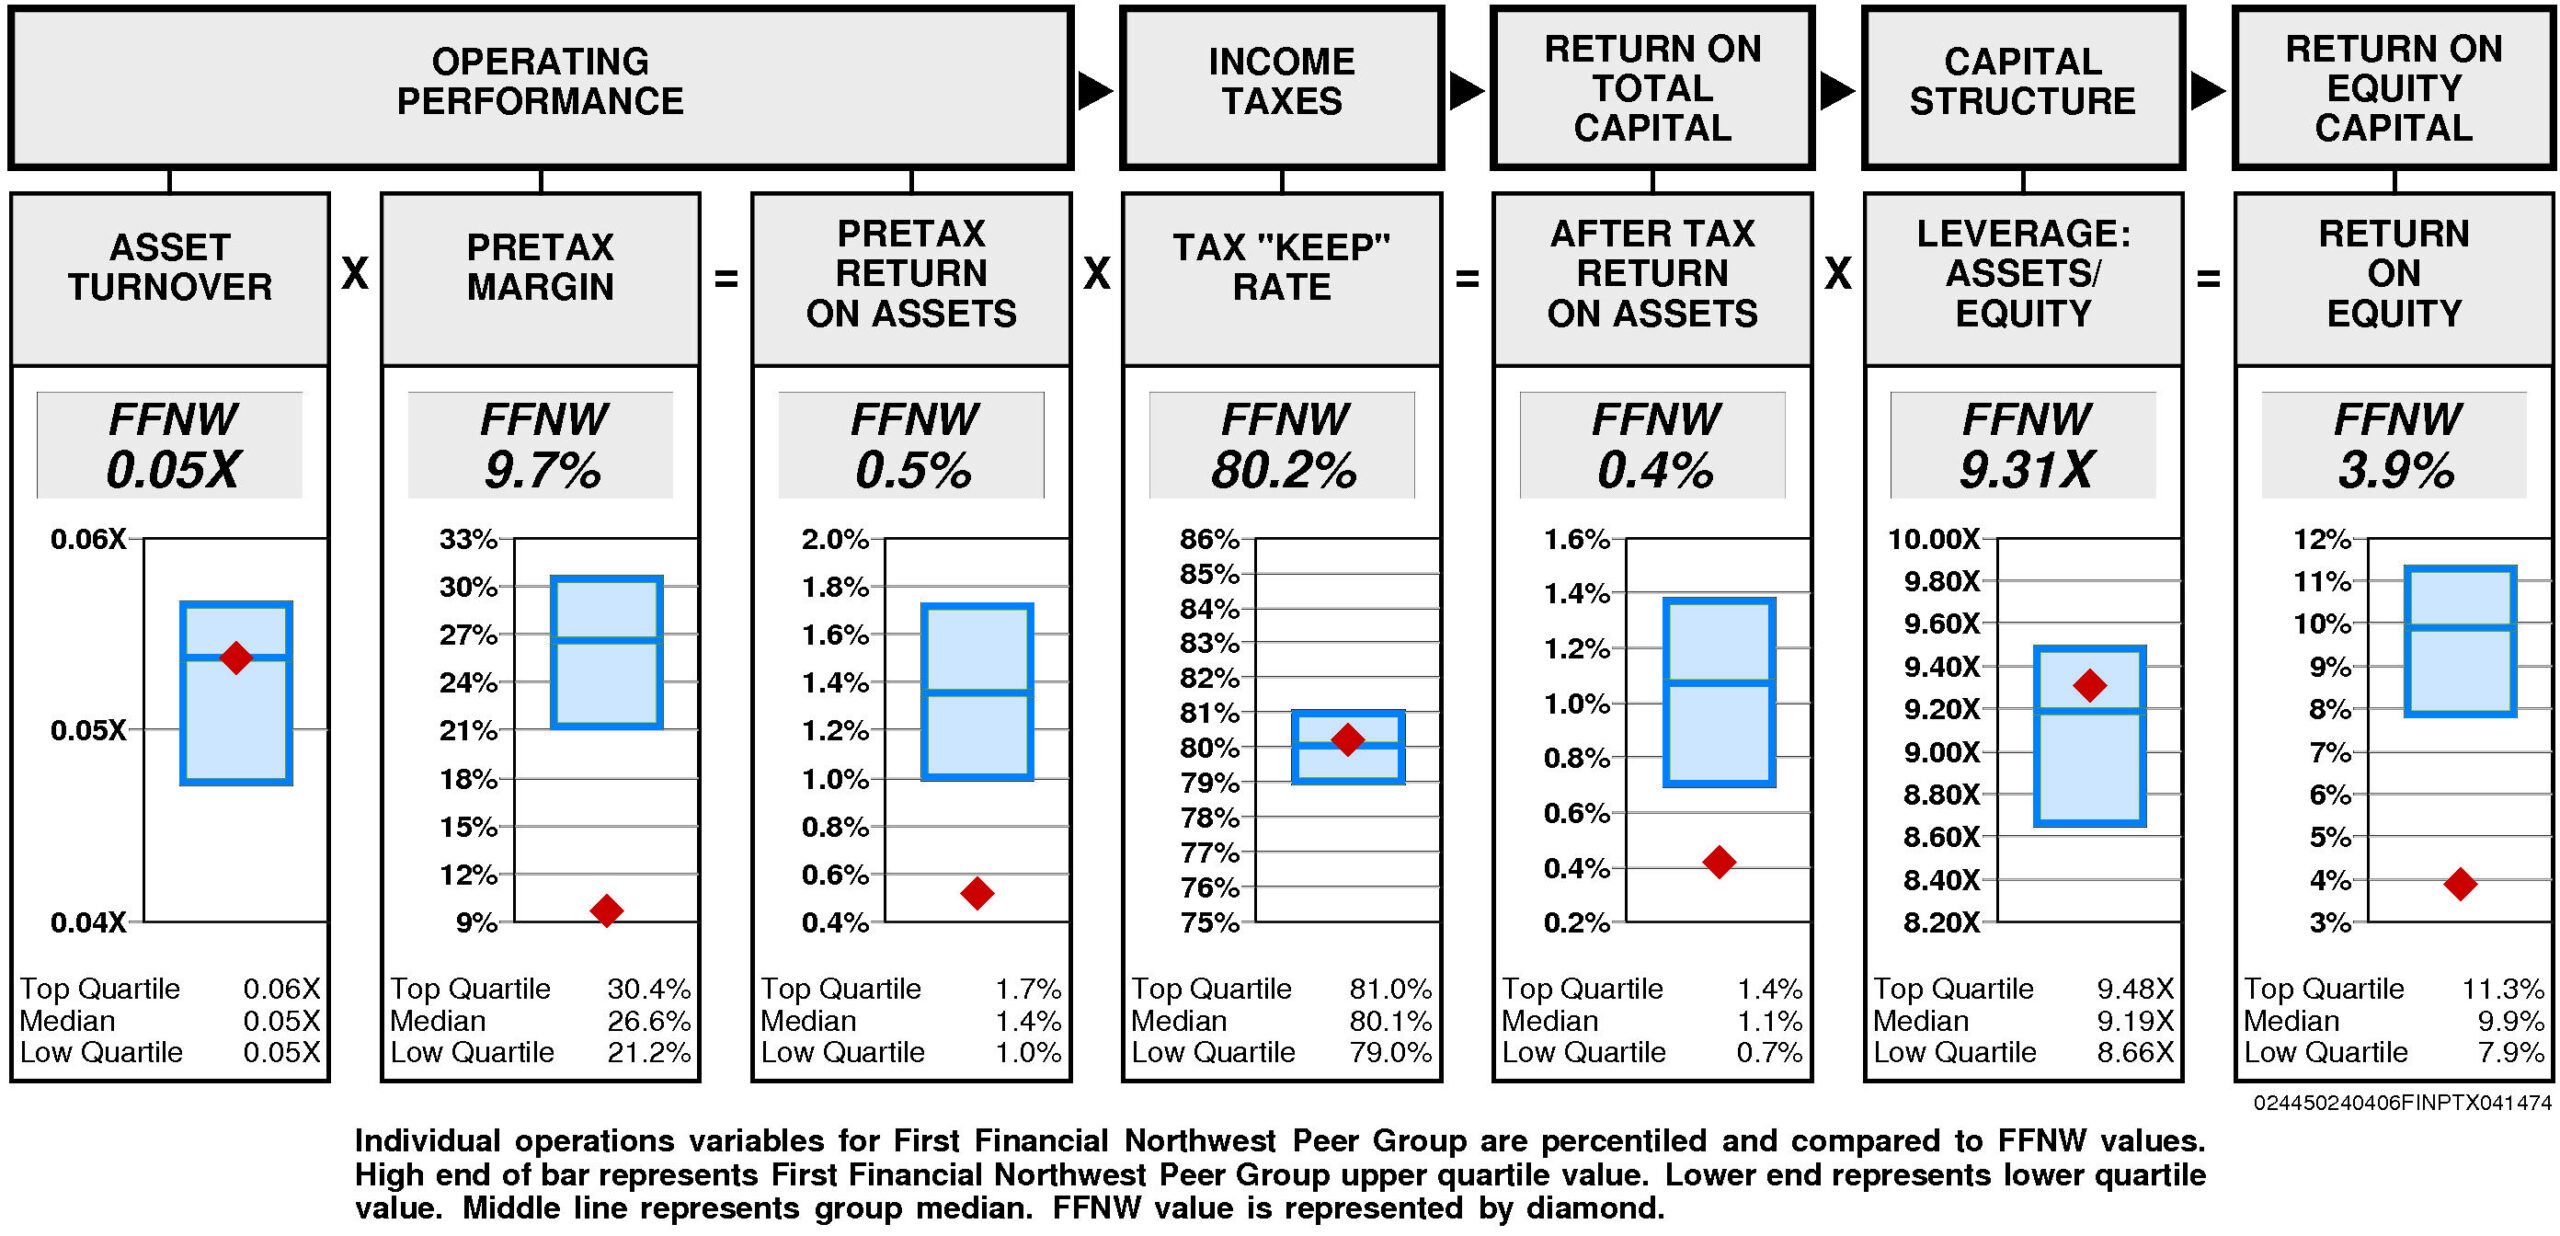 Operating performance (pretax return on assets) is lower quartile (0.5%) reflecting asset turnover that is at median (0.05X) and lower quartile pretax margin (9.7%).
Tax “keep” rate (income tax management) is at the upper quartile (80.2%) resulting in after tax return on assets that is lower quartile.
Financial leverage (leverage) is at the upper quartile (9.31X).
Operating performance (pretax return on assets) is lower quartile (0.5%) reflecting asset turnover that is at median (0.05X) and lower quartile pretax margin (9.7%).
Tax “keep” rate (income tax management) is at the upper quartile (80.2%) resulting in after tax return on assets that is lower quartile.
Financial leverage (leverage) is at the upper quartile (9.31X).
GROWTH RATES
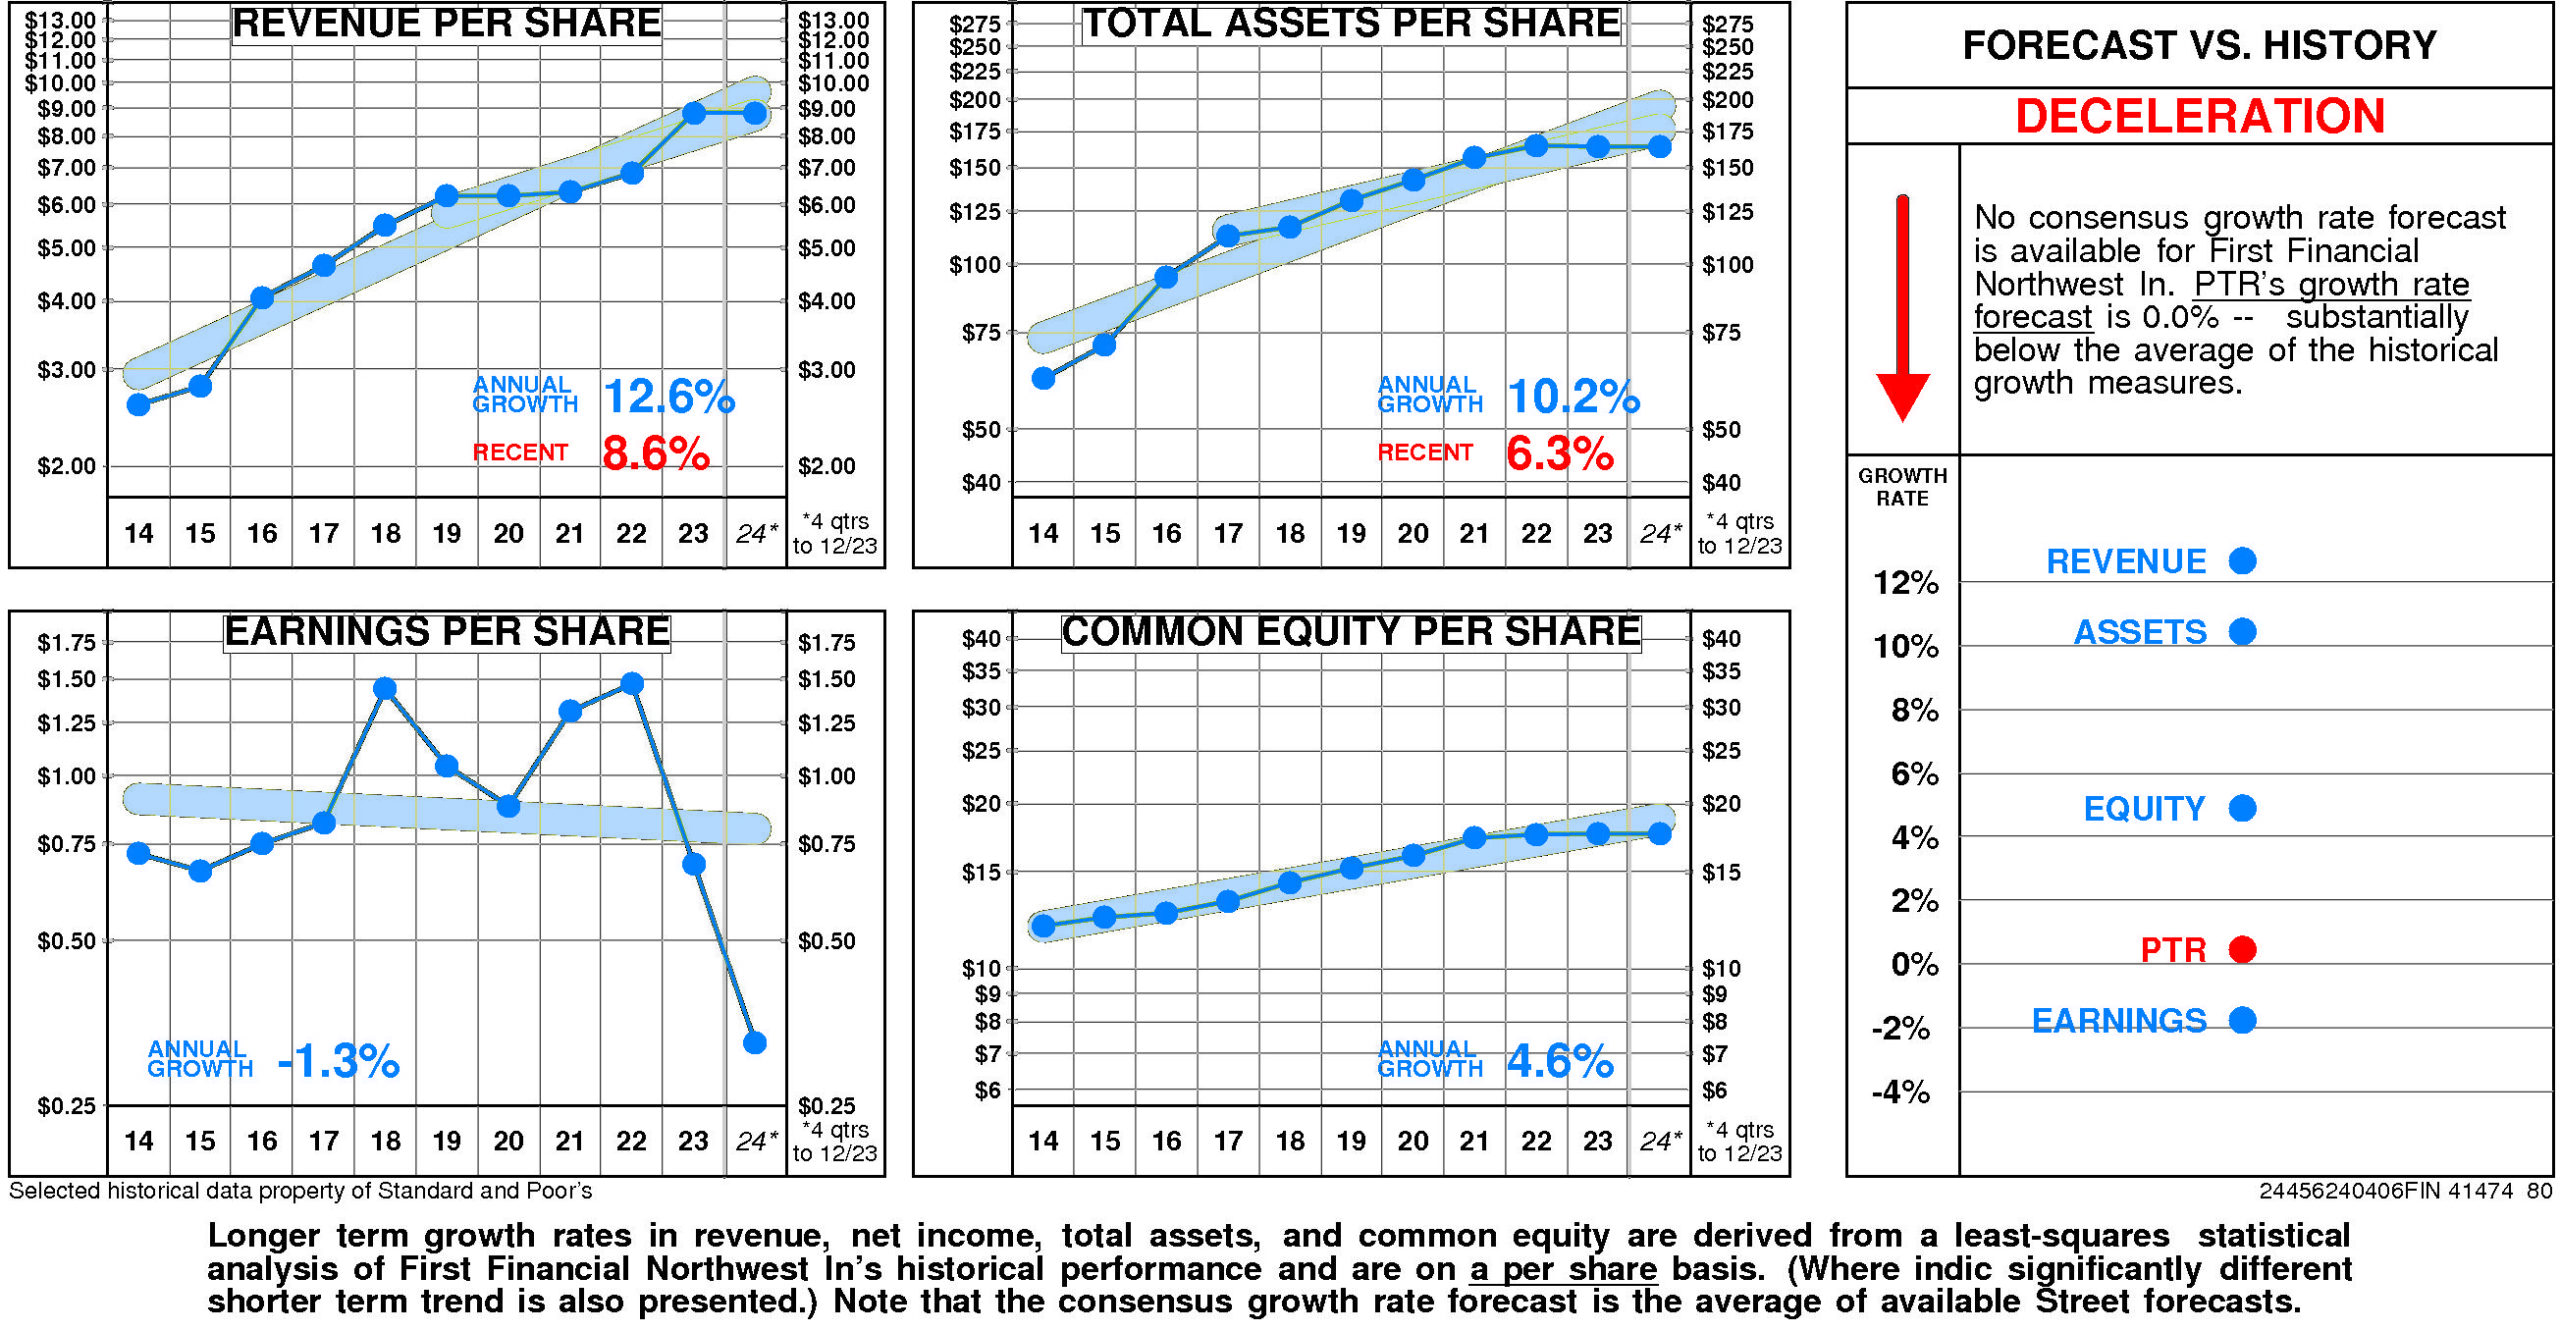
Overall, First Financial Northwest In's growth rate has slowed very considerably in recent years. First Financial Northwest In's historical income statement growth and balance sheet growth have diverged. Revenue growth has paralleled asset growth; earnings growth has fallen short of equity growth. Annual revenue growth
has been 12.6% per year. (More recently it has been 8.6%.) Total asset growth
has been 10.2% per year. (More recently it has been 6.3%.) Annual E.P.S. growth
has been -1.3% per year. Equity growth
has been 4.6% per year.
No consensus growth rate forecast is available for First Financial Northwest In.
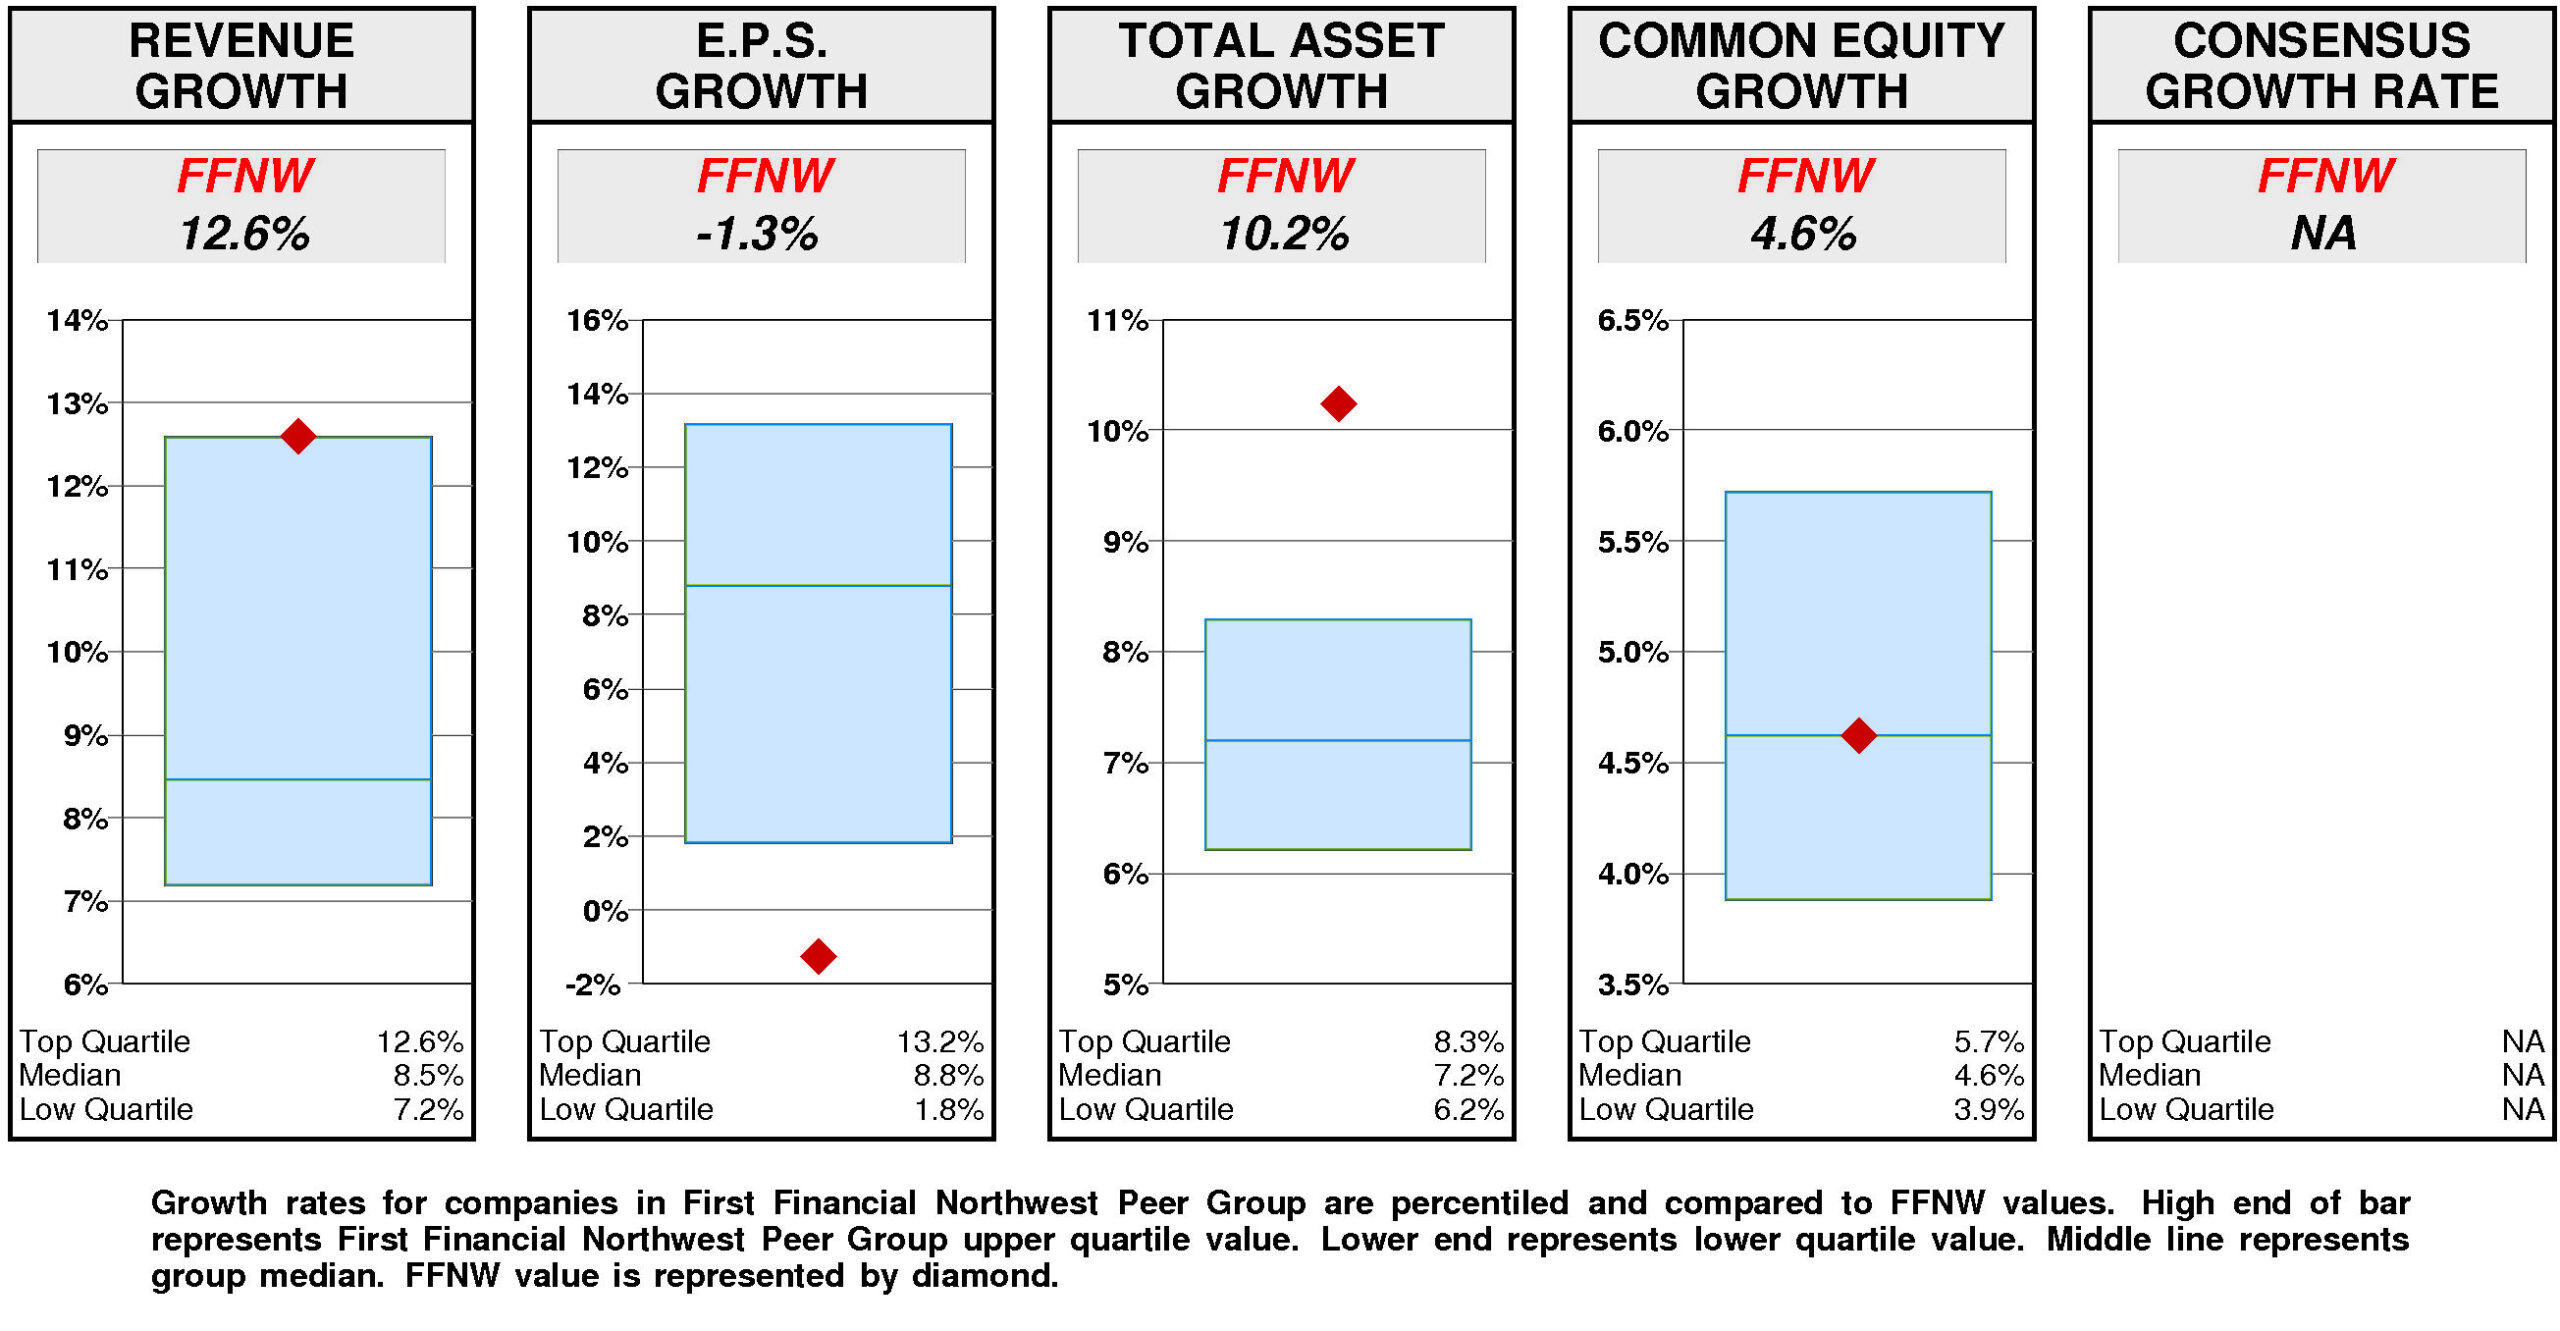
Relative to the First Financial Northwest Peer Group, First Financial Northwest's historical growth measures are erratic.
Total asset growth (10.2%) has been upper quartile. Revenue growth (12.6%) has been at the upper quartile. Equity growth (4.6%) has been at median. E.P.S. growth (-1.3%) has been lower quartile. Consensus growth forecast is unavailable.
PRICE HISTORY
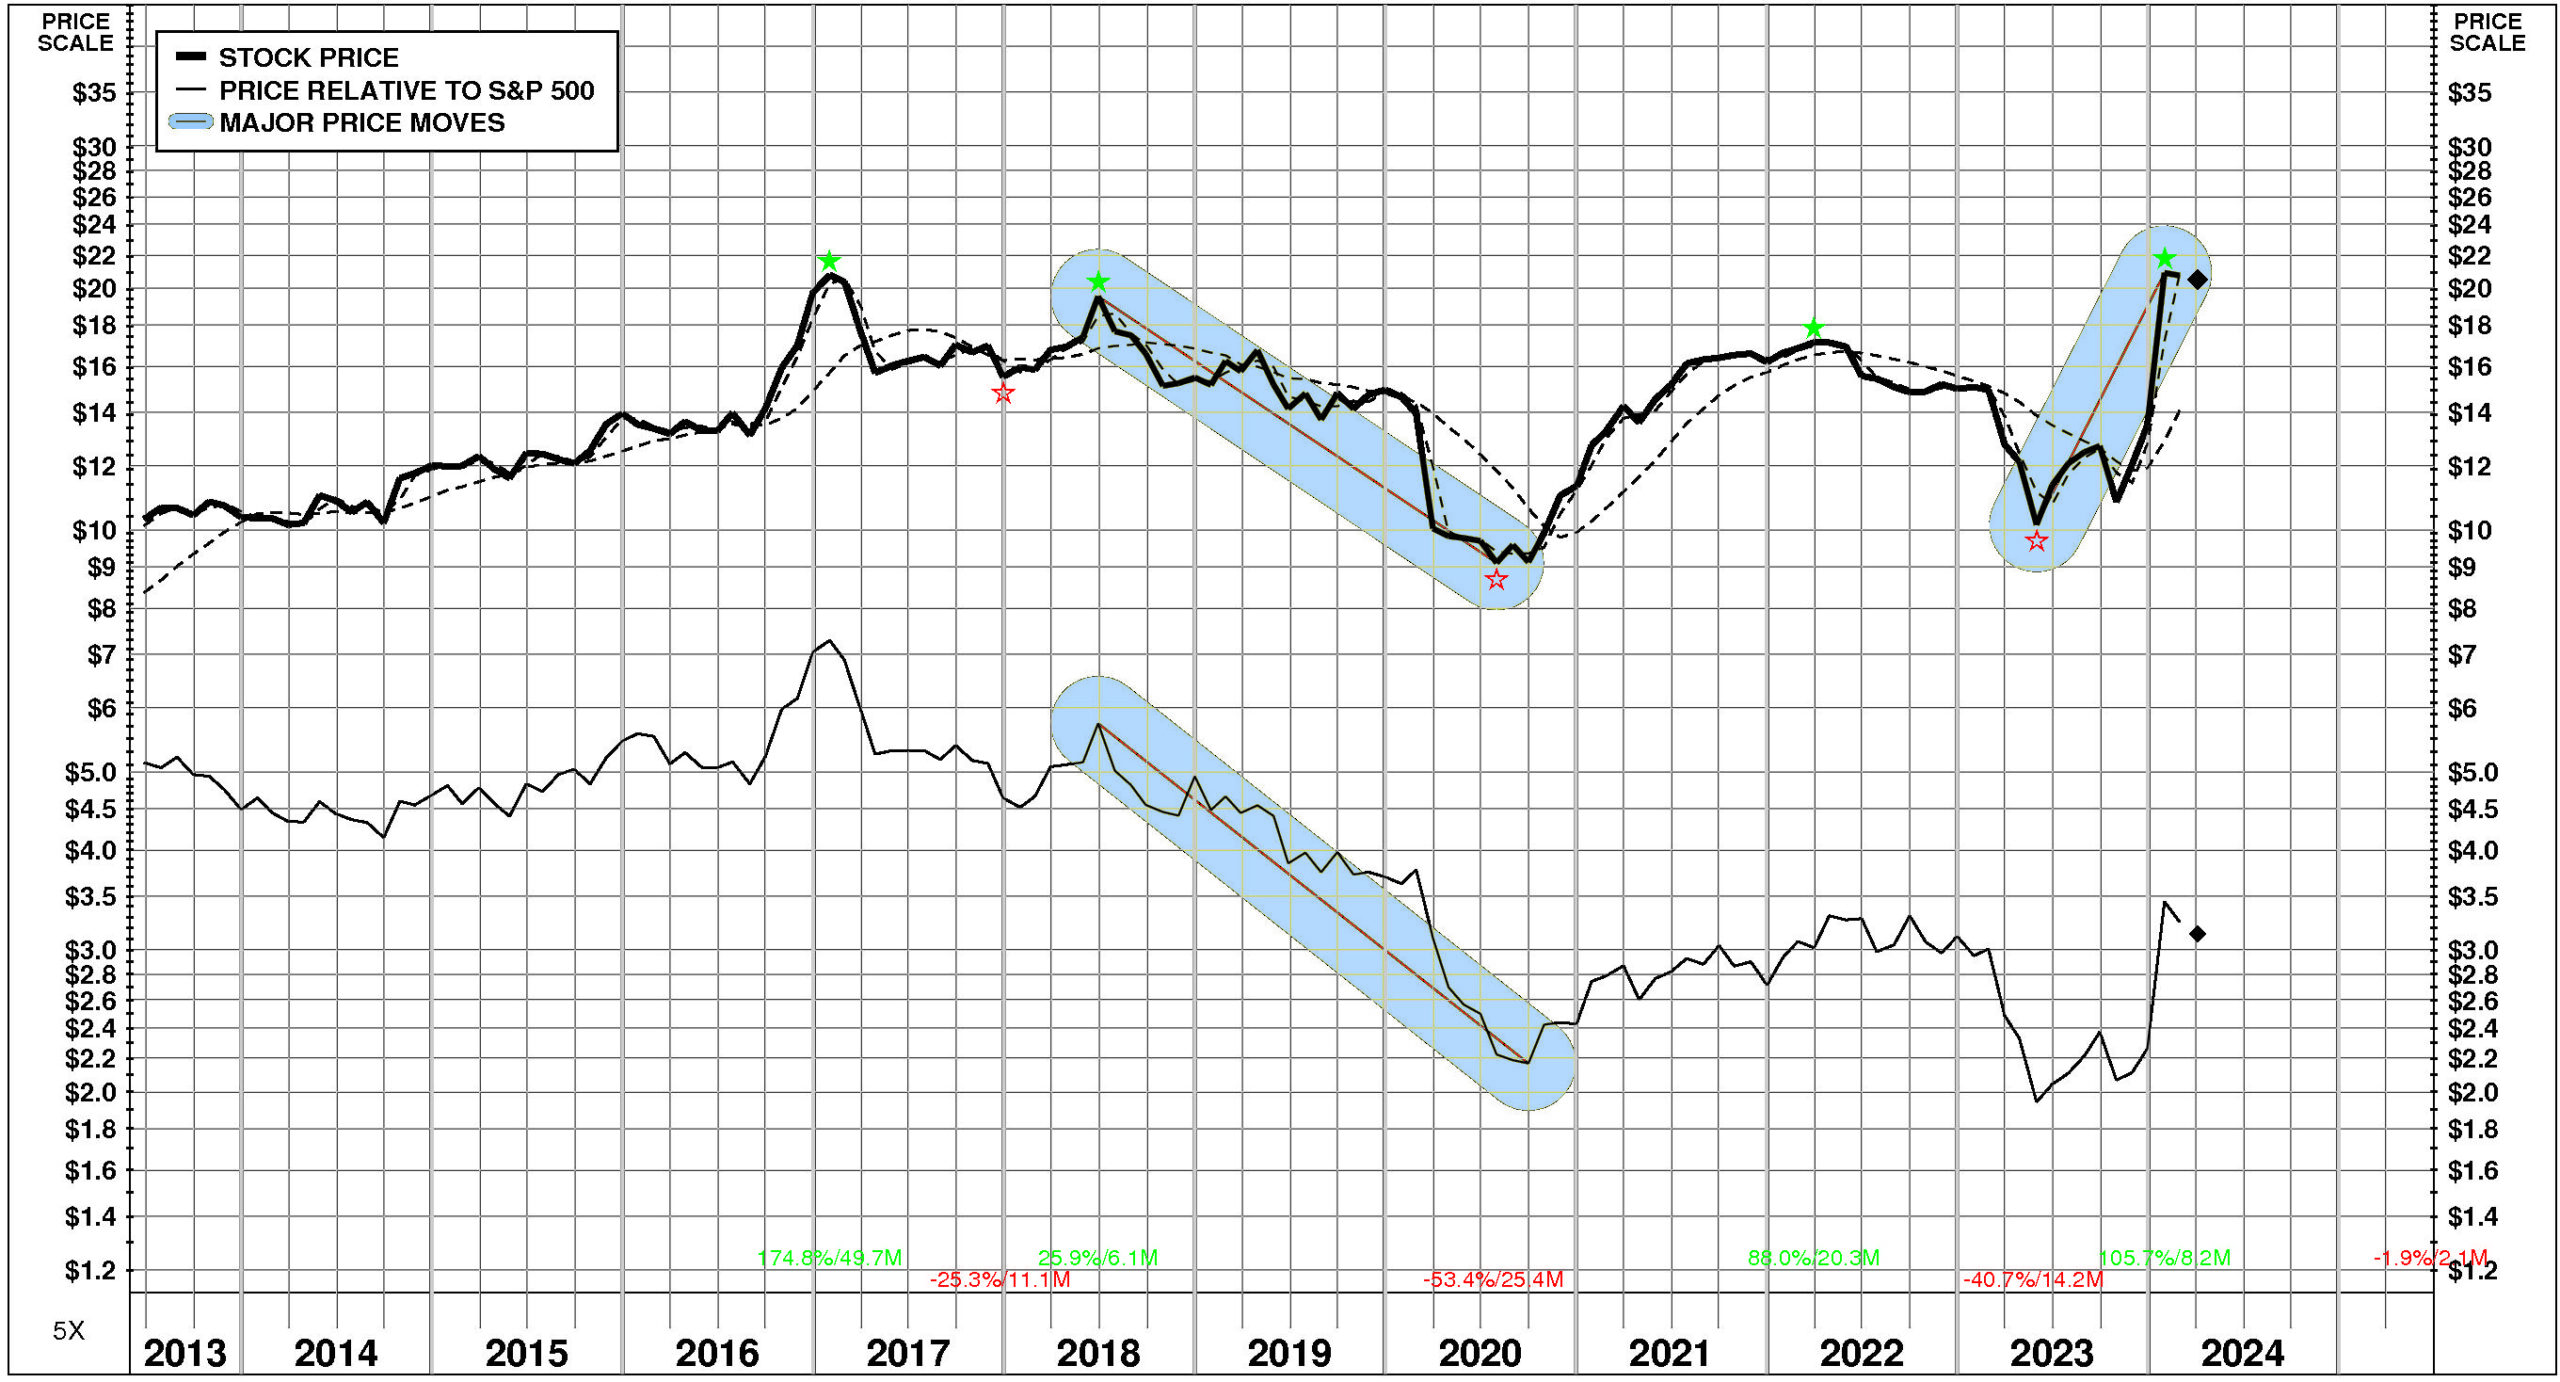
Over the full time period, First Financial Northwest's stock price performance has been below market.
Between June, 2013 and April, 2024, First Financial Northwest's stock price rose +99%; relative to the market, this was a -39% loss. Significant price moves during the period: 1) May, 2023 – January, 2024: +106%; and 2) June, 2018 – July, 2020: -53%.
TOTAL INVESTMENT RETURNS
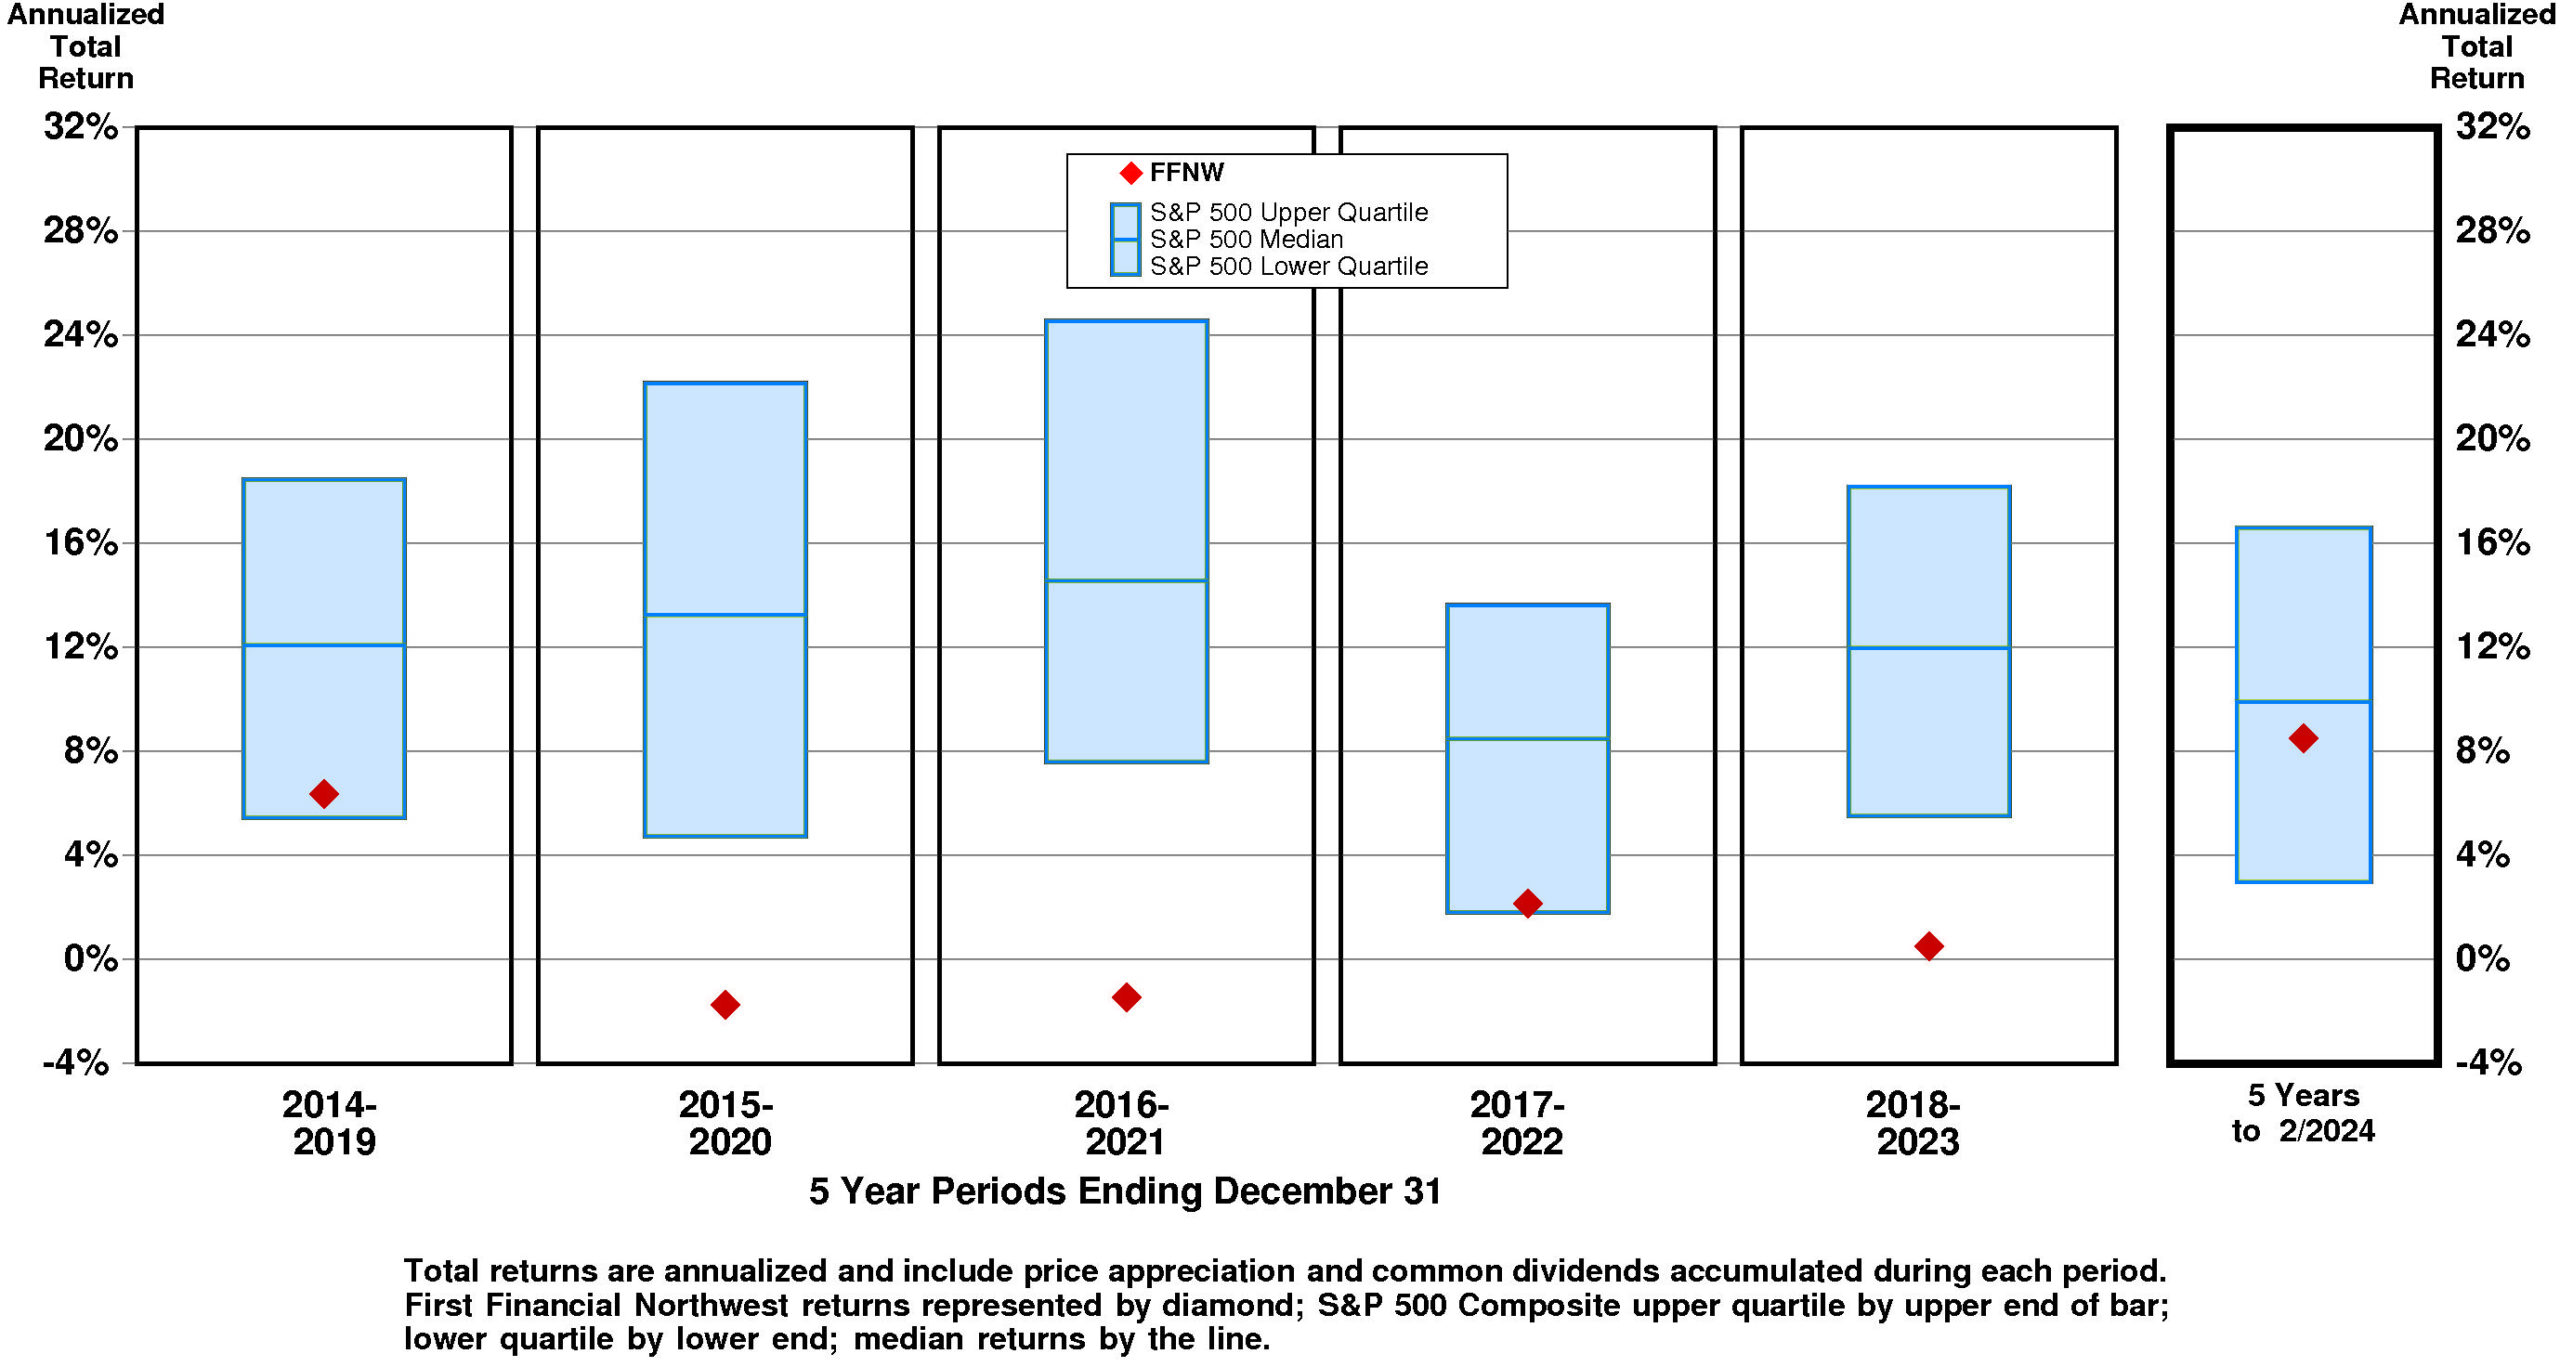
Current annual total return performance of 44.5% is upper quartile relative to the S&P 500 Composite.
In addition to being upper quartile relative to S&P 500 Composite, current annual total return performance through February, 2024 of 44.5% is upper quartile relative to First Financial Northwest Inc Peer Group.
Current 5-year total return performance of 8.5% is slightly below median relative to the S&P 500 Composite.
Through February, 2024, with slightly below median current 5-year total return of 8.5% relative to S&P 500 Composite, First Financial Northwest's total return performance is upper quartile relative to First Financial Northwest Inc Peer Group.
VALUATION BENCHMARKS
Relative to S&P 500 Composite, FFNW's overall valuation is normal.
The highest factor, the ratio of enterprise value/earnings before interest and taxes, is upper quartile. Ratio of enterprise value/revenue is slightly above median. Price/earnings ratio is slightly below median. Price/equity ratio is lower quartile. The lowest factor, the ratio of enterprise value/assets, is lower quartile.
Relative to First Financial Northwest Peer Group, FFNW's overall valuation is quite high.
The highest factor, the price/earnings ratio, is upper quartile. Ratio of enterprise value/earnings before interest and taxes is upper quartile. Price/equity ratio is at the upper quartile. Ratio of enterprise value/revenue is slightly above median. The lowest factor, the ratio of enterprise value/assets, is at median.
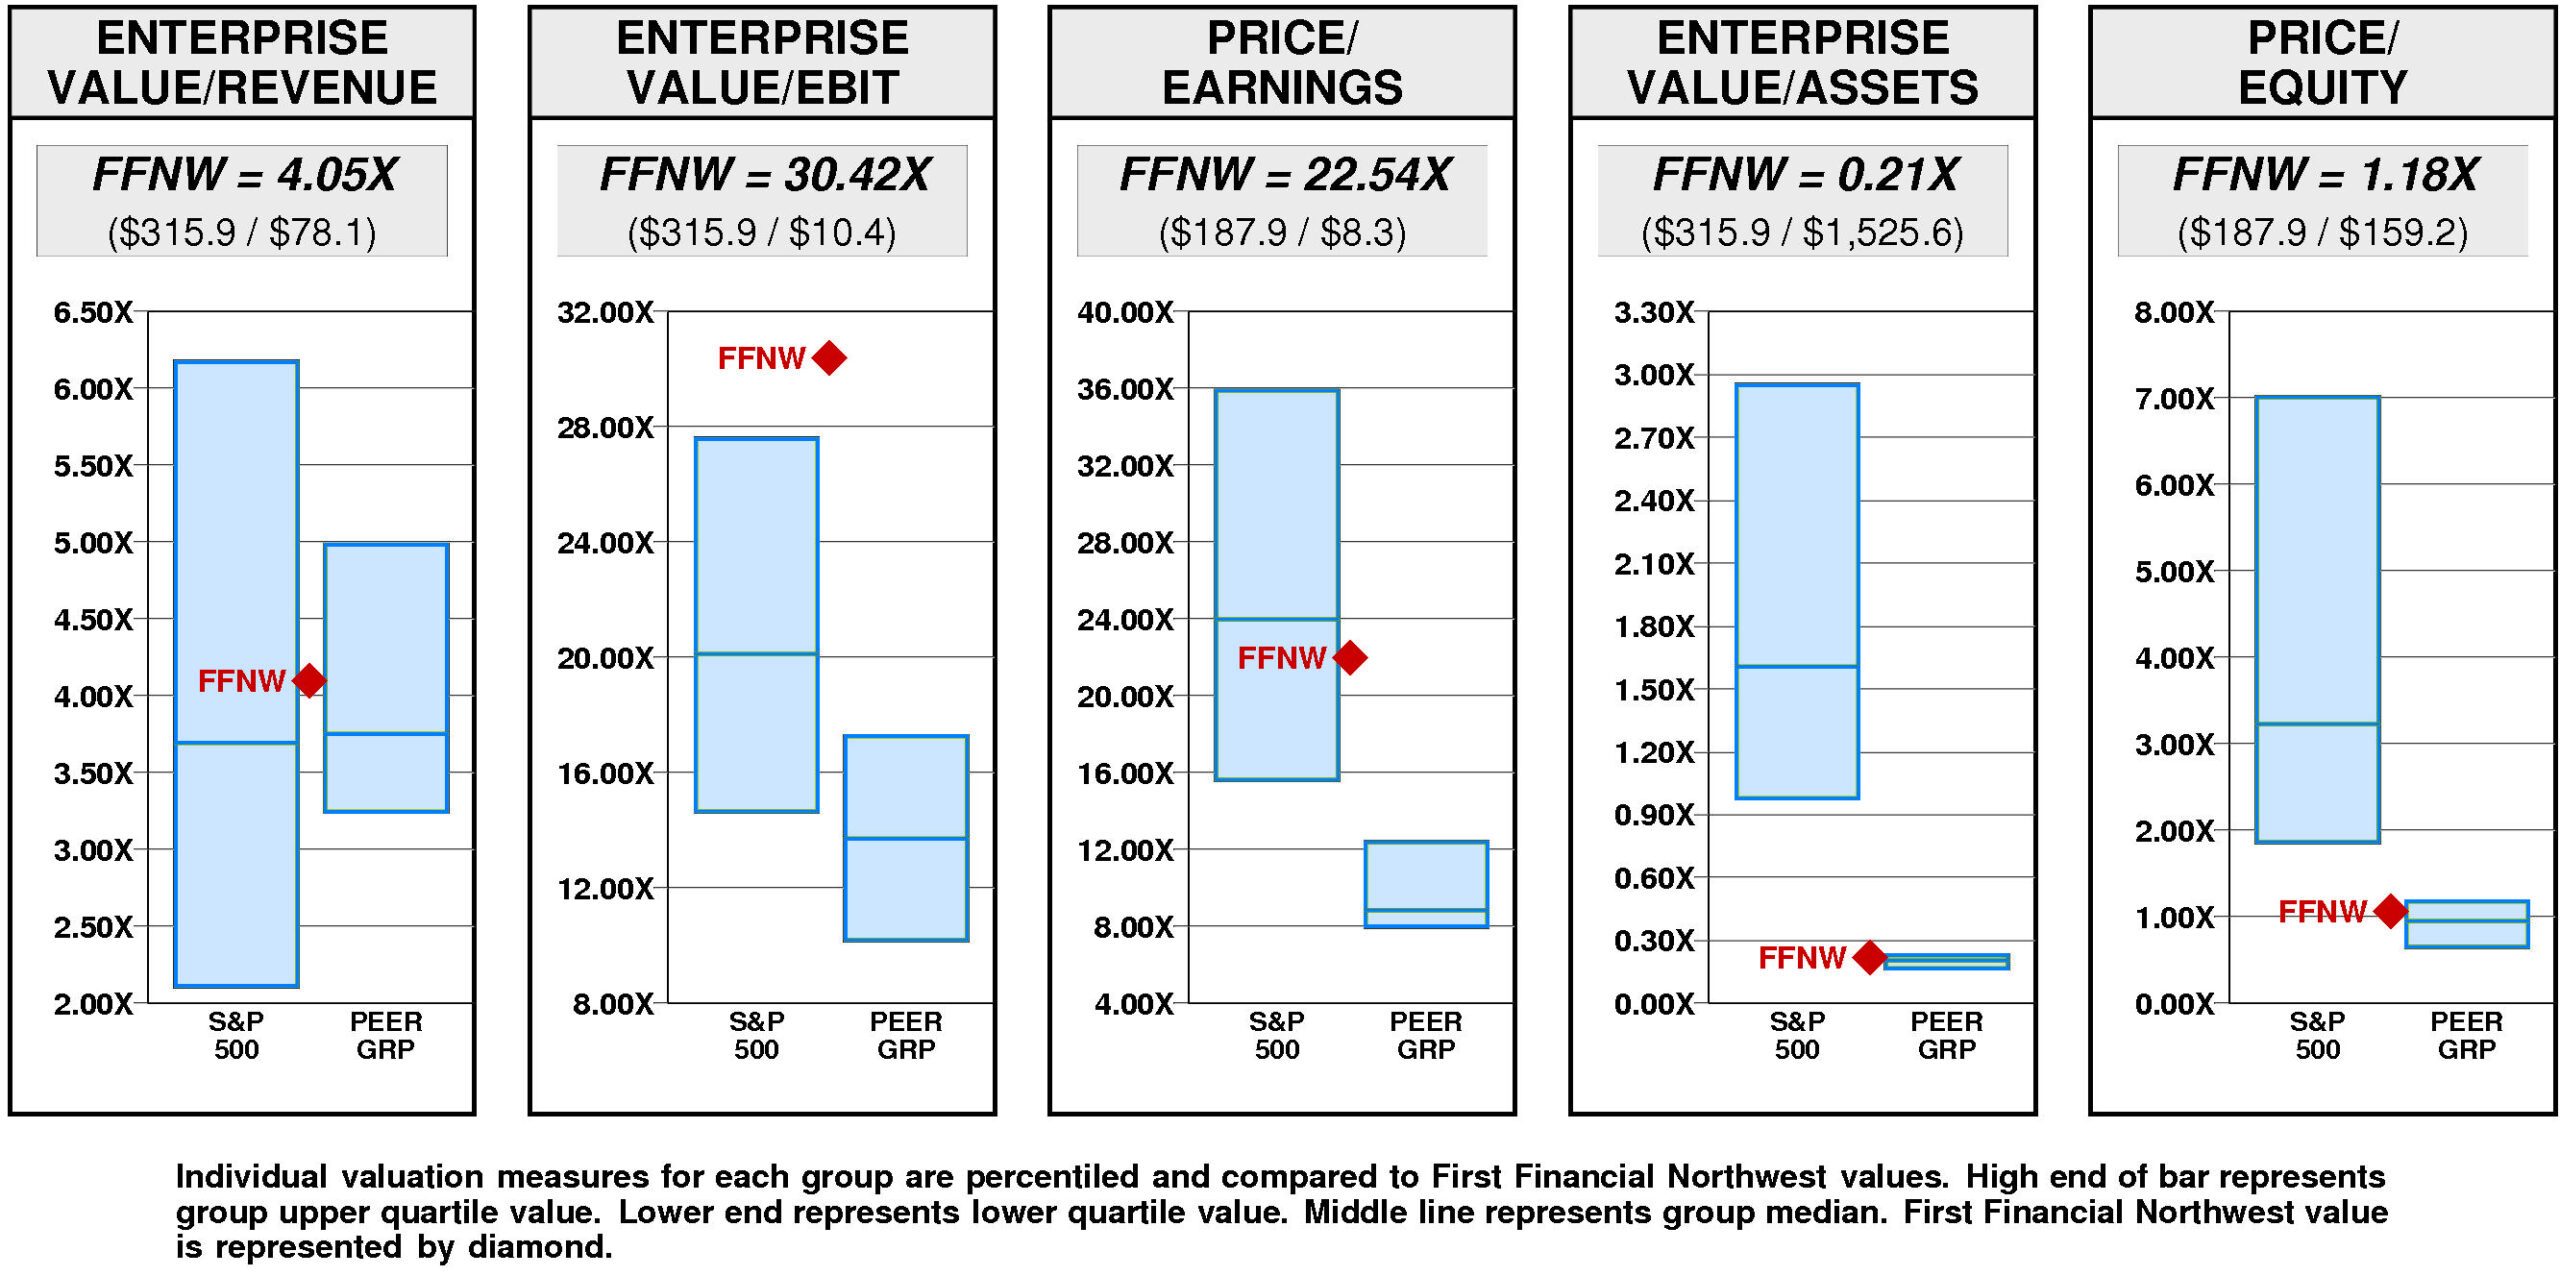
First Financial Northwest has a large value gap compared to the median.
For FFNW to achieve median valuation, its current ratio of enterprise value/revenue would have to fall from the current level of 4.05X to 3.75X. If FFNW's ratio of enterprise value/revenue were to fall to 3.75X, its stock price would be lower by $-3 to $18.
For FFNW to achieve upper quartile valuation relative to the First Financial Northwest Peer Group, its current ratio of enterprise value/revenue would have to rise from the current level of 4.05X to 4.98X. If FFNW's ratio of enterprise value/revenue were to rise to 4.98X, its stock price would increase by $8 from the current level of $20.
VALUE TARGETS
Reflecting future returns on capital that are forecasted to be in line with the cost of capital, FFNW is expected to continue to be Value Creation neutral.
First Financial Northwest's current Price Target of $18 represents a -12% change from the current price of $20.48.
This low appreciation potential results in an appreciation score of 28 (72% of the universe has greater appreciation potential.)
Notwithstanding this low Appreciation Score of 28, the high Power Rating of 93 results in an Value Trend Rating of C.
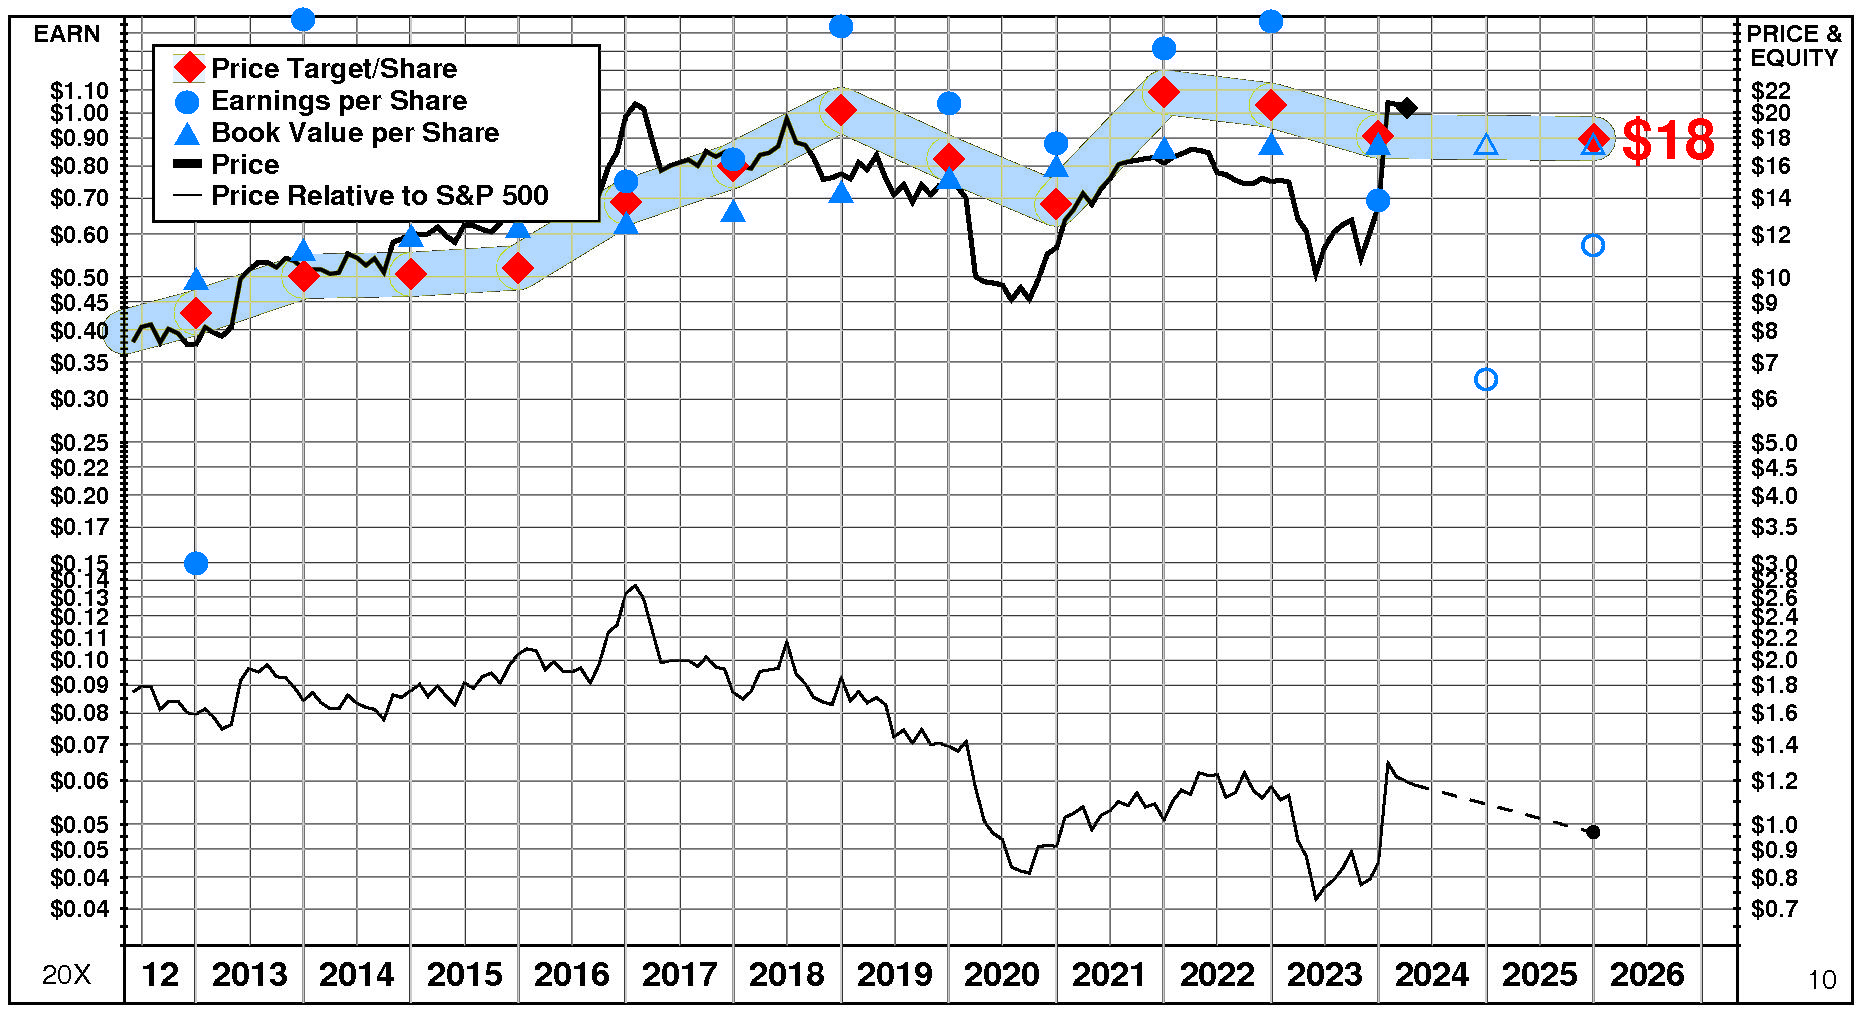
First Financial Northwest's current Price Target is $18 (-1% from the 2023 Target of $18 and -12% from the 04/03/24 price of $20.48).
This plateau in the Target is the result of a -4% decrease in the equity base and a +4% increase in the price/equity multiple. The forecasted decline in cost of equity has a very large positive impact on the price/equity multiple and the forecasted decline in growth has a very slight positive impact as well. Partially offsetting these Drivers, the forecasted decline in return on equity has a large negative impact.
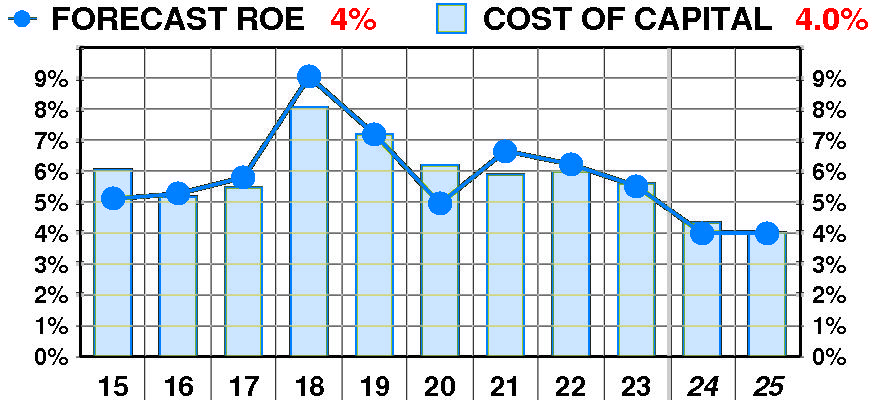
PTR's return on equity forecast is 4.0% — in line with our recent forecasts.
Forecasted return on equity exhibited a slight, erratic increase between 2015 and 2023. The current forecast is well below the 2018 peak of 9%.
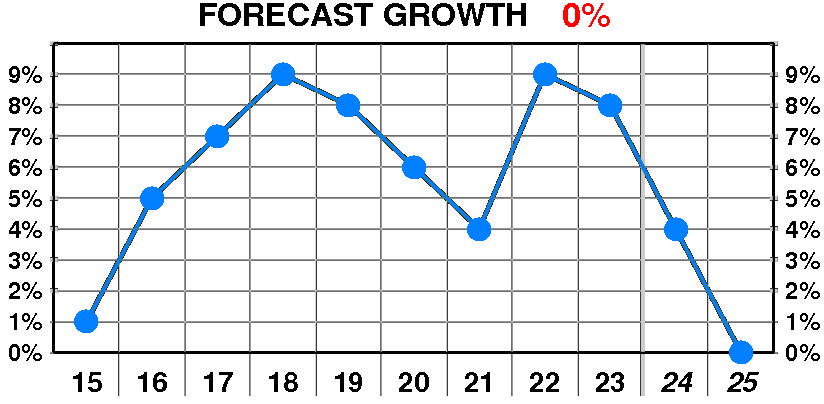
PTR's growth forecast is 0.0% — below our recent forecasts.
Forecasted growth enjoyed a dramatic, erratic increase between 2015 and 2023. The current forecast is well below the 2018 peak of 9%.
PTR's cost of equity forecast is 4.0% — in line with recent levels.
Forecasted cost of equity erratic but little changed between 2015 and 2023. The current forecast is below the 2018 peak of 8.1%.
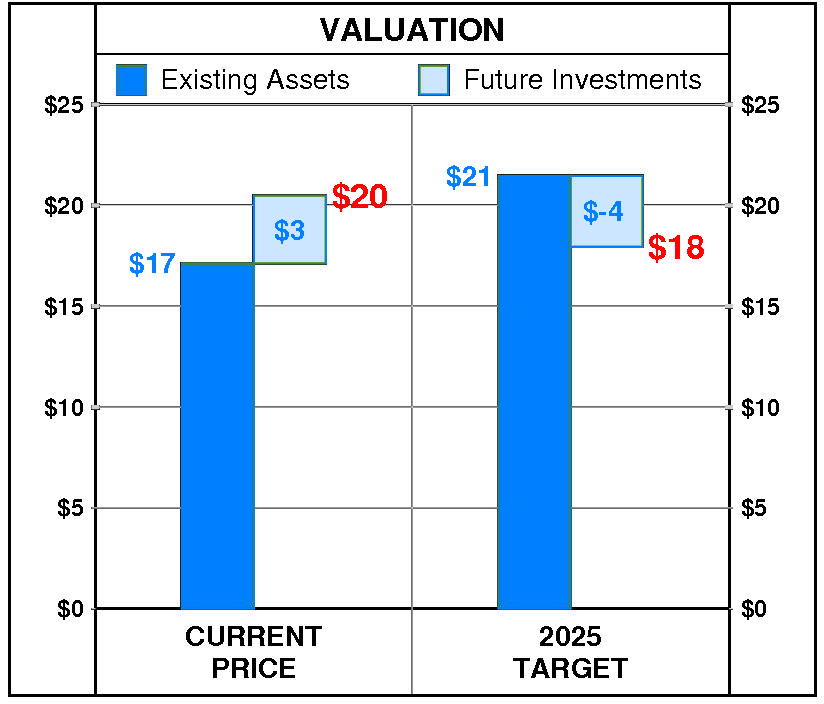 At First Financial Northwest's current price of $20.48, investors are placing a positive value of $3 on its future investments. This view is not supported by the company's most recent performance that reflected a growth rate of 8.0% per year, and a return on equity of 5.5% versus a cost of equity of 5.6%.
PTR's 2025 Price Target of $18 is based on these forecasts and reflects an estimated value of existing assets of $21 and a value of future investments of $-4.
At First Financial Northwest's current price of $20.48, investors are placing a positive value of $3 on its future investments. This view is not supported by the company's most recent performance that reflected a growth rate of 8.0% per year, and a return on equity of 5.5% versus a cost of equity of 5.6%.
PTR's 2025 Price Target of $18 is based on these forecasts and reflects an estimated value of existing assets of $21 and a value of future investments of $-4.