BUSINESS
Asbury Automotive Group, Inc., together with its subsidiaries, operates as an automotive retailer in the United States. It offers a range of automotive products and services, including new and used vehicles; and vehicle repair and maintenance services, replacement parts, and collision repair services. The company also provides finance and insurance products, including arranging vehicle financing through third parties; and aftermarket products, such as extended service contracts, guaranteed asset protection debt cancellation, prepaid maintenance, and credit life and disability insurance. As of December 31, 2021, the company owned and operated 205 new vehicle franchises representing 31 brands of automobiles at 155 dealership locations; and 35 collision centers in the United States. Asbury Automotive Group, Inc. was founded in 1996 and is headquartered in Duluth, Georgia.
INVESTMENT RATING

With future capital returns forecasted to exceed the cost of capital, ABG is expected to continue to be an important Value Builder.
ASBury Automotive Group has a current Value Trend Rating of C (High Neutral). This rating combines very contradictory signals from two proprietary PTR measures of a stock’s attractiveness. ASBury Automotive Group has a very high Appreciation Score of 91 but a slightly negative Power Rating of 32, resulting in the High Neutral Value Trend Rating.
ASBury Automotive Group’s stock is selling well below targeted value. The current stock price of $226.36 compares to targeted value 12 months forward of $815.
ASBury Automotive Group’s very high appreciation potential results in an appreciation score of 91 (only 9% of the universe has greater appreciation potential.)
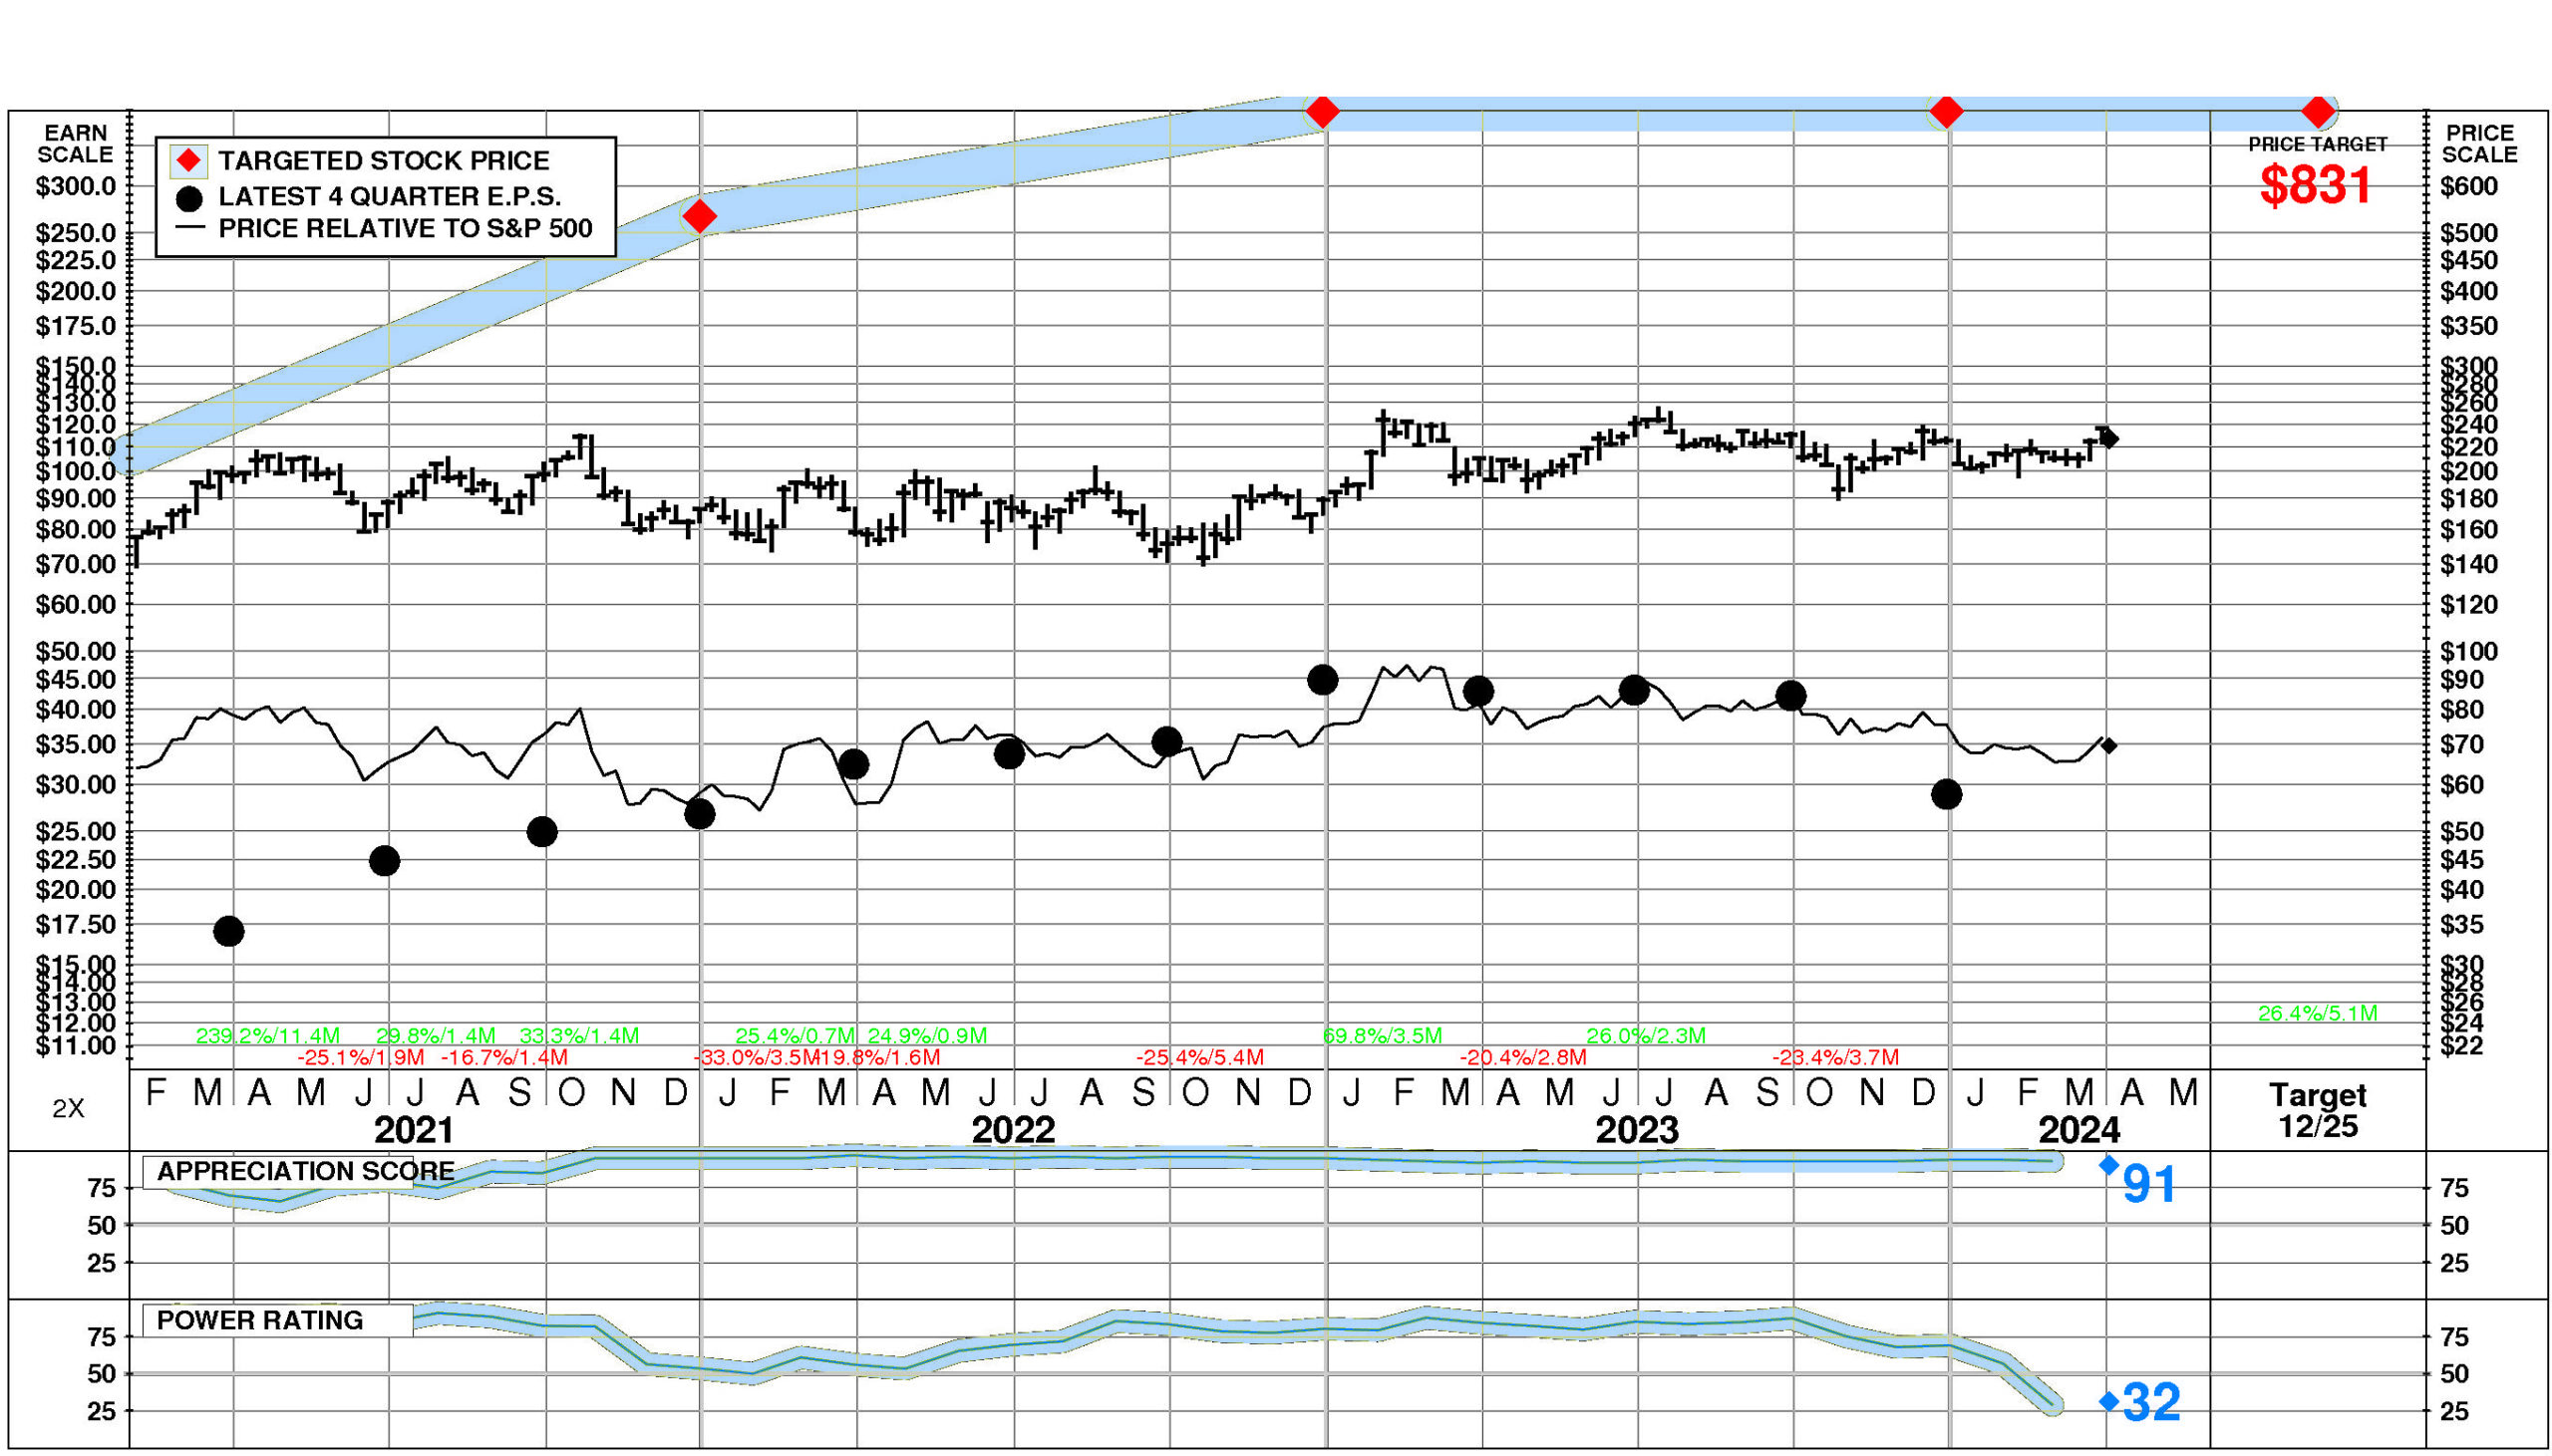
ASBury Automotive Group has a Power Rating of 32. (This slightly negative Power Rating indicates that ABG only has a better chance of achieving attractive investment performance over the near to intermediate term than 32% of companies in the universe.) Factors contributing to this slightly negative Power Rating include: earnings estimate behavior for ABG has been slightly negative recently; the Auto Dealers, Gas Stations comparison group is in a slightly weakened position currently; and recent price action has been slightly unfavorable.
INVESTMENT PROFILE
ABG’s financial strength is high. Financial strength rating is 78.
Relative to the S&P 500 Composite, ASBury Automotive Group Inc has both Growth and Value characteristics; its appeal is likely to be to Capital Gain-oriented investors; the perception is that ABG is normal risk. Low expected growth is a relative weakness for ABG. ABG’s valuation is low: low dividend yield, low P/E ratio, and low price/book ratio. ABG has unusually low market capitalization.
CURRENT SIGNALS
ASBury Automotive Group’s current operations are eroding. Return on equity is falling, reflecting: falling asset utilization; declining pretax margin; falling tax keep rate; and falling leverage.
ASBury Automotive Group’s current technical position is mixed. The stock price is in a 5.1 month up move. The stock has appreciated 26.4% from its prior low. The 200 day moving average is in a downtrend. The stock price is above its 200 day moving average.
ALERTS
Asbury Automotive Group Inc (NYSE: ABG) has recently experienced small negative changes in fundamentals: significant quarterly earnings deceleration occurred. The stock is currently rated C. On 4/2/24, Asbury Automotive Group Inc (NYSE: ABG) stock declined by -3.4%, closing at $226.36. This decline was accompanied by normal trading volume. Relative to the market the stock has been weak over the last nine months but has risen 1.0% during the last week.CASH FLOW
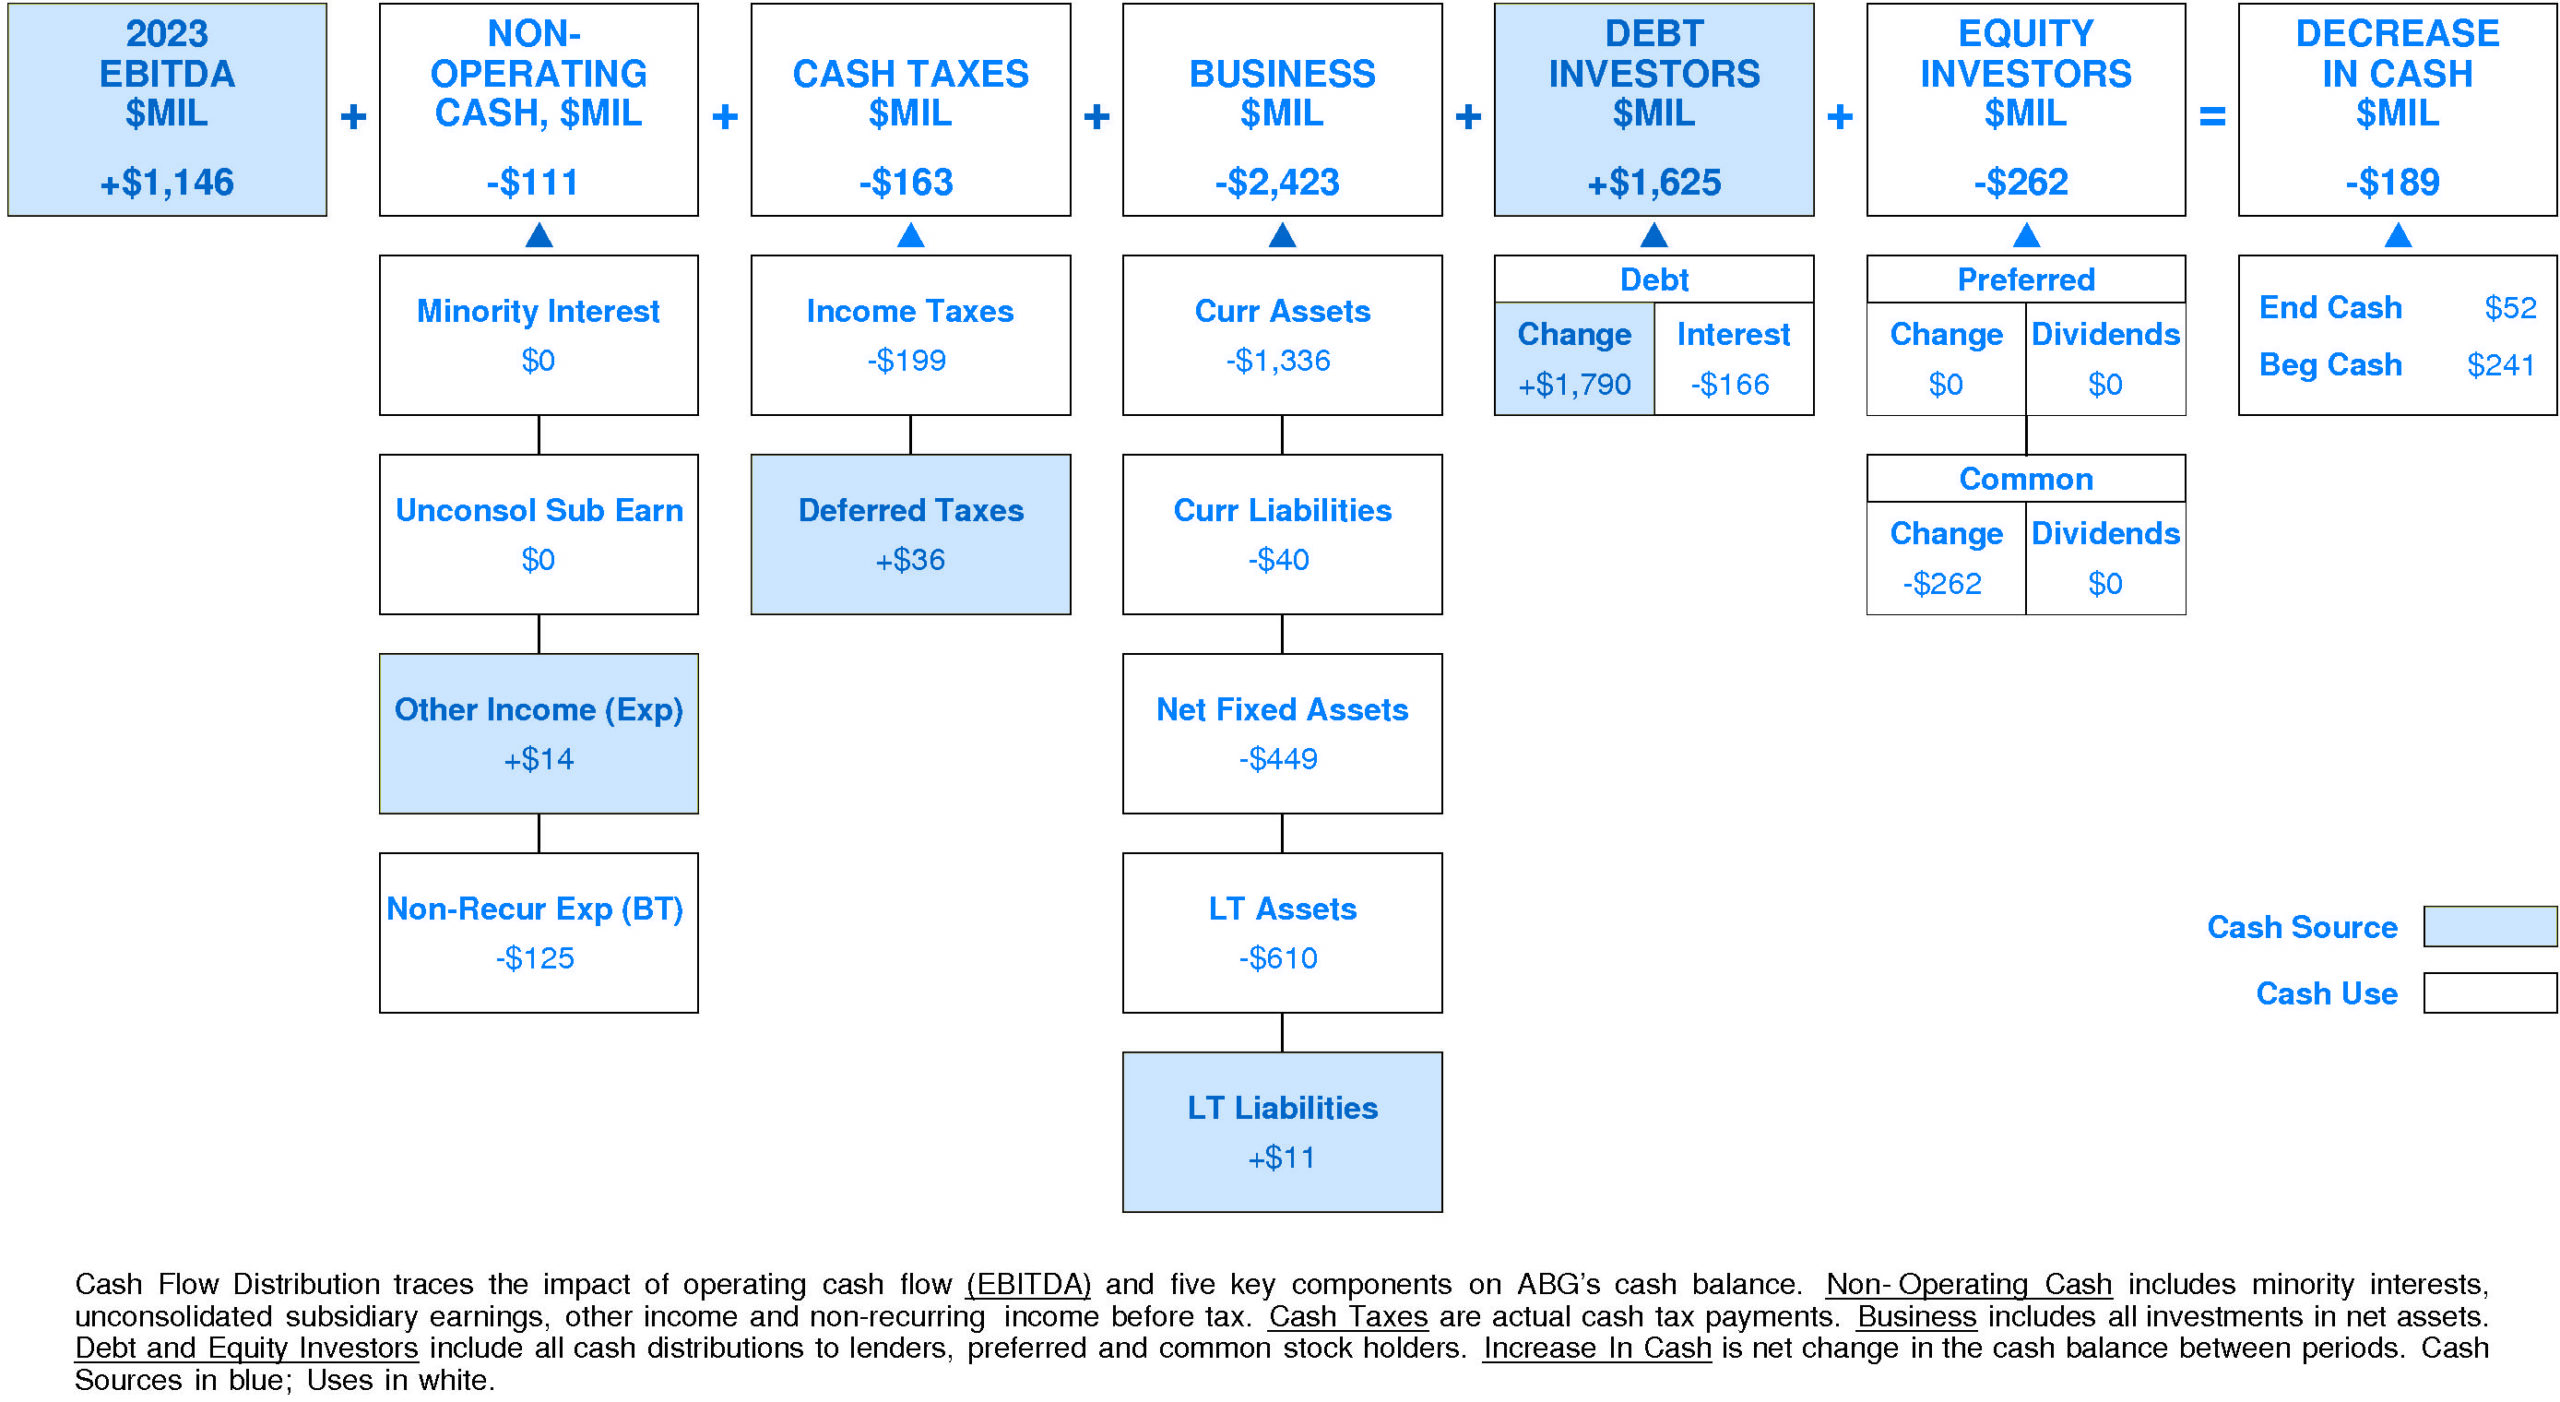
In 2023, ASBury Automotive Group experienced a very significant reduction in cash of -$189 million (-78%). Sources of cash were much lower than uses. Cash generated from 2023 EBITDA totaled +$1,146 million. Non-operating uses consumed -$111 million (-10% of EBITDA). Cash taxes consumed -$163 million (-14% of EBITDA). Re-investment in the business amounted to -$2,423 million (-211% of EBITDA). On a net basis, debt investors provided +$1,625 million (+142% of EBITDA) while equity investors withdrew -$262 million (-23% of EBITDA).
ABG’s Non-operating Income, %EBITDA has exhibited little to no overall change over the period. This stability was accompanied by stability for the Asbury Automotive Group Peer Group as well. In most years, ASBury Automotive Group was in the top quartile and third quartile. Currently, ASBury Automotive Group is lower quartile at -10% of EBITDA (-$111 million).
ABG’s Cash Taxes, %EBITDA has exhibited a very small overall uptrend over the period. This improvement was accompanied by a similar trend for the Asbury Automotive Group Peer Group. (Since 2021 Cash Taxes, %EBITDA has accelerated.) In most years, ASBury Automotive Group was in the second quartile and third quartile. Currently, ASBury Automotive Group is above median at -14% of EBITDA (-$163 million).
ABG’s Business Re-investment, %EBITDA has suffered a volatile overall downtrend over the period. This downtrend was accompanied by a similar trend for the Asbury Automotive Group Peer Group. In most years, ASBury Automotive Group was in the lower quartile and top quartile. Currently, ASBury Automotive Group is lower quartile at -211% of EBITDA (-$2,423 million).
ABG’s Debt Investors, %EBITDA has experienced a volatile overall uptrend over the period. This improvement was accompanied by an opposite trend for the Asbury Automotive Group Peer Group. In most years, ASBury Automotive Group was in the top quartile and lower quartile. Currently, ASBury Automotive Group is upper quartile at +142% of EBITDA (+$1,625 million).
ABG’s Equity Investors, %EBITDA has enjoyed a very strong overall uptrend over the period. This improvement was accompanied by stability for the Asbury Automotive Group Peer Group. (Since 2021 Equity Investors, %EBITDA has experienced a very sharp decline.) In most years, ASBury Automotive Group was in the second quartile and lower quartile. Currently, ASBury Automotive Group is slightly above median at -23% of EBITDA (-$262 million).
ABG’s Change in Cash, %EBITDA has exhibited little to no overall change over the period. This stability was accompanied by a downtrend for the Asbury Automotive Group Peer Group. (Since 2021 Change in Cash, %EBITDA has experienced a very sharp decline.) In most years, ASBury Automotive Group was in the third quartile and second quartile. Currently, ASBury Automotive Group is substantially below median at -16% of EBITDA (-$189 million).
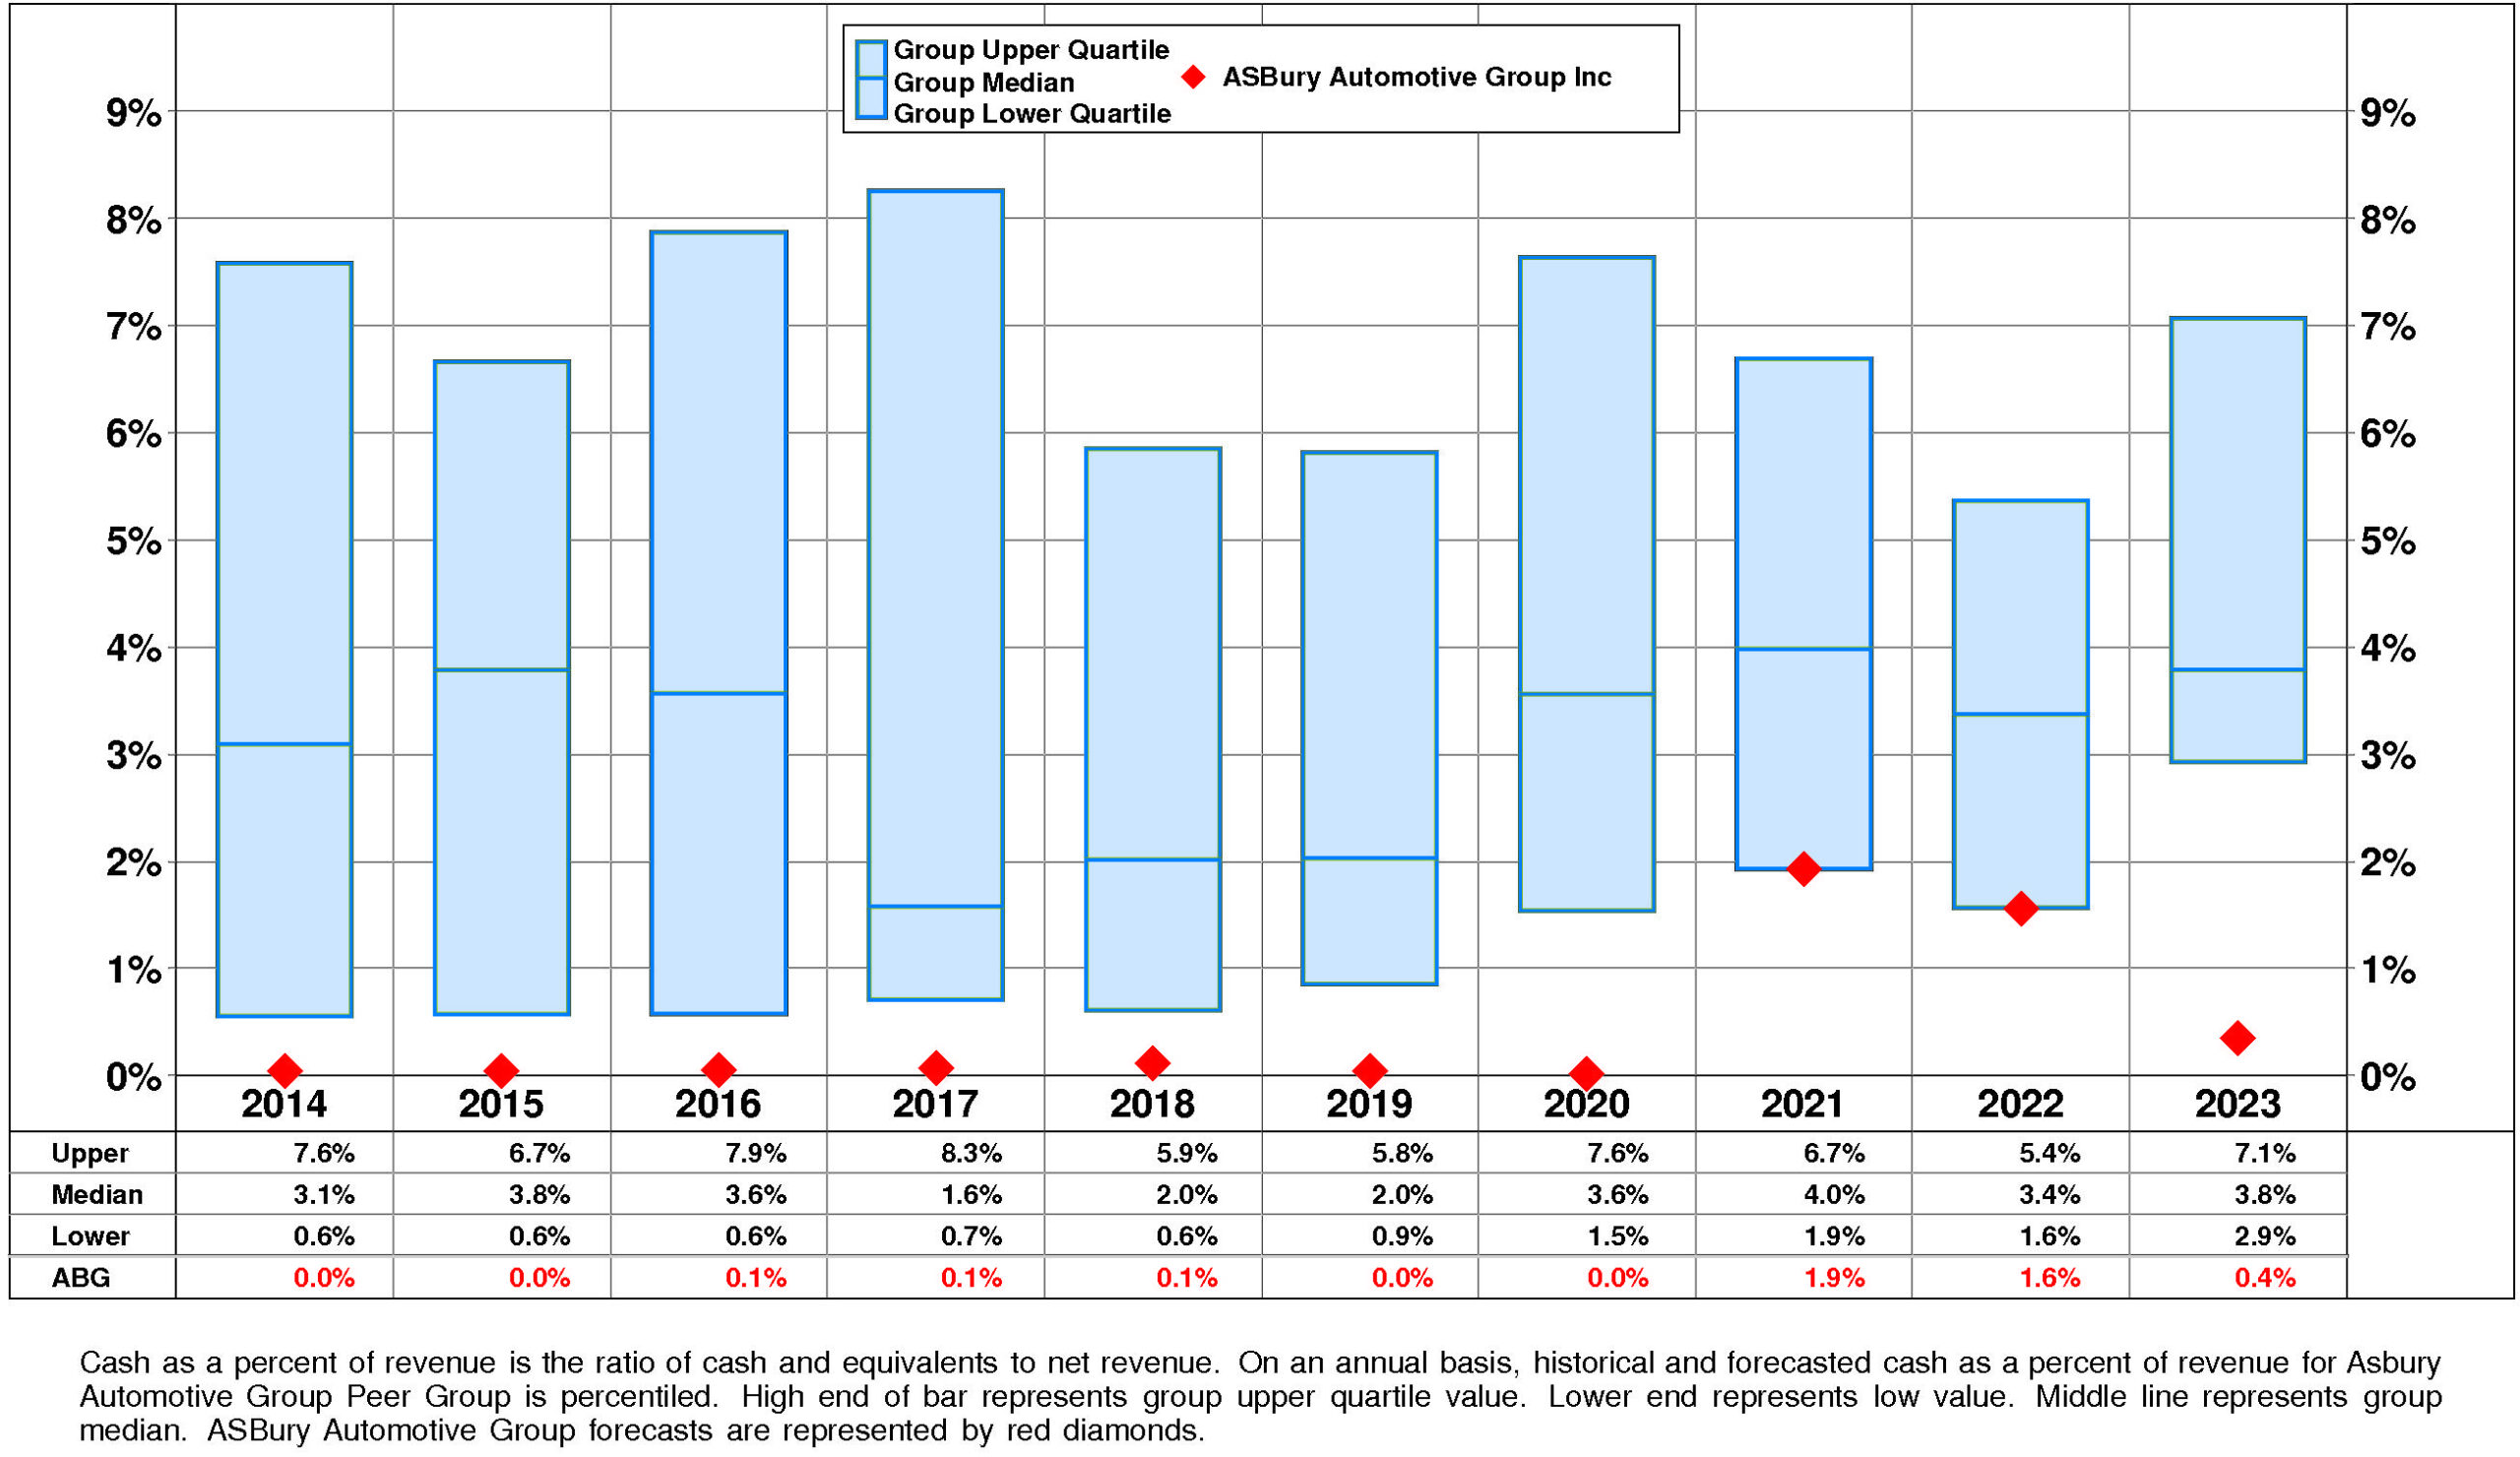
ABG’s Cash, %Revenue has exhibited little to no overall change over the period. This stability was accompanied by stability for the Asbury Automotive Group Peer Group as well. In most years, ASBury Automotive Group was in the lower quartile. Currently, ASBury Automotive Group is lower quartile at +0%.
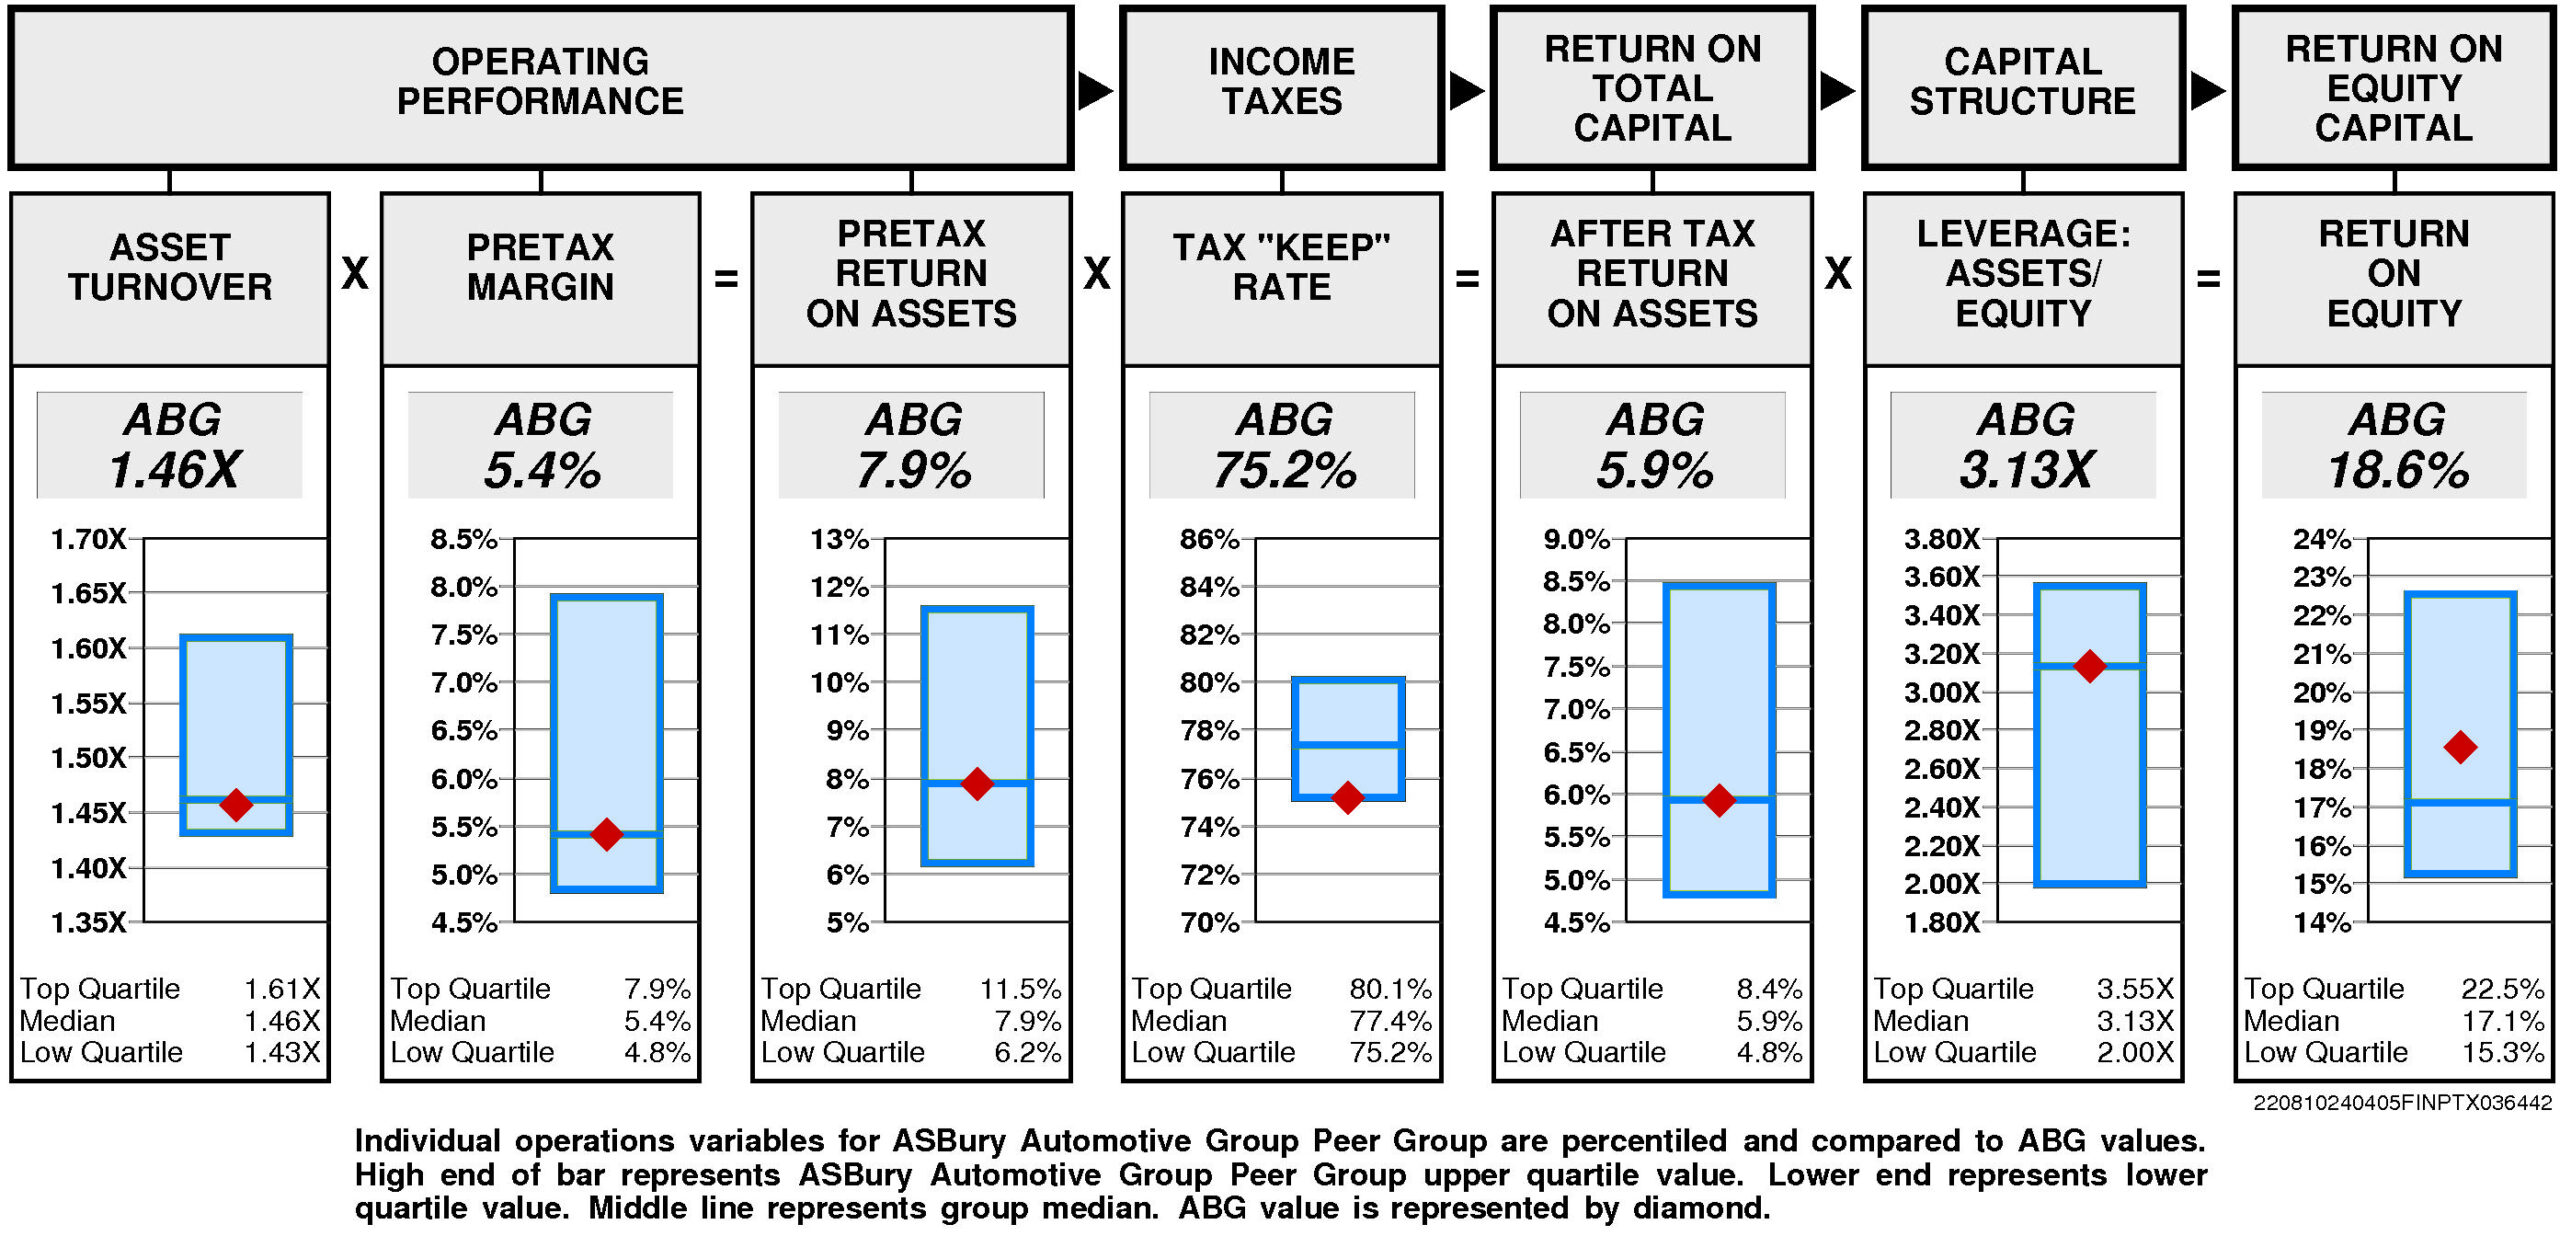
PROFITABILITY
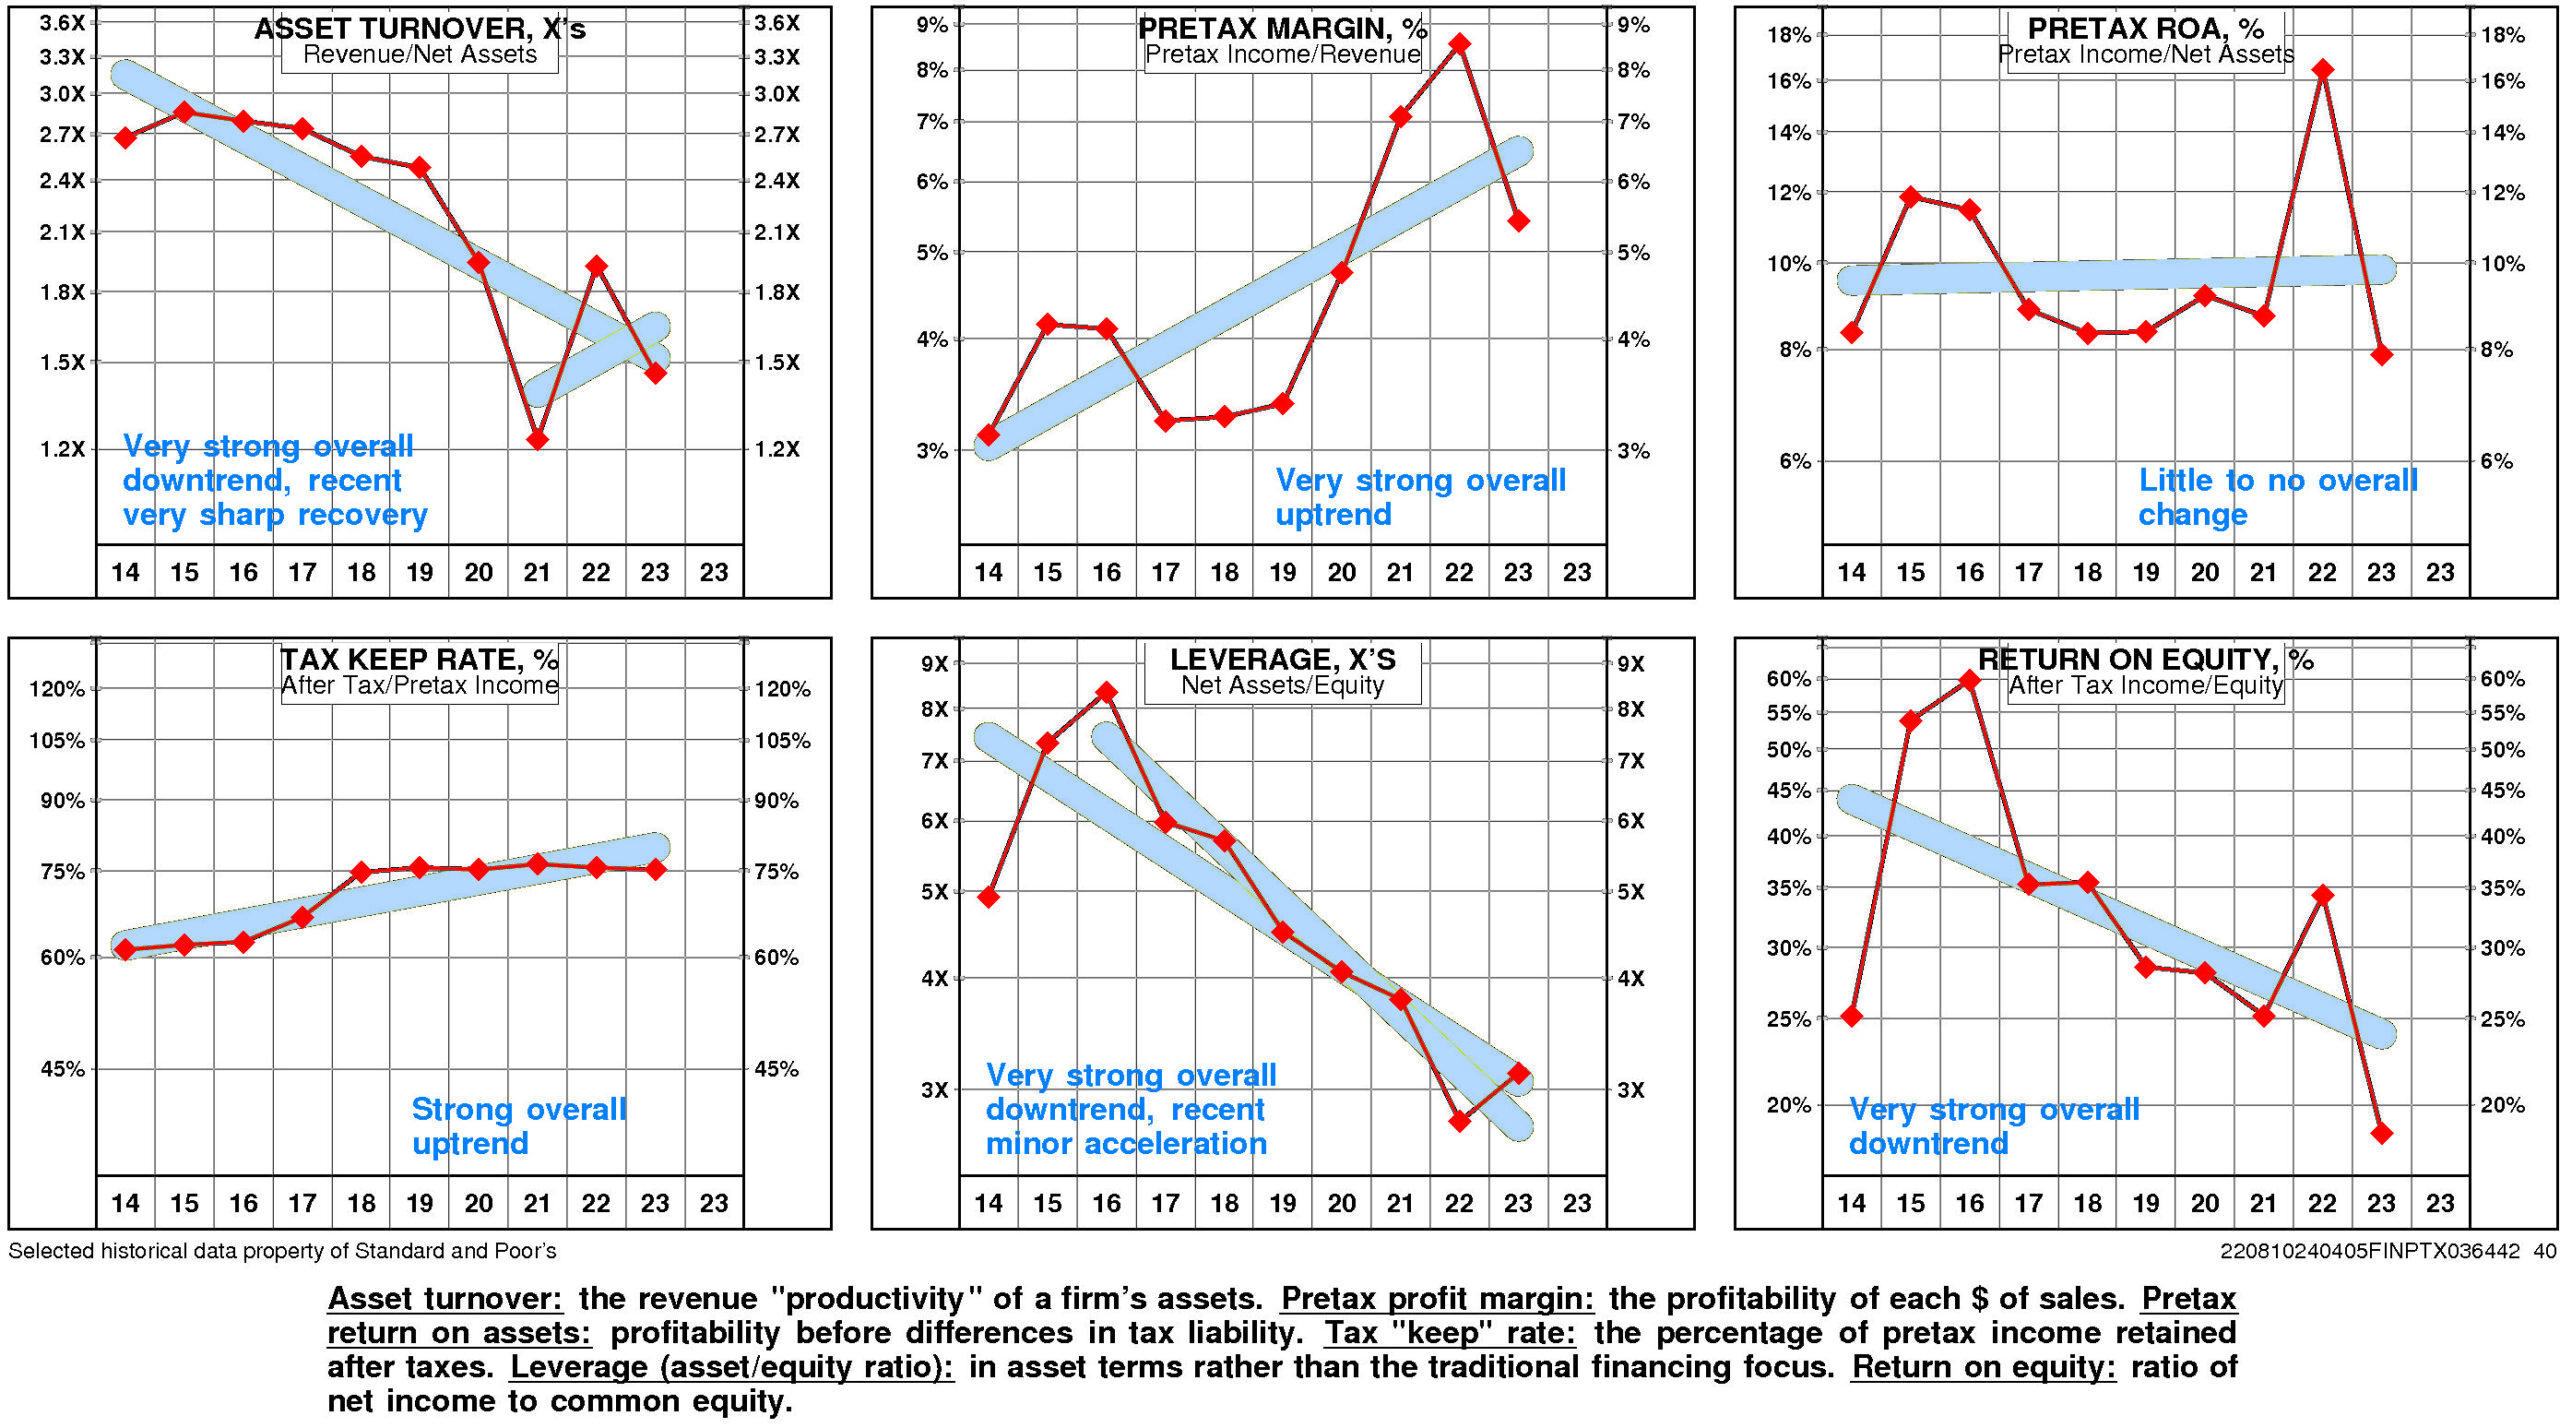
ABG’s return on equity has eroded very significantly since 2014.
A major analytical focus for ABG is a little change in pretax operating return significantly offset by a very strong negative trend in non-operating factors.
The productivity of ABG’s assets declined over the full period 2014-2023: asset turnover has suffered a very strong overall downtrend although it experienced a very sharp recovery after the 2022 low.
ABG’s pretax margin enjoyed a very strong overall uptrend over the period 2014-2023.
Non-operating factors (income taxes and financial leverage) had a significant negative influence on return on equity.
ABG’s return on equity is unavailable for the four quarters ended December, 2023.
 Operating performance (pretax return on assets) is unavailable reflecting asset turnover that is unavailable and unavailable pretax margin .
Tax “keep” rate (income tax management) is unavailable resulting in after tax return on assets that is unavailable.
Financial leverage (leverage) is unavailable .
Operating performance (pretax return on assets) is unavailable reflecting asset turnover that is unavailable and unavailable pretax margin .
Tax “keep” rate (income tax management) is unavailable resulting in after tax return on assets that is unavailable.
Financial leverage (leverage) is unavailable .
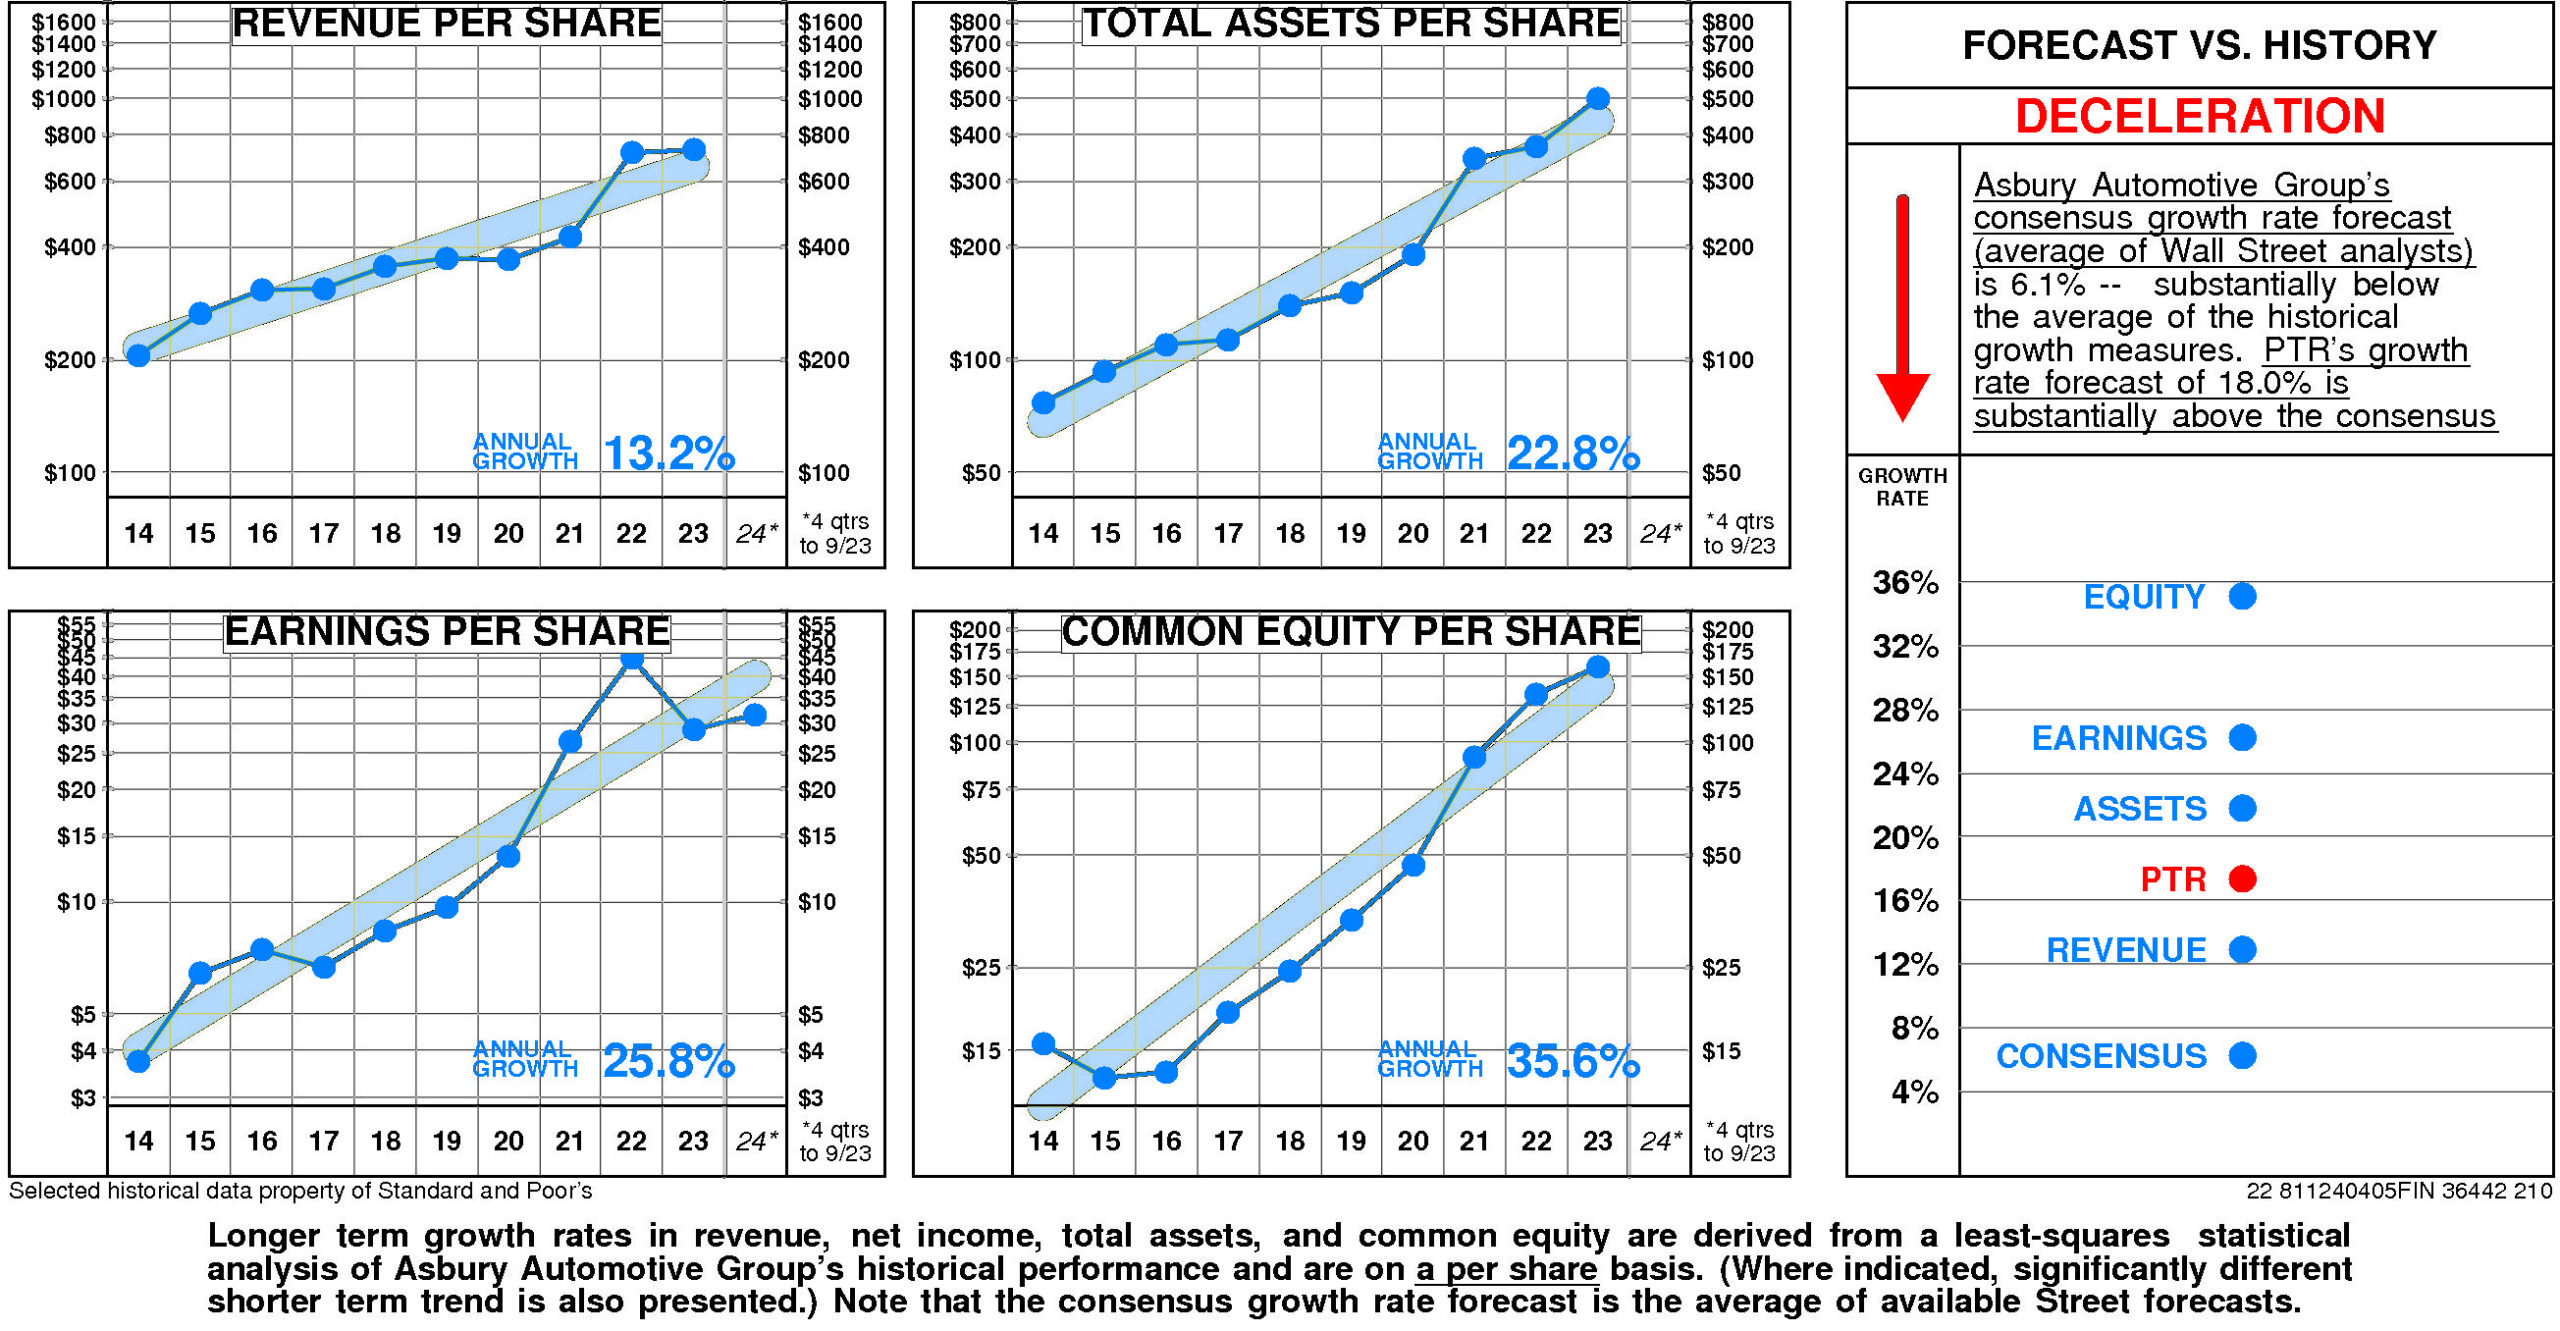
GROWTH RATES
There are no significant differences between Asbury Automotive Group’s longer term growth and growth in recent years. Asbury Automotive Group’s historical income statement growth has been lower than balance sheet growth. Revenue growth has fallen short of asset growth; earnings growth has fallen short of equity growth.Annual revenue growth has been 13.2% per year.
Total asset growth has been 22.8% per year.
Annual E.P.S. growth has been 25.8% per year.
Equity growth has been 35.6% per year.
Asbury Automotive Group’s consensus growth rate forecast (average of Wall Street analysts) is 6.1% — substantially below the average of the historical growth measures.
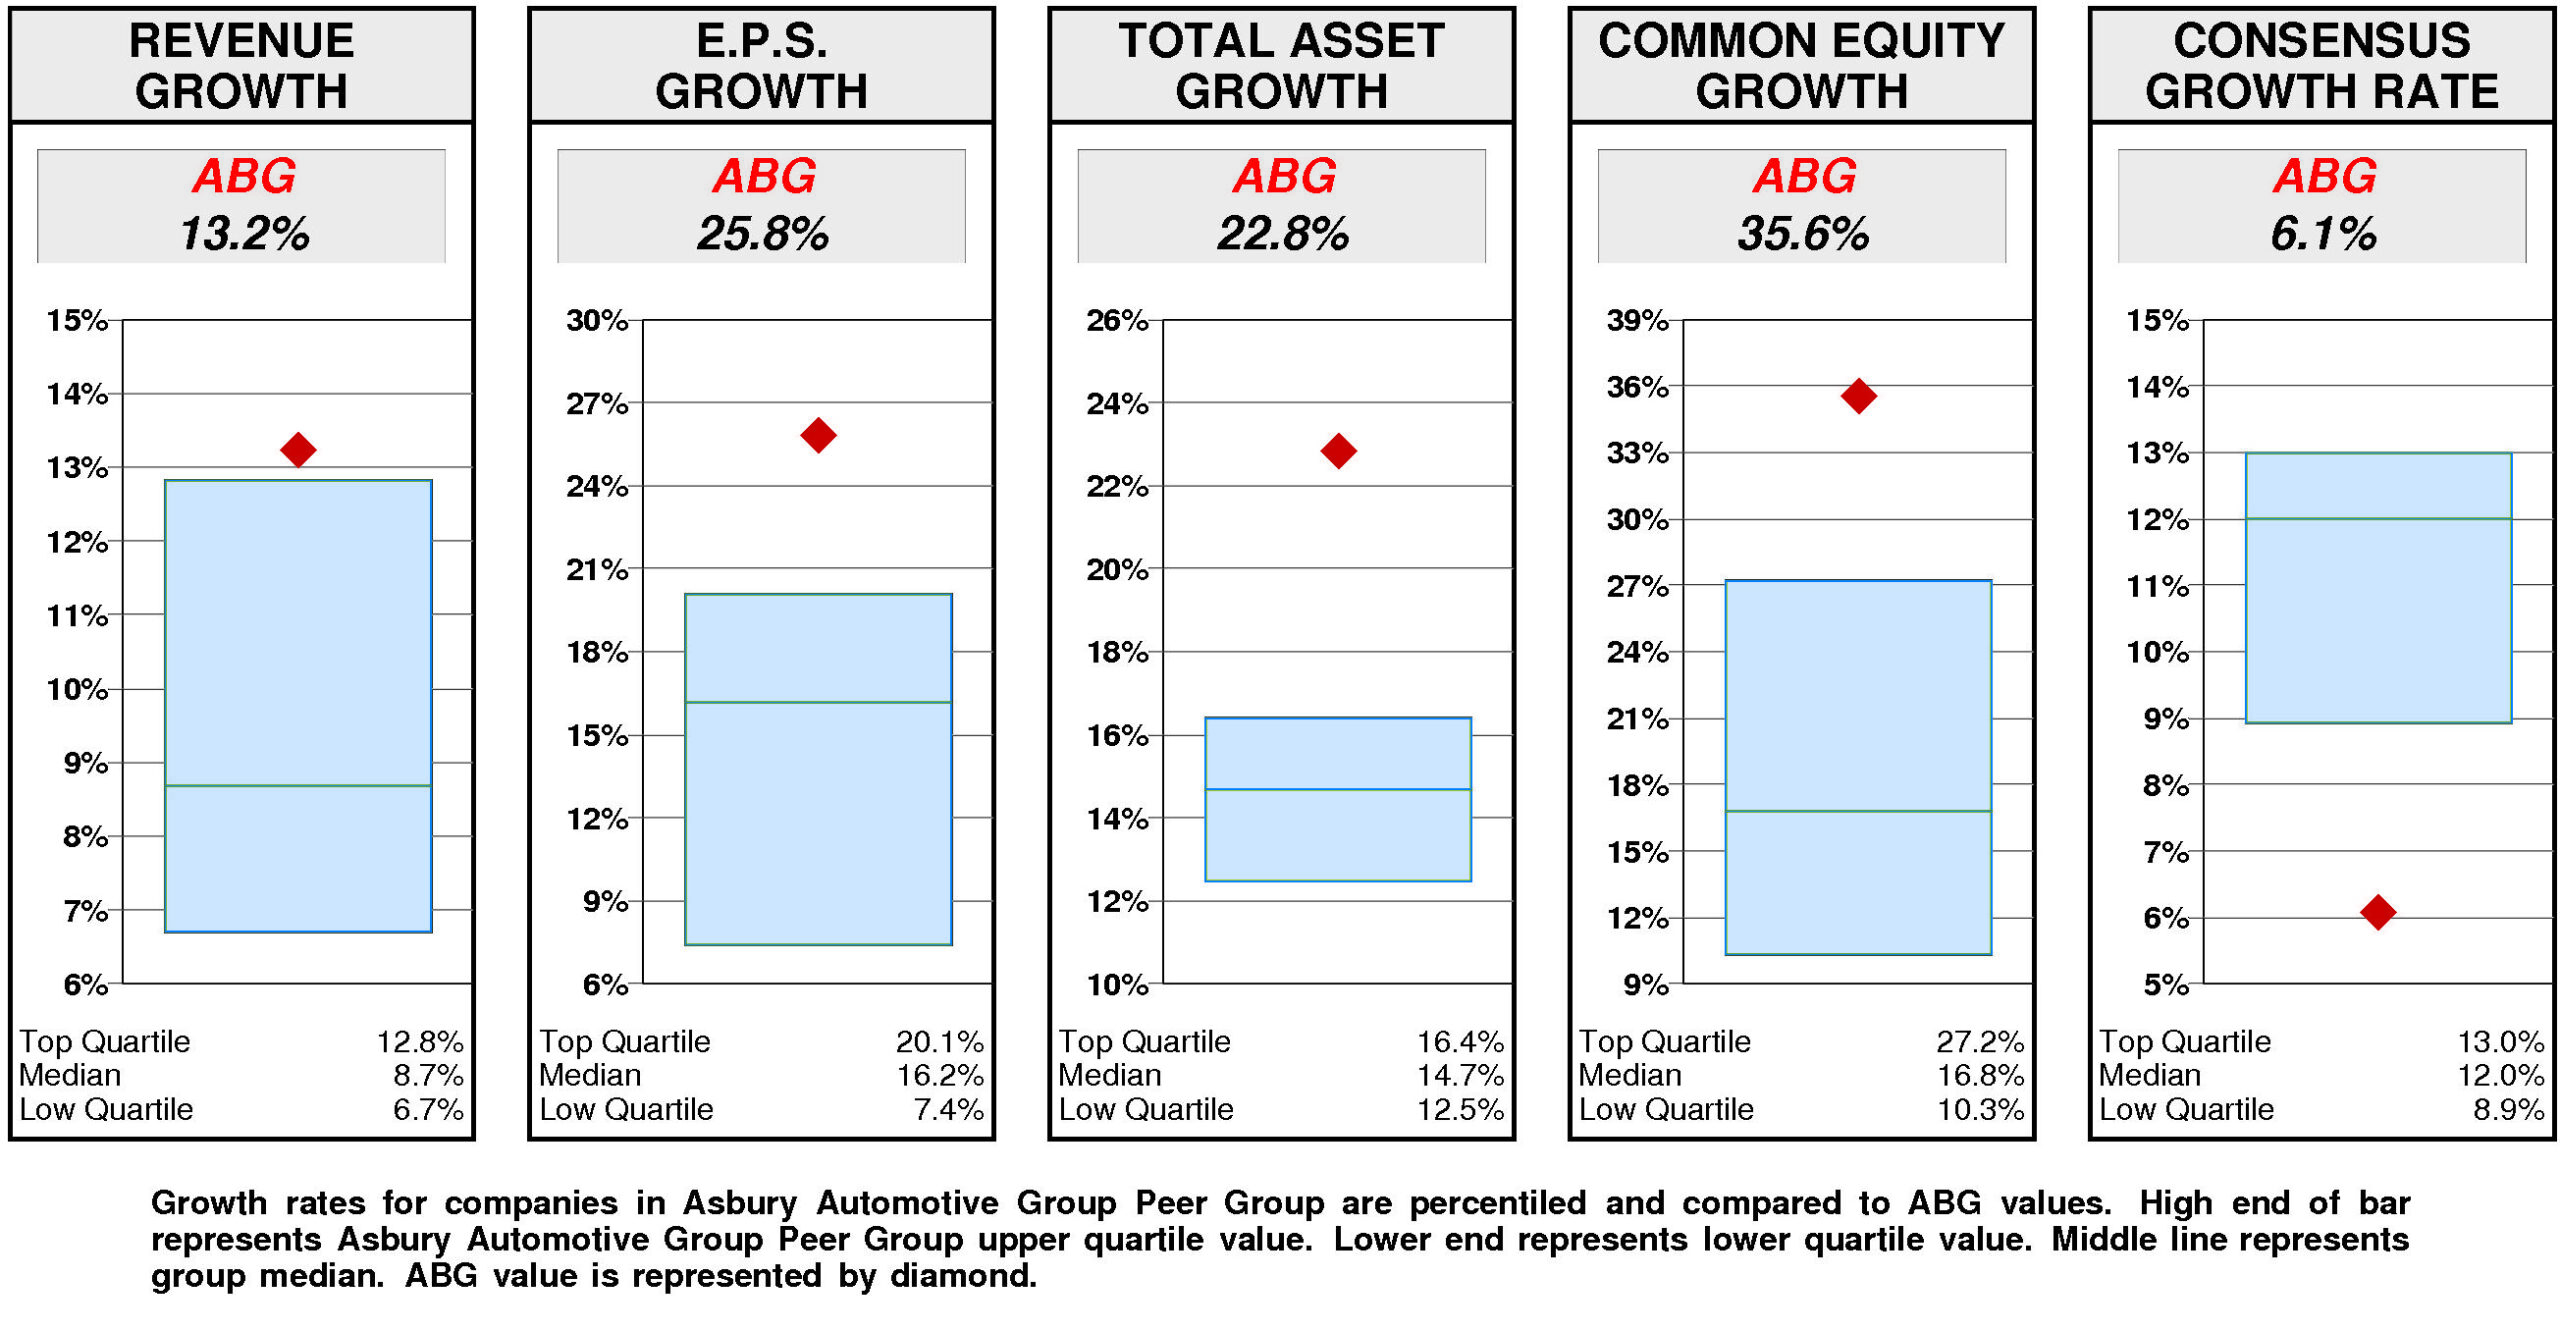
Relative to the Asbury Automotive Group Peer Group, ASBury Automotive Group’s historical growth measures are consistently top quartile. Revenue growth (13.2%) has been upper quartile. Total asset growth (22.8%) has been upper quartile. E.P.S. growth (25.8%) has been upper quartile. Equity growth (35.6%) has been upper quartile.
In total contrast, consensus growth forecast (6.1%) is lower quartile.
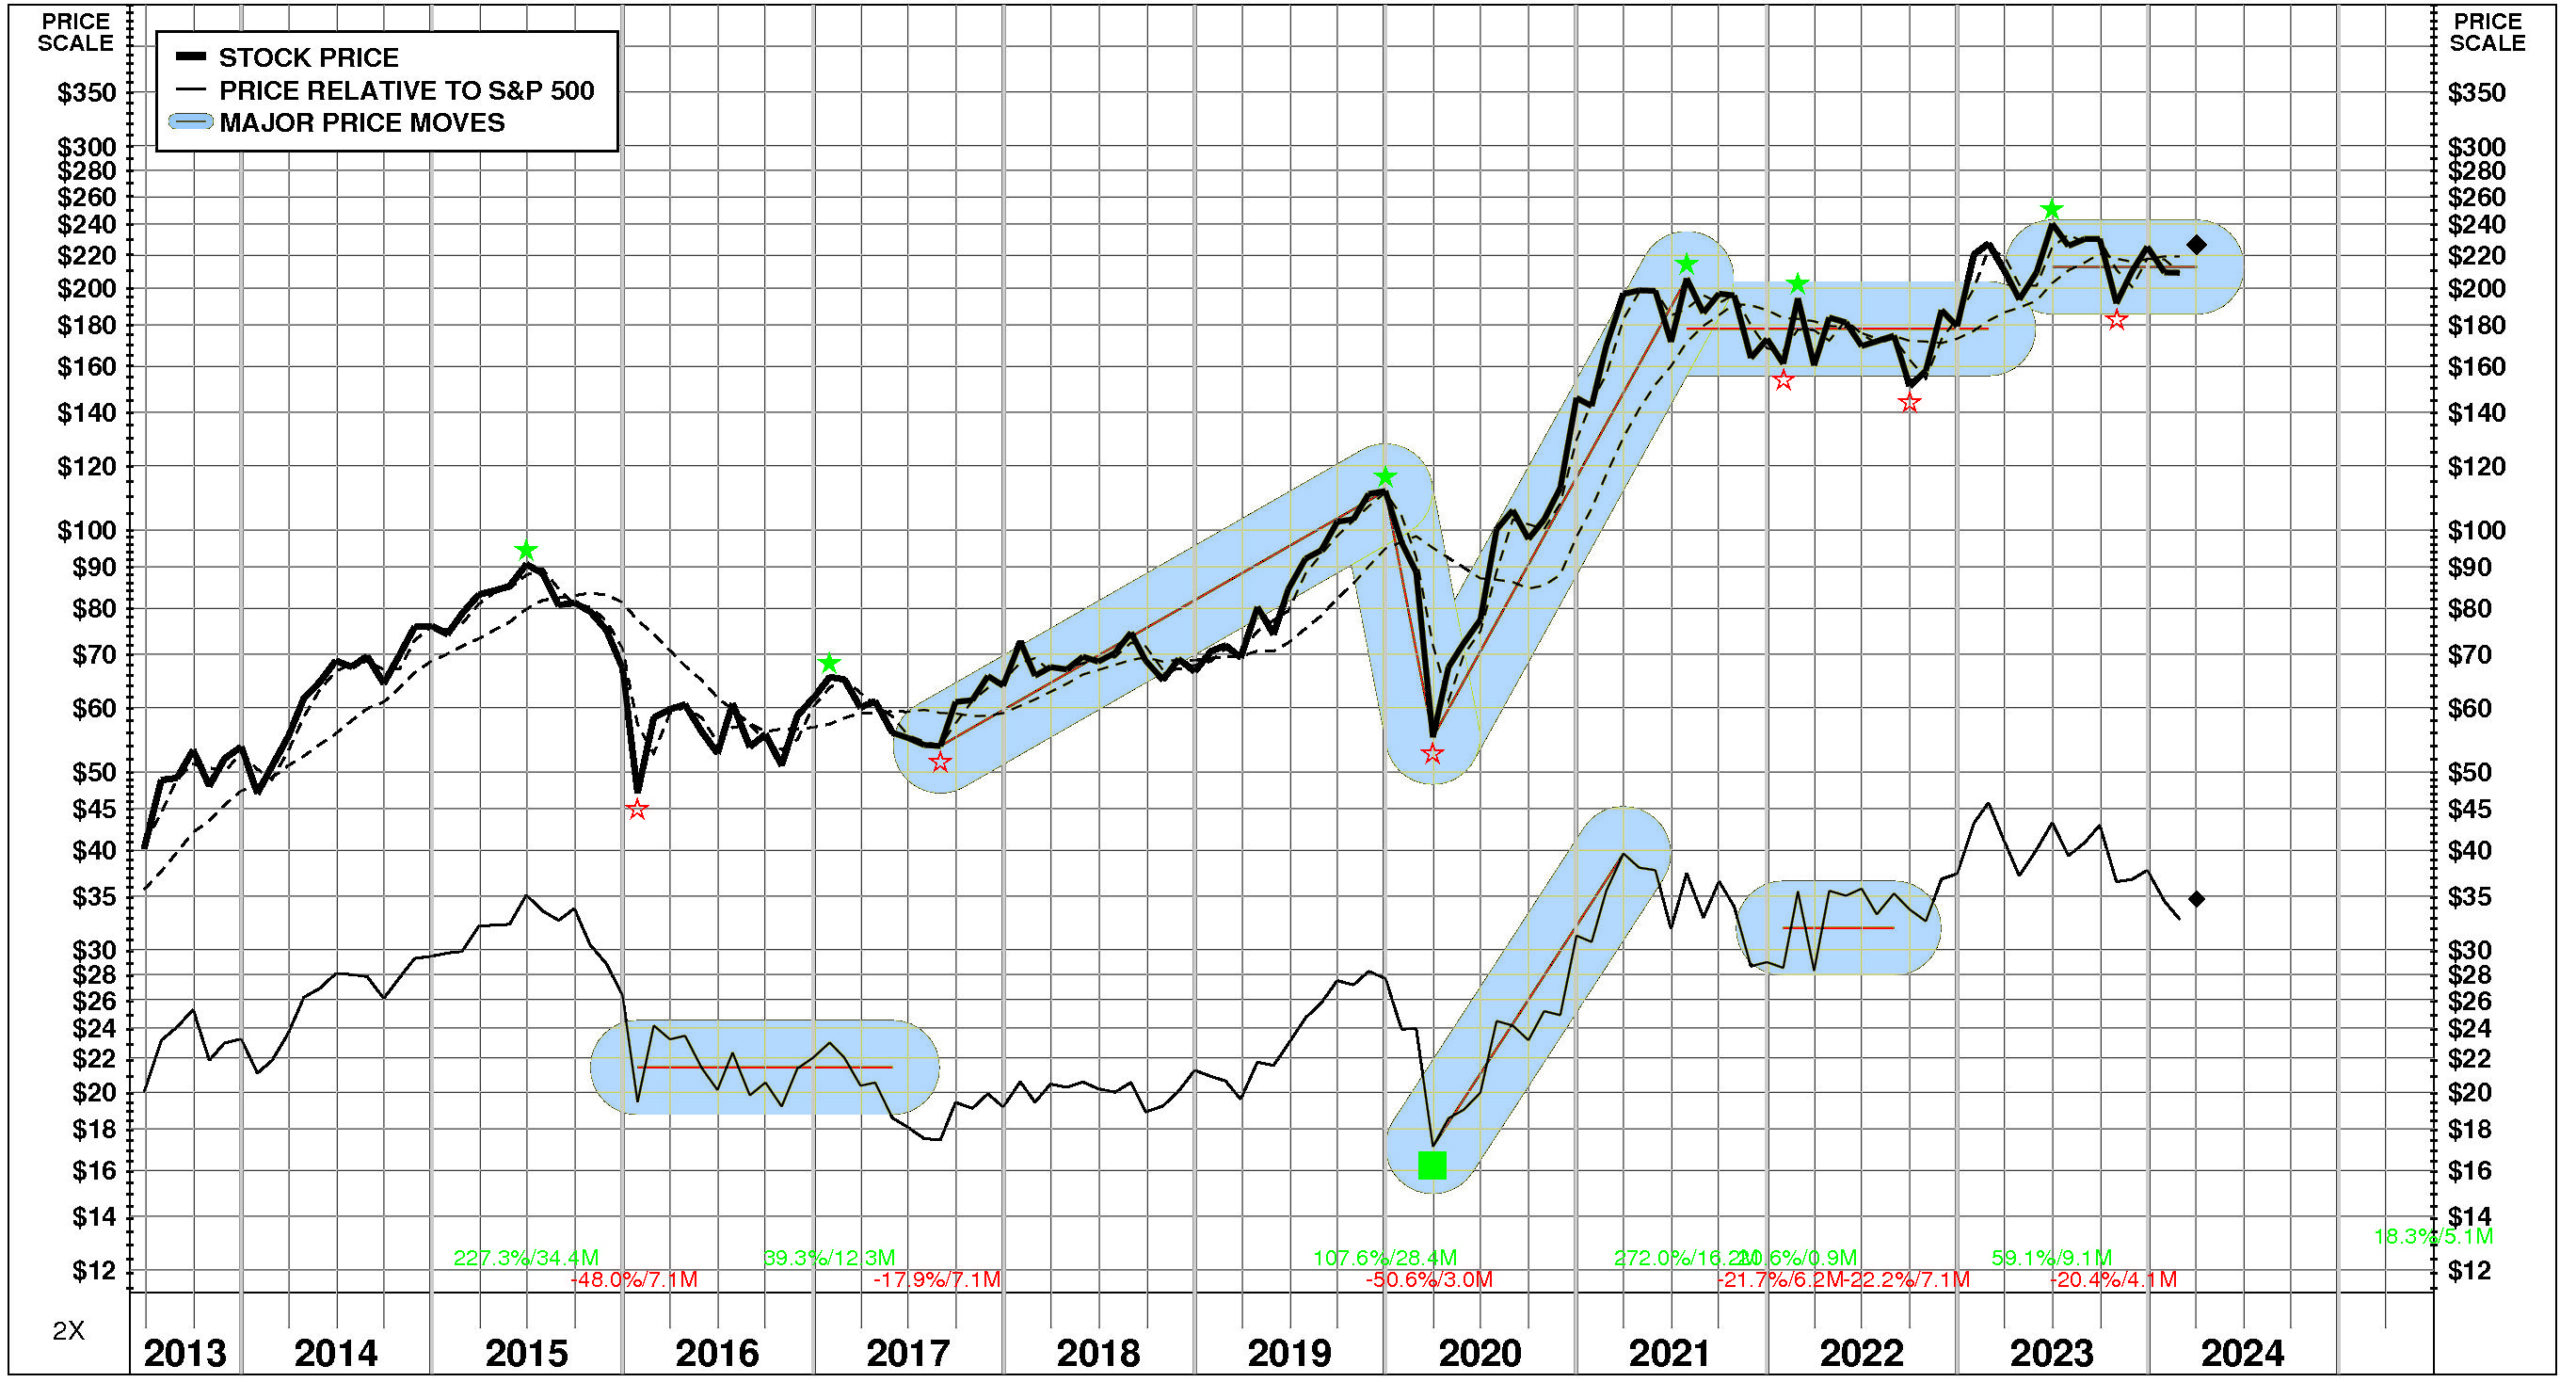
PRICE HISTORY
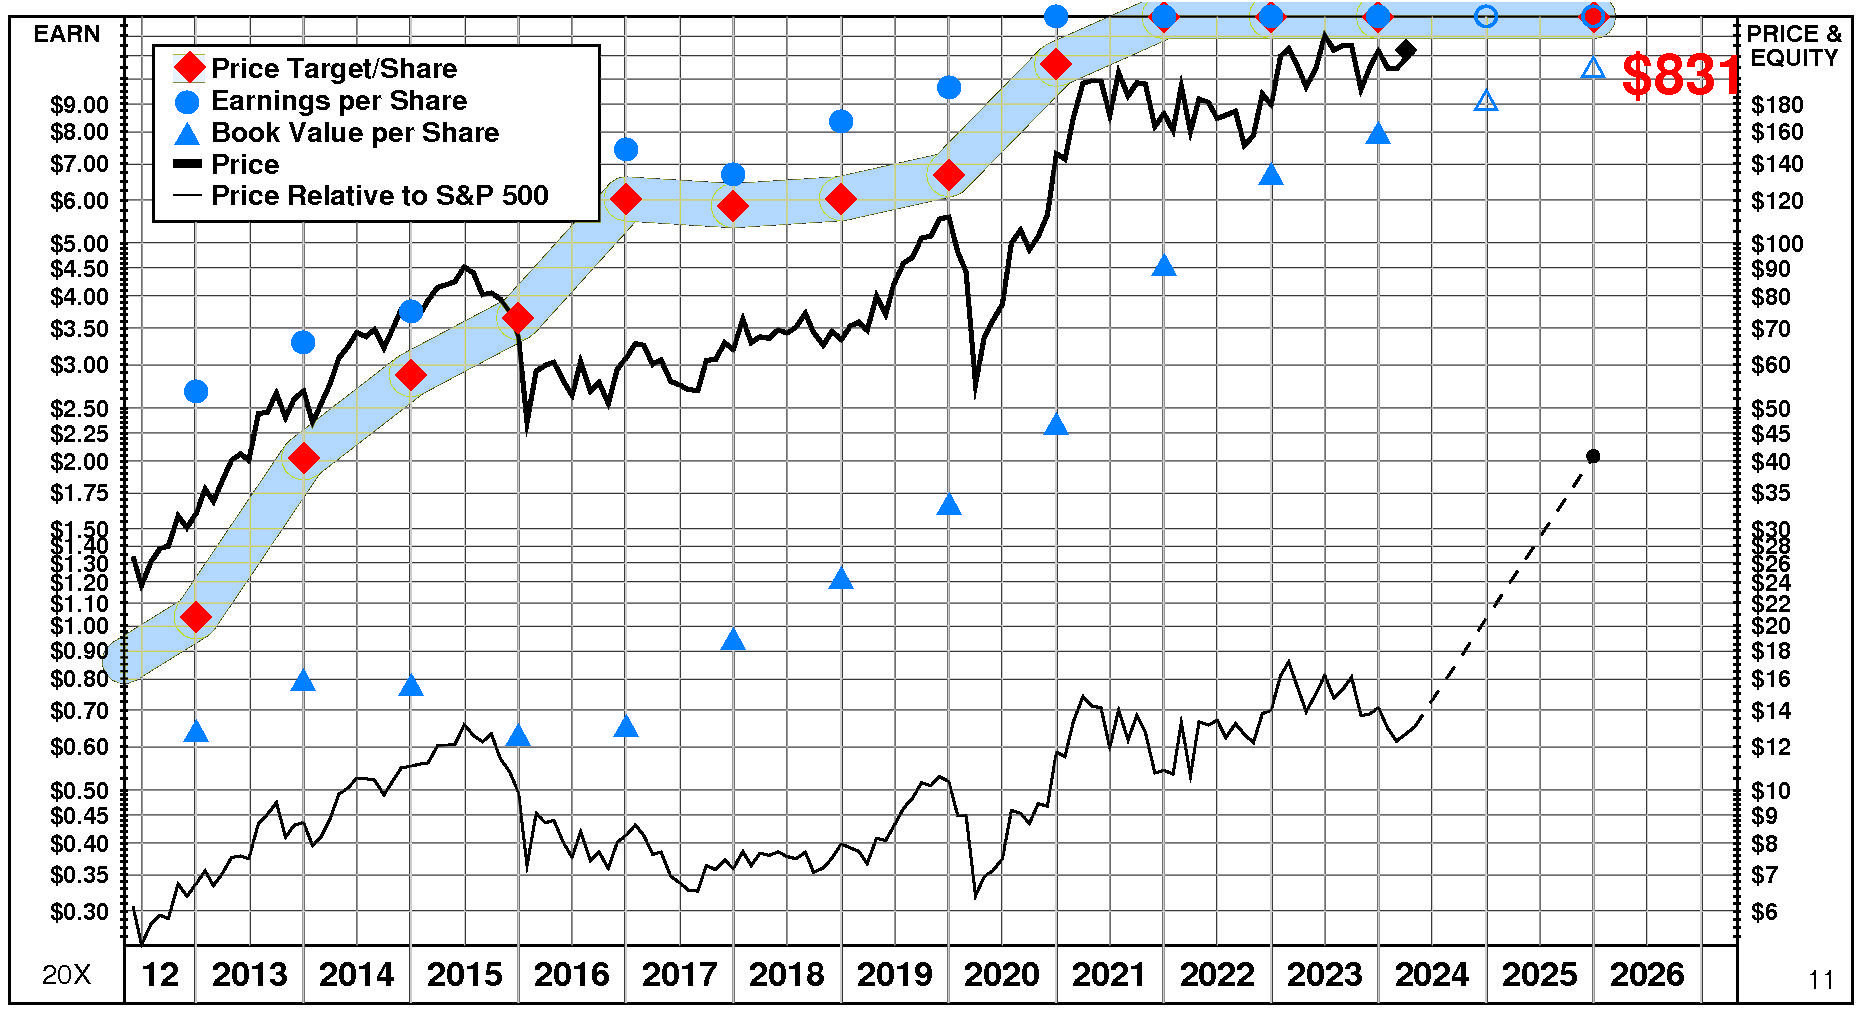
Over the full time period, Asbury Automotive Group’s stock price performance has been variable and superior. Between June, 2013 and April, 2024, Asbury Automotive Group’s stock price rose +464%; relative to the market, this was a +74% gain. Significant price moves during the period: 1) March, 2020 – July, 2021: +272%; 2) December, 2019 – March, 2020: -51%; and 3) August, 2017 – December, 2019: +108%.
TOTAL INVESTMENT RETURNS
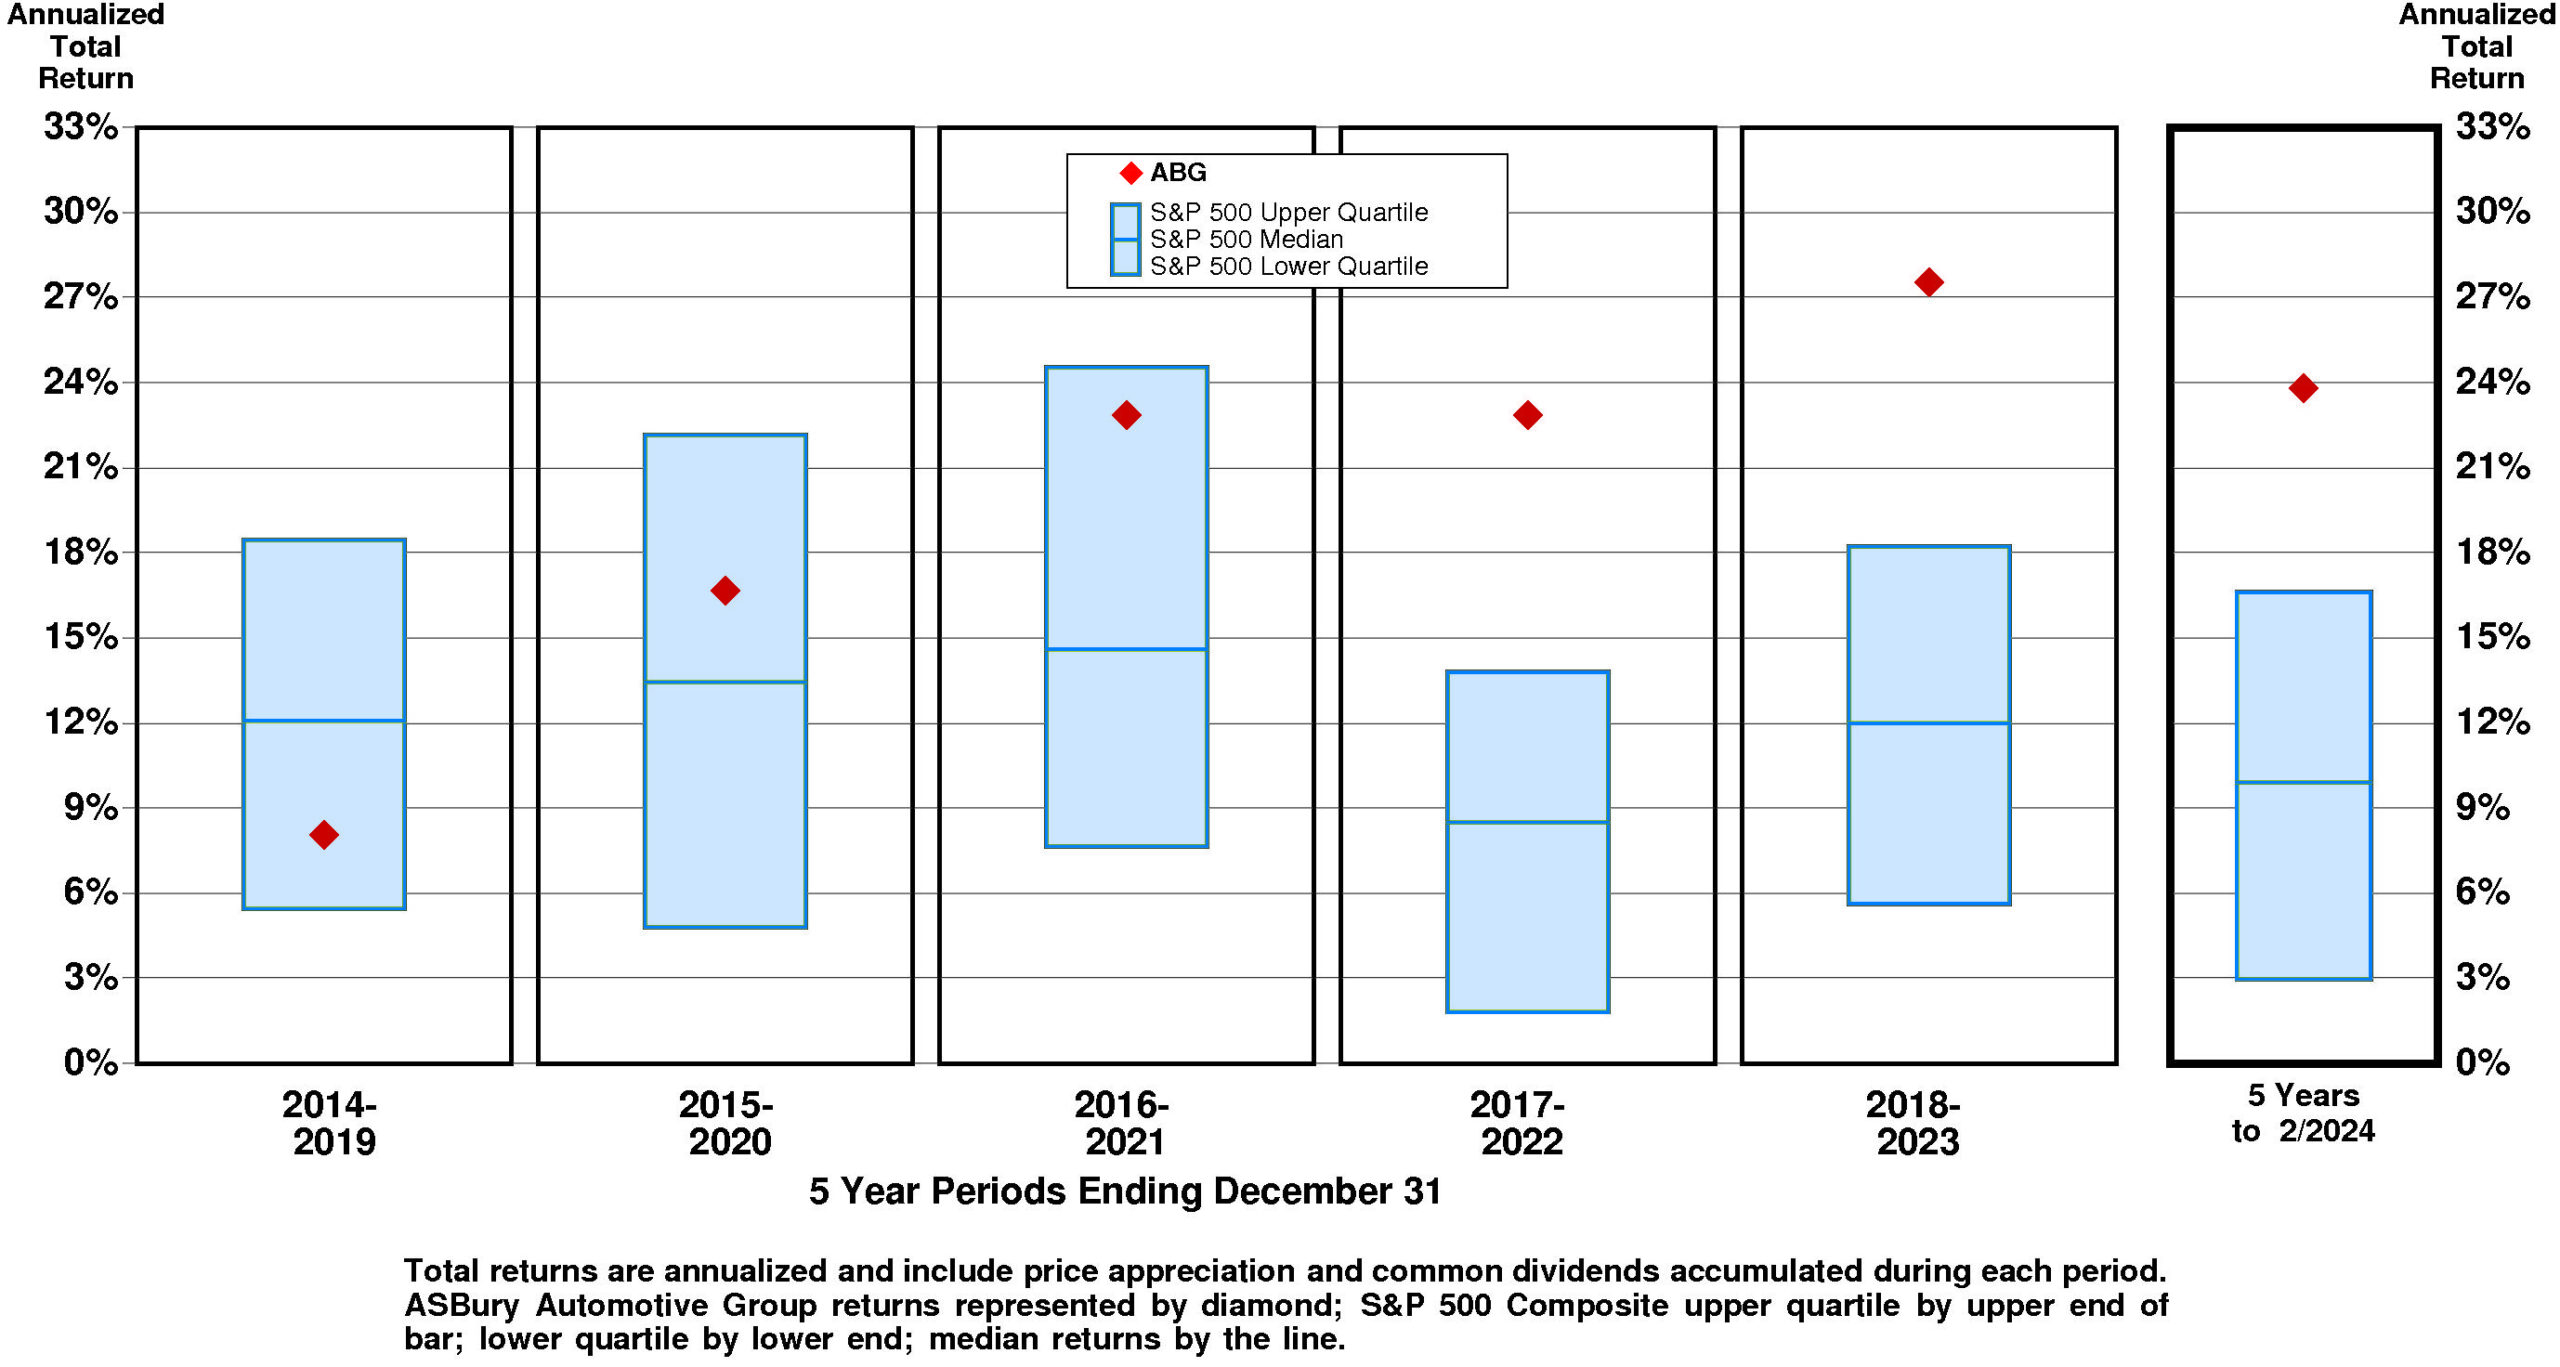
Current annual total return performance of -8.1% is lower quartile relative to the S&P 500 Composite. In addition to being lower quartile relative to S&P 500 Composite, current annual total return performance through February, 2024 of -8.1% is lower quartile relative to Asbury Automotive Group Inc Peer Group.
Current 5-year total return performance of 23.8% is upper quartile relative to the S&P 500 Composite.
Through February, 2024, with upper quartile current 5-year total return of 23.8% relative to S&P 500 Composite, ASBury Automotive Group’s total return performance is at the upper quartile relative to Asbury Automotive Group Inc Peer Group.
VALUATION BENCHMARKS
Relative to S&P 500 Composite, ABG’s overall valuation is exceptionally low. Four of five factors are lower quartile. The highest factor is the ratio of enterprise value/assets, followed by the price/equity ratio, then by the ratio of enterprise value/earnings before interest and taxes, then by the price/earnings ratio. The lowest factor, ratio of enterprise value/revenue, is lower quartile.
Relative to ASBury Automotive Group Peer Group, ABG’s overall valuation is exceptionally low. Four of five factors are lower quartile. The highest factor is the ratio of enterprise value/assets, followed by the price/equity ratio, then by the ratio of enterprise value/revenue, then by the ratio of enterprise value/earnings before interest and taxes. The lowest factor, price/earnings ratio, is lower quartile.
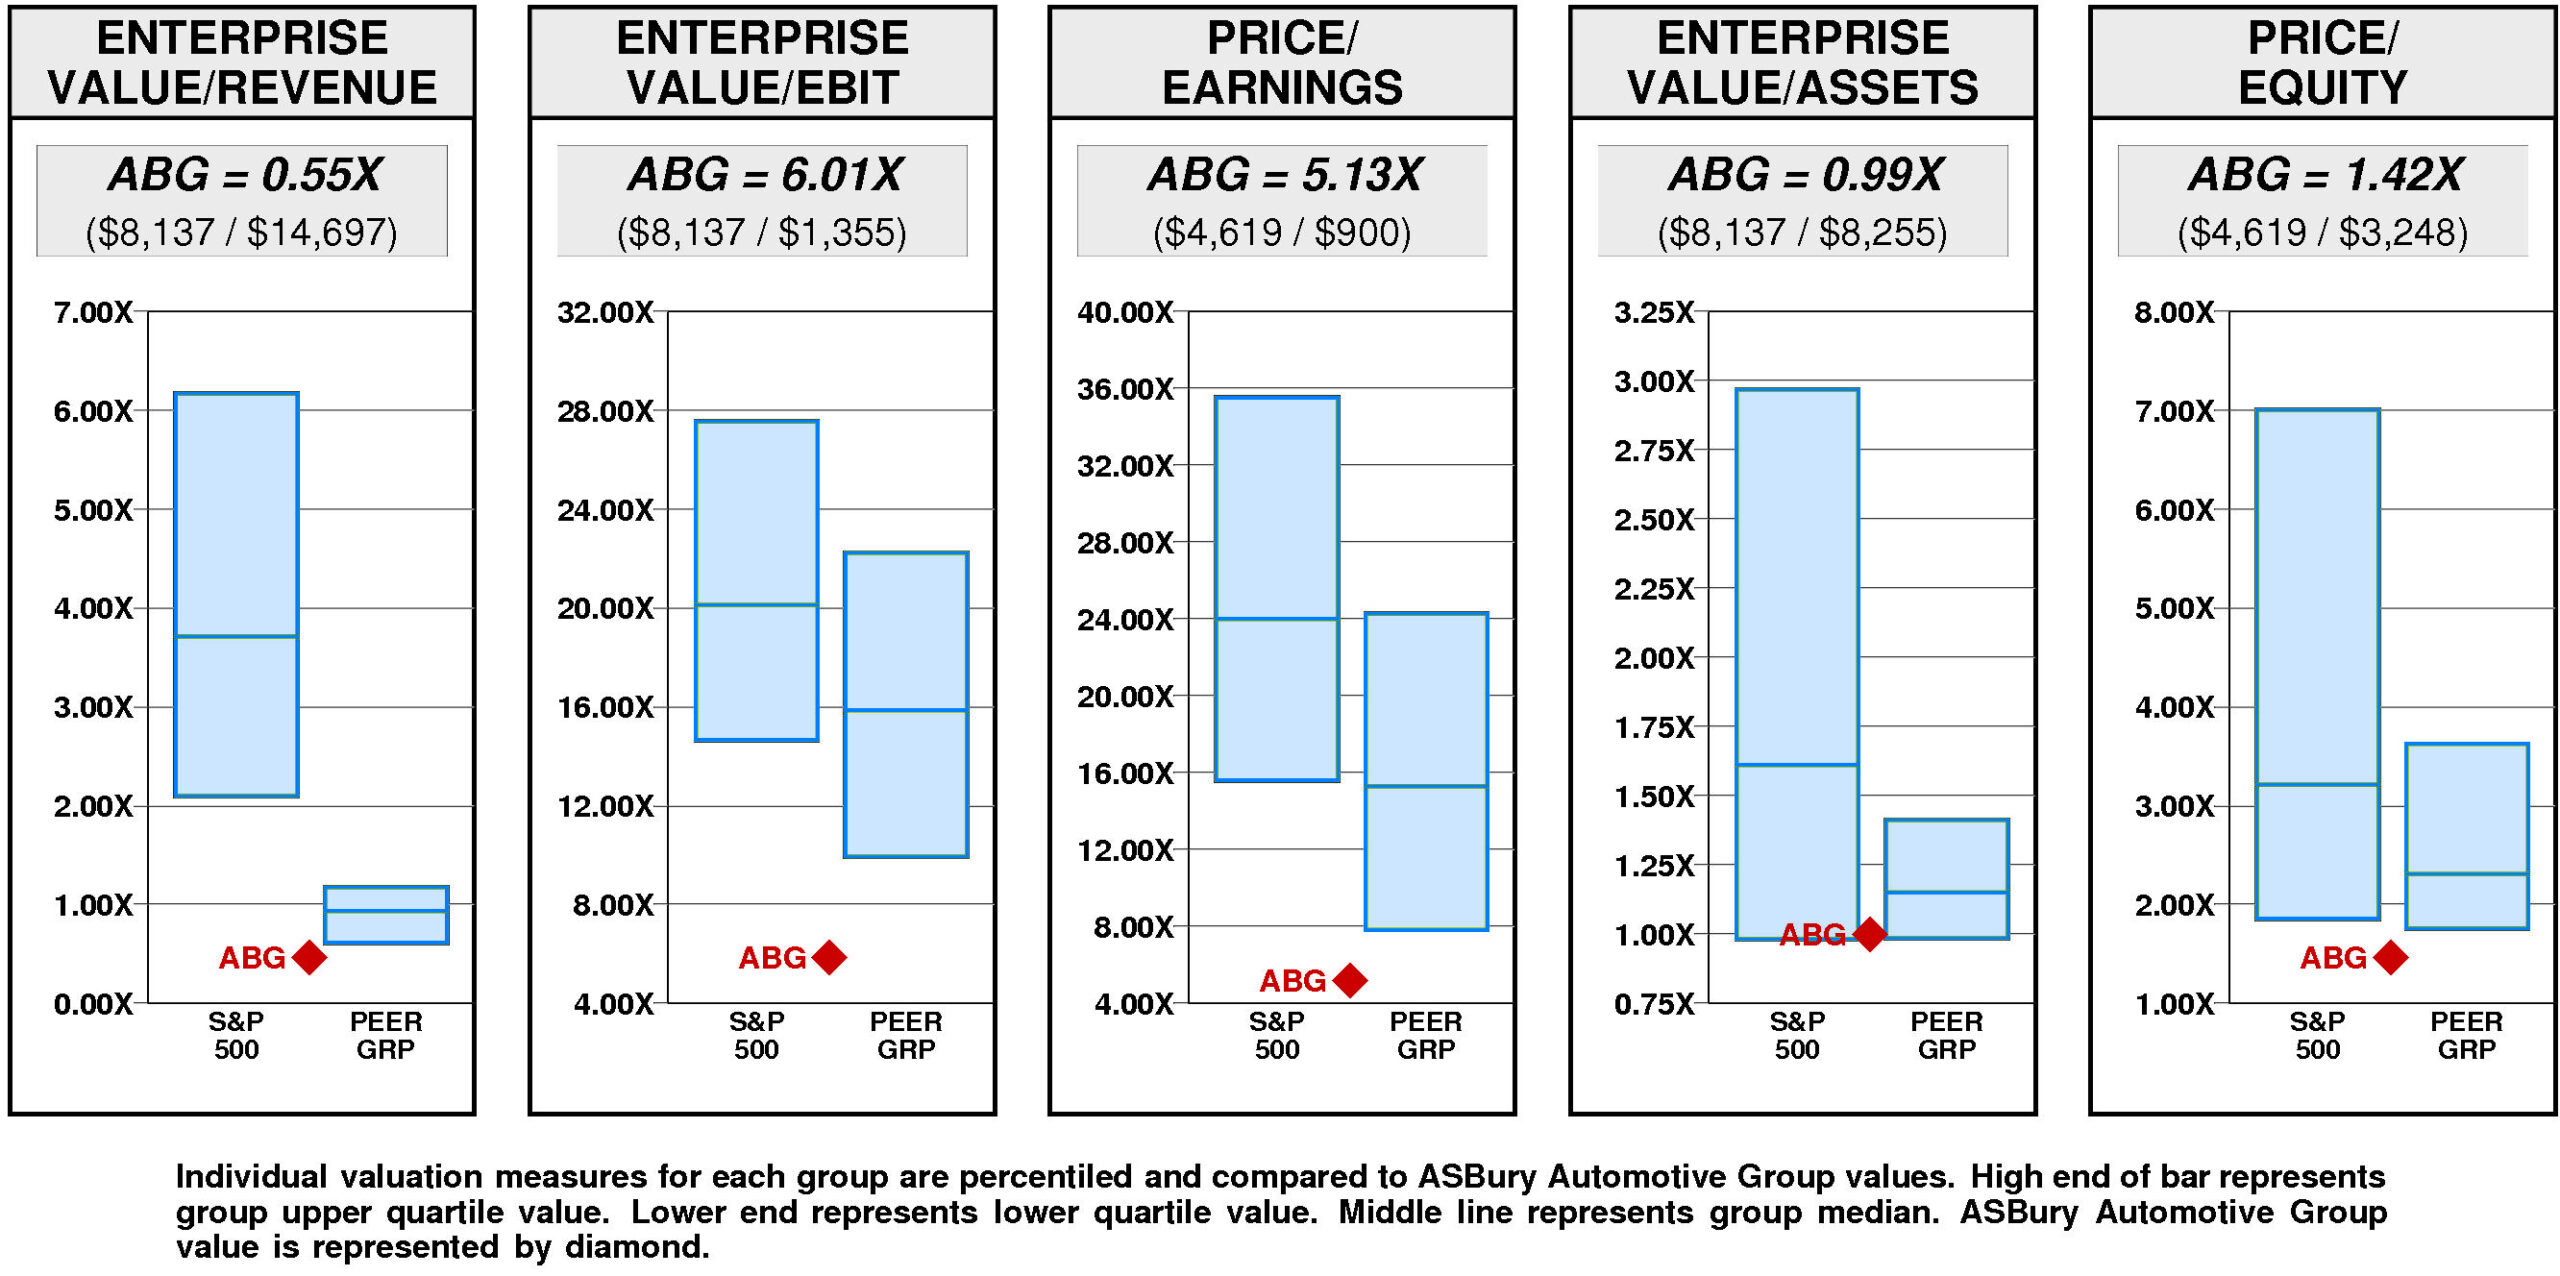
ASBury Automotive Group has a major value gap compared to the median. For ABG to hit median valuation, its current ratio of enterprise value/revenue would have to rise from the current level of 0.55X to 0.93X. If ABG’s ratio of enterprise value/revenue were to rise to 0.93X, its stock price would be higher by $274 to $501. For ABG to achieve upper quartile valuation relative to the ASBury Automotive Group Peer Group, its current ratio of enterprise value/revenue would have to rise from the current level of 0.55X to 1.18X. If ABG’s ratio of enterprise value/revenue were to rise to 1.18X, its stock price would increase by $448 from the current level of $226.
VALUE TARGETS
With future capital returns forecasted to exceed the cost of capital, ABG is expected to continue to be an important Value Builder.
Asbury Automotive Group’s current Price Target of $831 represents a +267% change from the current price of $226.36.
This very high appreciation potential results in an appreciation score of 91 (only 9% of the universe has greater appreciation potential.)
Notwithstanding this high Appreciation Score of 91, the moderately low Power Rating of 32 results in an Value Trend Rating of C.
Asbury Automotive Group’s current Price Target is $831 (-12% from the 2023 Target of $947 but +267% from the 04/02/24 price of $226.36). This slight fall in the Target is the result of a +26% increase in the equity base and a -30% decrease in the price/equity multiple. The forecasted decline in return on equity has a very large negative impact on the price/equity multiple and the forecasted decline in growth has a very large negative impact as well. Partially offsetting these Drivers, the forecasted decline in cost of equity has a very large positive impact.
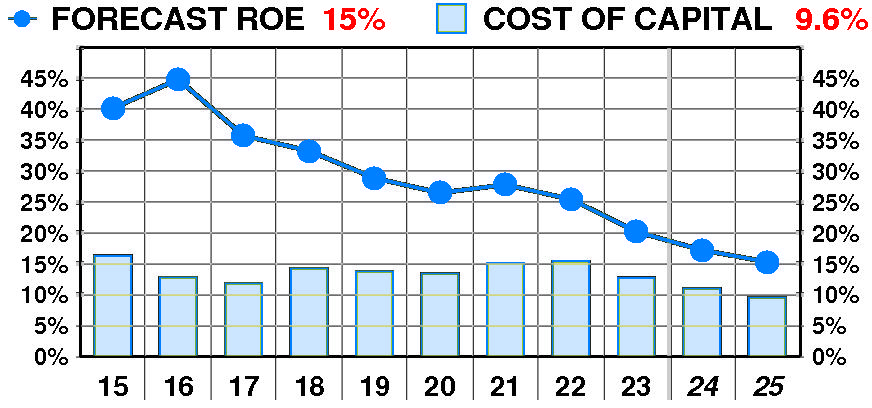
PTR’s return on equity forecast is 15.3% — slightly below our recent forecasts. Forecasted return on equity suffered a dramatic, steady decline between 2015 and 2023. The current forecast is significantly below the 2016 peak of 45%.
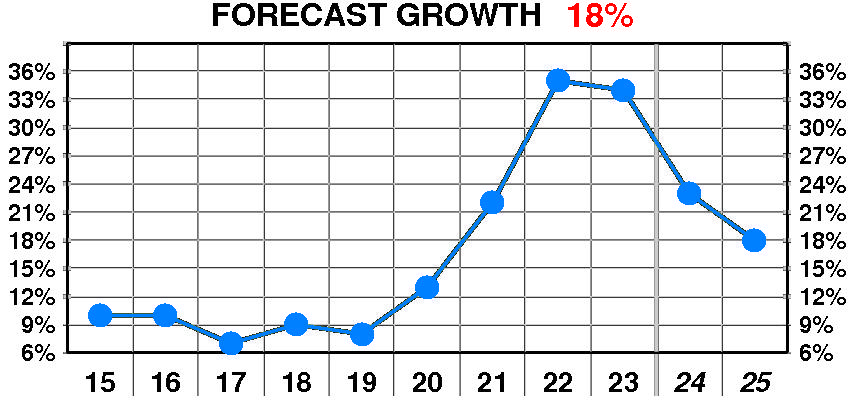
PTR’s growth forecast is 18.0% — significantly below our recent forecasts. Forecasted growth enjoyed a dramatic, variable increase between 2015 and 2023. The current forecast is significantly above the 2017 low of 7%.
PTR’s cost of equity forecast is 9.6% — slightly below recent levels. Forecasted cost of equity erratic but little changed between 2015 and 2023. The current forecast is well below the 2015 peak of 16.3%.
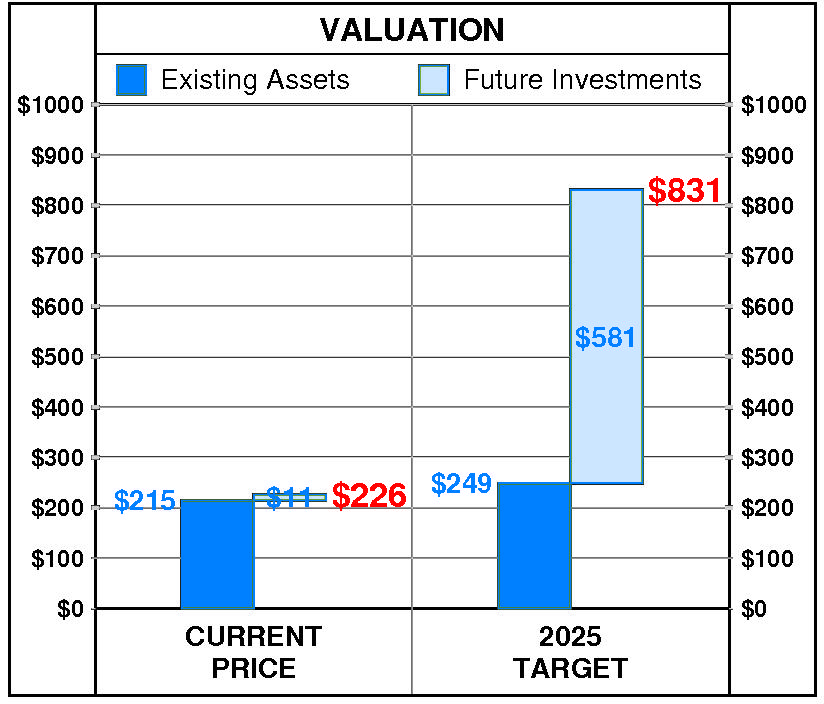 At Asbury Automotive Group’s current price of $226.36, investors are placing a positive value of $11 on its future investments. This view is consistent with the company’s most recent performance that reflected a growth rate of 34.0% per year, and a return on equity of 20.2% versus a cost of equity of 12.7%.
PTR’s 2025 Price Target of $831 is based on these forecasts and reflects an estimated value of existing assets of $249 and a value of future investments of $581.
At Asbury Automotive Group’s current price of $226.36, investors are placing a positive value of $11 on its future investments. This view is consistent with the company’s most recent performance that reflected a growth rate of 34.0% per year, and a return on equity of 20.2% versus a cost of equity of 12.7%.
PTR’s 2025 Price Target of $831 is based on these forecasts and reflects an estimated value of existing assets of $249 and a value of future investments of $581.
Be the first to comment