![]()
BUSINESS
Sono-Tek Corporation designs and manufactures ultrasonic coating systems for applying on parts and components for the microelectronics/electronics, alternative energy, medical, industrial, and research and development/other markets worldwide. It also designs and manufactures custom-engineered ultrasonic coating systems; and provides nozzles and generators for manufacturers’ equipment. The company’s products include integrated multi-axis coating systems, integrated coating systems, fluxing systems, OEM systems, and other related systems. It markets and distributes its products through independent distributors and sales representatives. The company was incorporated in 1975 and is based in Milton, New York.
INVESTMENT RATING
Reflecting future returns on capital that are forecasted to be in line with the cost of capital, SOTK is expected to continue to be Value Creation neutral.
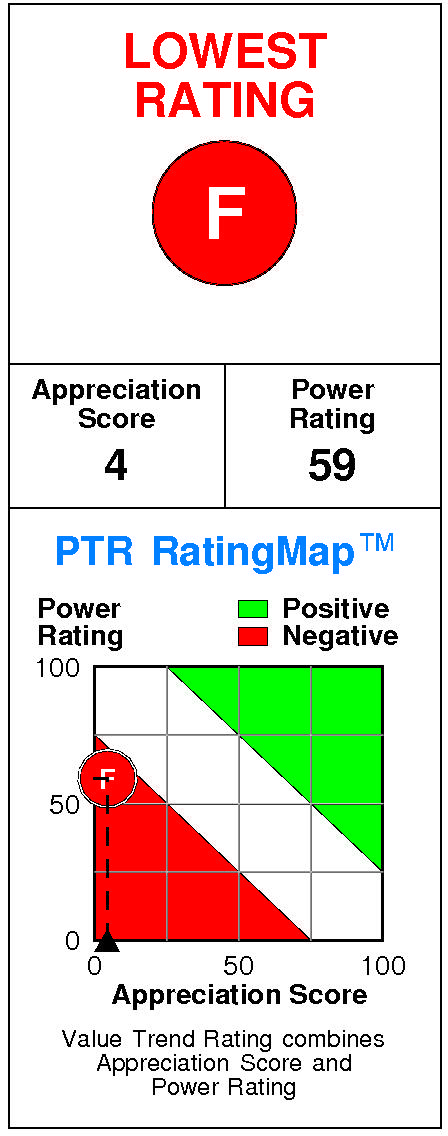
Sono-Tek has a current Value Trend Rating of F (Lowest Rating).
With this rating, PTR’s two proprietary measures of a stock’s current attractiveness are providing inconsistent signals. Sono-Tek has a very low Appreciation Score of 4 but a neutral Power Rating of 59, triggering the Lowest Value Trend Rating.
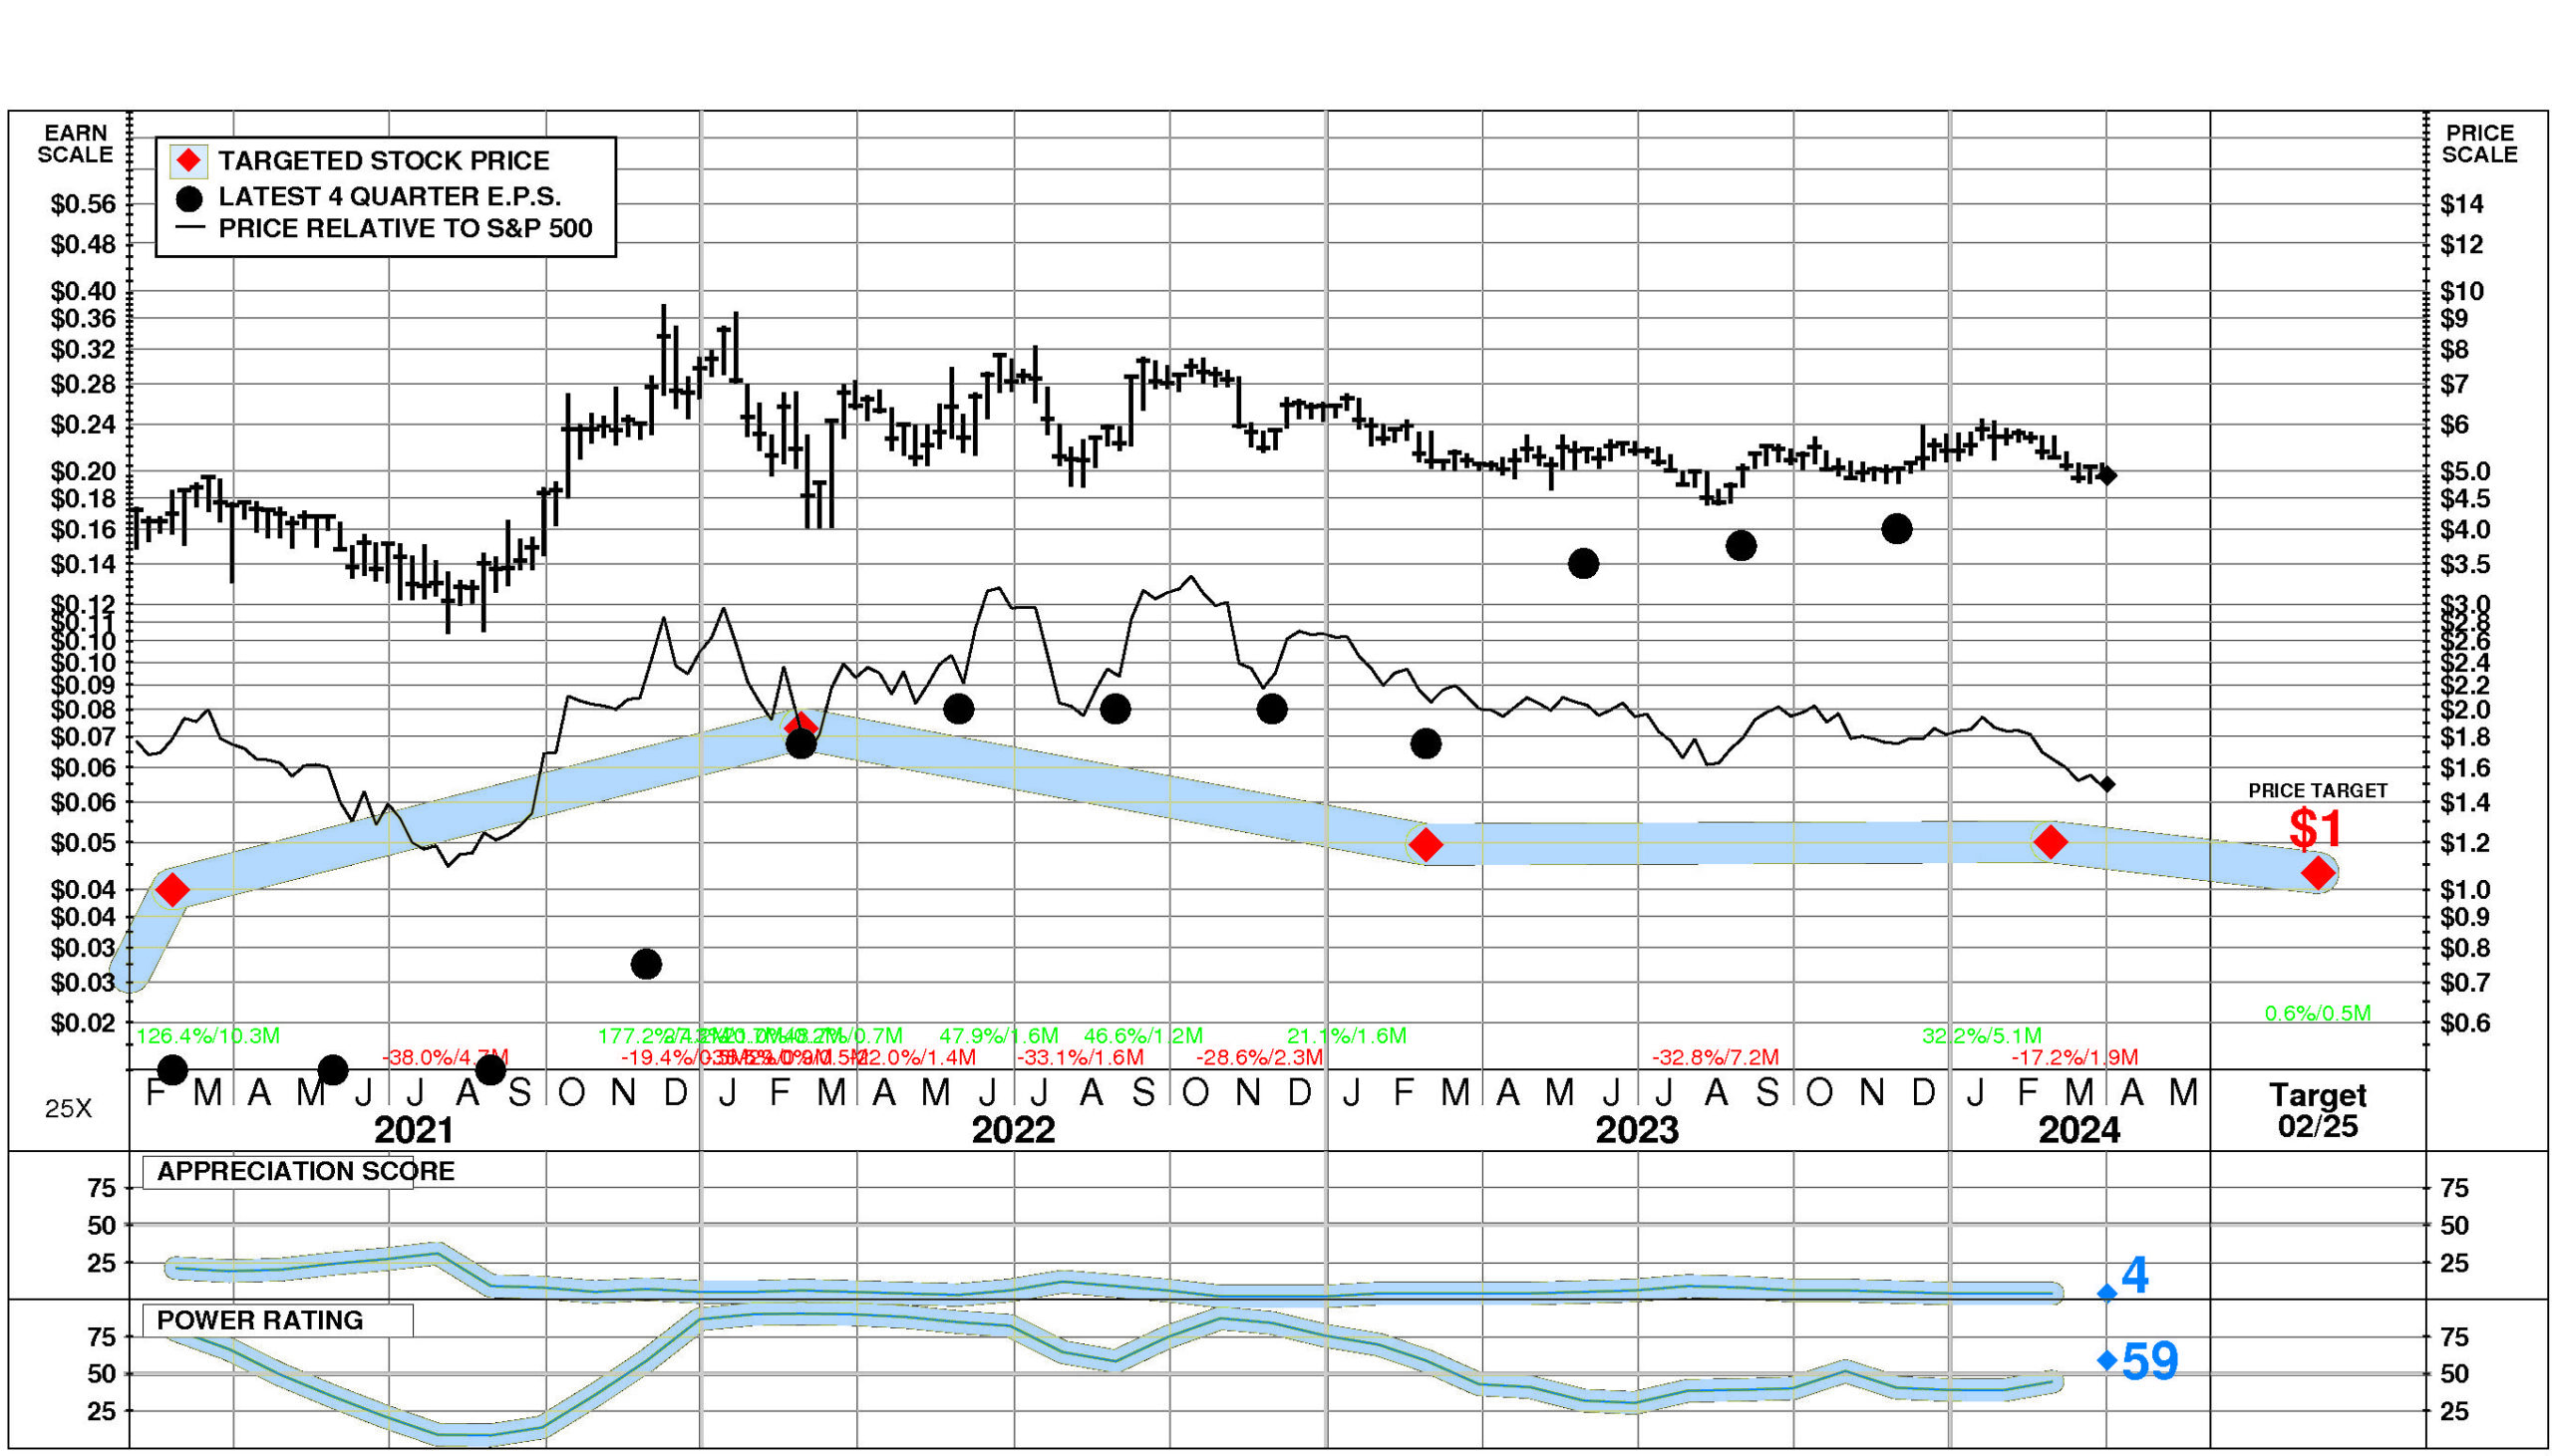
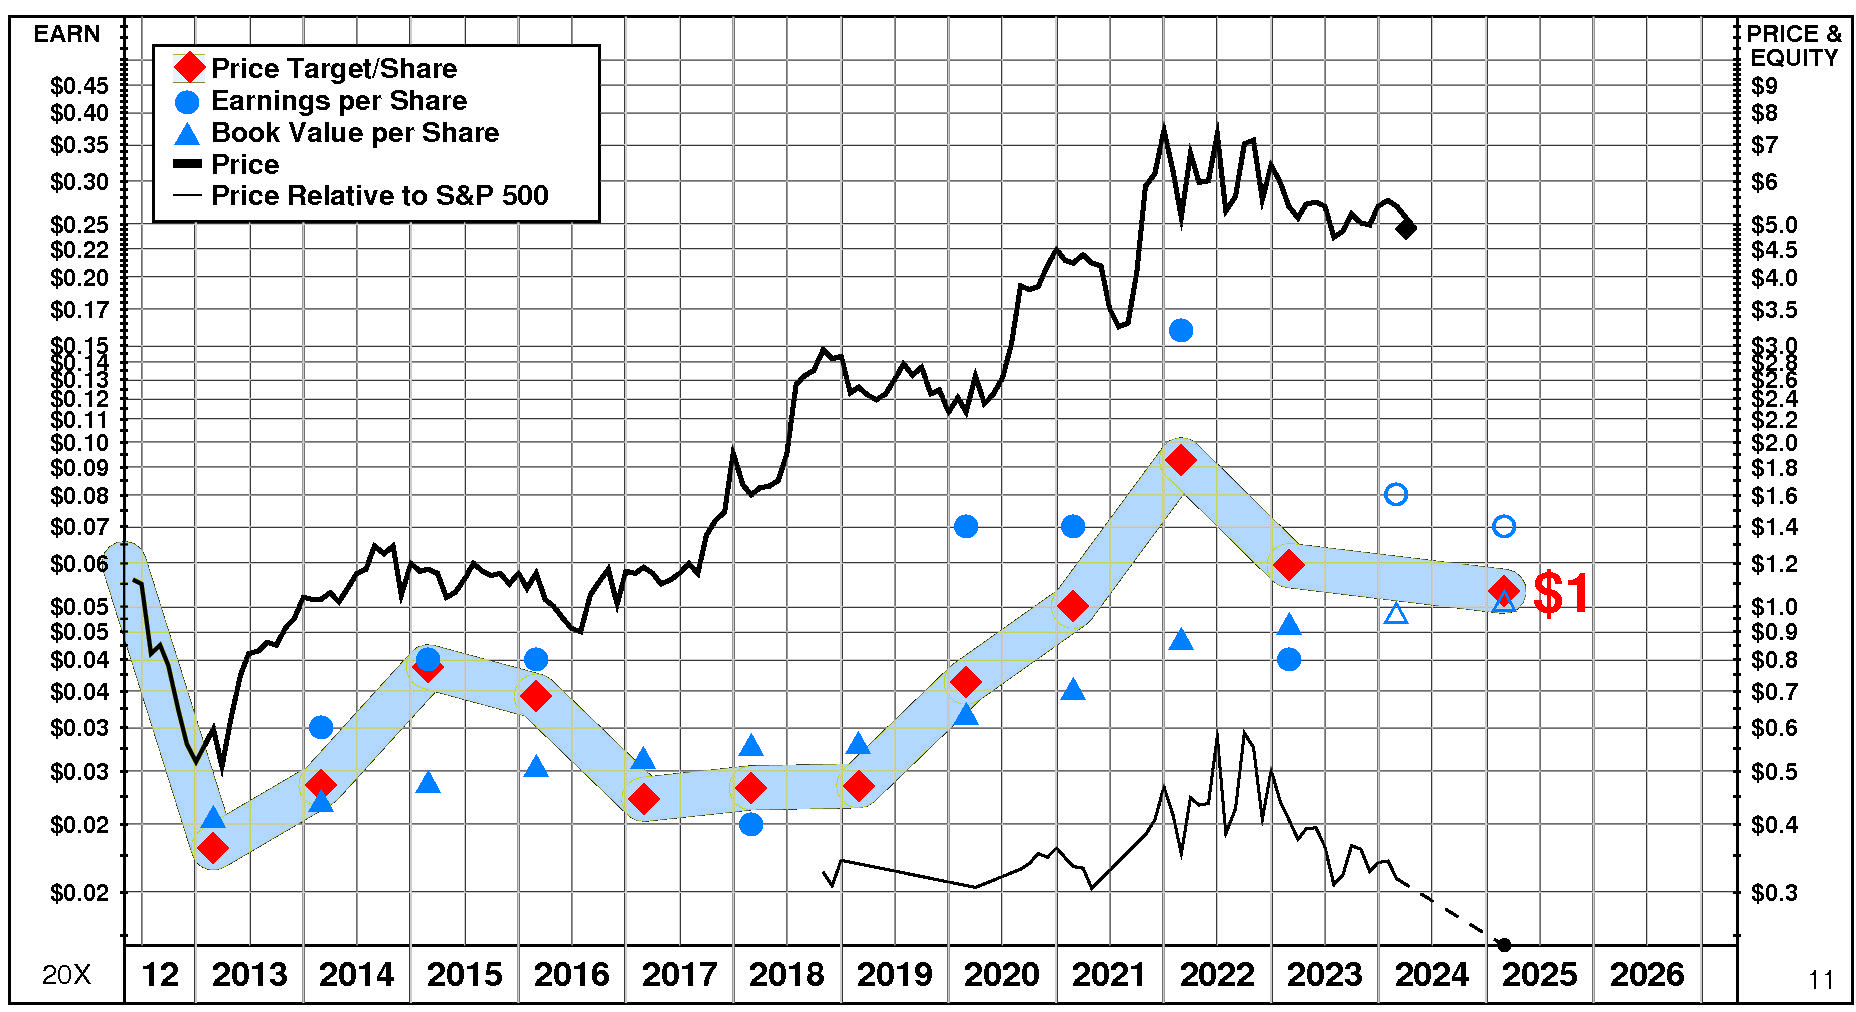
Sono-Tek’s stock is selling significantly above targeted value. The current stock price of $4.92 compares to targeted value 12 months forward of $1.
Sono-Tek’s very low appreciation potential results in an appreciation score of 4 (96% of the universe has greater appreciation potential.)
Sono-Tek has a Power Rating of 59. (This neutral Power Rating indicates that SOTK’s chances of enjoying attractive investment performance over the near to intermediate term are only average.)
Factors contributing to this neutral Power Rating include: the recent trend in SOTK’s earnings estimates has been favorable; and recent price action has been slightly favorable. An offsetting factor is the Miscellaneous Electric Machinery, Equipment, Supplies comparison group is currently in an unfavorable position.
INVESTMENT PROFILE
Sono-Tek’s financial strength is high. Financial strength rating is 76.
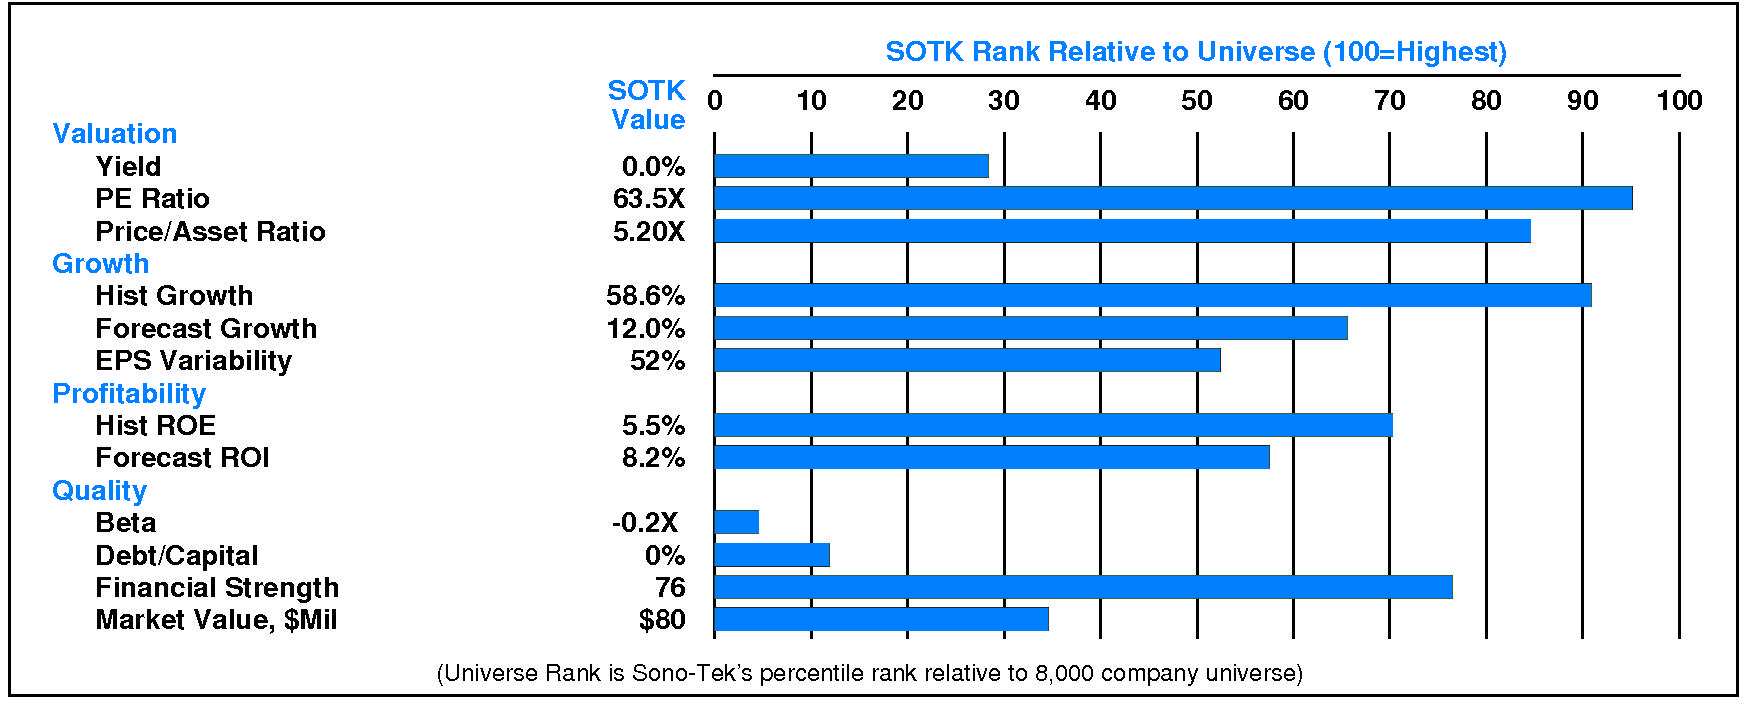
Relative to the S&P 500 Composite, Sono-Tek Corp has both Growth and Value characteristics; its appeal is likely to be to Capital Gain-oriented investors; the perception is that SOTK is lower risk. Relative weaknesses include: low forecasted profitability, and low historical profitability. Sono-Tek’s valuation is high: low dividend yield, high P/E ratio, and moderate price/book ratio. SOTK has unusually low market capitalization.
CURRENT SIGNALS
Sono-Tek’s current operations are eroding. Return on equity is falling, reflecting: falling asset utilization; declining pretax margin; falling tax keep rate; and falling leverage.
Sono-Tek’s current technical position is very weak. The stock price is in a 1.9 month down move. The stock has declined 14.7% from its prior high. The stock price is below its 200 day moving average which is in a downtrend.
ALERTS
Recent meaningful negative changes in investment behavior have impacted Sono-Tek Corp (NASDAQ: SOTK): negative upside/downside volume developed.
Recent important positive changes in fundamentals have benefitted Sono-Tek Corp (NASDAQ: SOTK): significant quarterly earnings acceleration occurred, and significant quarterly sales acceleration occurred.
The stock is currently rated F.
Sono-Tek Corp (NASDAQ: SOTK) stock closed at $4.92 on 4/1/24 after a modest gain of 0.6%. However, exceptionally low trading volume at 39% of normal accompanied the advance. The stock has declined -0.6% during the last week but has been strong relative to the market over the last nine months.
CASH FLOW
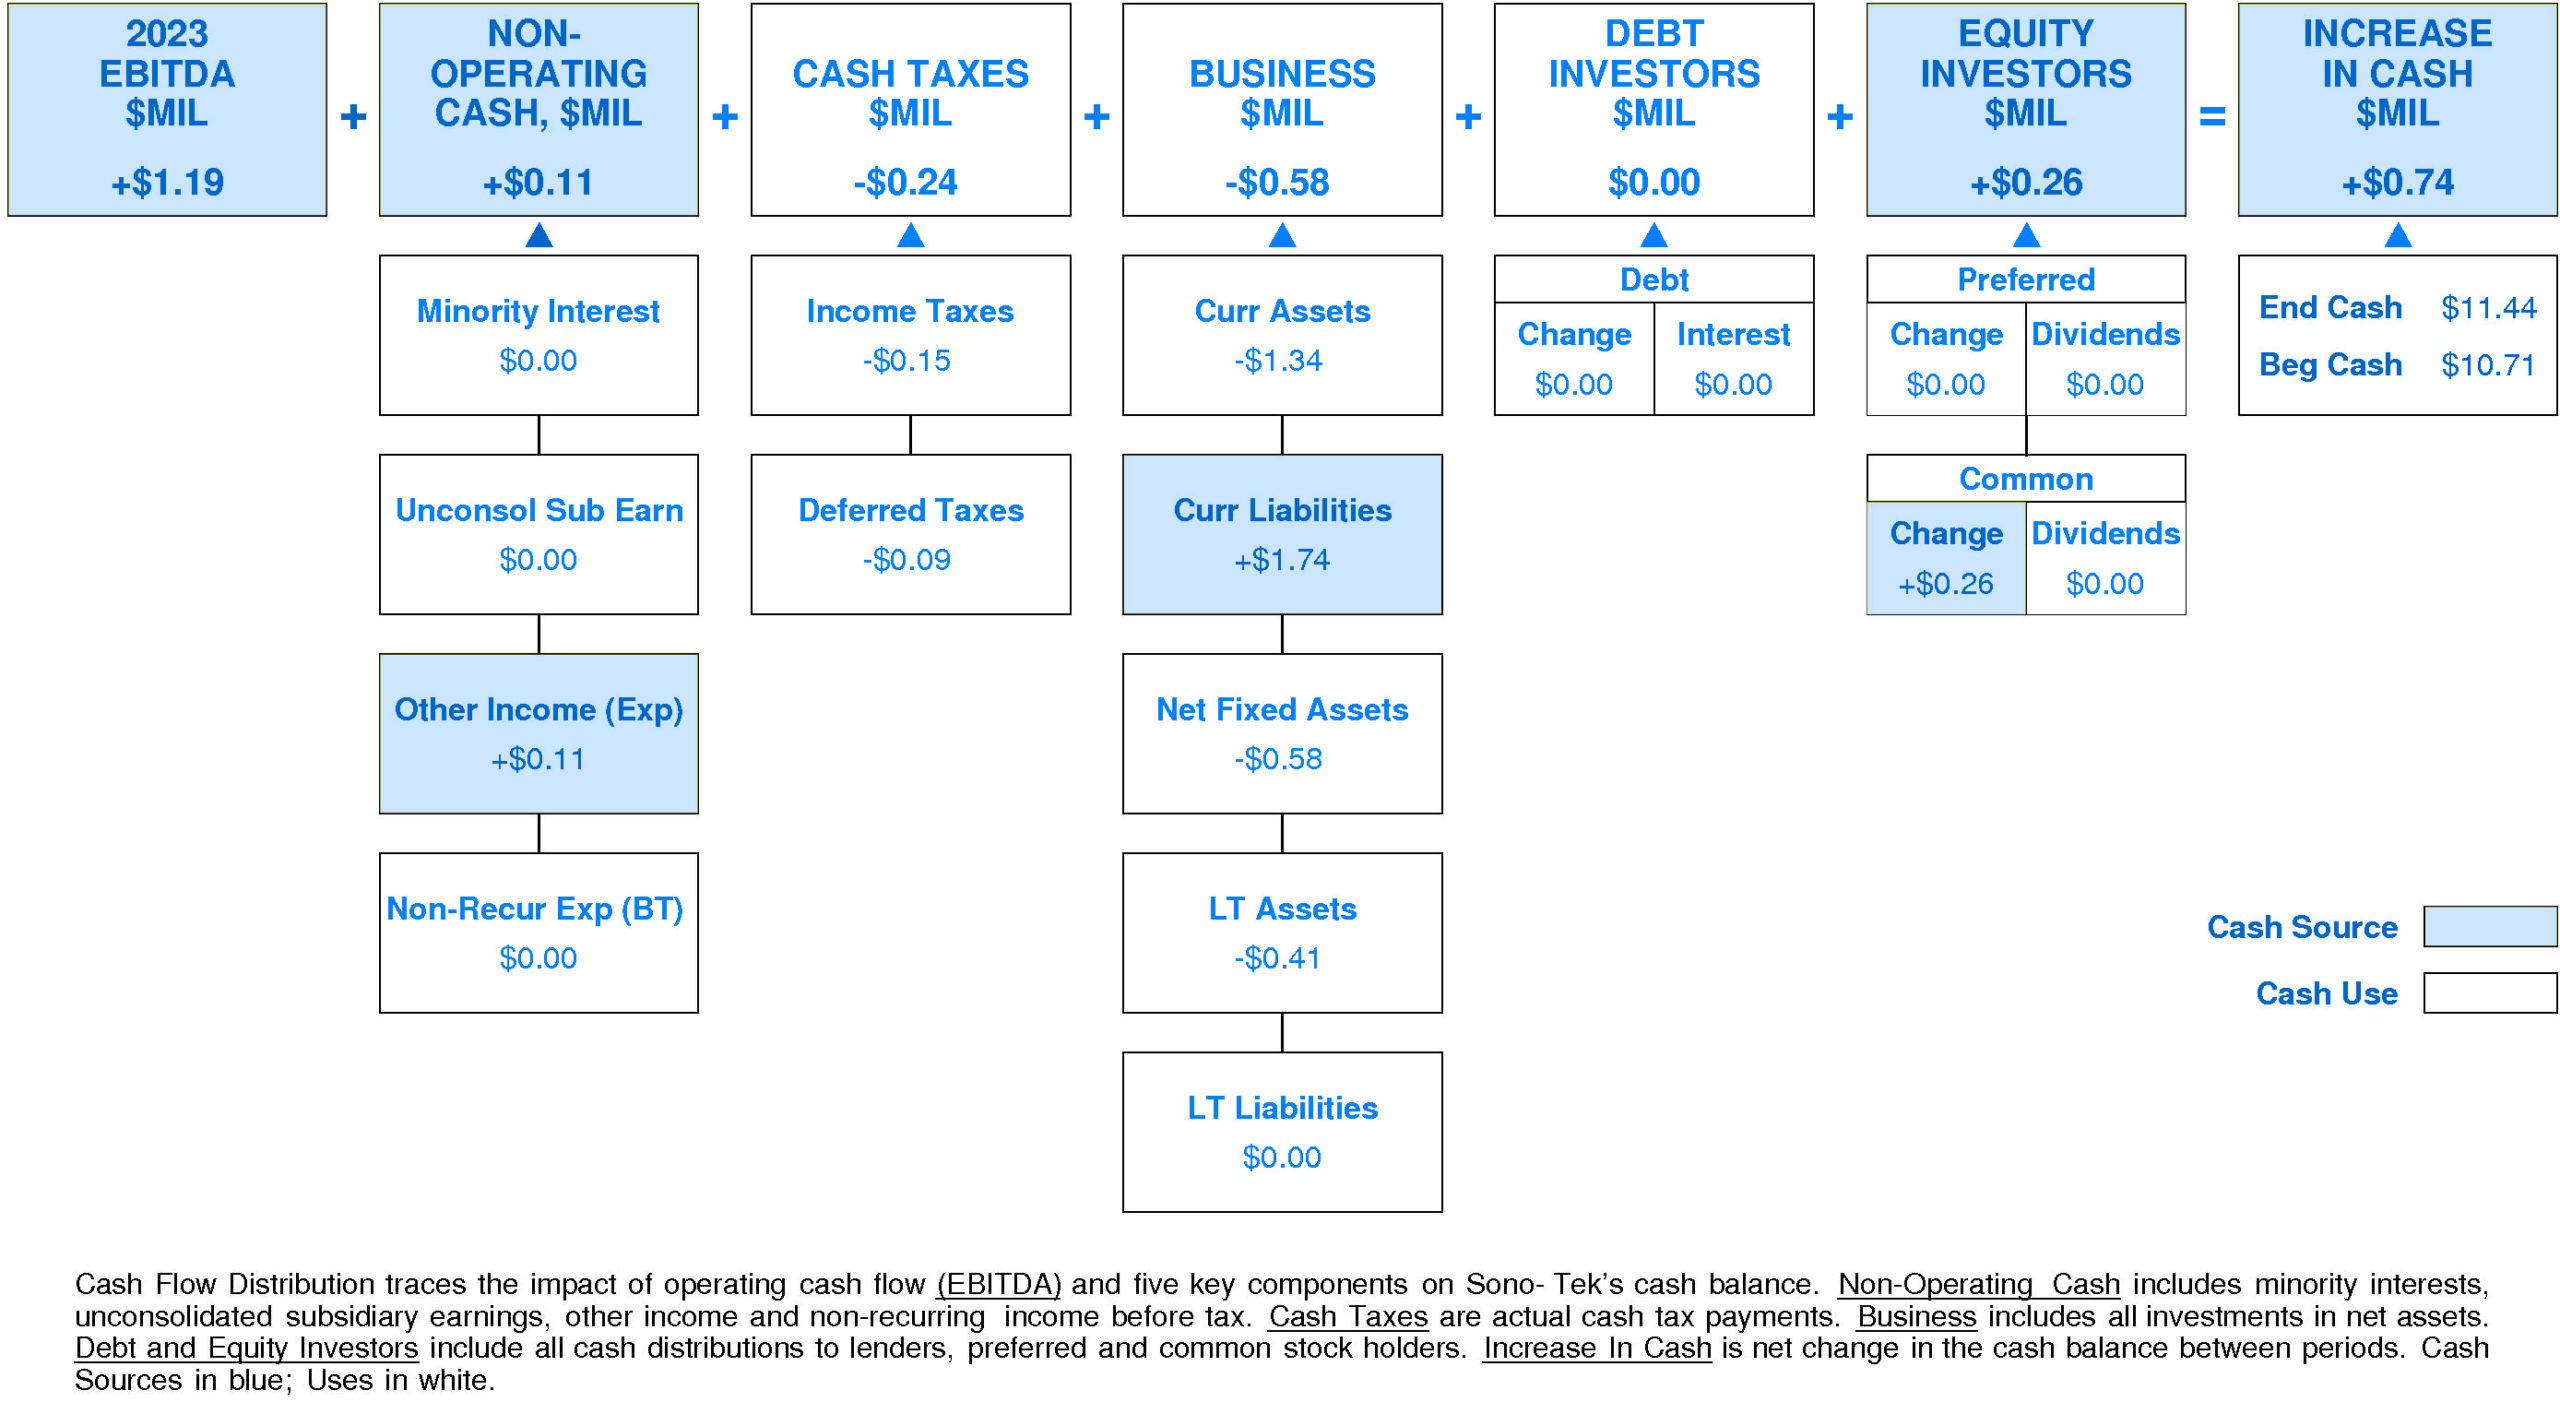
In 2023, Sono-Tek generated a slight increase in cash of +$0.74 million (+7%). Sources of cash were slightly larger than uses. Cash generated from 2023 EBITDA totaled +$1.19 million. Non-operating sources contributed +$0.11 million (+9% of EBITDA). Cash taxes consumed -$0.24 million (-20% of EBITDA). Re-investment in the business amounted to -$0.58 million (-49% of EBITDA). In 2023, debt investors had no impact on cash while equity investors provided +$0.26 million (+21% of EBITDA).
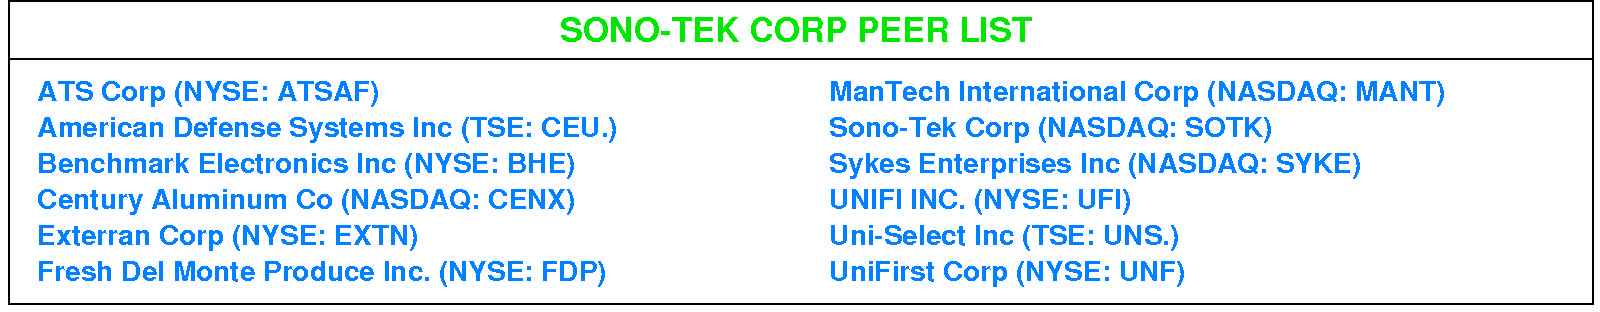
Sono-Tek’s Non-operating Income, %EBITDA has exhibited a volatile overall uptrend over the period. This improvement was accompanied by stability for the Sono-Tek Peer Group. In most years, Sono-Tek was in the top quartile. Currently, Sono-Tek is upper quartile at +9% of EBITDA (+$0.11 million).
Sono-Tek’s Cash Taxes, %EBITDA has experienced a downtrend over the period. This downtrend was accompanied by stability for the Sono-Tek Peer Group. (Since 2017 Cash Taxes, %EBITDA has accelerated sharply.) In most years, Sono-Tek was in the third quartile and second quartile. Currently, Sono-Tek is lower quartile at -20% of EBITDA (-$0.24 million).
Sono-Tek’s Business Re-investment, %EBITDA has suffered a volatile overall downtrend over the period. This downtrend was accompanied by a similar trend for the Sono-Tek Peer Group. In most years, Sono-Tek was in the top quartile and second quartile. Currently, Sono-Tek is substantially below median at -49% of EBITDA (-$0.58 million).
Sono-Tek’s Debt Investors, %EBITDA has experienced a volatile overall uptrend over the period. This improvement was accompanied by a similar trend for the Sono-Tek Peer Group. In most years, Sono-Tek was in the lower quartile and second quartile. Currently, Sono-Tek is slightly above median at 0% of EBITDA ( $0.00 million).
Sono-Tek’s Equity Investors, %EBITDA has exhibited a volatile overall uptrend over the period. This improvement was accompanied by a similar trend for the Sono-Tek Peer Group. (Since 2021 Equity Investors, %EBITDA has sharply accelerated.) In most years, Sono-Tek was in the top quartile and second quartile. Currently, Sono-Tek is upper quartile at +21% of EBITDA (+$0.26 million).
Sono-Tek’s Change in Cash, %EBITDA has experienced a downtrend over the period. This downtrend was accompanied by a similar trend for the Sono-Tek Peer Group. In most years, Sono-Tek was in the top quartile. Currently, Sono-Tek is at the upper quartile at +62% of EBITDA (+$0.74 million).
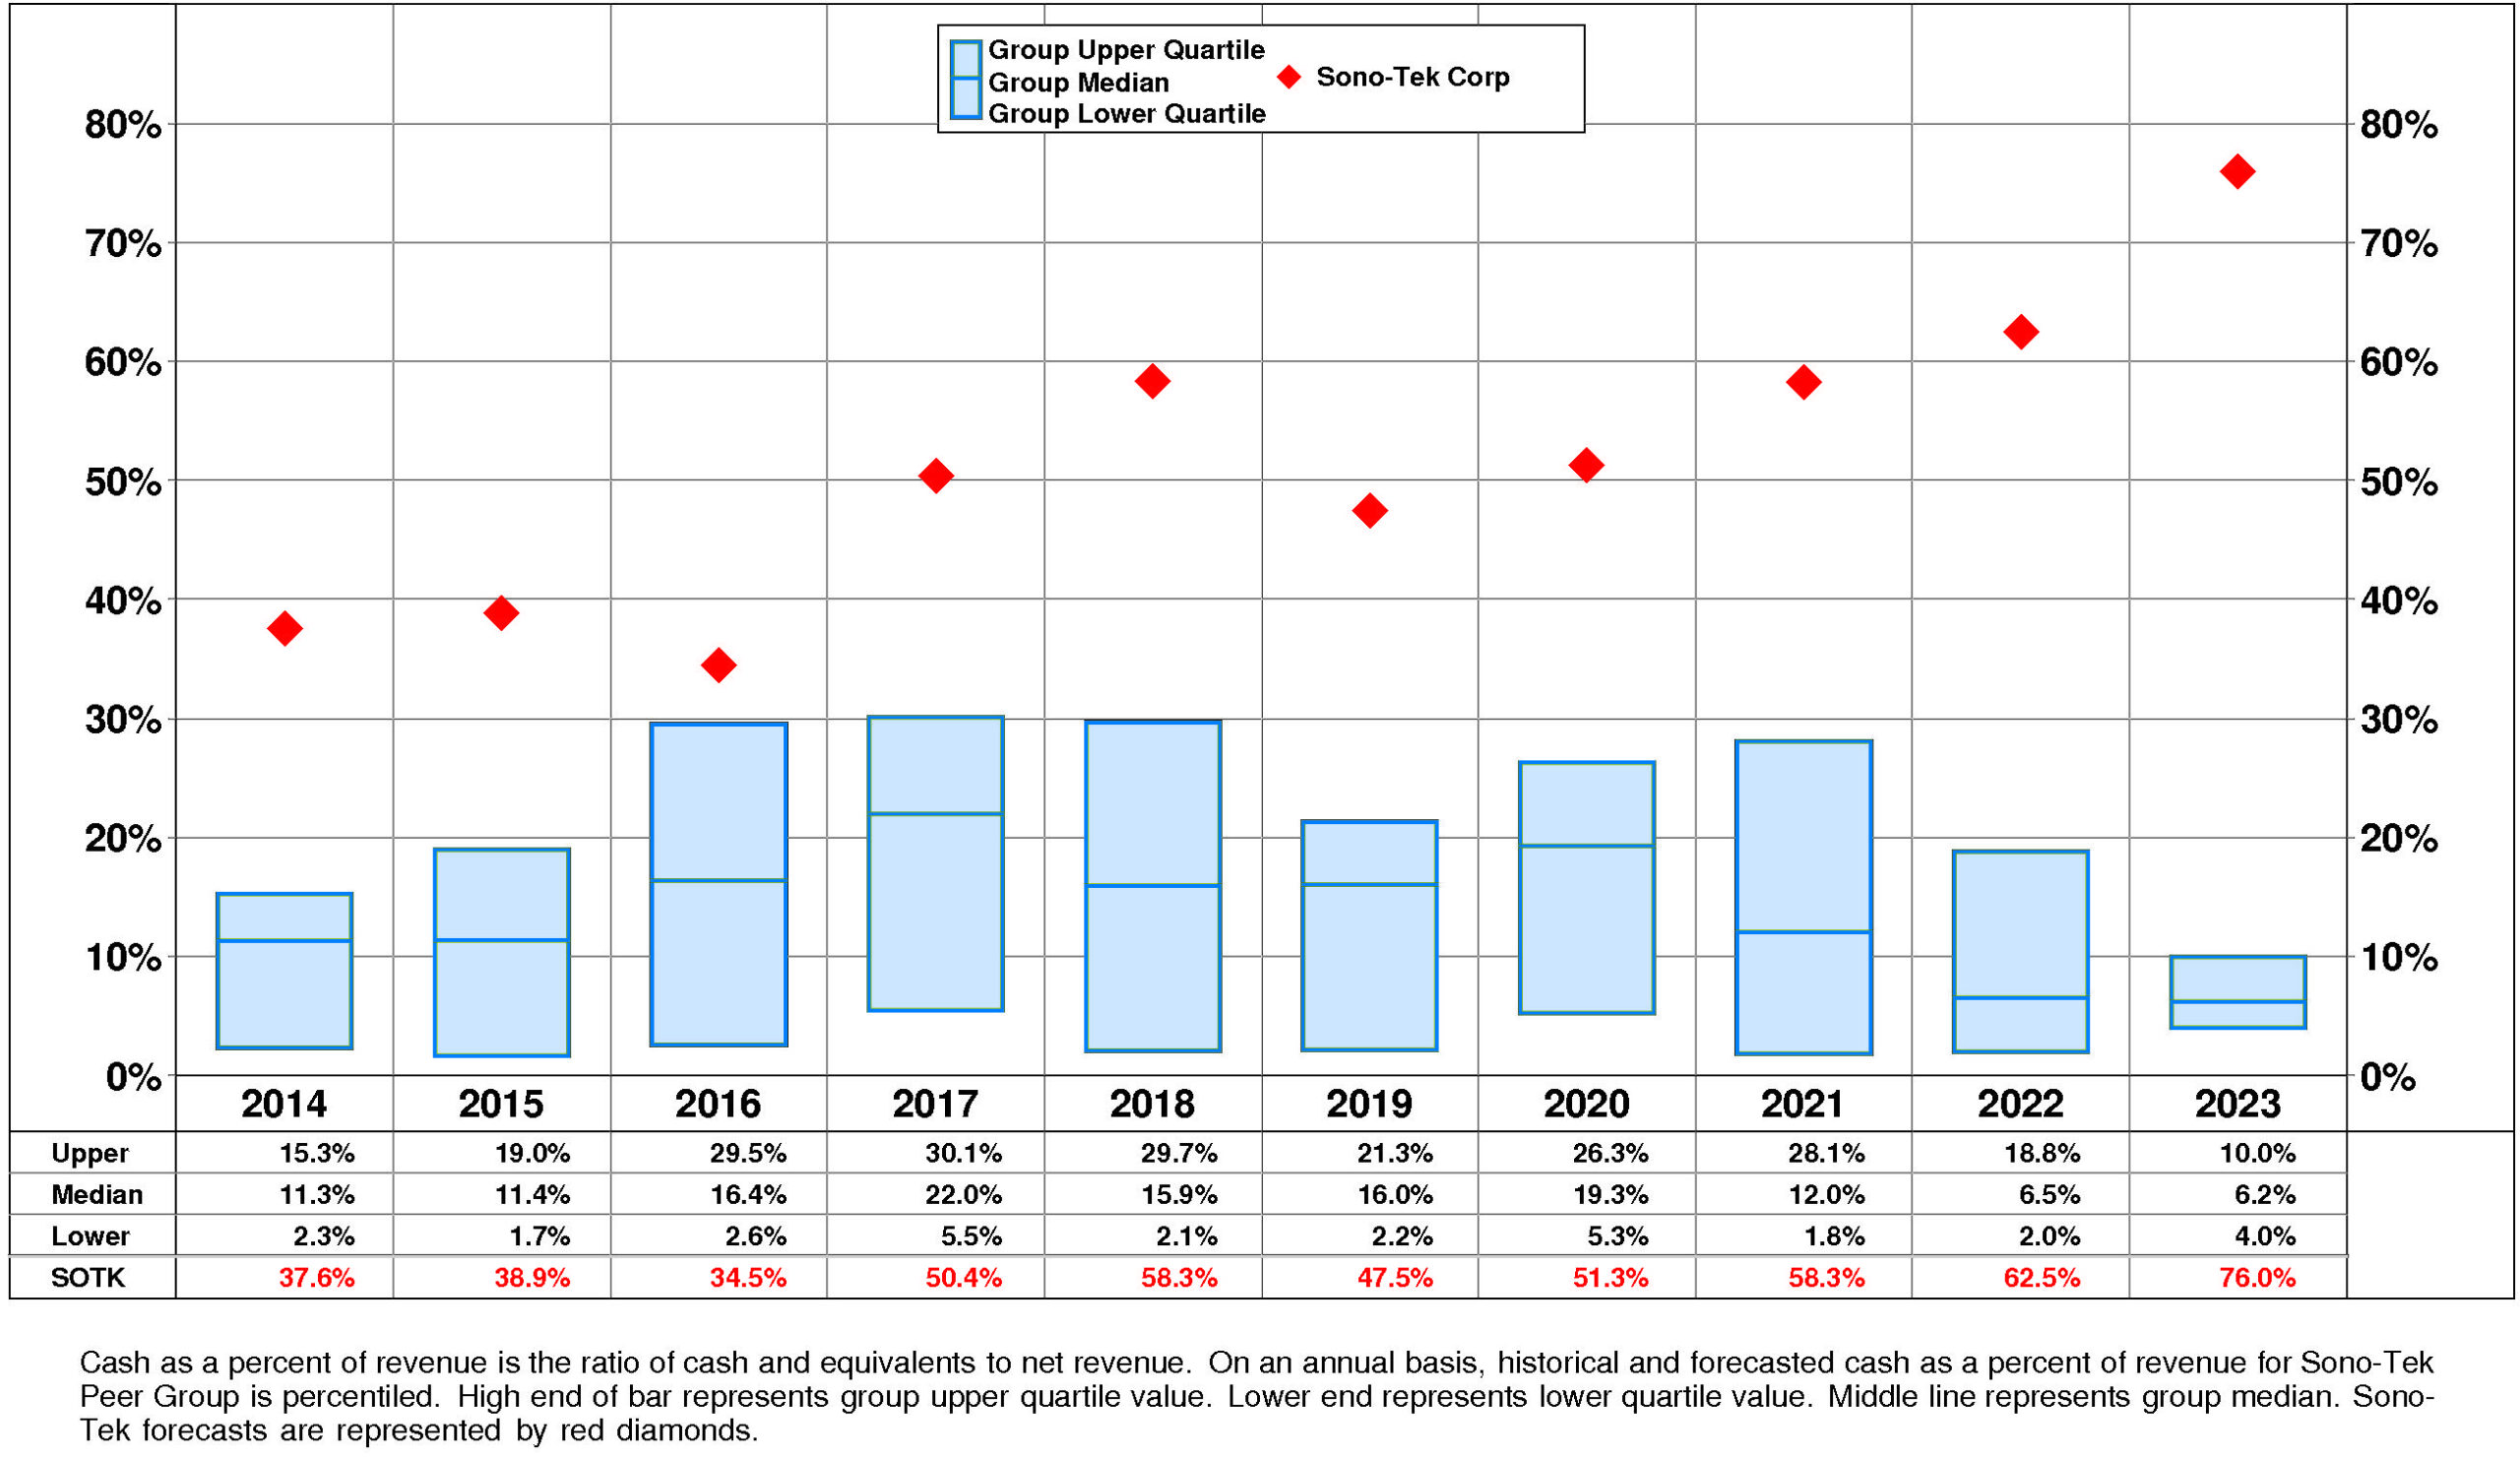
Sono-Tek’s Cash, %Revenue has enjoyed a strong overall uptrend over the period. This improvement was accompanied by an opposite trend for the Sono-Tek Peer Group. (Since 2019 Cash, %Revenue has stabilized.) In most years, Sono-Tek was in the top quartile. Currently, Sono-Tek is upper quartile at +76%.
PROFITABILITY
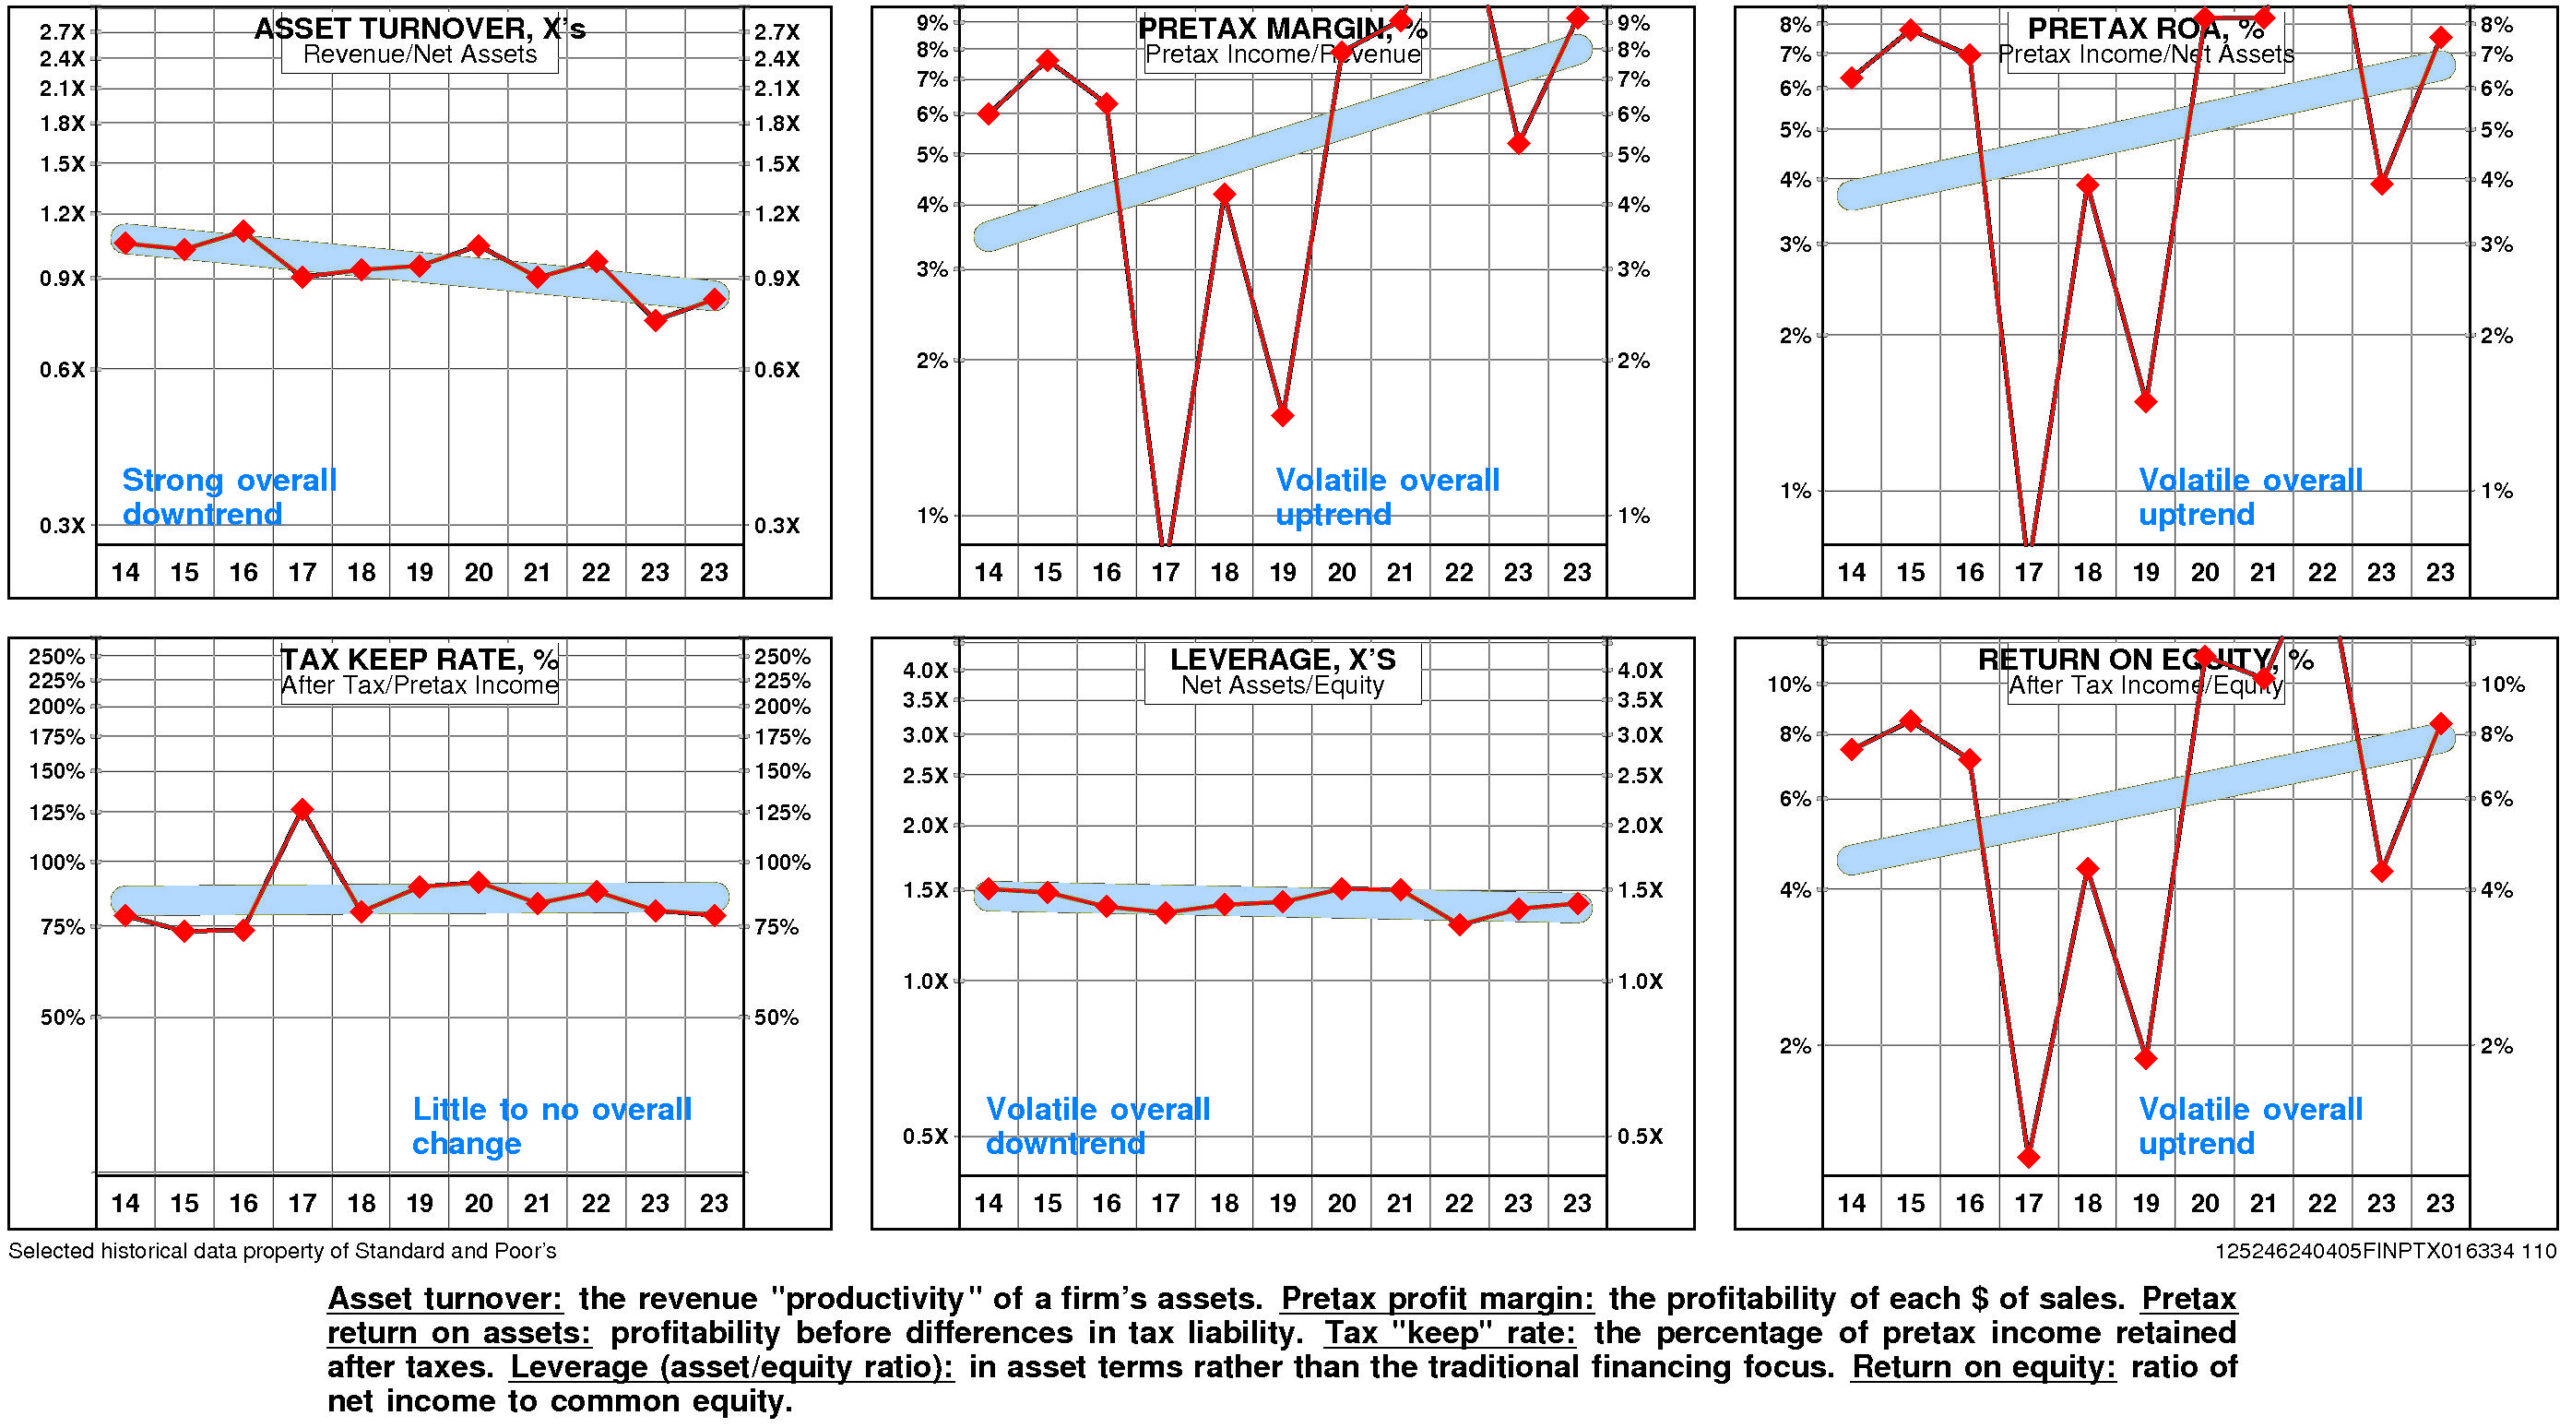
Sono-Tek’s return on equity has improved very significantly since 2014. The current level of 8.4% is 1.13X the low for the period and is -1.1% from the high.
This very significant improvement was due to very strong positive trend in pretax operating return and little change in non-operating factors.
The productivity of Sono-Tek’s assets declined over the full period 2014-2023: asset turnover has suffered a strong overall downtrend.
Sono-Tek’s pretax margin enjoyed a volatile overall uptrend over the period 2014-2023.
Non-operating factors (income taxes and financial leverage) had little influence on return on equity.
Sono-Tek’s return on equity is above median (8.4%) for the four quarters ended November, 2023.
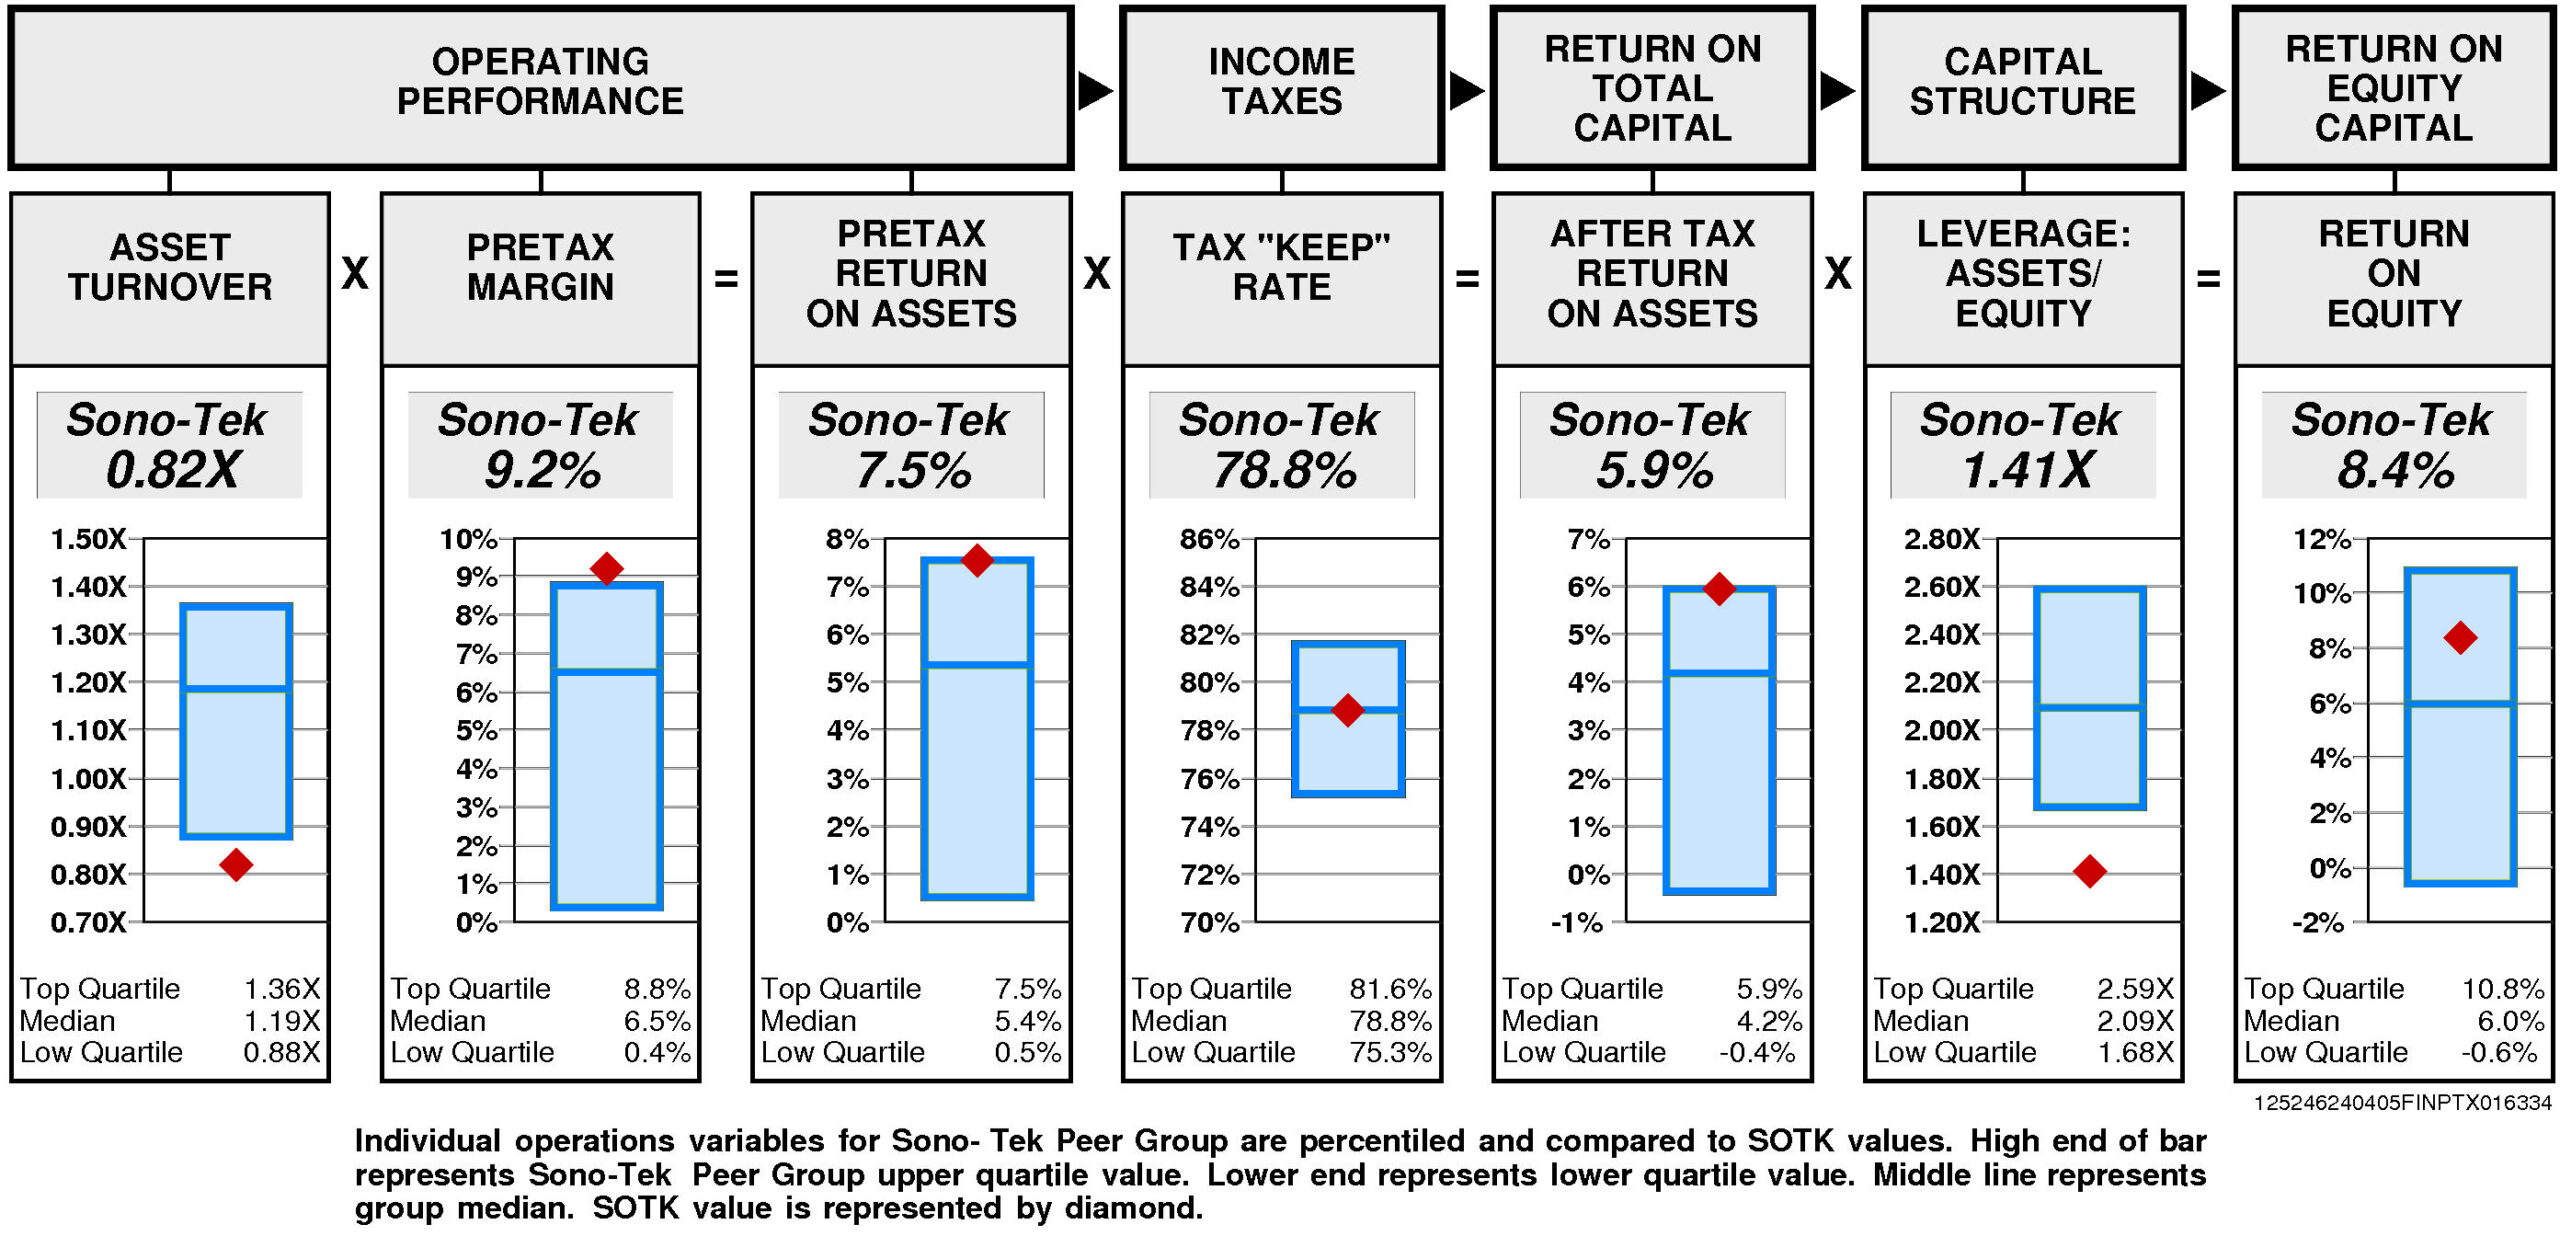
Operating performance (pretax return on assets) is at the upper quartile (7.5%) reflecting asset turnover that is lower quartile (0.82X) and upper quartile pretax margin (9.2%).
Tax “keep” rate (income tax management) is at median (78.8%) resulting in after tax return on assets that is at the upper quartile.
Financial leverage (leverage) is lower quartile (1.41X).
GROWTH RATES
There are no significant differences between Sono-Tek’s longer term growth and growth in recent years.
Sono-Tek’s historical income statement growth has been in line with balance sheet growth. Revenue growth has paralleled asset growth; earnings growth has paralleled equity growth.
Annual revenue growth has been 5.4% per year.
Total asset growth has been 8.1% per year.
Annual E.P.S. growth has been 13.8% per year.
Equity growth has been 8.7% per year.
No consensus growth rate forecast is available for Sono-Tek.
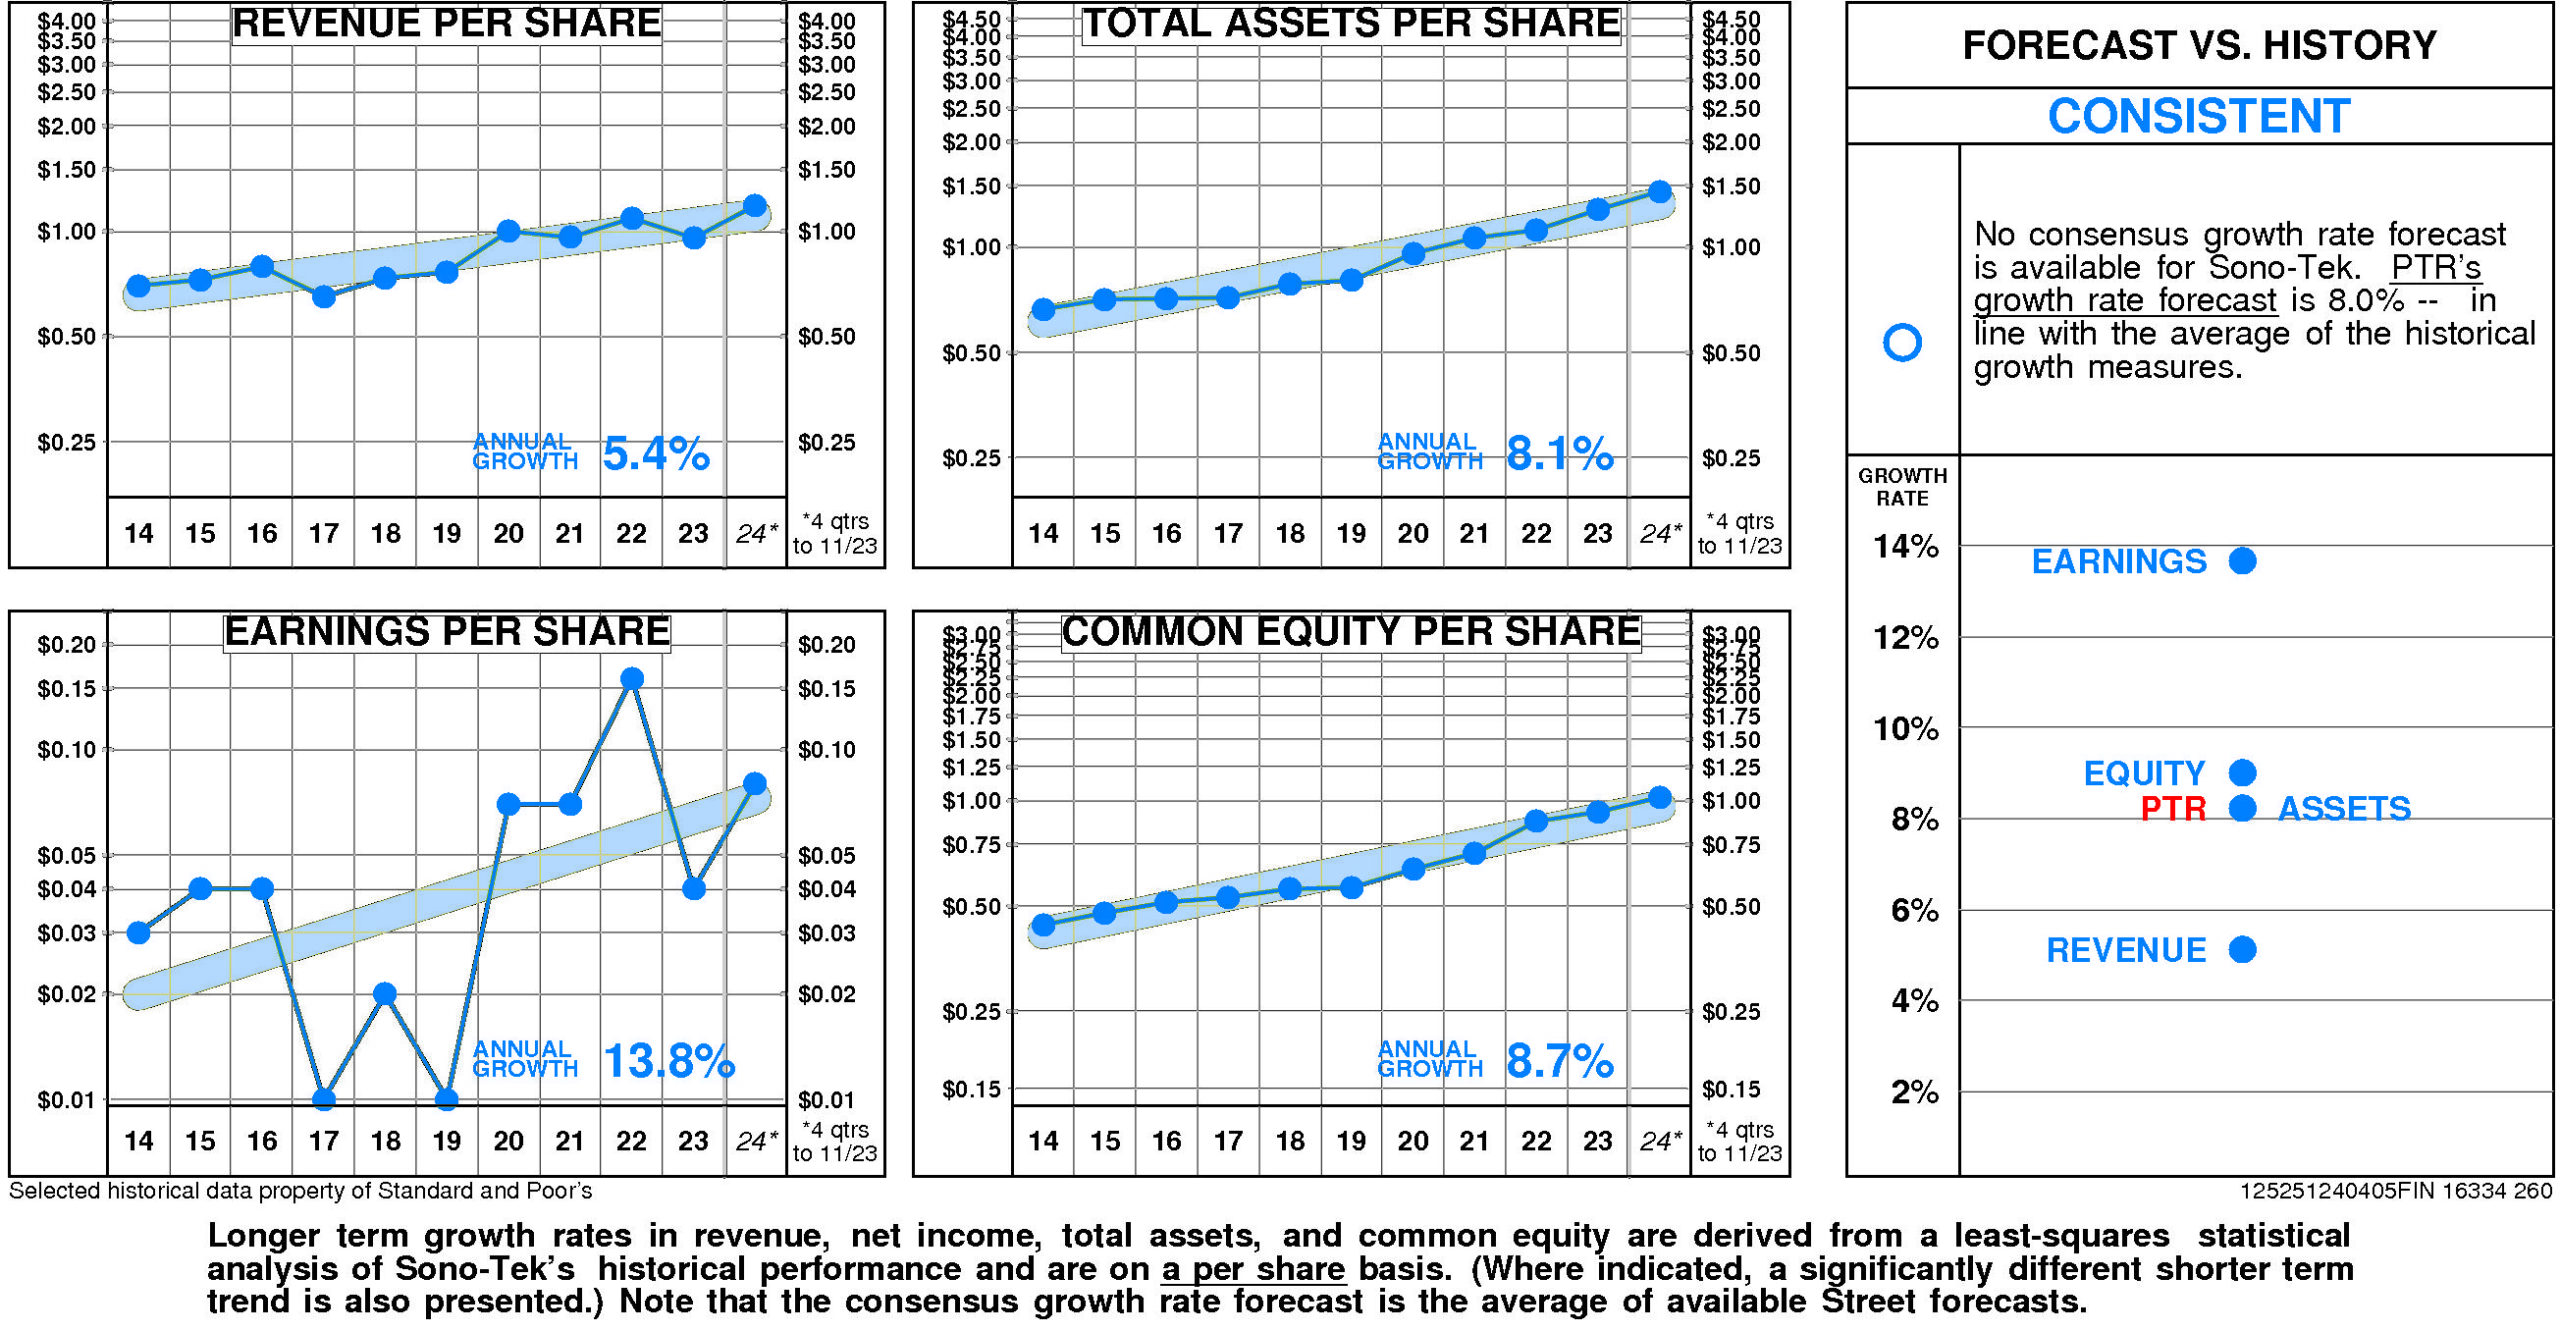
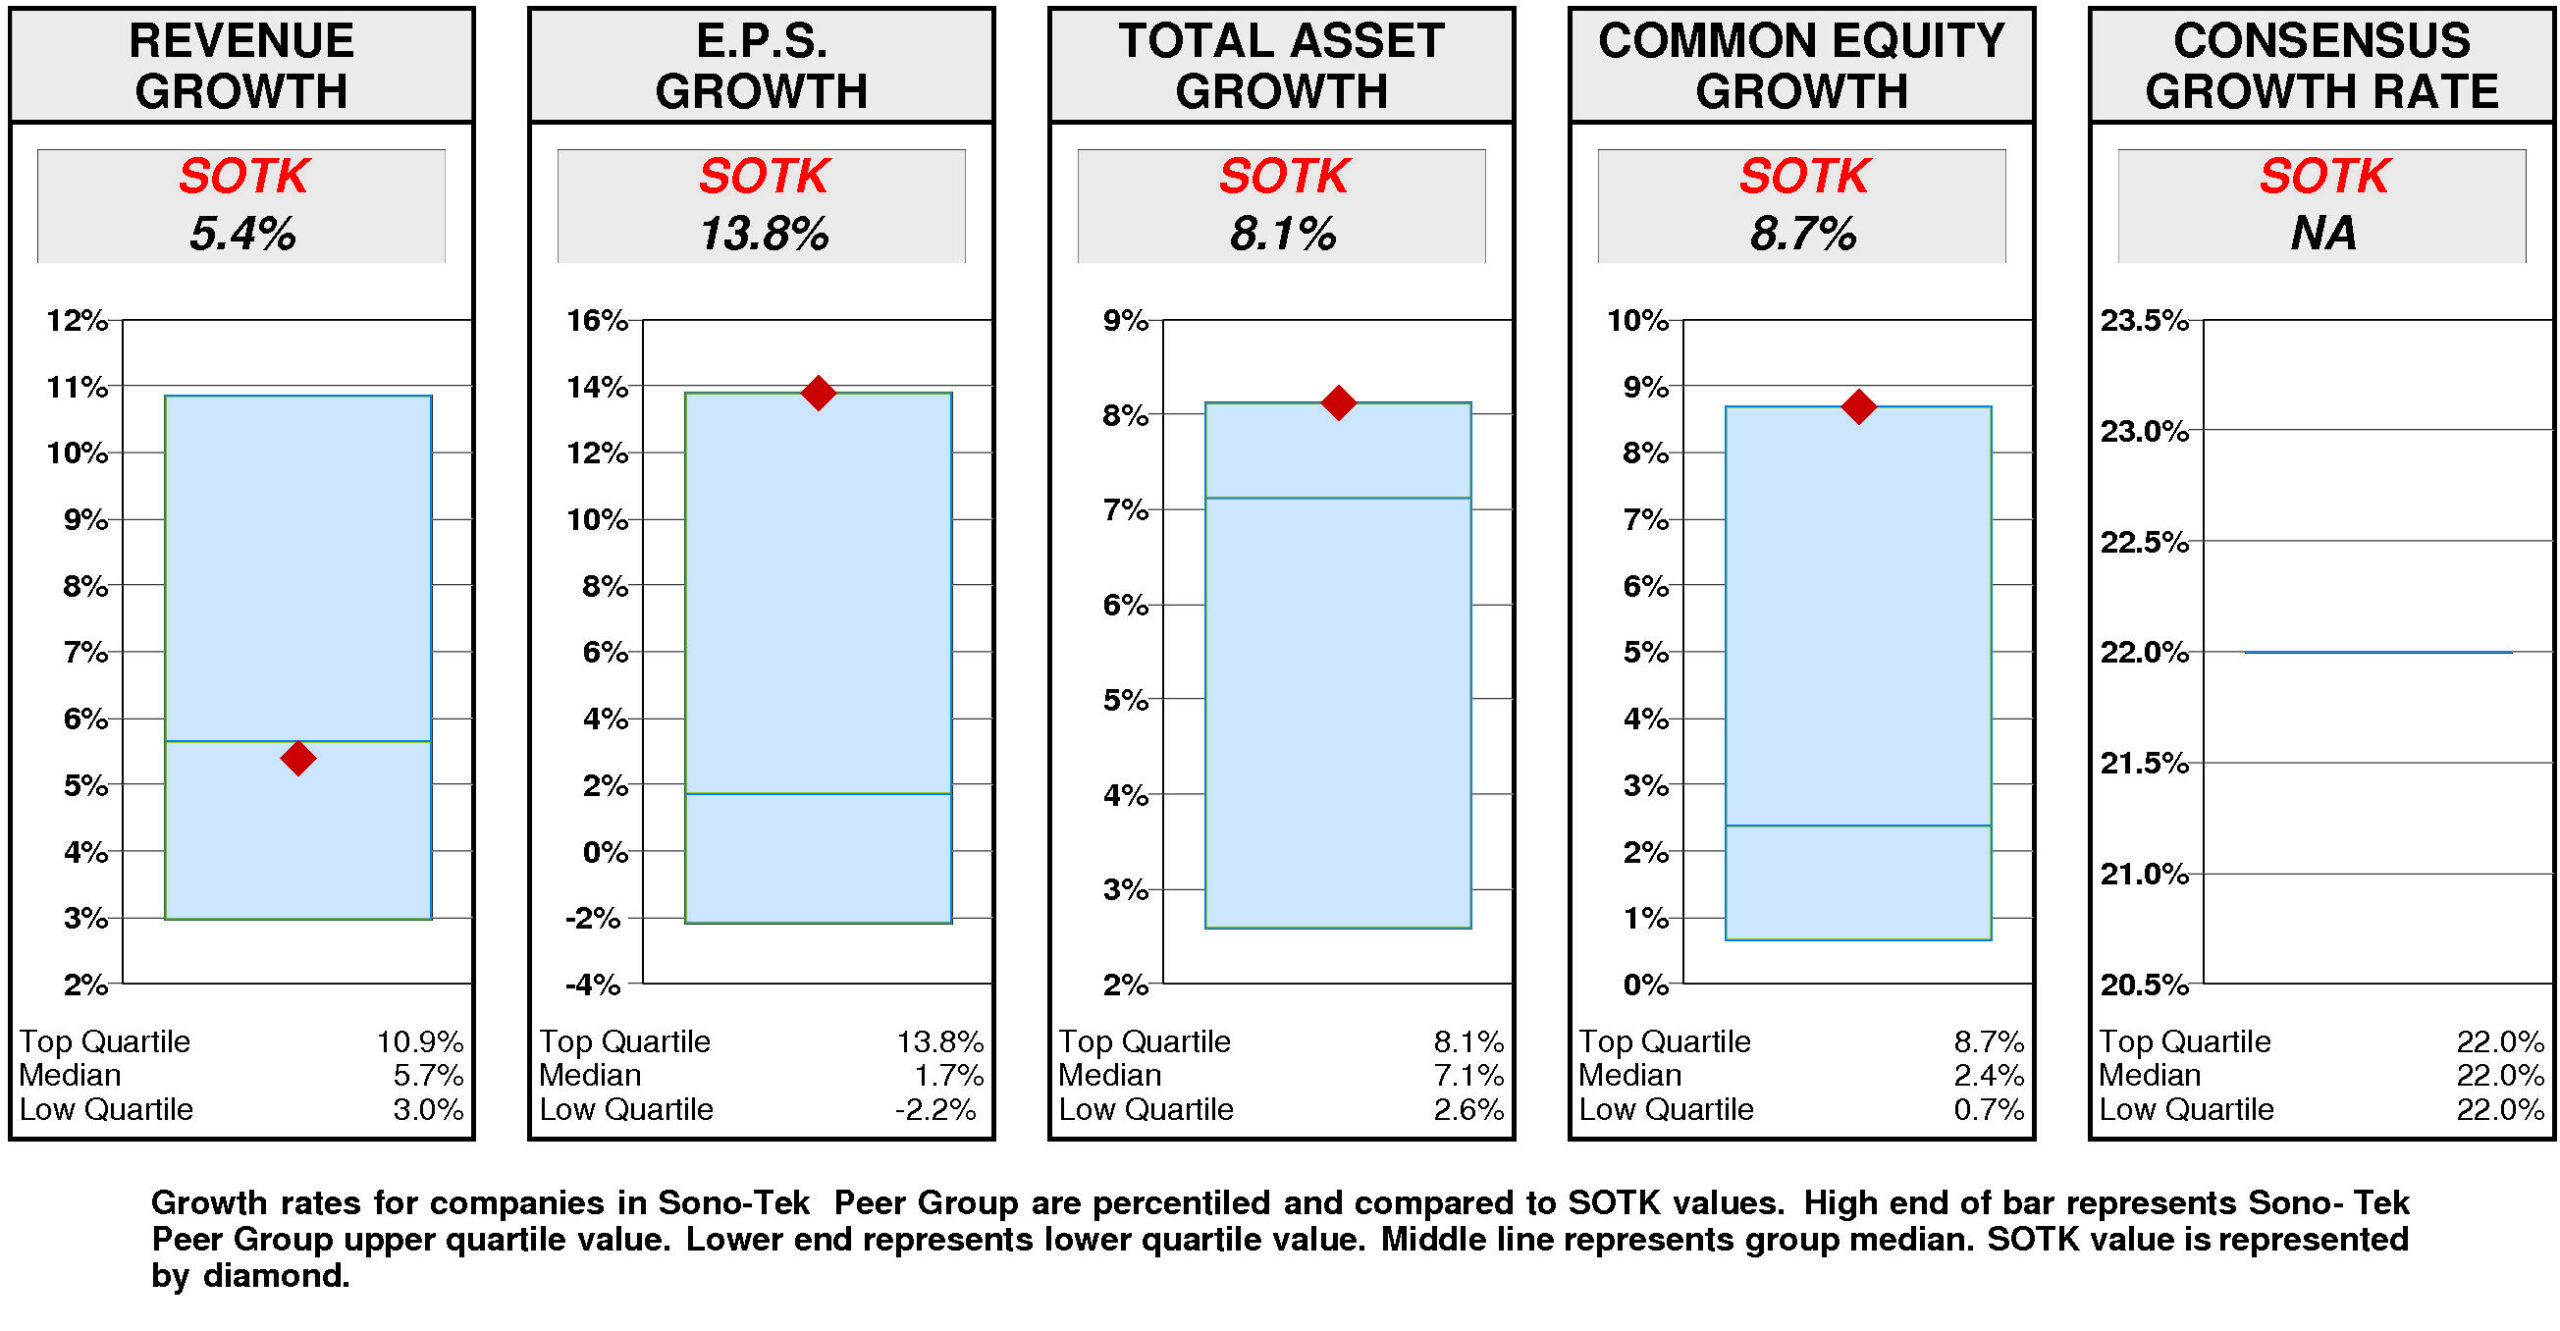
Relative to the Sono-Tek Peer Group, Sono-Tek’s historical growth measures are generally top quartile. E.P.S. growth (13.8%) has been at the upper quartile. Total asset growth (8.1%) has been at the upper quartile. Equity growth (8.7%) has been at the upper quartile. Revenue growth (5.4%) has been slightly below median.
Consensus growth forecast is unavailable.
PRICE HISTORY
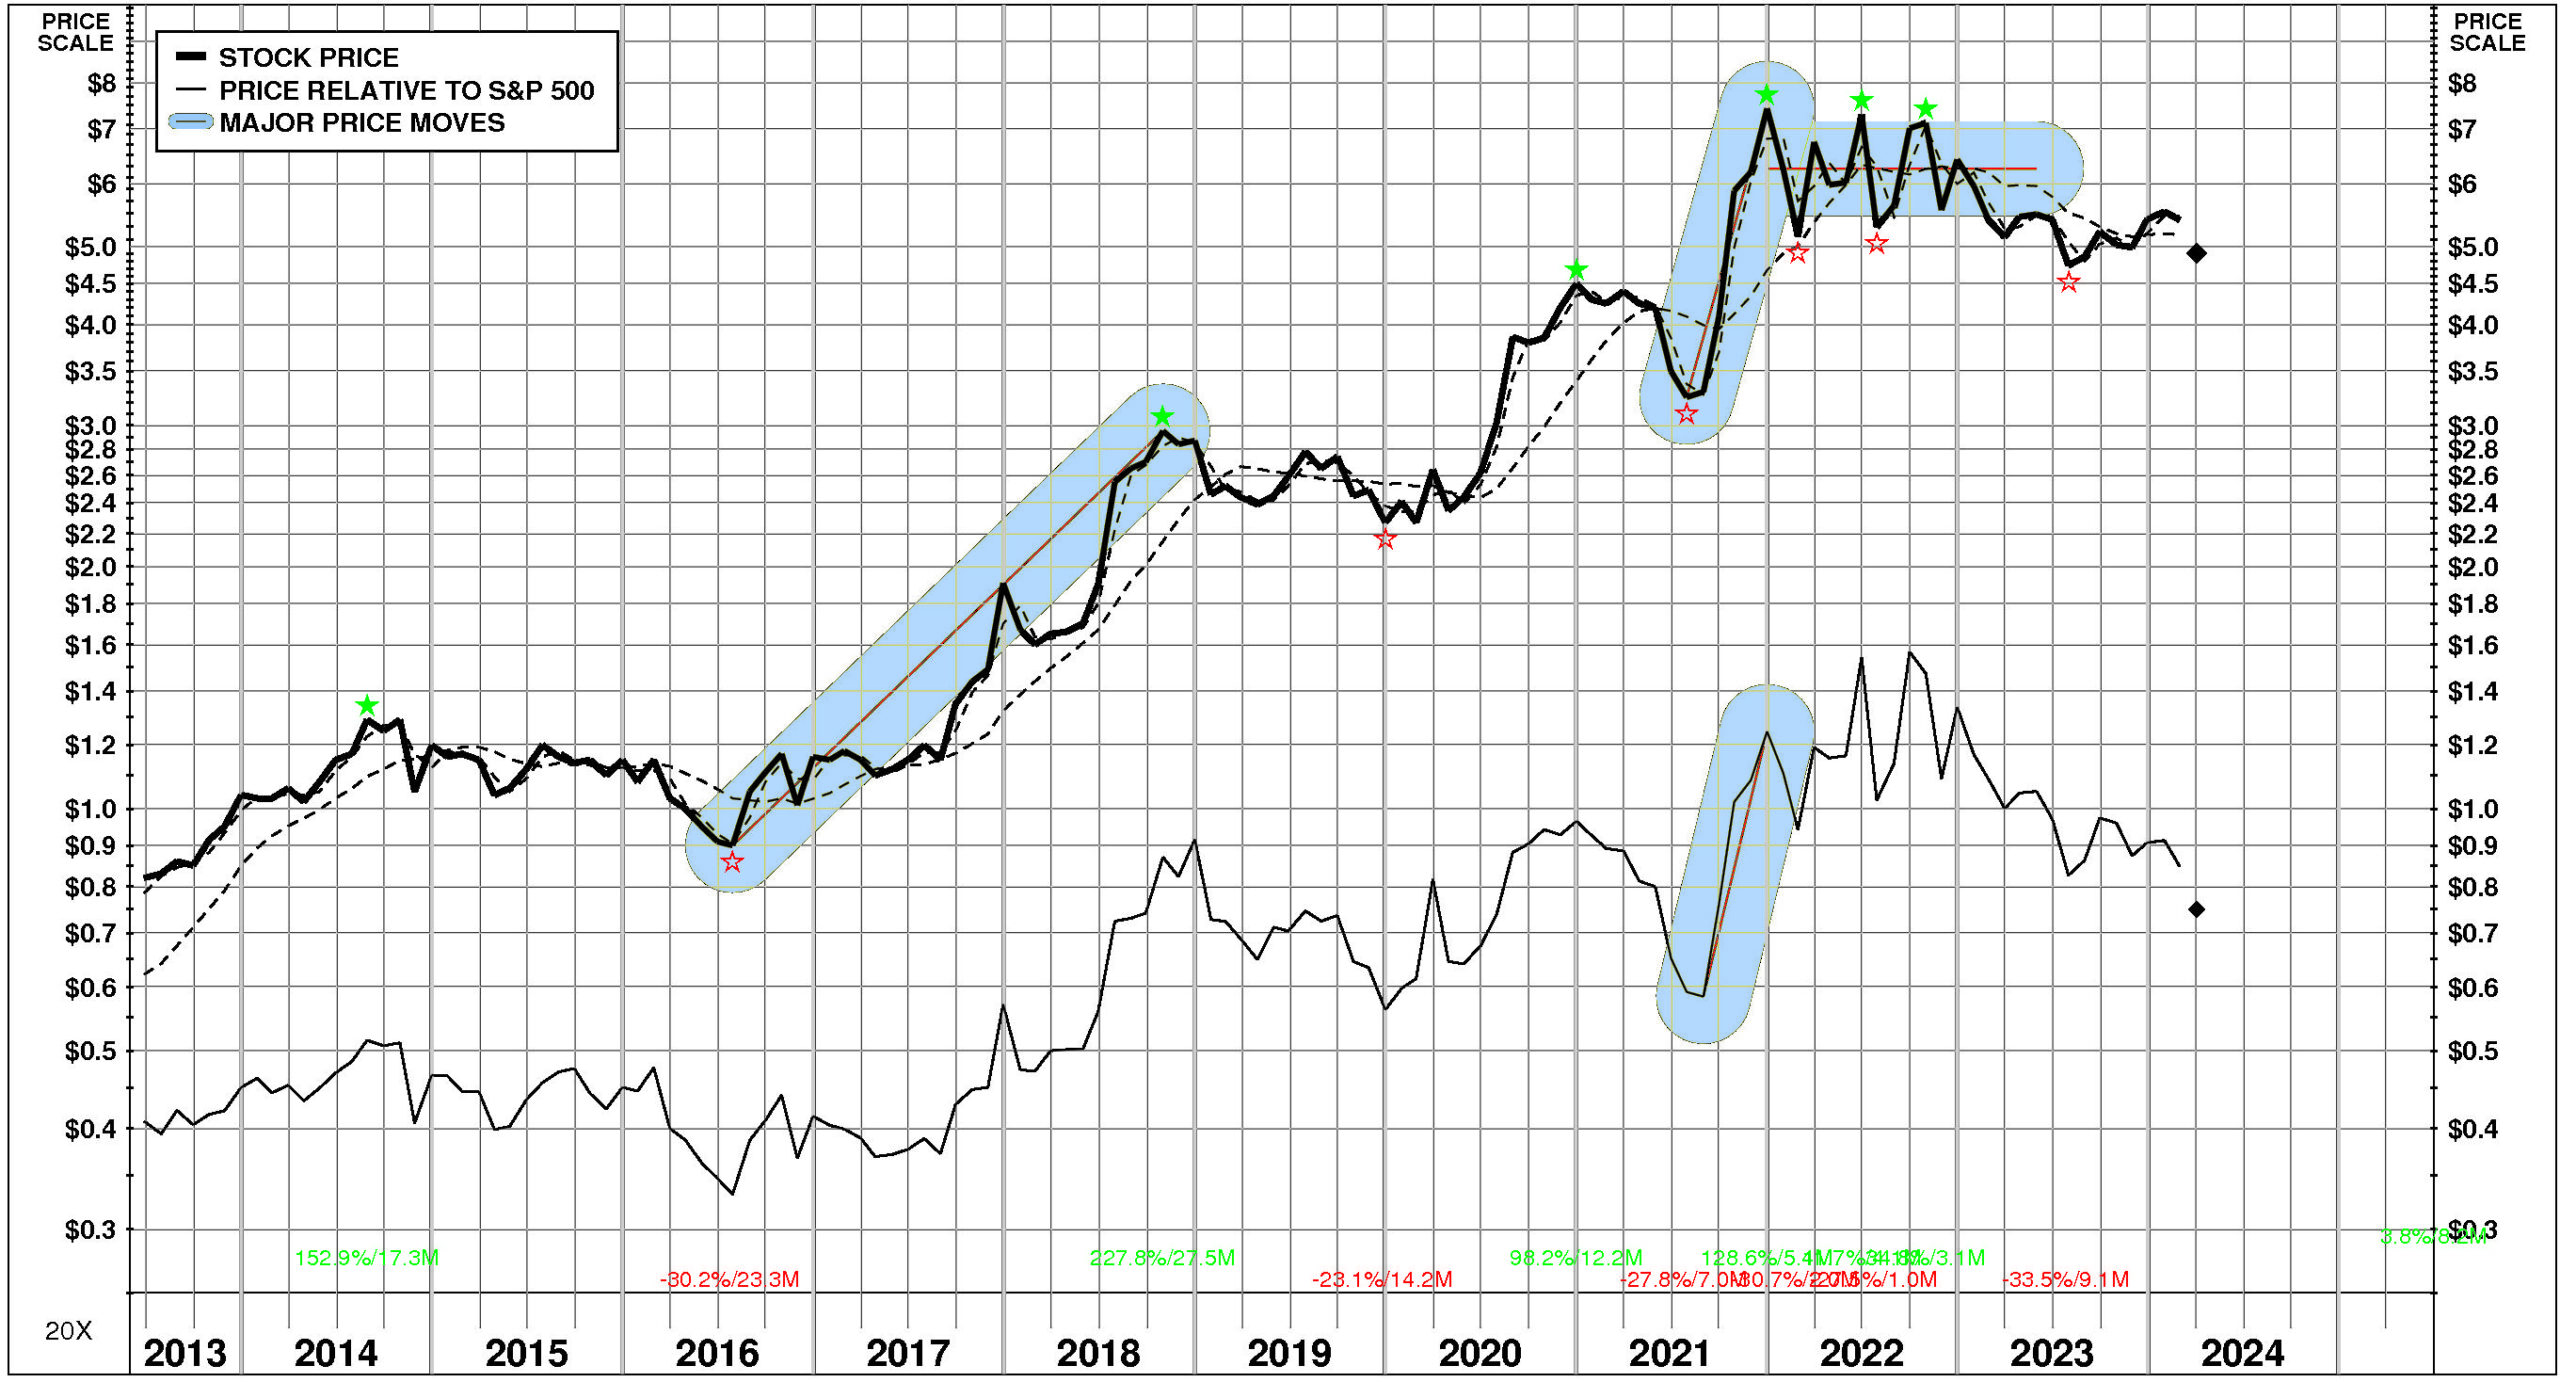
Over the full time period, Sono-Tek’s stock price performance has been variable and superior. Between June, 2013 and April, 2024, Sono-Tek’s stock price rose +500%; relative to the market, this was a +84% gain. Significant price moves during the period: 1) July, 2021 – December, 2021: +129%; and 2) July, 2016 – October, 2018: +228%.
TOTAL INVESTMENT RETURNS
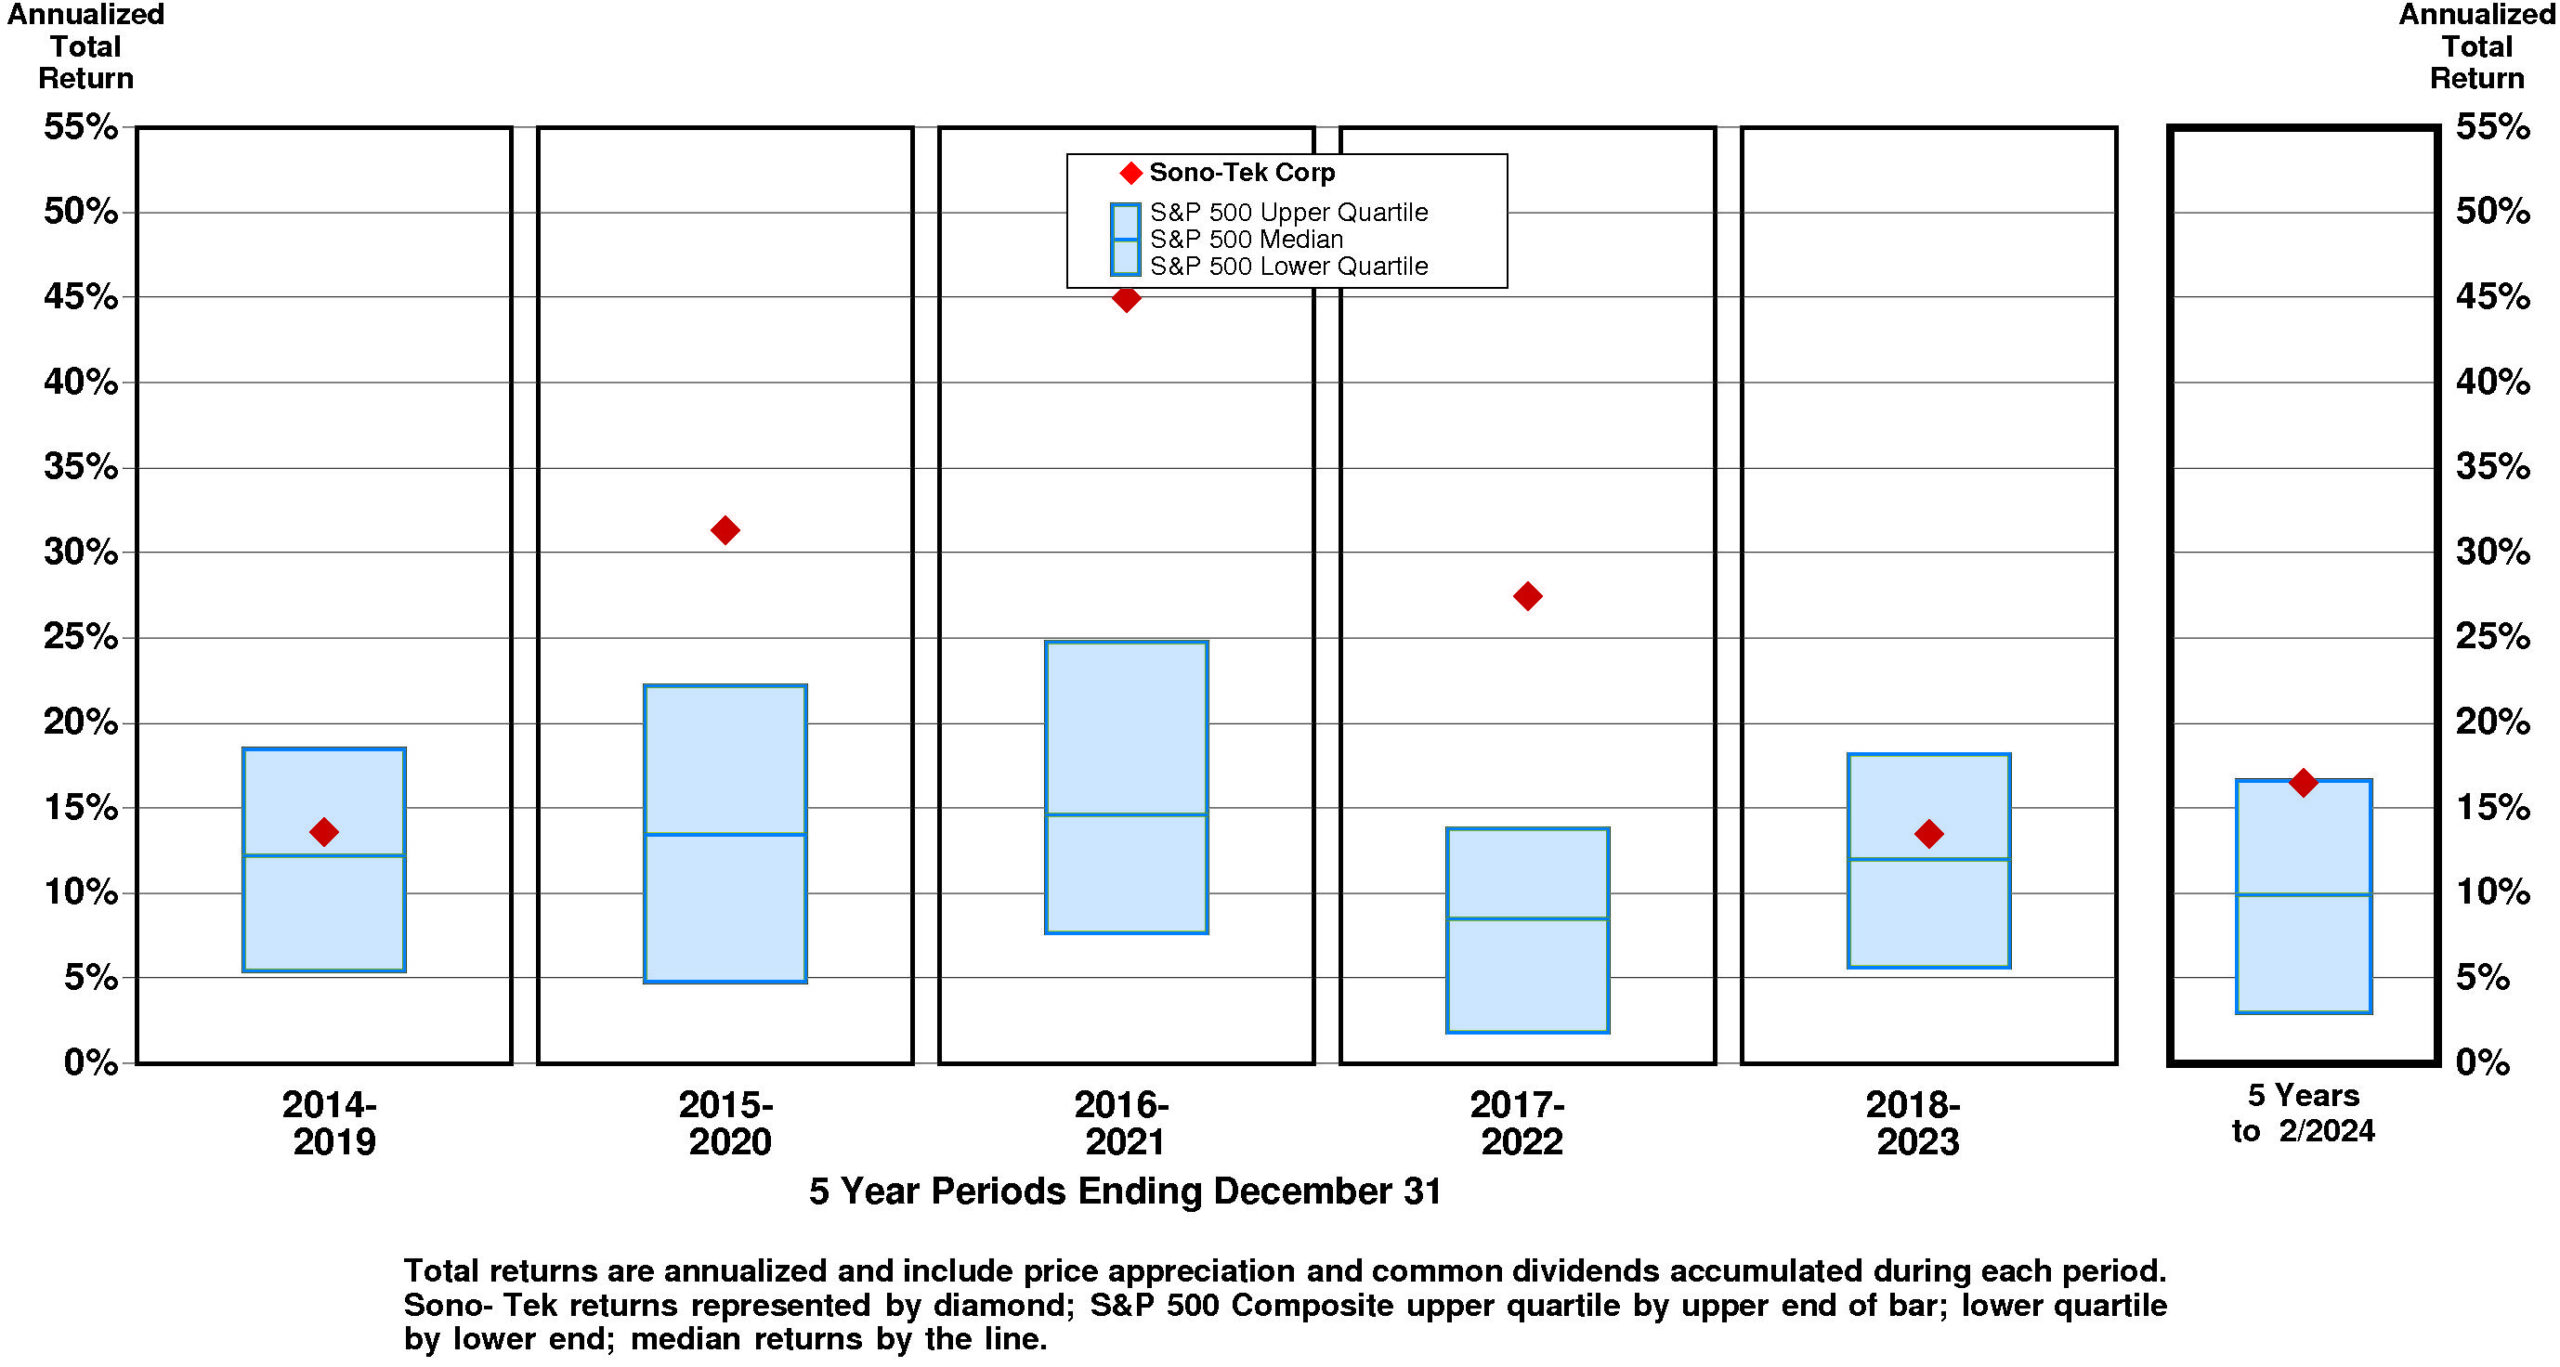
Current annual total return performance of 0.0% is below median relative to the S&P 500 Composite.
In addition to being below median relative to S&P 500 Composite, current annual total return performance through February, 2024 of 0.0% is slightly above median relative to Sono-Tek Corp Peer Group.
Current 5-year total return performance of 16.5% is at the upper quartile relative to the S&P 500 Composite.
Through February, 2024, with current 5-year total return of 16.5% relative to S&P 500 Composite at the upper quartile, Sono-Tek’s total return performance is at the upper quartile relative to Sono-Tek Corp Peer Group.
VALUATION BENCHMARKS
Relative to S&P 500 Composite, SOTK’s overall valuation is quite high. The highest factor, the price/earnings ratio, is upper quartile. Ratio of enterprise value/earnings before interest and taxes is upper quartile. Ratio of enterprise value/assets is upper quartile. Price/equity ratio is above median. The lowest factor, the ratio of enterprise value/revenue, is slightly above median.
Relative to Sono-Tek Peer Group, SOTK’s overall valuation is exceptionally high. All five factors are upper quartile. The highest factor is the ratio of enterprise value/revenue, followed by the ratio of enterprise value/assets, then by the ratio of enterprise value/earnings before interest and taxes, then by the price/earnings ratio. The lowest factor is the price/equity ratio.
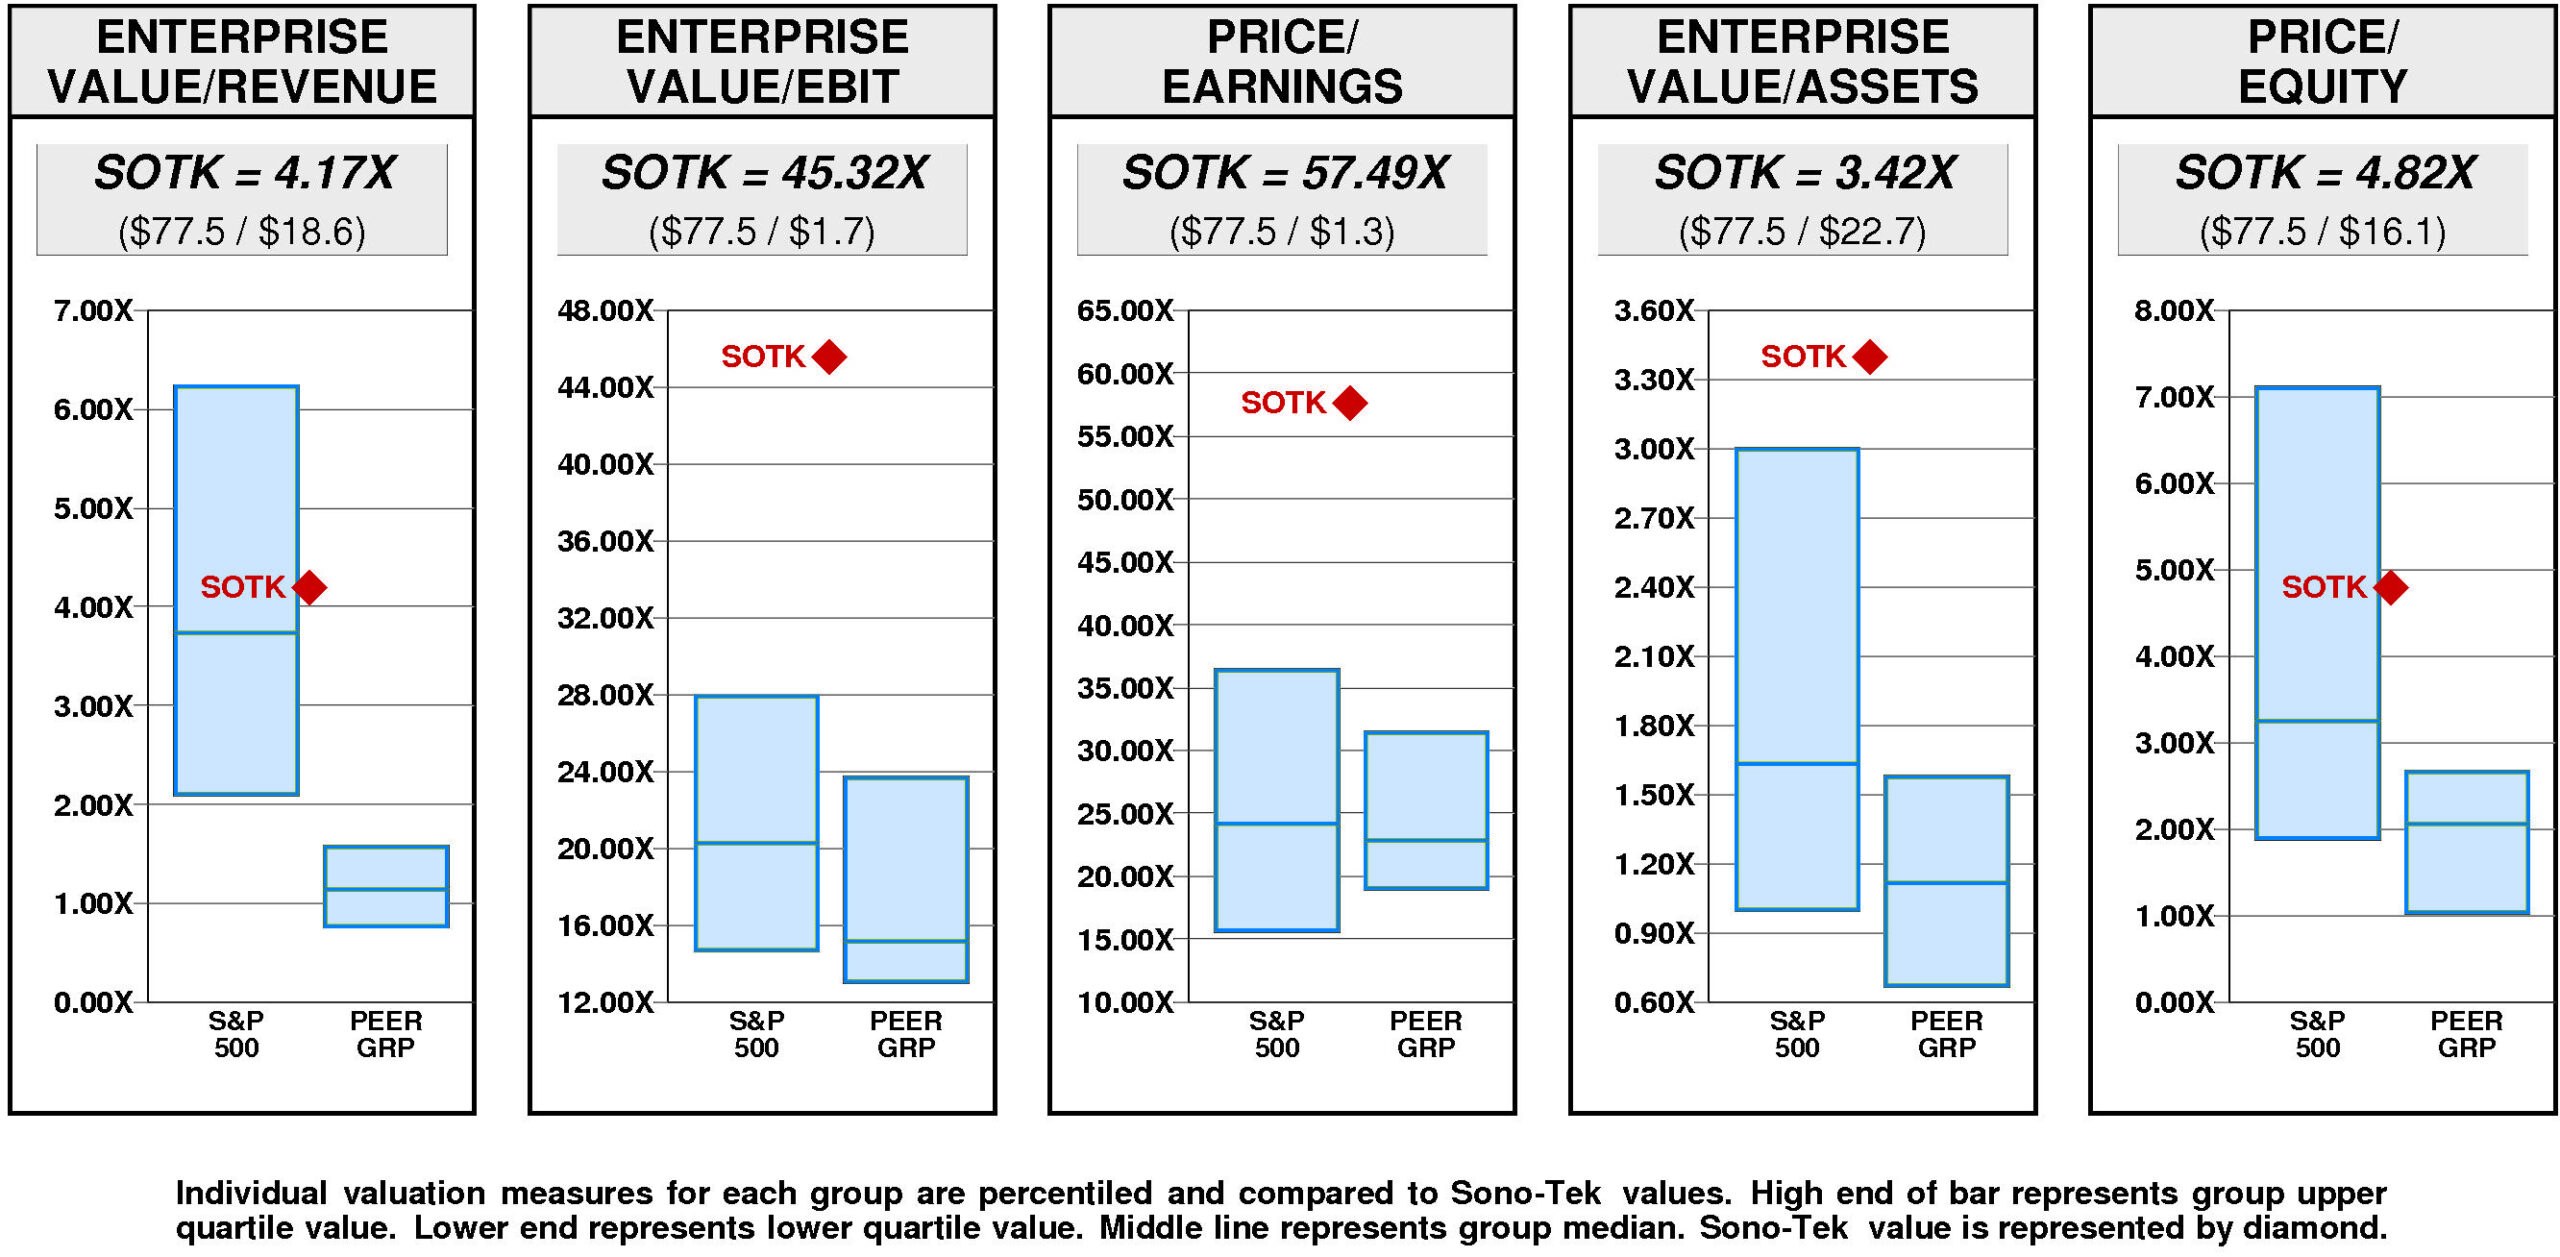
Sono-Tek has a major value gap compared to the median valuation. For SOTK to achieve median valuation, its current ratio of enterprise value/revenue would have to fall from the current level of 4.17X to 1.14X. If SOTK’s ratio of enterprise value/revenue were to fall to 1.14X, its stock price would be lower by $-4 to $1.
For SOTK to fall to lower quartile valuation relative to the Sono-Tek Peer Group, its current ratio of enterprise value/revenue would have to fall from the current level of 4.17X to 0.77X. If SOTK’s ratio of enterprise value/revenue were to fall to 0.77X, its stock price would decline by $-4 from the current level of $4.92.
VALUE TARGETS
Reflecting future returns on capital that are forecasted to be in line with the cost of capital, SOTK is expected to continue to be Value Creation neutral.
Sono-Tek’s current Price Target of $1 represents a -78% change from the current price of $4.92.
Sono-Tek’s very low appreciation potential results in an appreciation score of 4 (96% of the universe has greater appreciation potential.)
With this low Appreciation Score of 4, the neutral Power Rating of 59 results in an Value Trend Rating of F.
Sono-Tek’s current Price Target is $1 (-10% from the 2023 Target of $1 and -78% from the 04/01/24 price of $4.92). This slight fall in the Target is the result of a +7% increase in the equity base and a -16% decrease in the price/equity multiple. The forecasted decline in return on equity has a very large negative impact on the price/equity multiple and the forecasted decline in growth has a slight negative impact as well. Partially offsetting these Drivers, the forecasted decline in cost of equity has a very large positive impact.
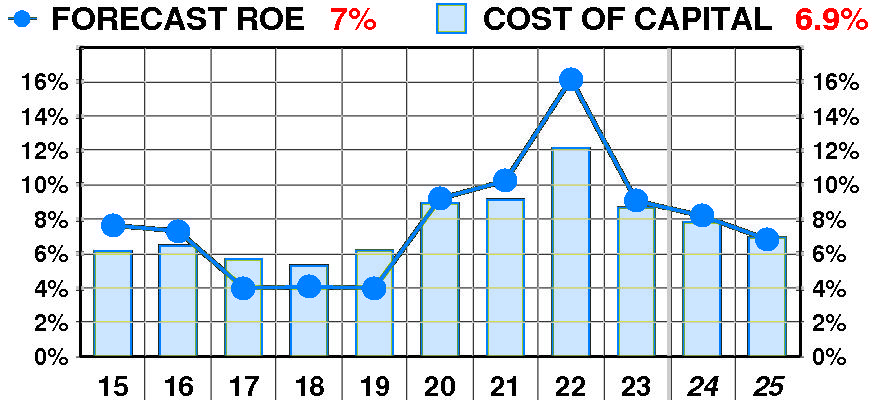
PTR’s return on equity forecast is 6.8% — slightly below our recent forecasts. Forecasted return on equity enjoyed a dramatic, erratic increase between 2015 and 2023. The current forecast is well below the 2022 peak of 16%.
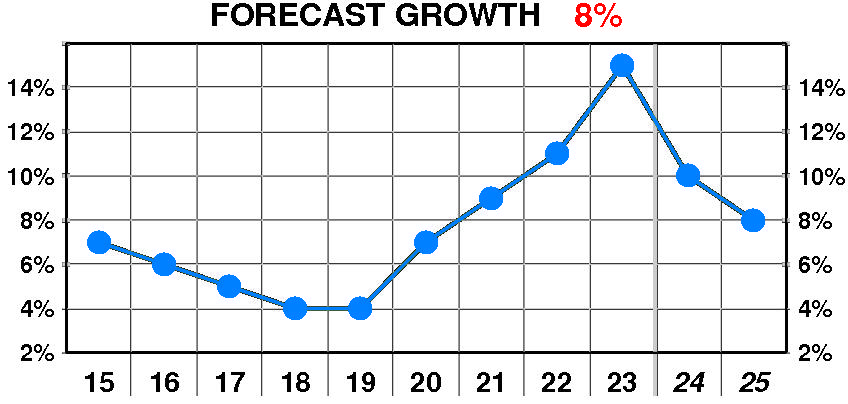
PTR’s growth forecast is 8.0% — below our recent forecasts. Forecasted growth enjoyed a dramatic, erratic increase between 2015 and 2023. The current forecast is above the 2019 low of 4%.
PTR’s cost of equity forecast is 6.9% — in line with recent levels. Forecasted cost of equity suffered a dramatic, variable increase between 2015 and 2023. The current forecast is well below the 2022 peak of 12.1%.
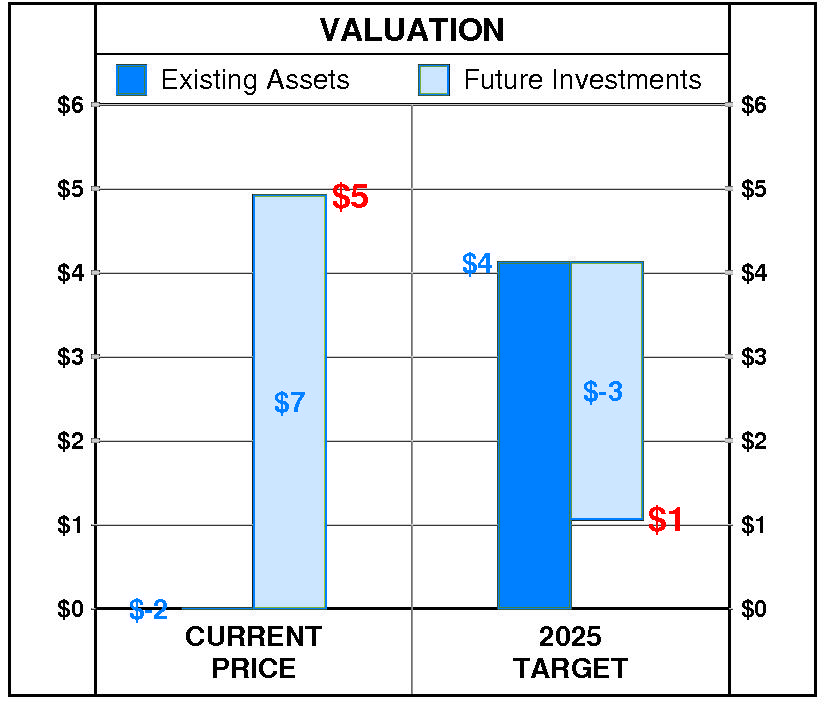
At Sono-Tek’s current price of $4.92, investors are placing a positive value of $7 on its future investments. This view is consistent with the company’s most recent performance that reflected a growth rate of 15.0% per year, and a return on equity of 9.1% versus a cost of equity of 8.7%.
PTR’s 2025 Price Target of $1 is based on these forecasts and reflects an estimated value of existing assets of $4 and a value of future investments of $-3.
Be the first to comment