BUSINESS
Sonoco Products Company, together with its subsidiaries, manufactures and sells industrial and consumer packaging products in North and South America, Europe, Australia, and Asia. The company operates through two segments: Consumer Packaging and Industrial Paper Packaging. The Consumer Packaging segment round and shaped rigid paper containers; metal and peelable membrane ends and closures; thermoformed plastic trays and containers; printed flexible packaging; and global brand artwork management. The Industrial Paper Packaging segment provides fiber-based tubes, cones, and cores; fiber-based construction tubes; fiber-based protective packaging and components; wooden, metal, and composite wire and cable, as well as reels and spools; and recycled paperboard, corrugating medium, recovered paper, and material recycling services.
INVESTMENT RATING
SON is expected to continue to be a major Value Builder reflecting capital returns that are forecasted to exceed the cost of capital.
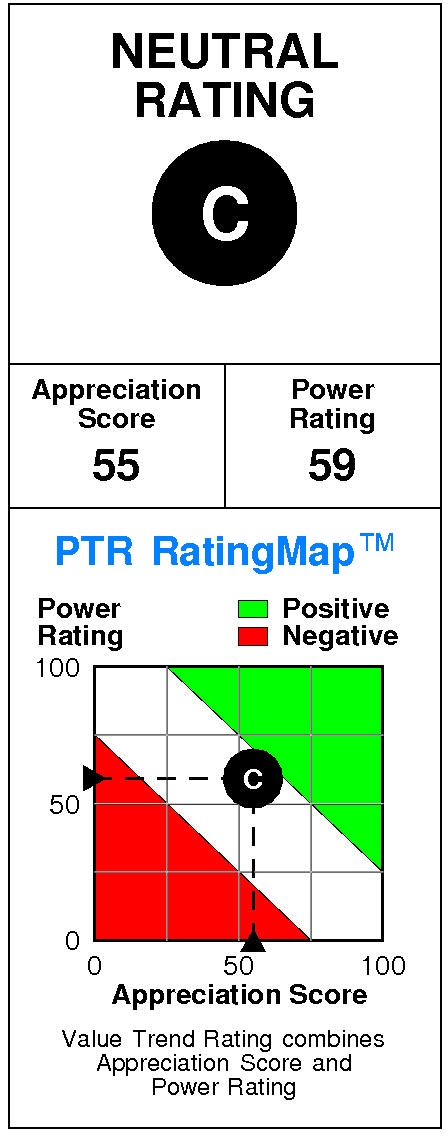
Sonoco Products has a current Value Trend Rating of C (Neutral).
With this rating, PTR's two proprietary measures of a stock's current attractiveness are providing highly consistent signals. Sonoco Products has a neutral Appreciation Score of 55 and a neutral Power Rating of 59, triggering the Neutral Value Trend Rating.
Sonoco Products' stock is selling well below targeted value.
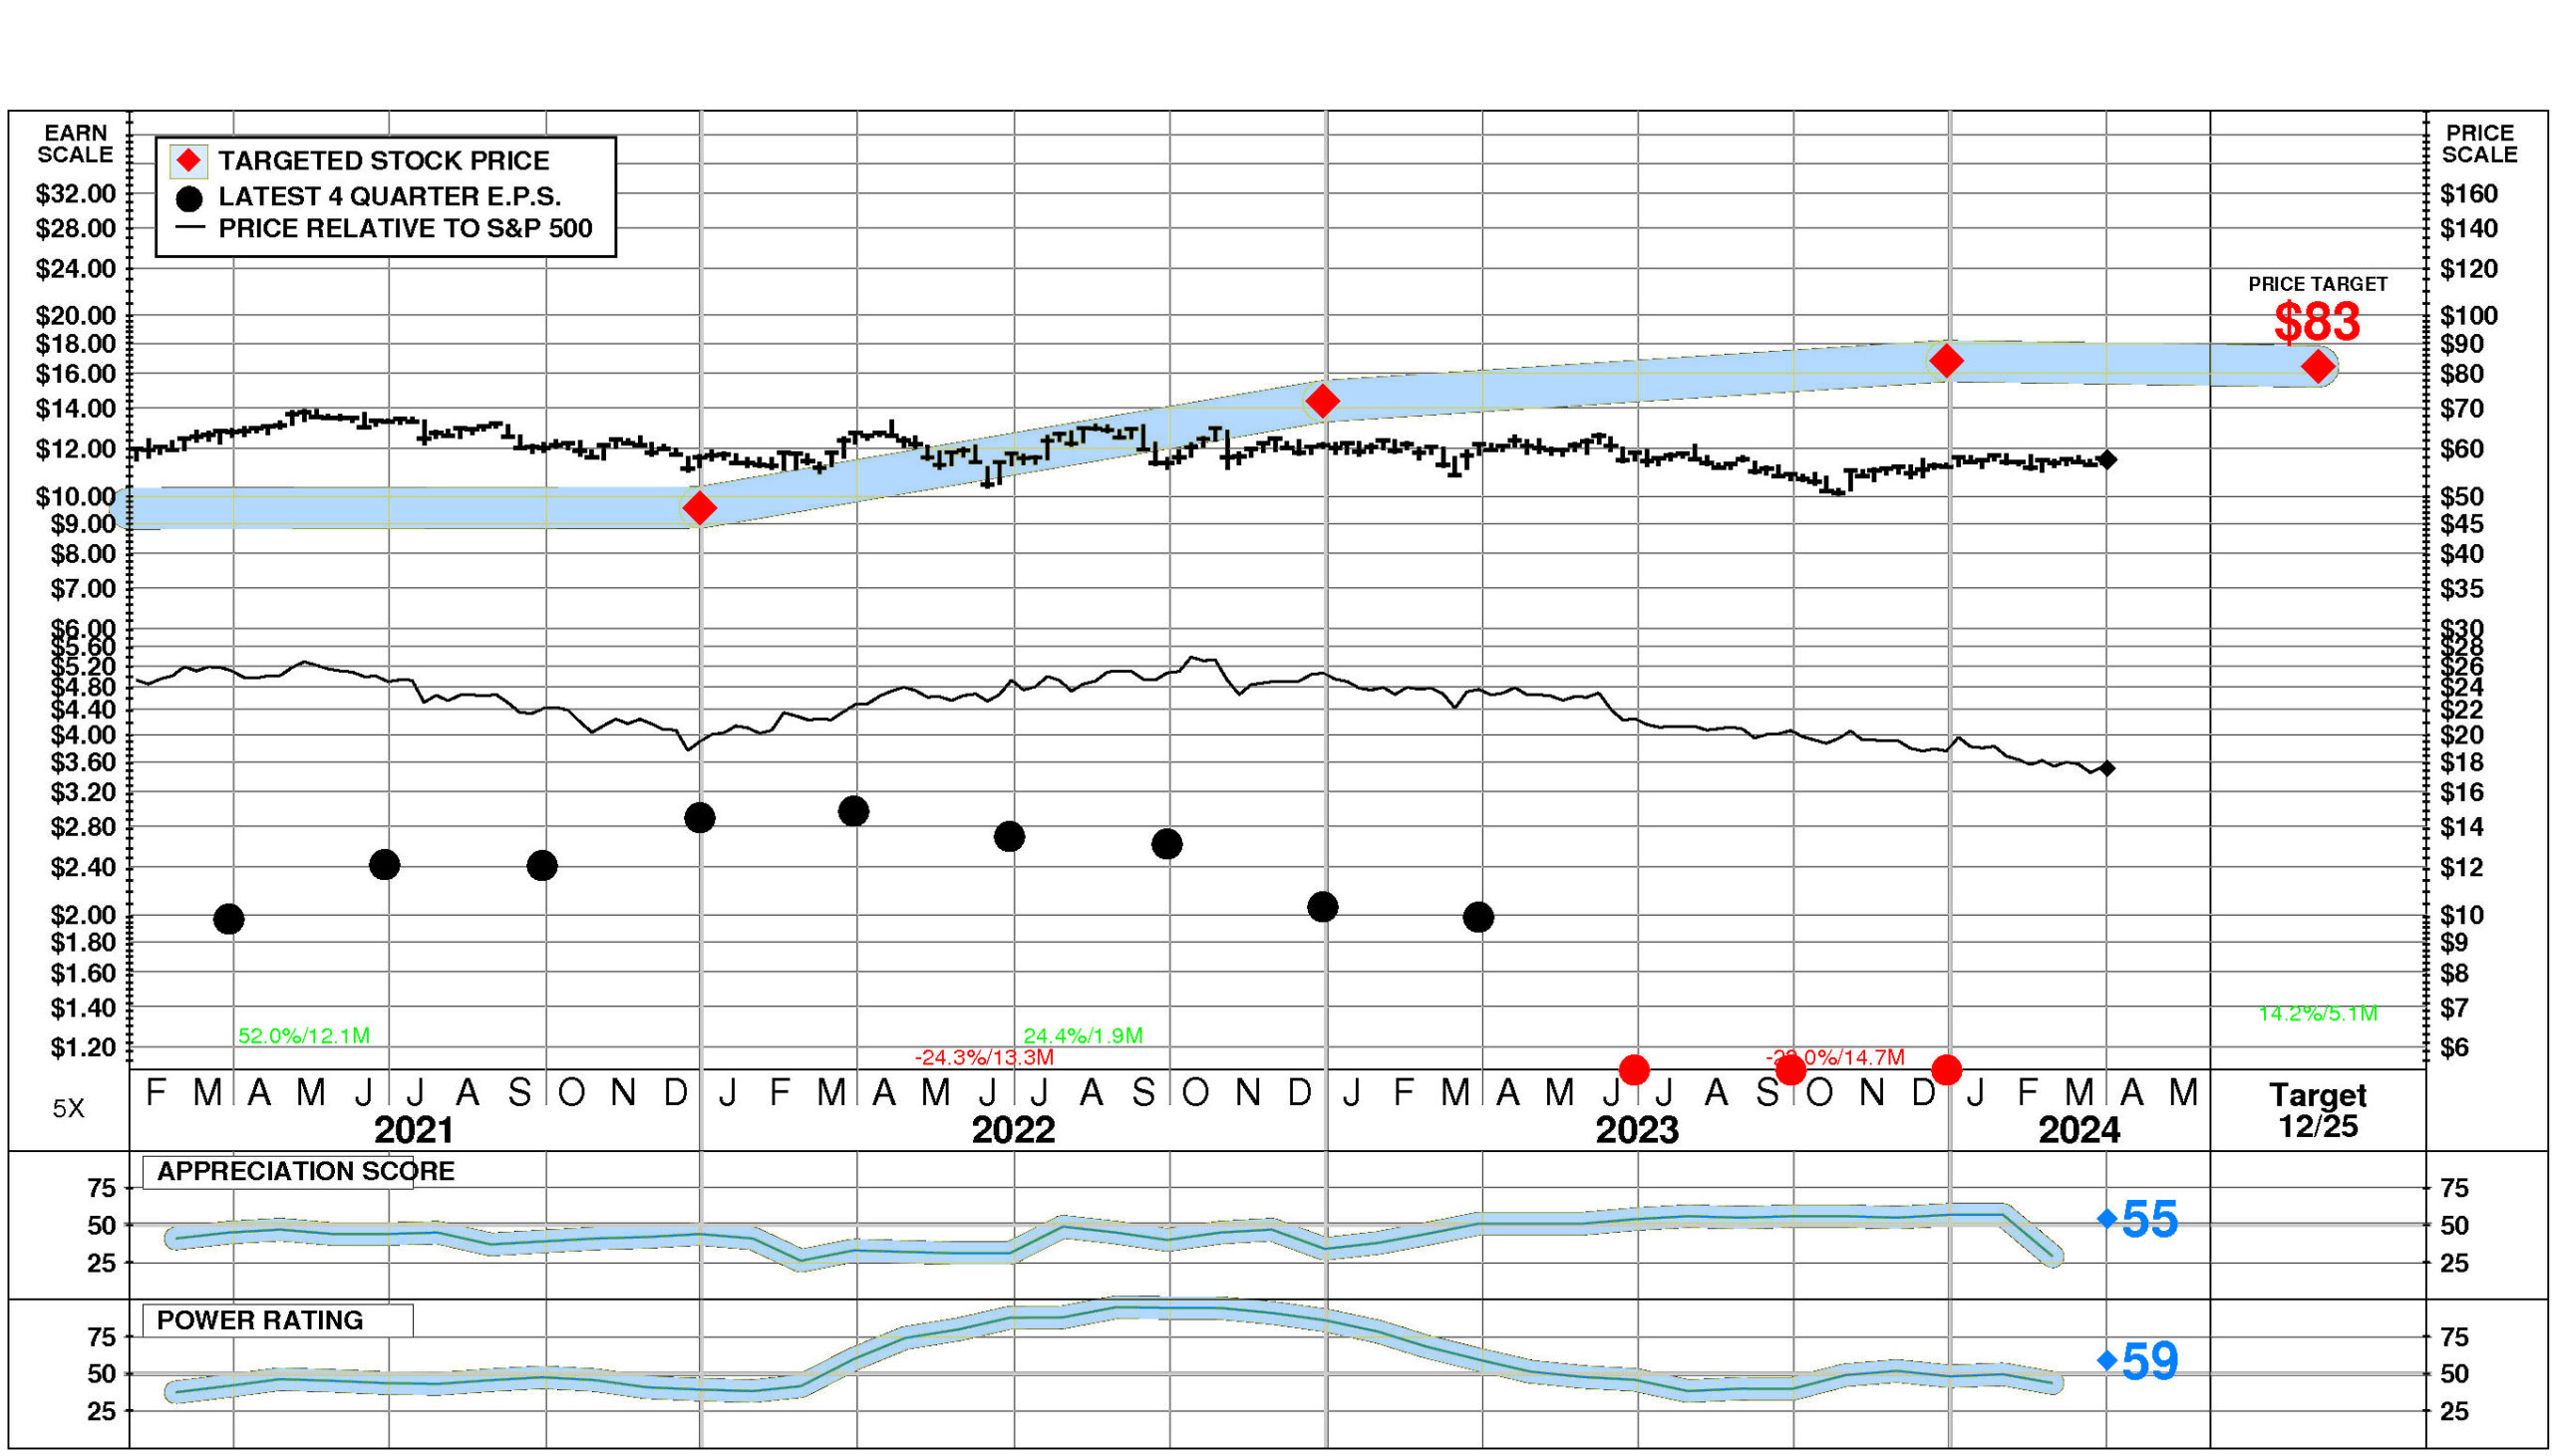
The current stock price of $57.60 compares to targeted value 12 months forward of $82.
This neutral appreciation potential results in an appreciation score of 55 (45% of the universe has greater appreciation potential.)
Sonoco Products has a Power Rating of 59.
(This neutral Power Rating indicates that SON's chances of enjoying attractive investment performance over the near to intermediate term are only average.)
Contributing to this neutral Power Rating: the Paperboard Containers, Boxes comparison group is in an extremely strong phase currently. Offsetting factors are recent price action has been neutral; and earnings estimate behavior for SON has been slightly negative recently.
INVESTMENT PROFILE
SON's financial strength is average. Financial strength rating is 50.
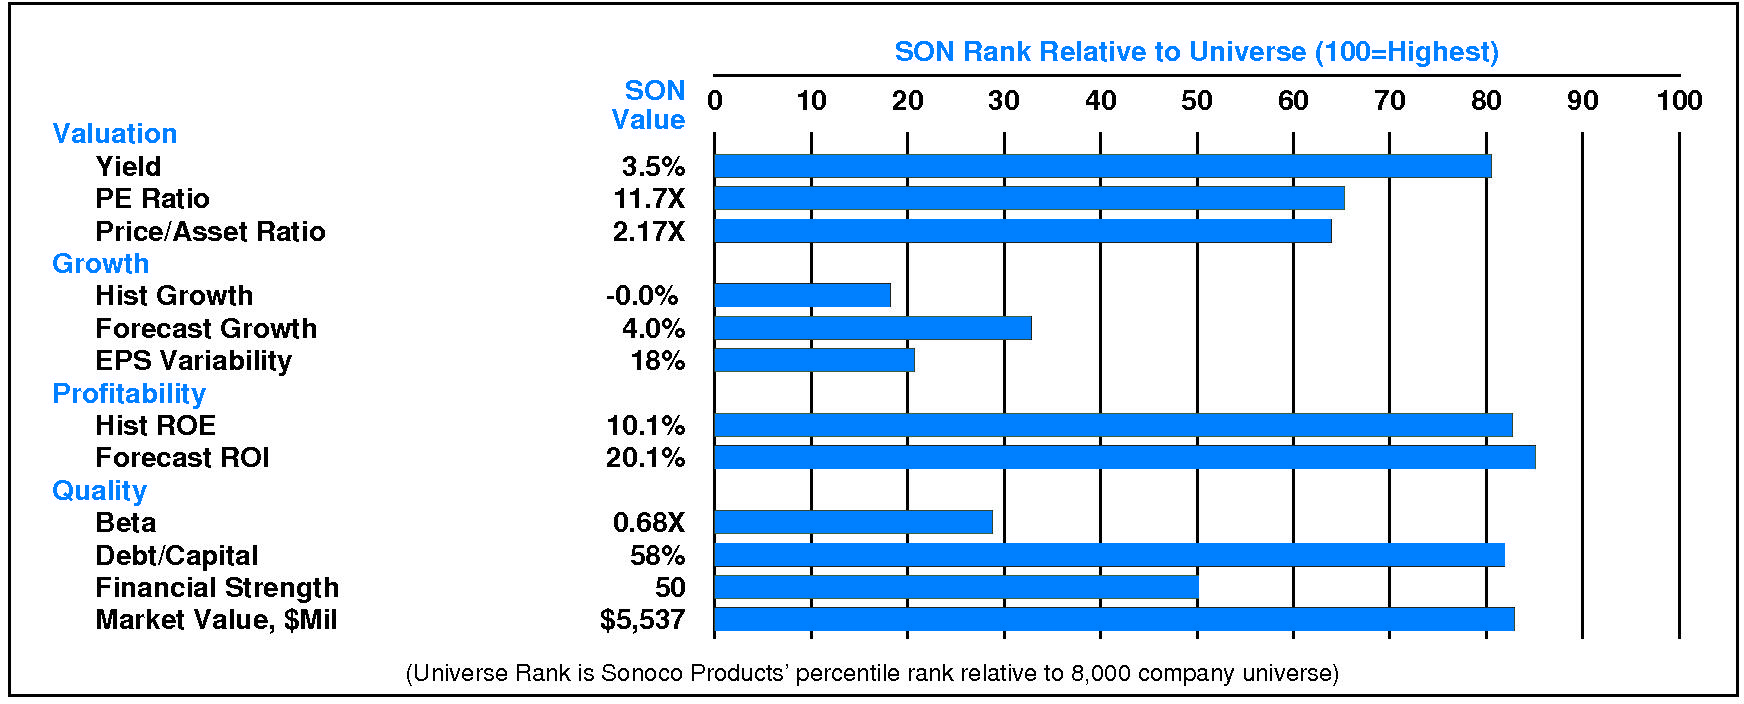
Relative to the S&P 500 Composite, Sonoco Products Co has moderate Value characteristics; its appeal is likely to be to Income-oriented investors; the perception is that SON is normal risk.
Relative weaknesses include: low financial strength, high financial leverage, low expected growth, and low historical growth. SON's valuation is low: high dividend yield, low P/E ratio, and moderate price/book ratio. SON has unusually low market capitalization.
CURRENT SIGNALS
Sonoco Products' current operations are eroding.
Return on equity is falling, reflecting: and falling asset utilization.
Sonoco Products' current technical position is very weak.
The stock price is in a 14.7 month down move. The stock has declined 18.0% from its prior high. The stock price is below its 200 day moving average which is in a downtrend.
ALERTS
Sonoco Products Co (NYSE: SON). Significant positive changes in investment behavior have recently occurred: its shorter term price trend turned up.
Sonoco Products Co (NYSE: SON). Minimal negative changes in fundamentals have recently occurred: significant quarterly earnings deceleration occurred.
The stock is currently rated C.
Sonoco Products Co (NYSE: SON) stock closed at $57.60 on 4/1/24 after a slight decline of -0.4%. NORMAL trading volume accompanied the decline. The stock has risen 0.6% during the last week and has performed in line with the market over the last nine months.
CASH FLOW
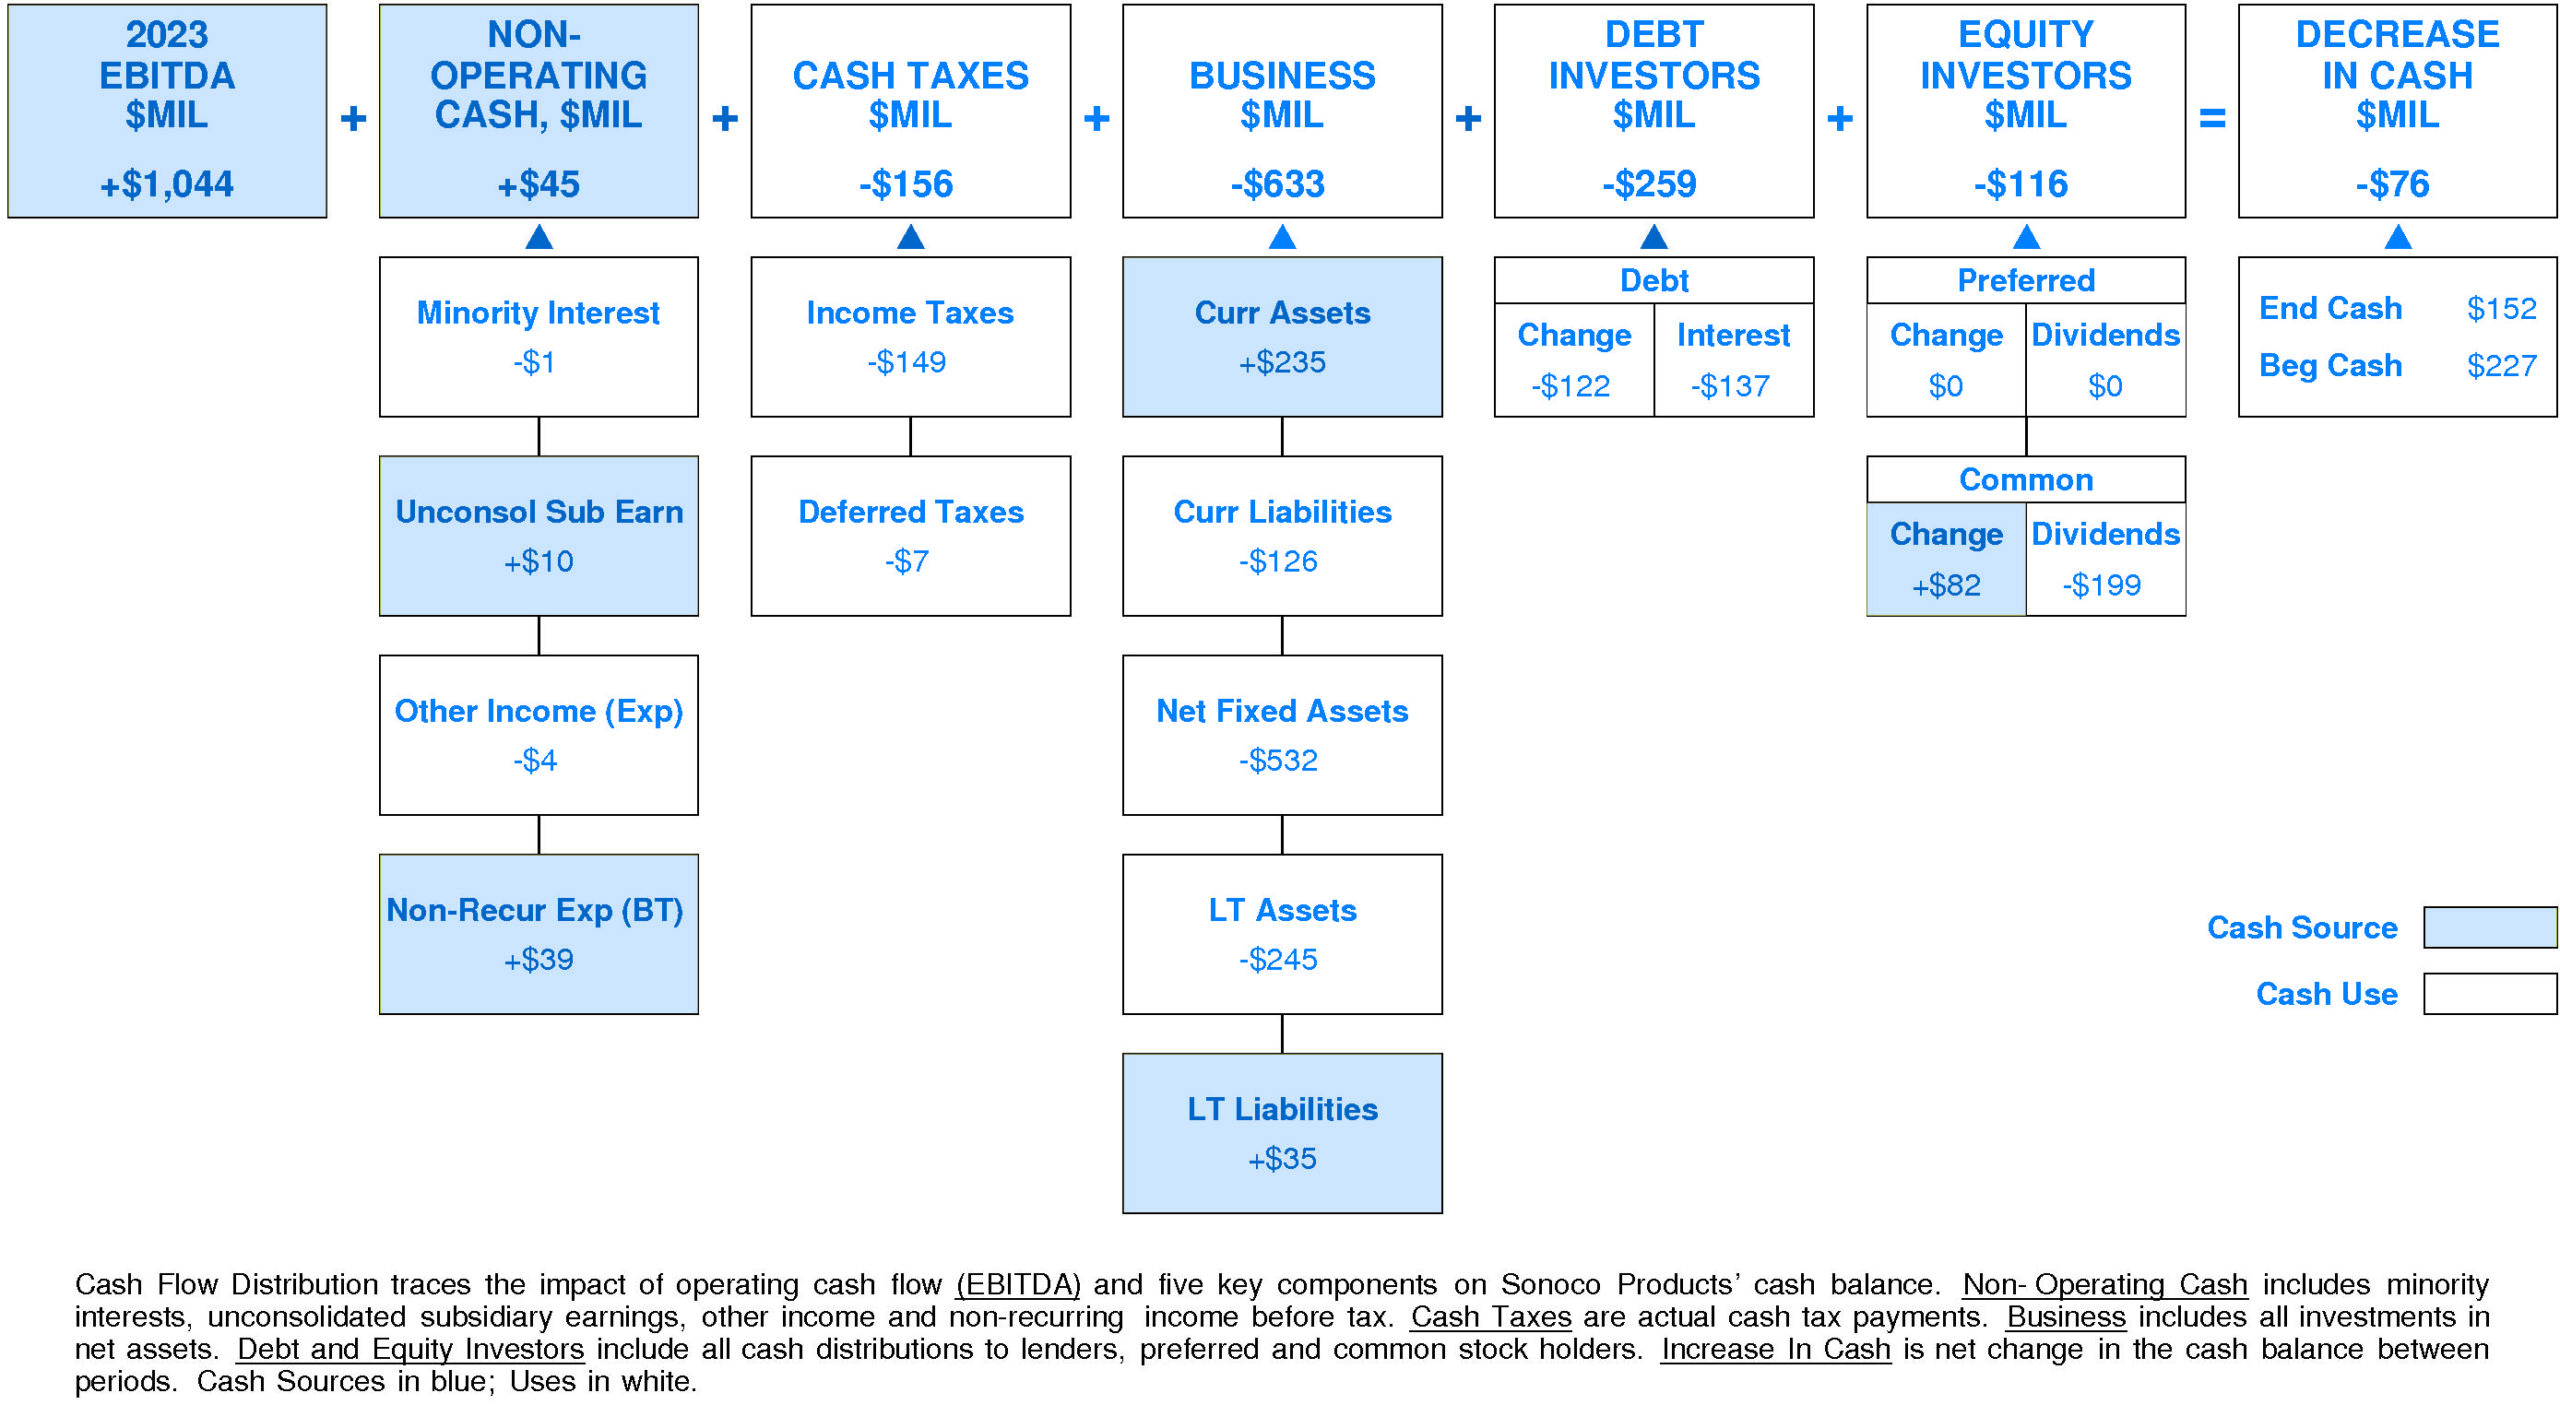
In 2023, Sonoco Products experienced a very significant reduction in cash of -$76 million (-33%). Sources of cash were much lower than uses.
Cash generated from 2023 EBITDA totaled +$1,044 million. Non-operating sources contributed +$45 million (+4% of EBITDA). Cash taxes consumed -$156 million (-15% of EBITDA). Re-investment in the business amounted to -$633 million (-61% of EBITDA). On a net basis, debt investors removed -$259 million (-25% of EBITDA) while equity investors received -$116 million (-11% of EBITDA).
Sonoco Products' Non-operating Income, %EBITDA has suffered a volatile overall downtrend over the period.
This downtrend was accompanied by stability for the Sonoco Products Peer Group. (Since 2021 Non-operating Income, %EBITDA has experienced a very sharp recovery.) In most years, Sonoco Products was in the third quartile and top quartile. Currently, Sonoco Products is upper quartile at +4% of EBITDA (+$45 million).
Sonoco Products' Cash Taxes, %EBITDA has exhibited a minor overall uptrend over the period.
This improvement was accompanied by a similar trend for the Sonoco Products Peer Group. (Since 2021 Cash Taxes, %EBITDA has experienced a very sharp decline.) In most years, Sonoco Products was in the top quartile and second quartile. Currently, Sonoco Products is above median at -15% of EBITDA (-$156 million).
Sonoco Products' Business Re-investment, %EBITDA has suffered a volatile overall downtrend over the period.
This downtrend was accompanied by a similar trend for the Sonoco Products Peer Group. In most years, Sonoco Products was in the second quartile and lower quartile. Currently, Sonoco Products is lower quartile at -61% of EBITDA (-$633 million).
Sonoco Products' Debt Investors, %EBITDA has experienced a volatile overall uptrend over the period.
This improvement was accompanied by an opposite trend for the Sonoco Products Peer Group. In most years, Sonoco Products was in the third quartile and second quartile. Currently, Sonoco Products is slightly above median at -25% of EBITDA (-$259 million).
Sonoco Products' Equity Investors, %EBITDA has enjoyed a very strong overall uptrend over the period.
This improvement was accompanied by a similar trend for the Sonoco Products Peer Group. In most years, Sonoco Products was in the second quartile and top quartile. Currently, Sonoco Products is above median at -11% of EBITDA (-$116 million).
Sonoco Products' Change in Cash, %EBITDA has experienced a downtrend over the period.
This downtrend was accompanied by stability for the Sonoco Products Peer Group. In most years, Sonoco Products was in the second quartile and lower quartile. Currently, Sonoco Products is lower quartile at -7% of EBITDA (-$76 million).
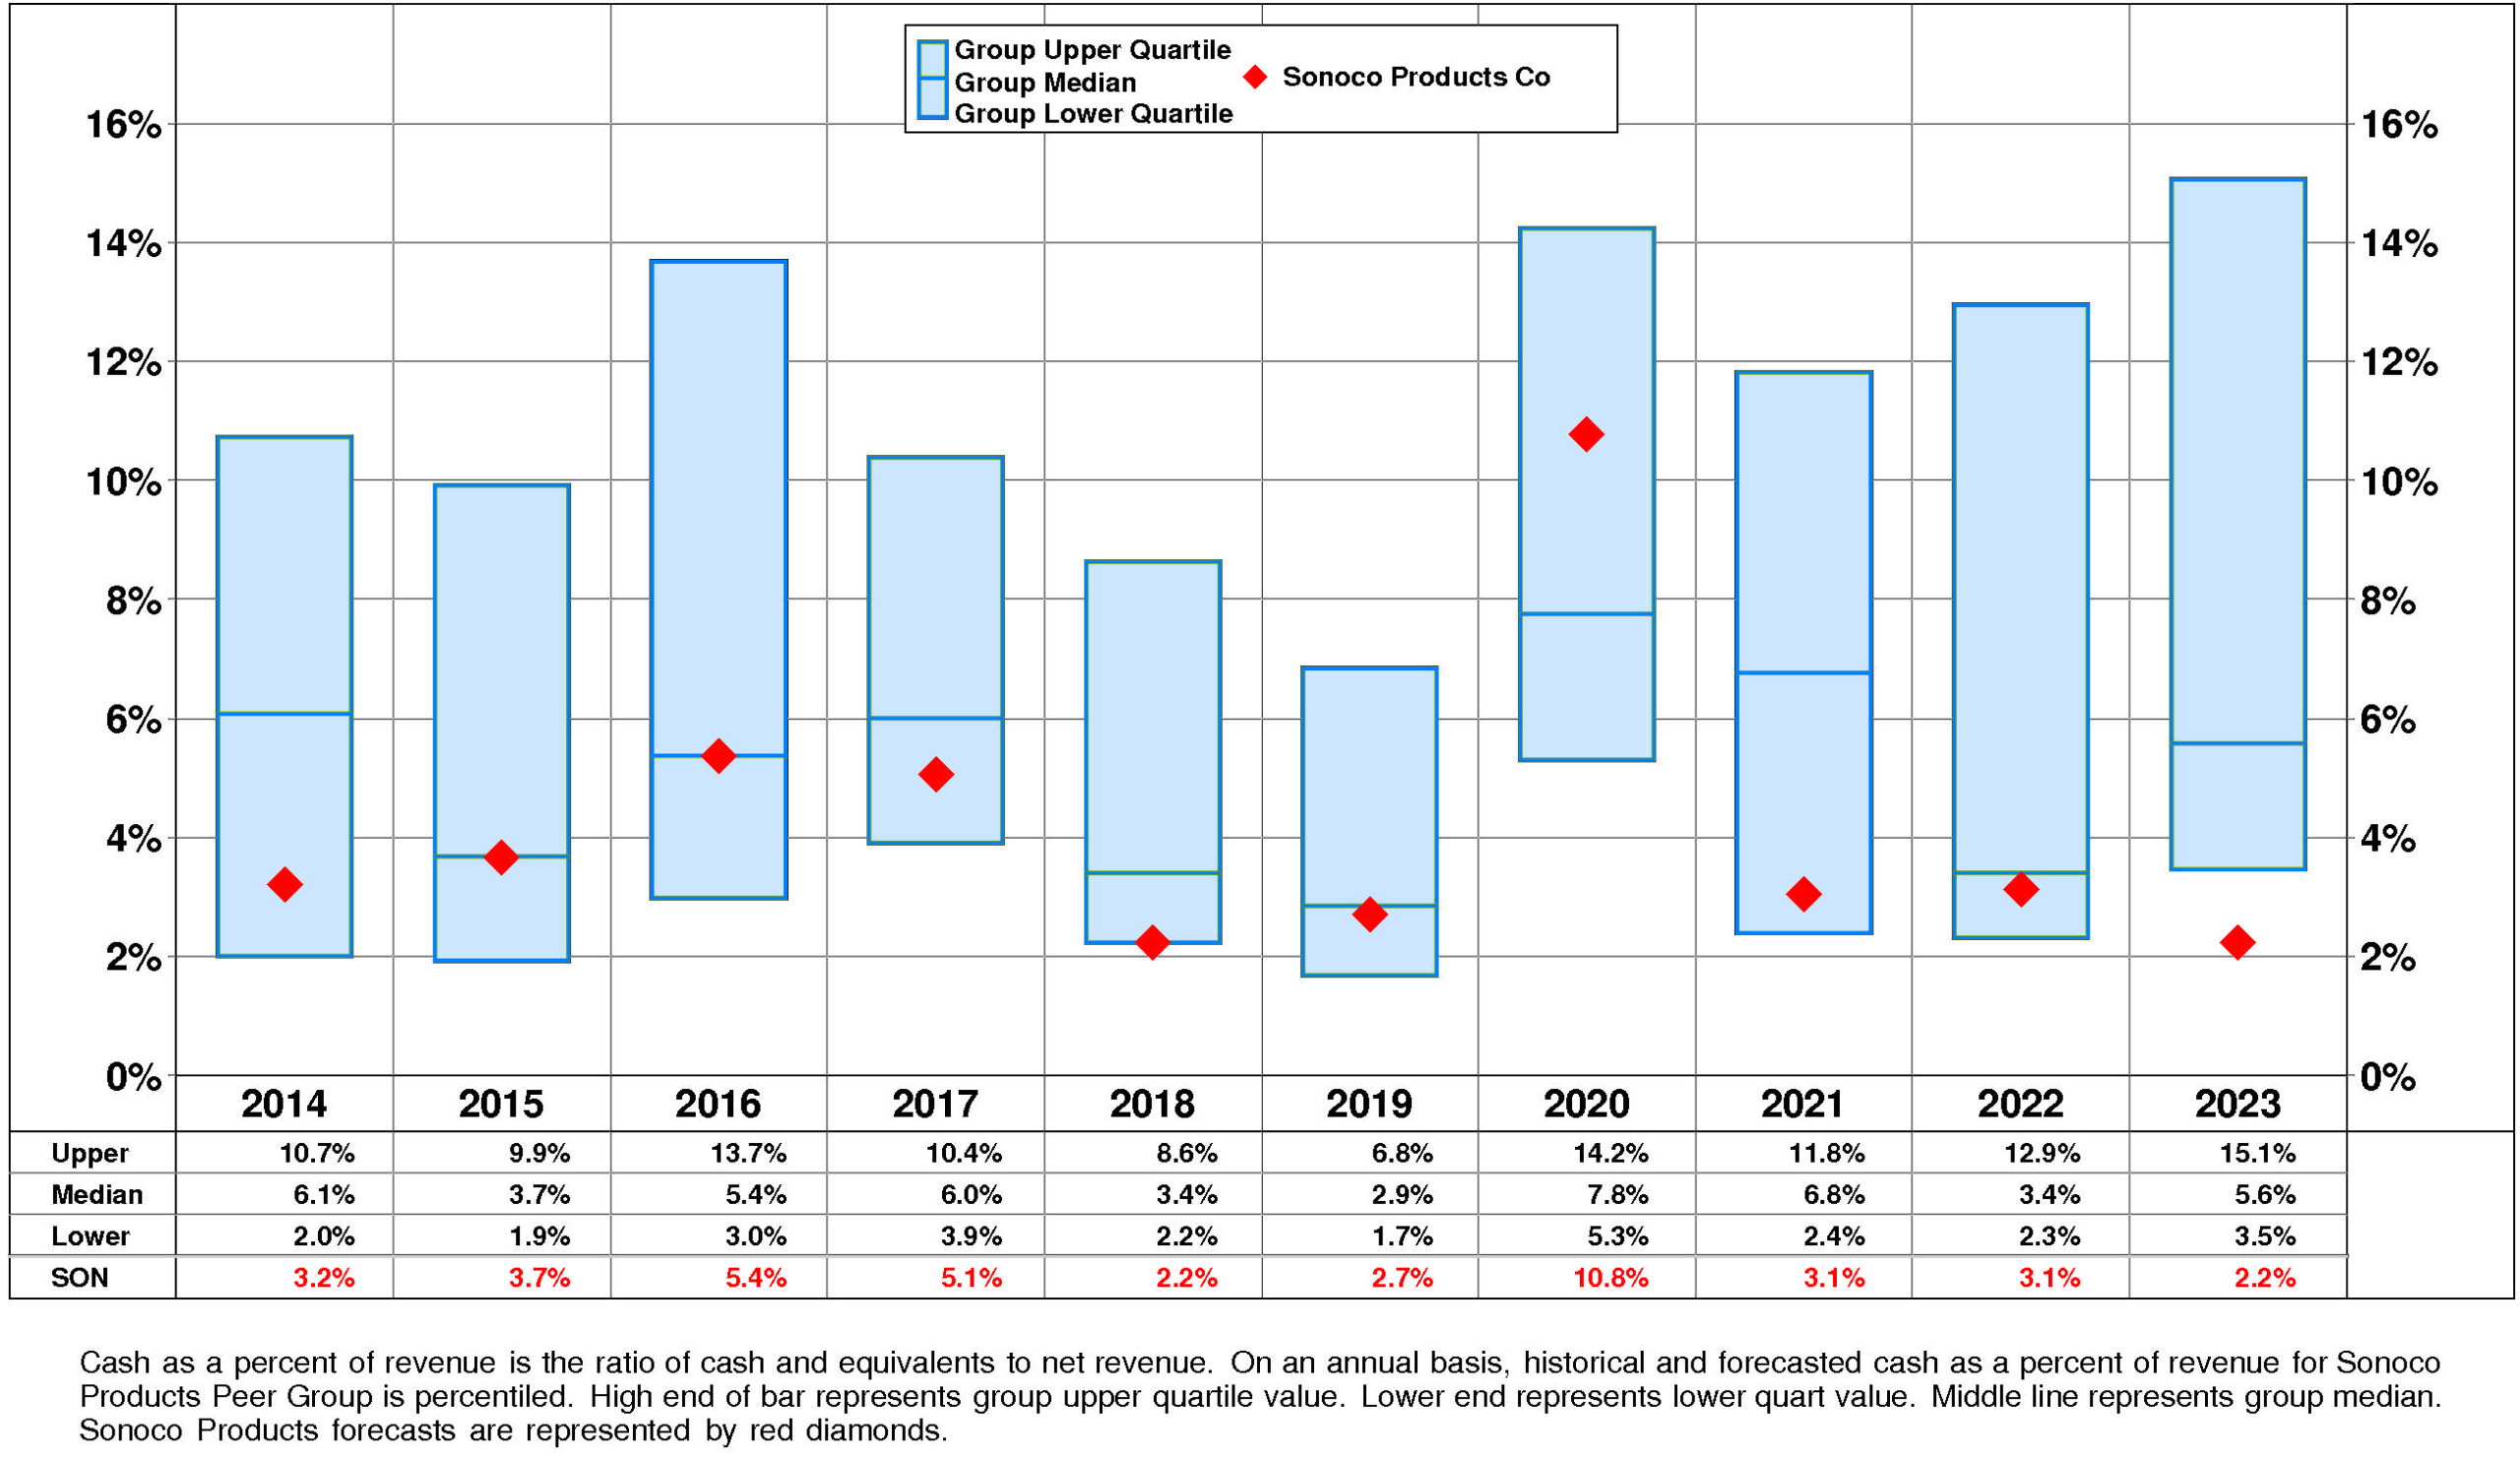
Sonoco Products' Cash, %Revenue has exhibited little to no overall change over the period.
This stability was accompanied by stability for the Sonoco Products Peer Group as well. In most years, Sonoco Products was in the third quartile and second quartile. Currently, Sonoco Products is lower quartile at +2%.
PROFITABILITY
Sonoco Products' return on equity has eroded very significantly since 2014. The current level is 19.6% versus the high of 15.2% and the low of -4.7%.
This very significant erosion was due to very strong negative trend in pretax operating return and small positive trend in non-operating factors.
The productivity of Sonoco Products' assets declined over the full period 2014-2023: asset turnover has suffered a strong overall downtrend.
Reinforcing this trend, pretax margin experienced a strong overall downtrend but it experienced a very sharp recovery after the 2021 low.
Non-operating factors (income taxes and financial leverage) had a minor positive influence on return on equity.
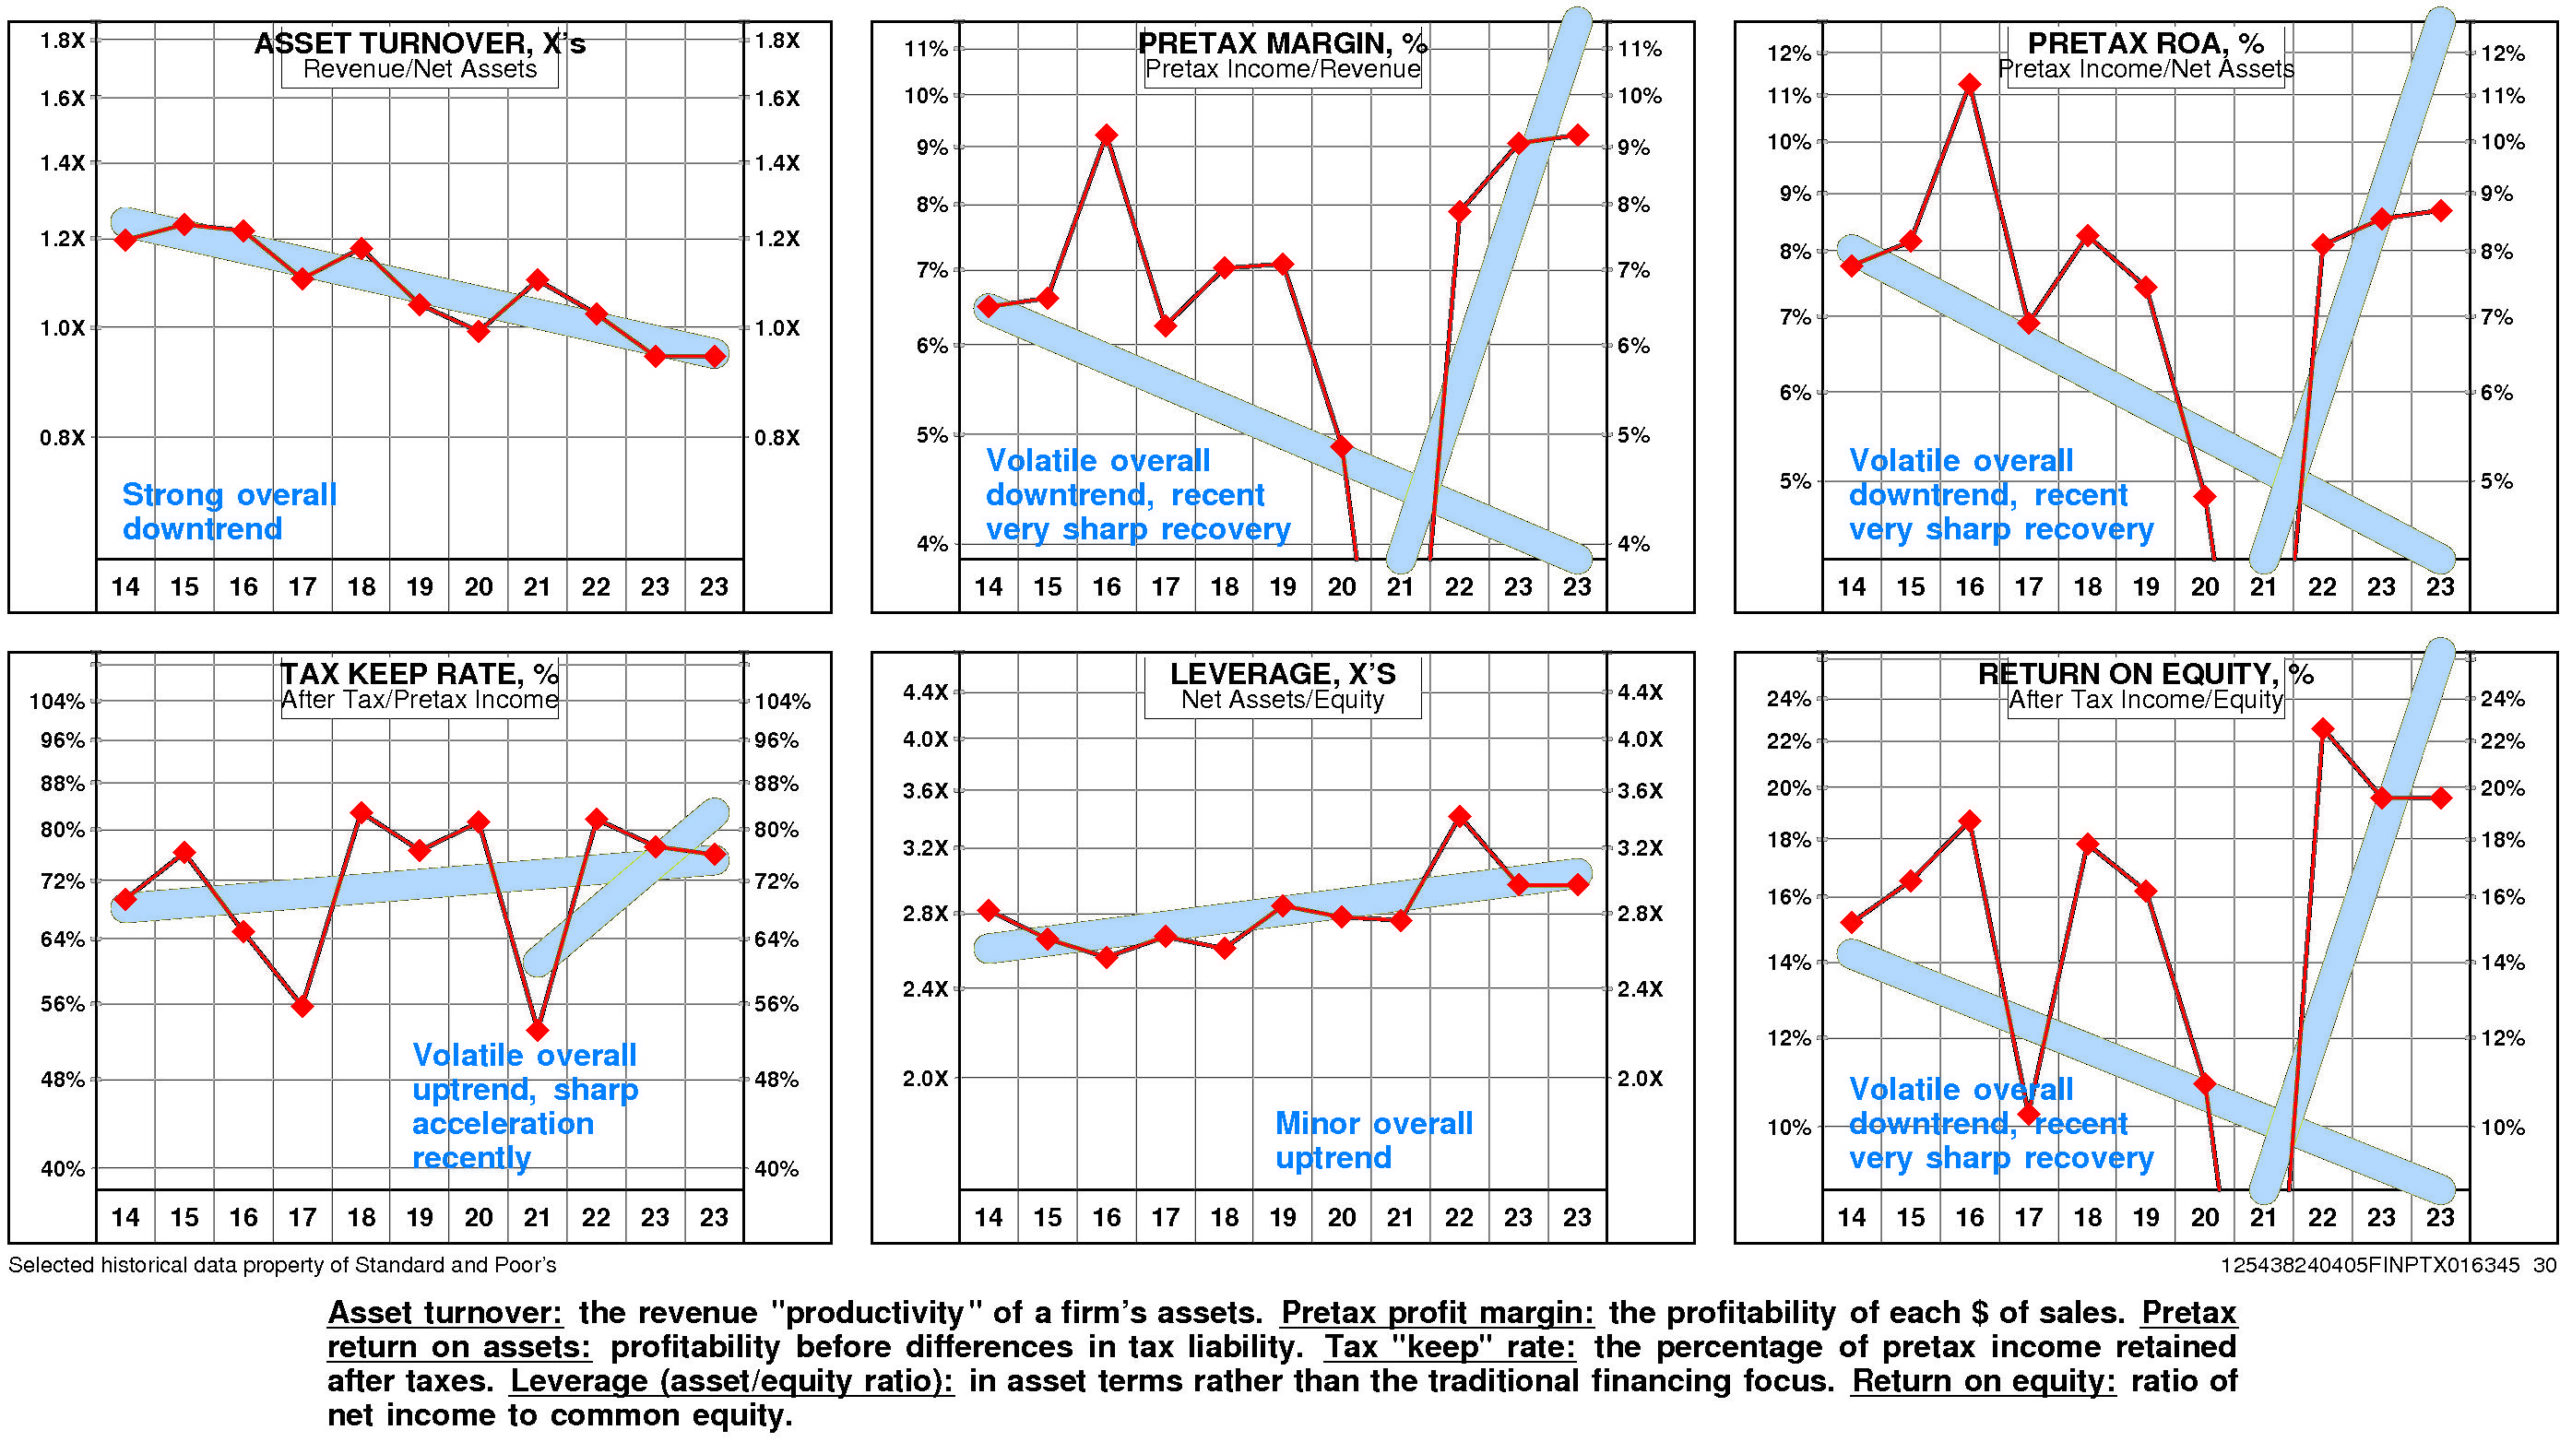
Sonoco Products' return on equity is substantially above median (19.6%) for the four quarters ended December, 2023.
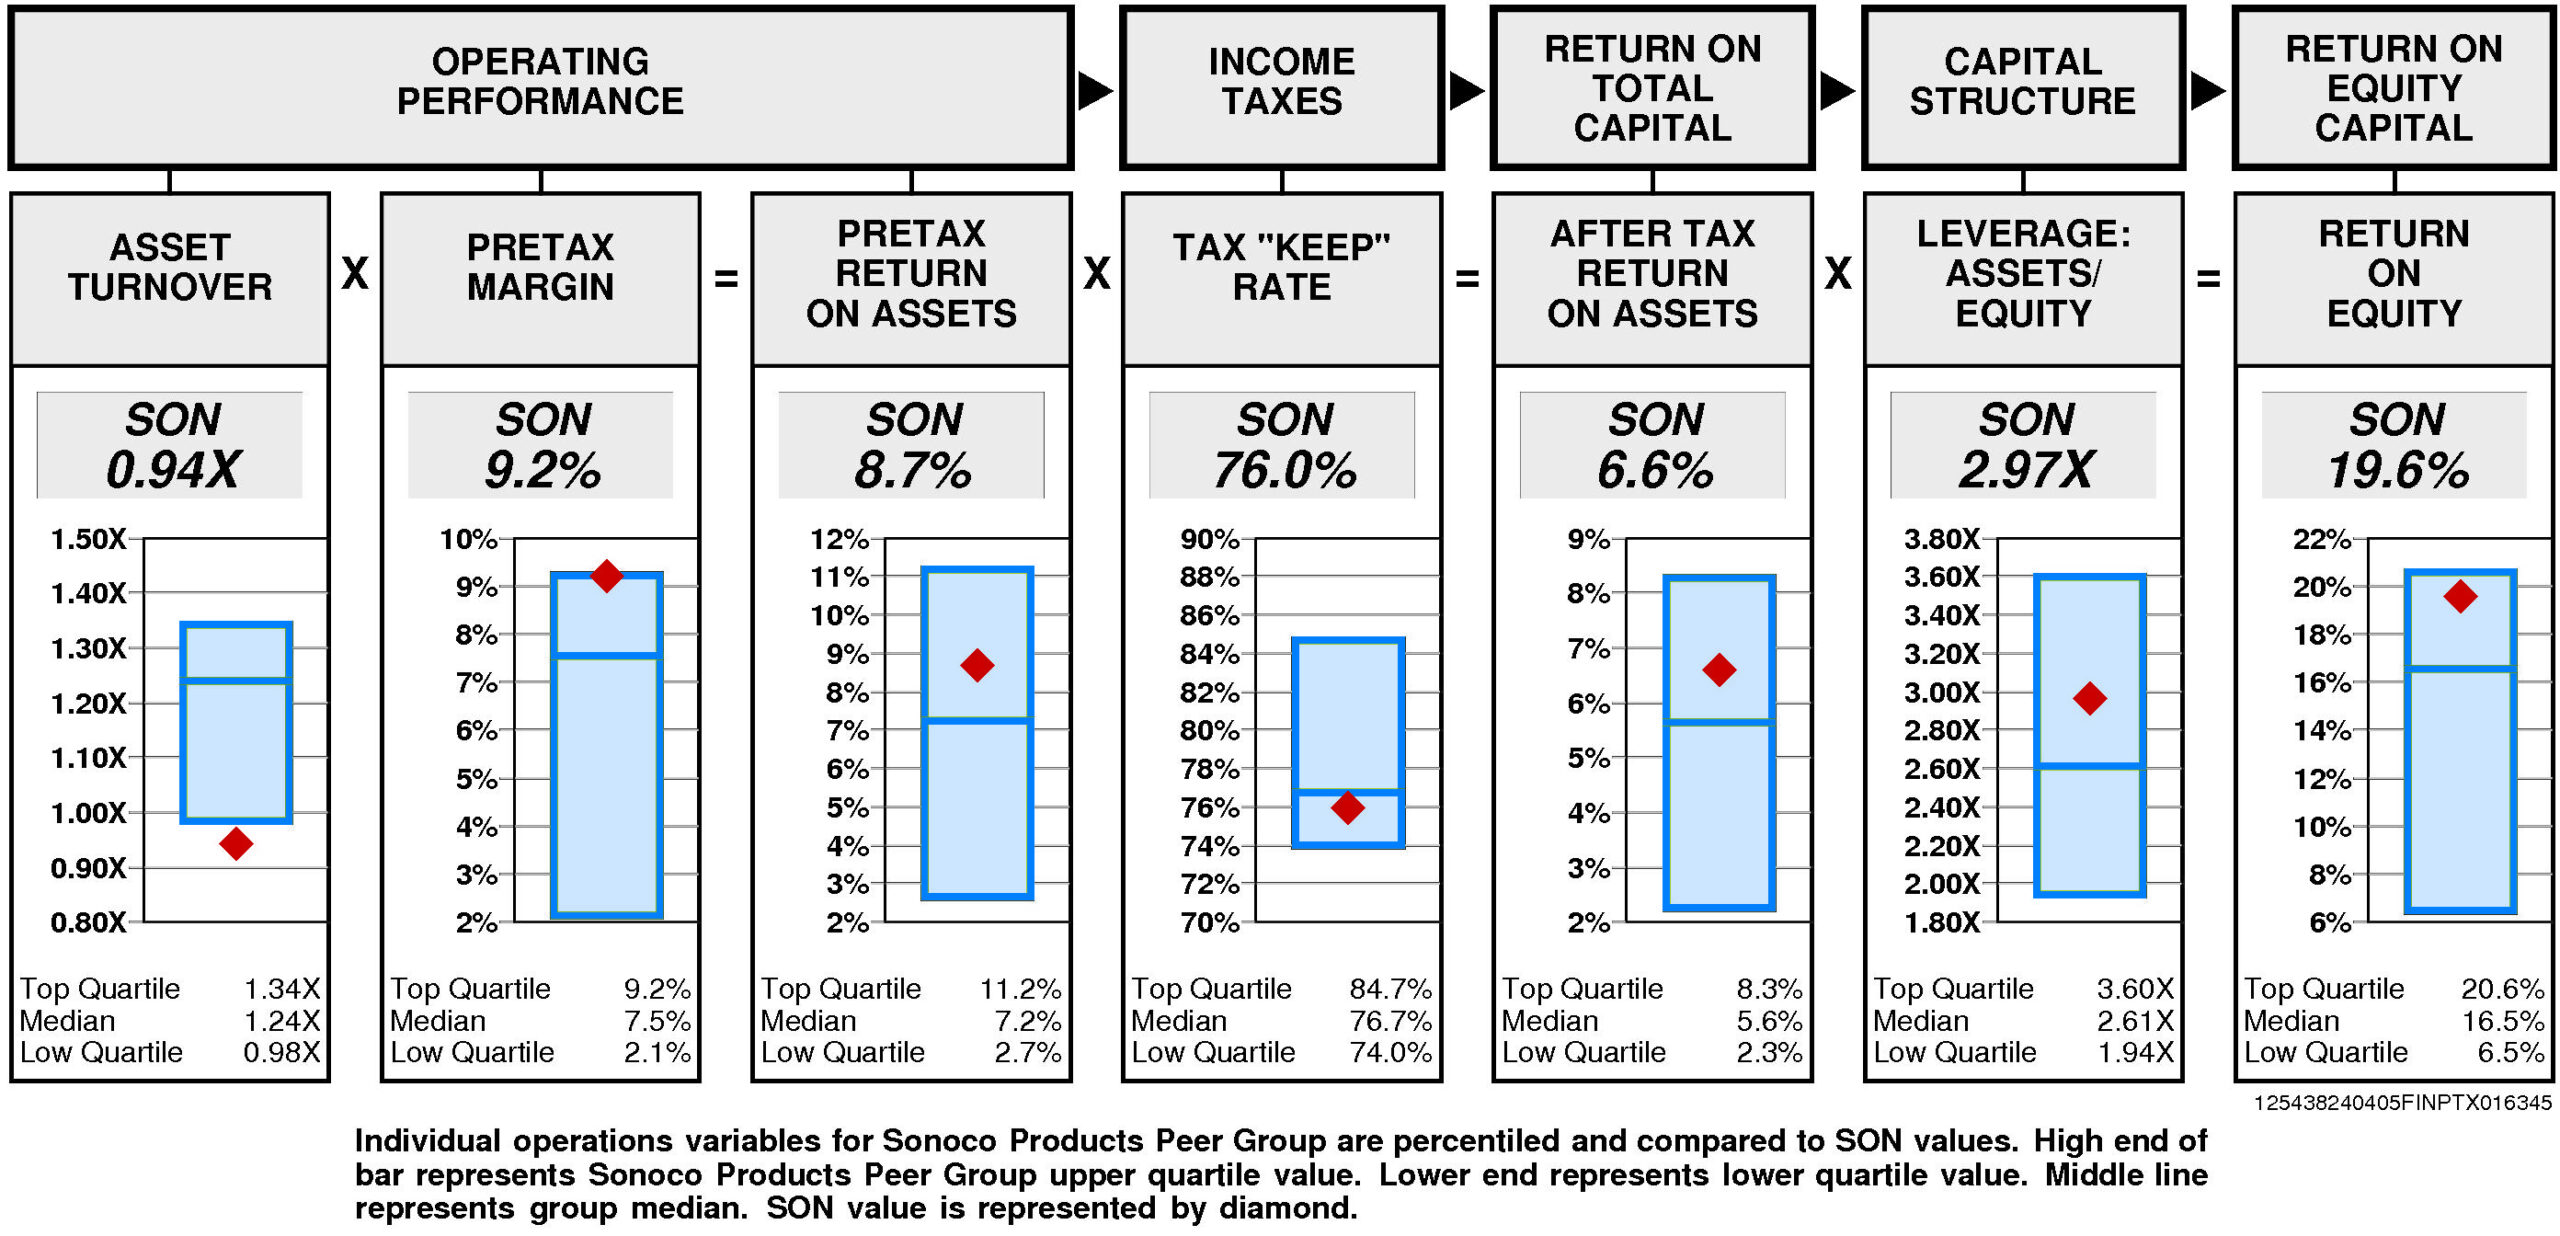
Operating performance (pretax return on assets) is above median (8.7%) reflecting asset turnover that is lower quartile (0.94X) and pretax margin at the upper quartile (9.2%).
Tax “keep” rate (income tax management) is at median (76.0%) resulting in after tax return on assets that is above median.
Financial leverage (leverage) is above median (2.97X).
GROWTH RATES
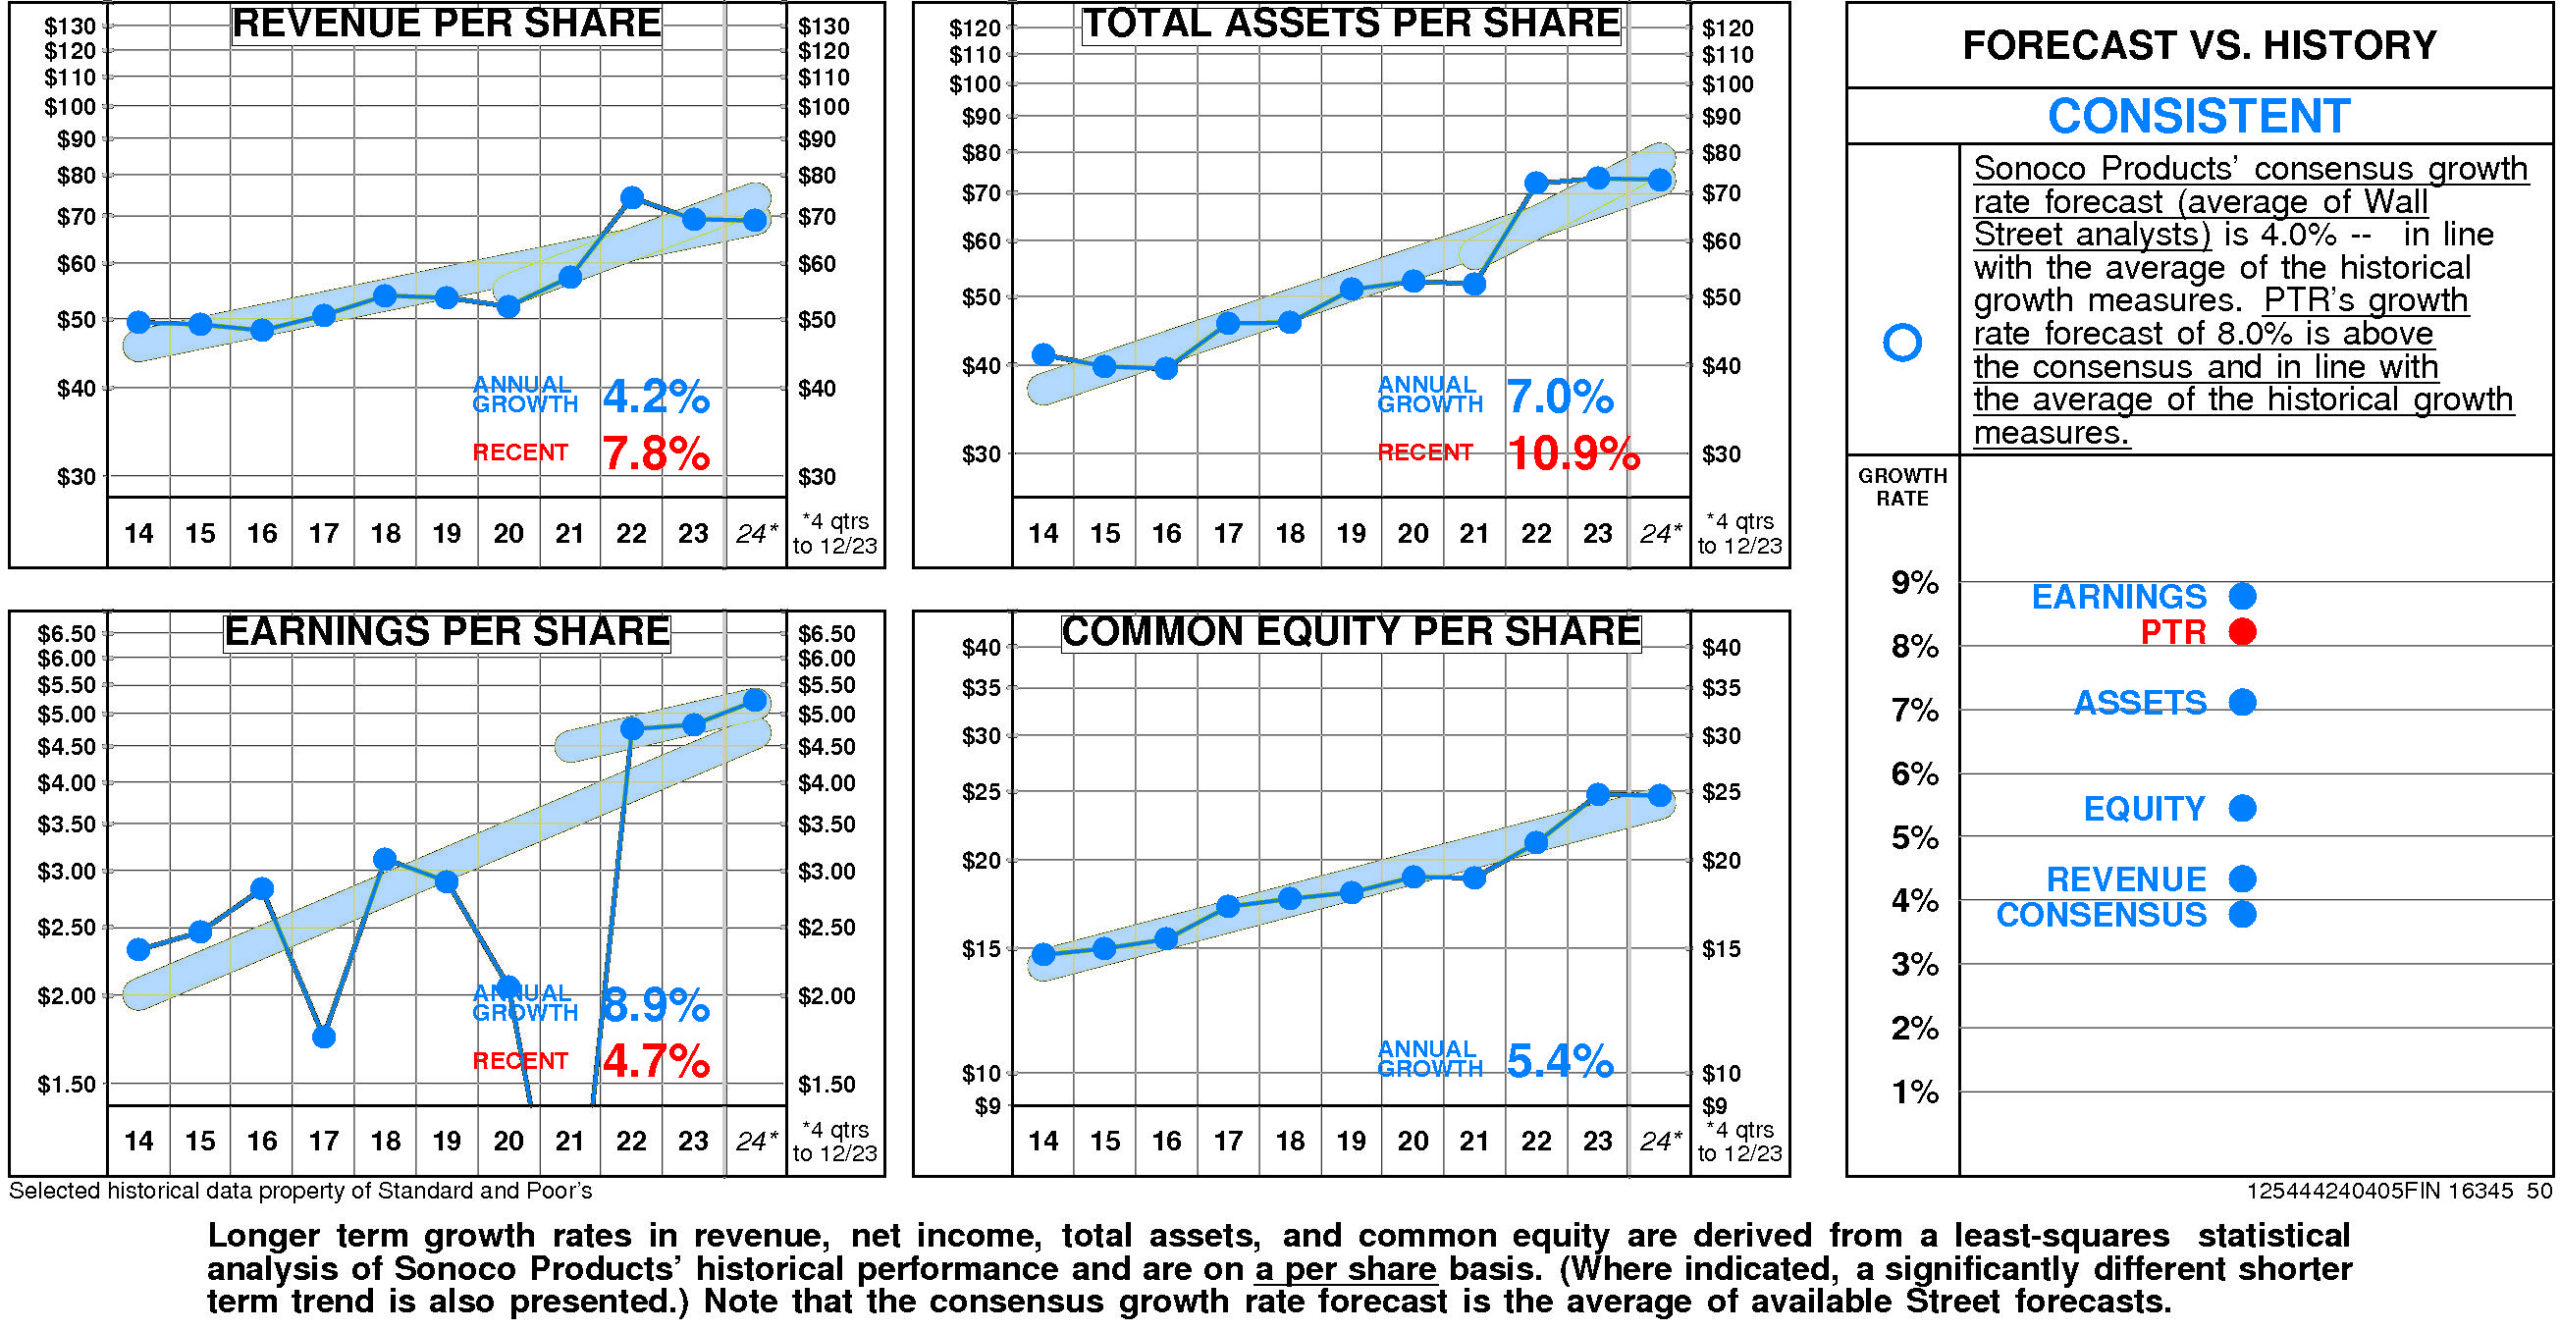
There are no significant differences between Sonoco Products' longer term growth and growth in recent years.
Sonoco Products' historical income statement growth has been in line with balance sheet growth. Revenue growth has paralleled asset growth; earnings growth has paralleled equity growth.
Annual revenue growth
has been 4.2% per year. (More recently it has been 7.8%.)
Total asset growth
has been 7.0% per year. (More recently it has been 10.9%.)
Annual E.P.S. growth
has been 8.9% per year. (More recently it has been 4.7%.)
Equity growth
has been 5.4% per year.
Sonoco Products' consensus growth rate forecast (average of Wall Street analysts)
is 4.0% — in line with the average of the historical growth measures.
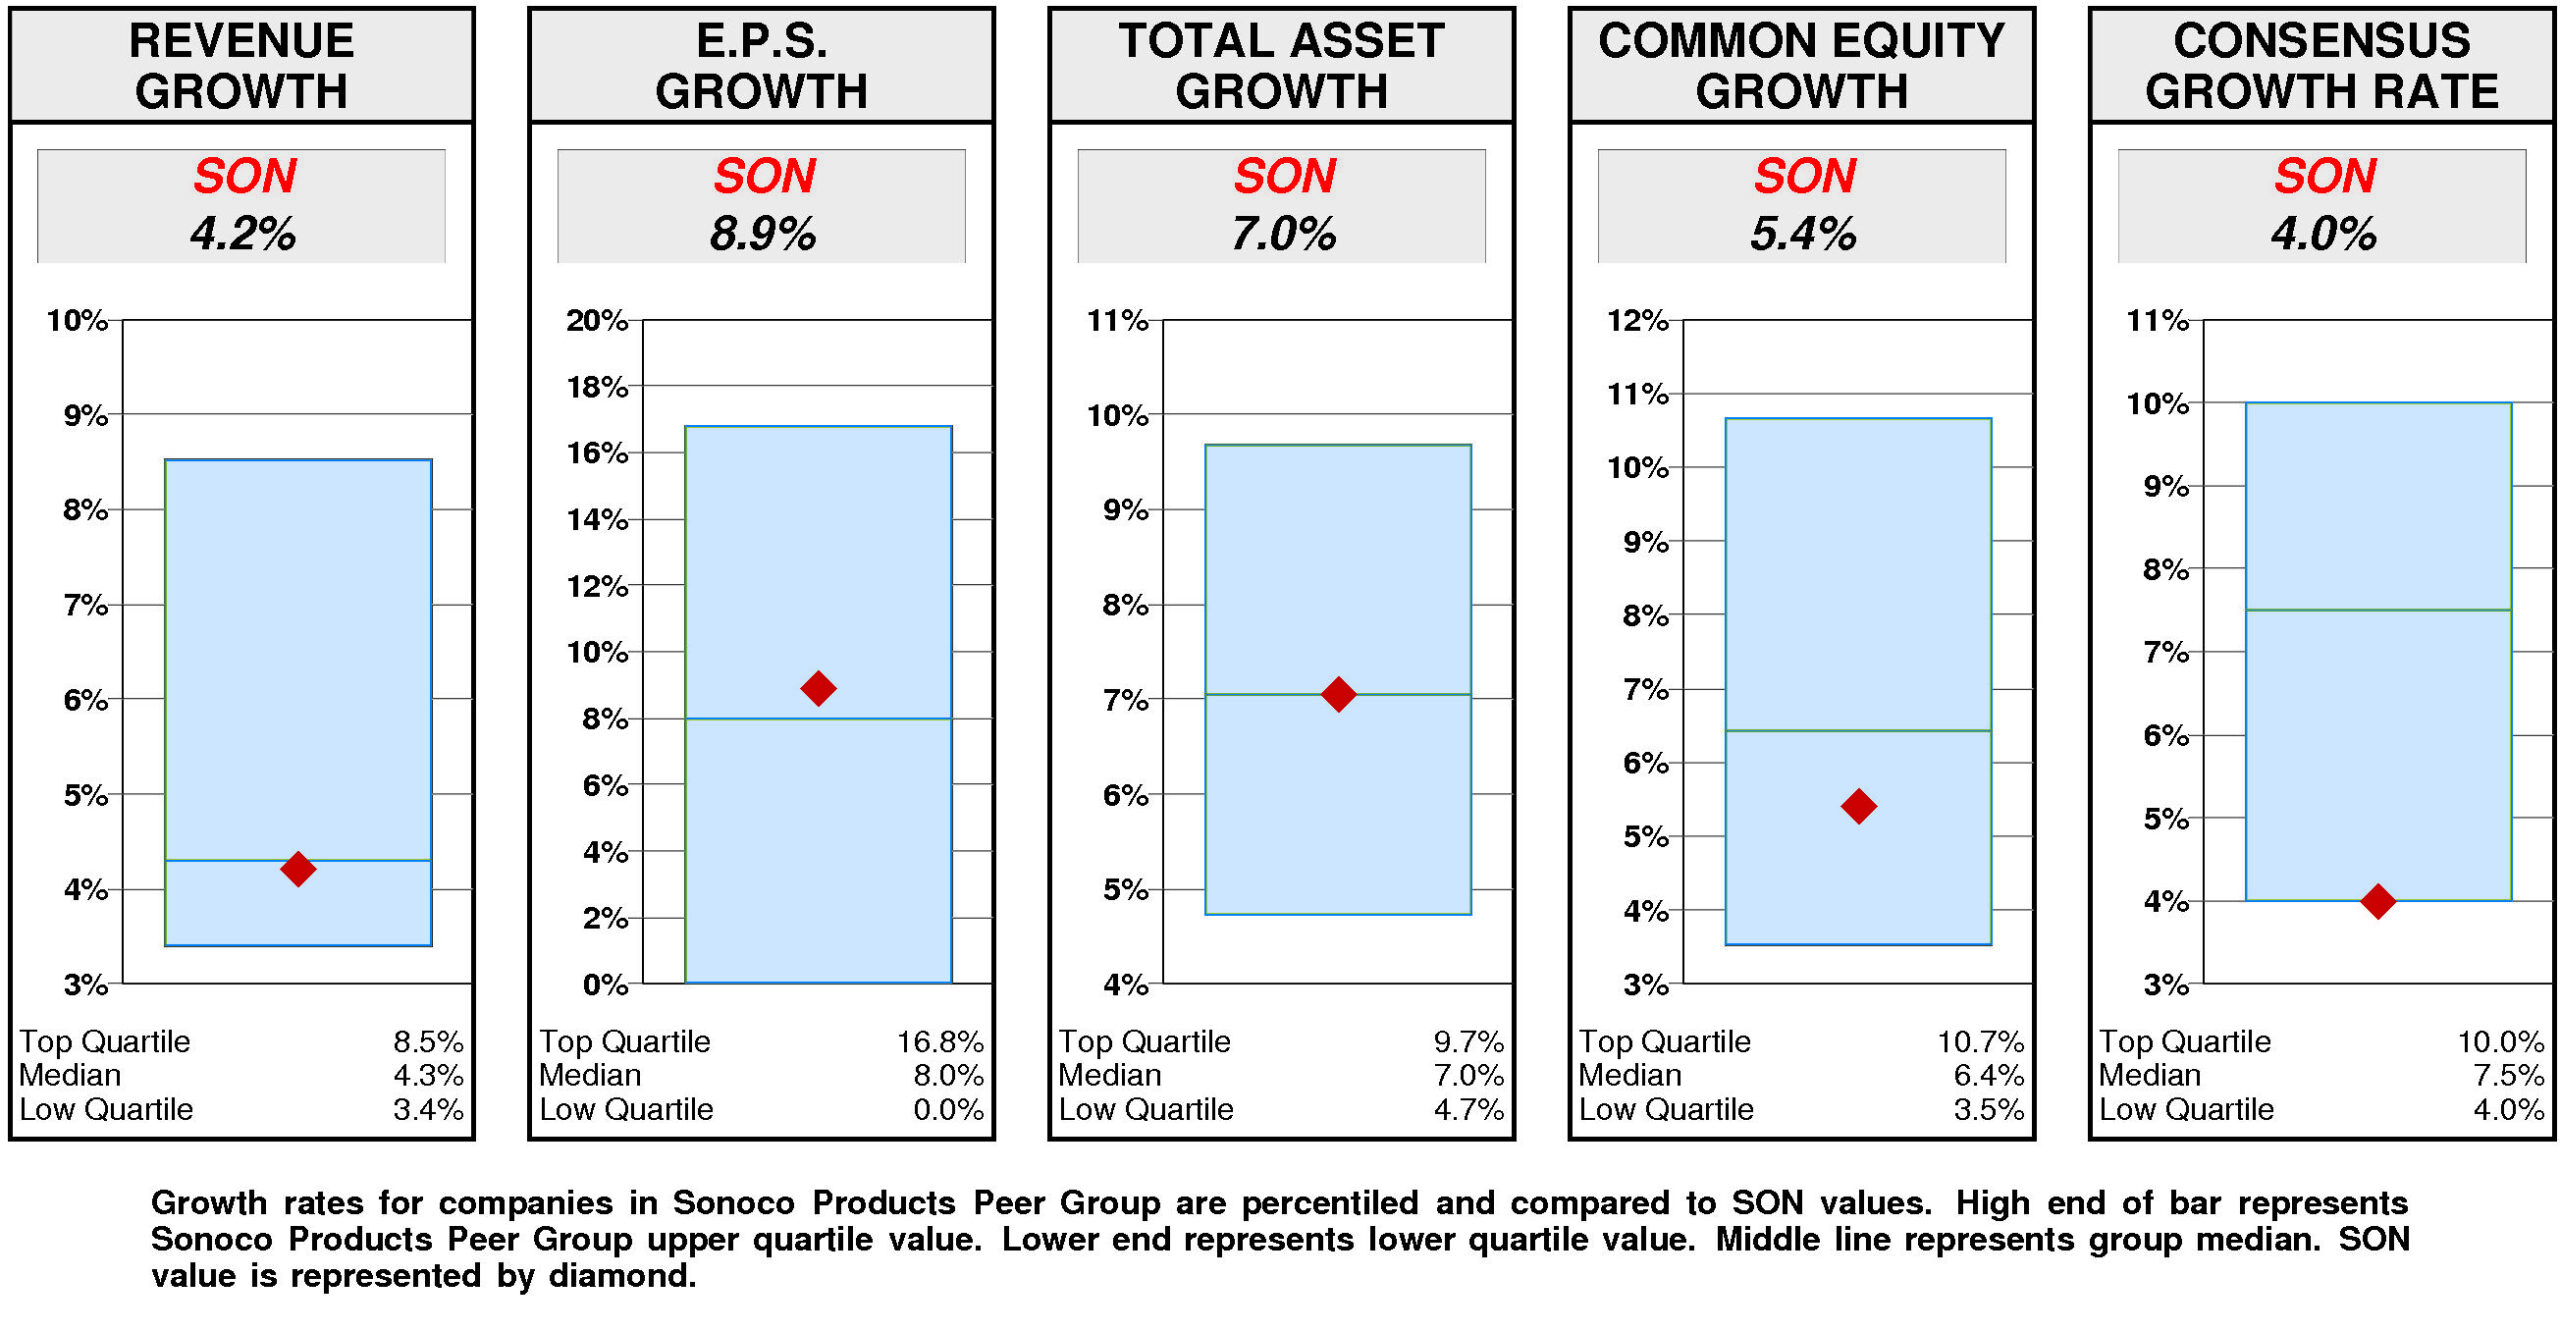
Relative to the Sonoco Products Peer Group, Sonoco Products' historical growth measures are erratic.
E.P.S. growth (8.9%) has been slightly above median. Total asset growth (7.0%) has been at median. Revenue growth (4.2%) has been slightly below median. Equity growth (5.4%) has been below median.
Consensus growth forecast (4.0%) is at the lower quartile.
PRICE HISTORY
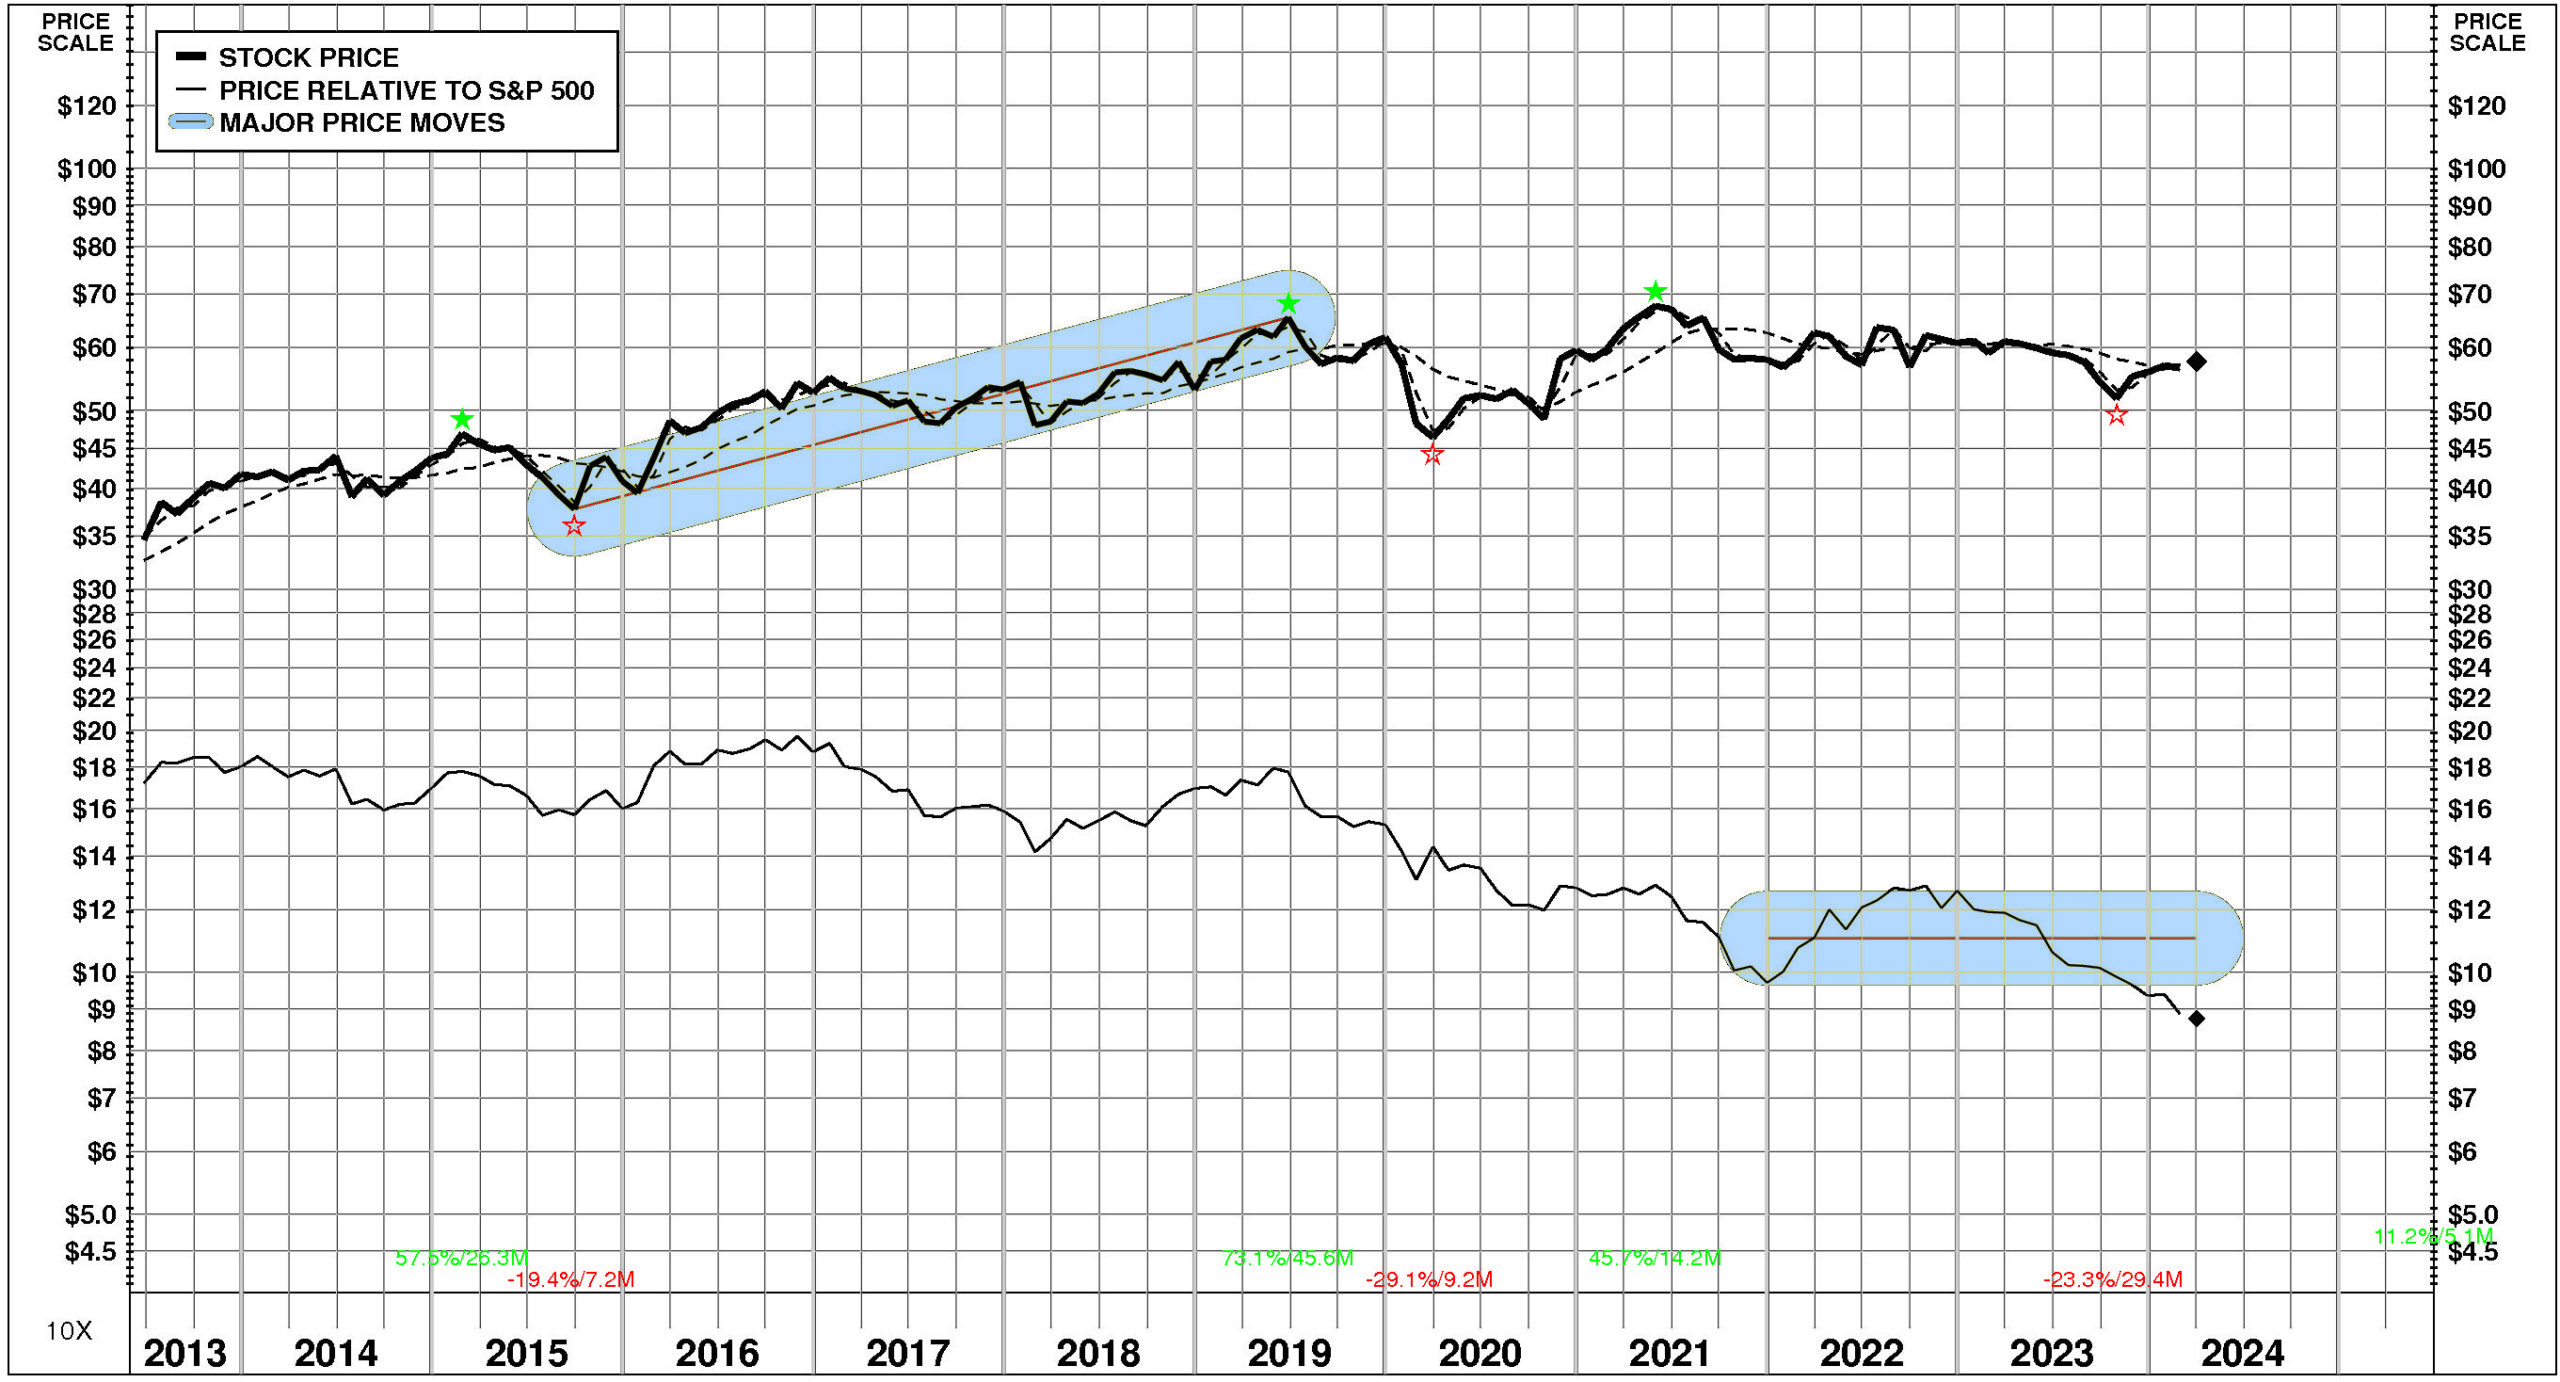
Over the full time period, Sonoco Products' stock price performance has been below market.
Between June, 2013 and April, 2024, Sonoco Products' stock price rose +67%; relative to the market, this was a -49% loss. Significant price move during the period: 1) September, 2015 – June, 2019: +73%.
TOTAL INVESTMENT RETURNS
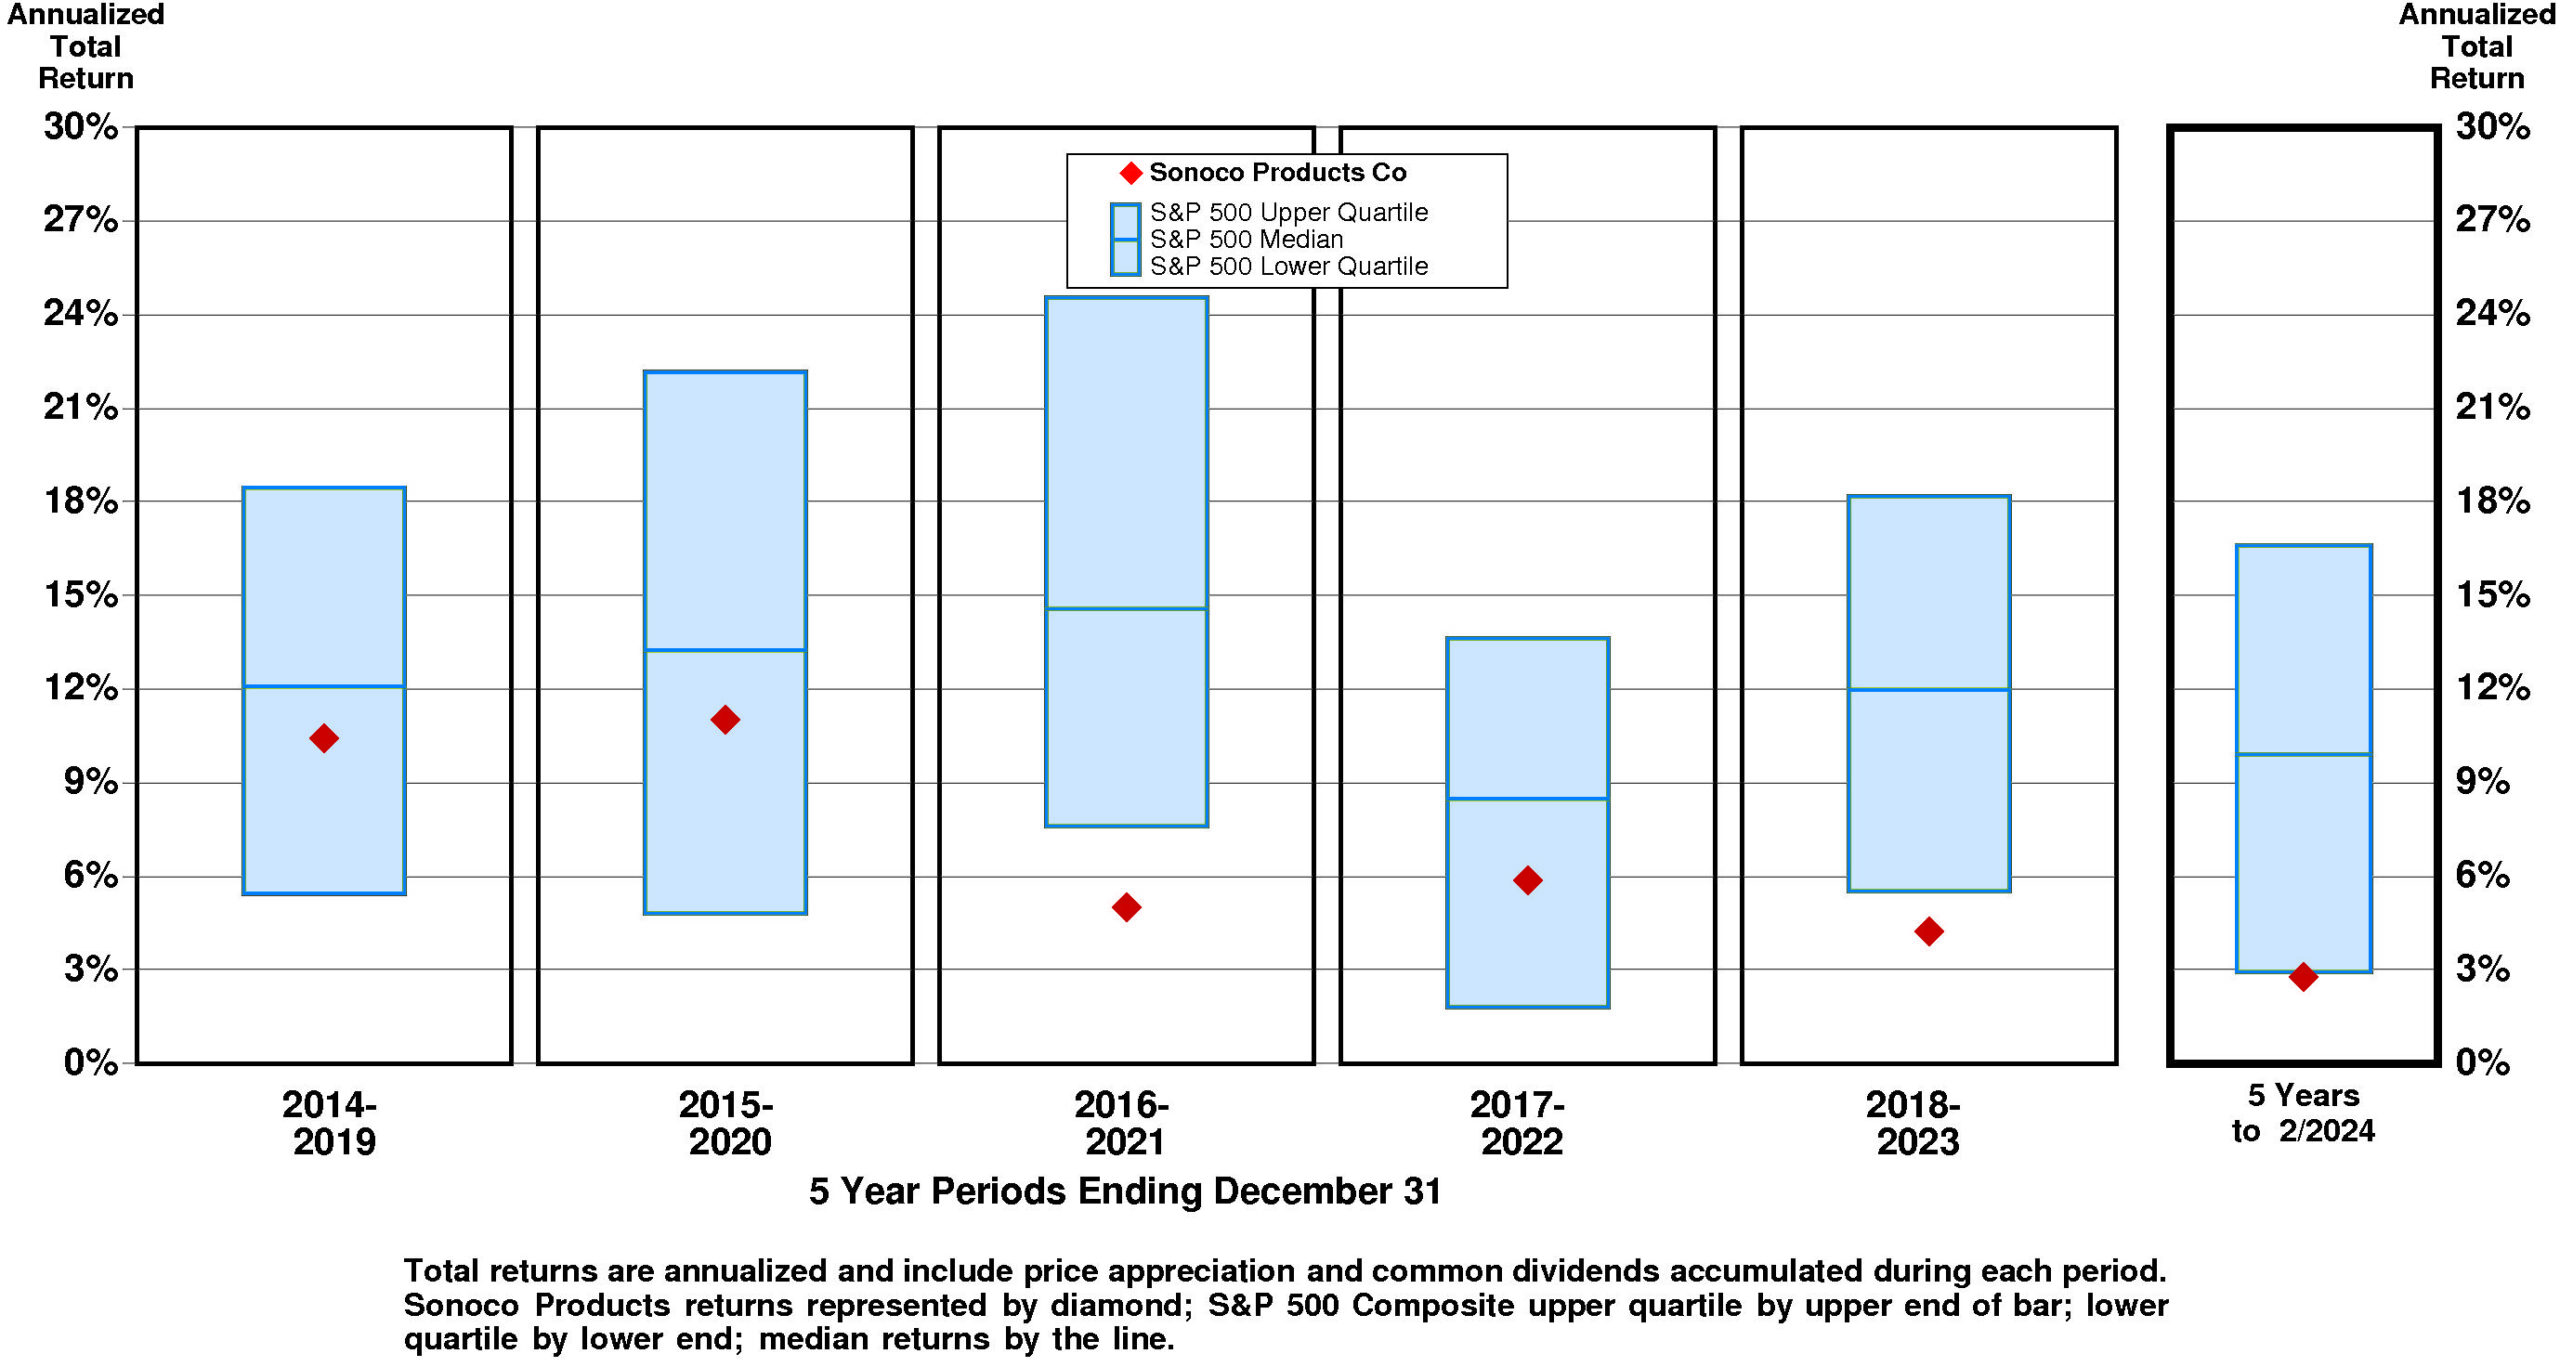
Current annual total return performance of -0.6% is substantially below median relative to the S&P 500 Composite.
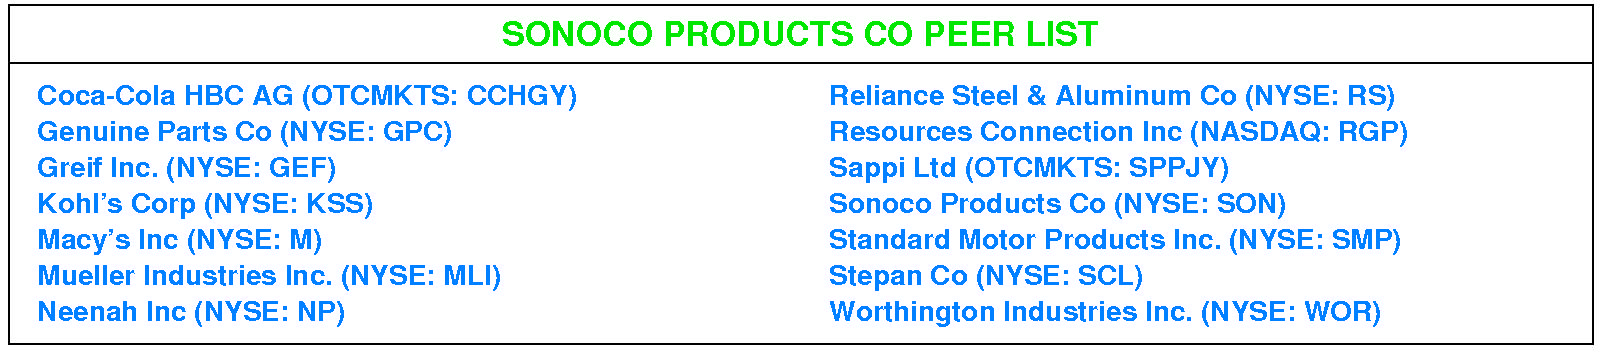
In addition to being substantially below median relative to S&P 500 Composite, current annual total return performance through February, 2024 of -0.6% is slightly above median relative to Sonoco Products Co Peer Group.
Current 5-year total return performance of 2.8% is lower quartile relative to the S&P 500 Composite.
Through February, 2024, with lower quartile current 5-year total return of 2.8% relative to S&P 500 Composite, Sonoco Products' total return performance is slightly above median relative to Sonoco Products Co Peer Group.
VALUATION BENCHMARKS
Relative to S&P 500 Composite, SON's overall valuation is quite low.
The highest factor, the ratio of enterprise value/assets, is below median. Price/equity ratio is below median. Ratio of enterprise value/earnings before interest and taxes is lower quartile. Price/earnings ratio is lower quartile. The lowest factor, the ratio of enterprise value/revenue, is lower quartile.
Relative to Sonoco Products Peer Group, SON's overall valuation is high.
The highest factor, the ratio of enterprise value/revenue, is at the upper quartile. Price/equity ratio is near the upper quartile. Ratio of enterprise value/assets is above median. Ratio of enterprise value/earnings before interest and taxes is slightly above median. The lowest factor, the price/earnings ratio, is at median.
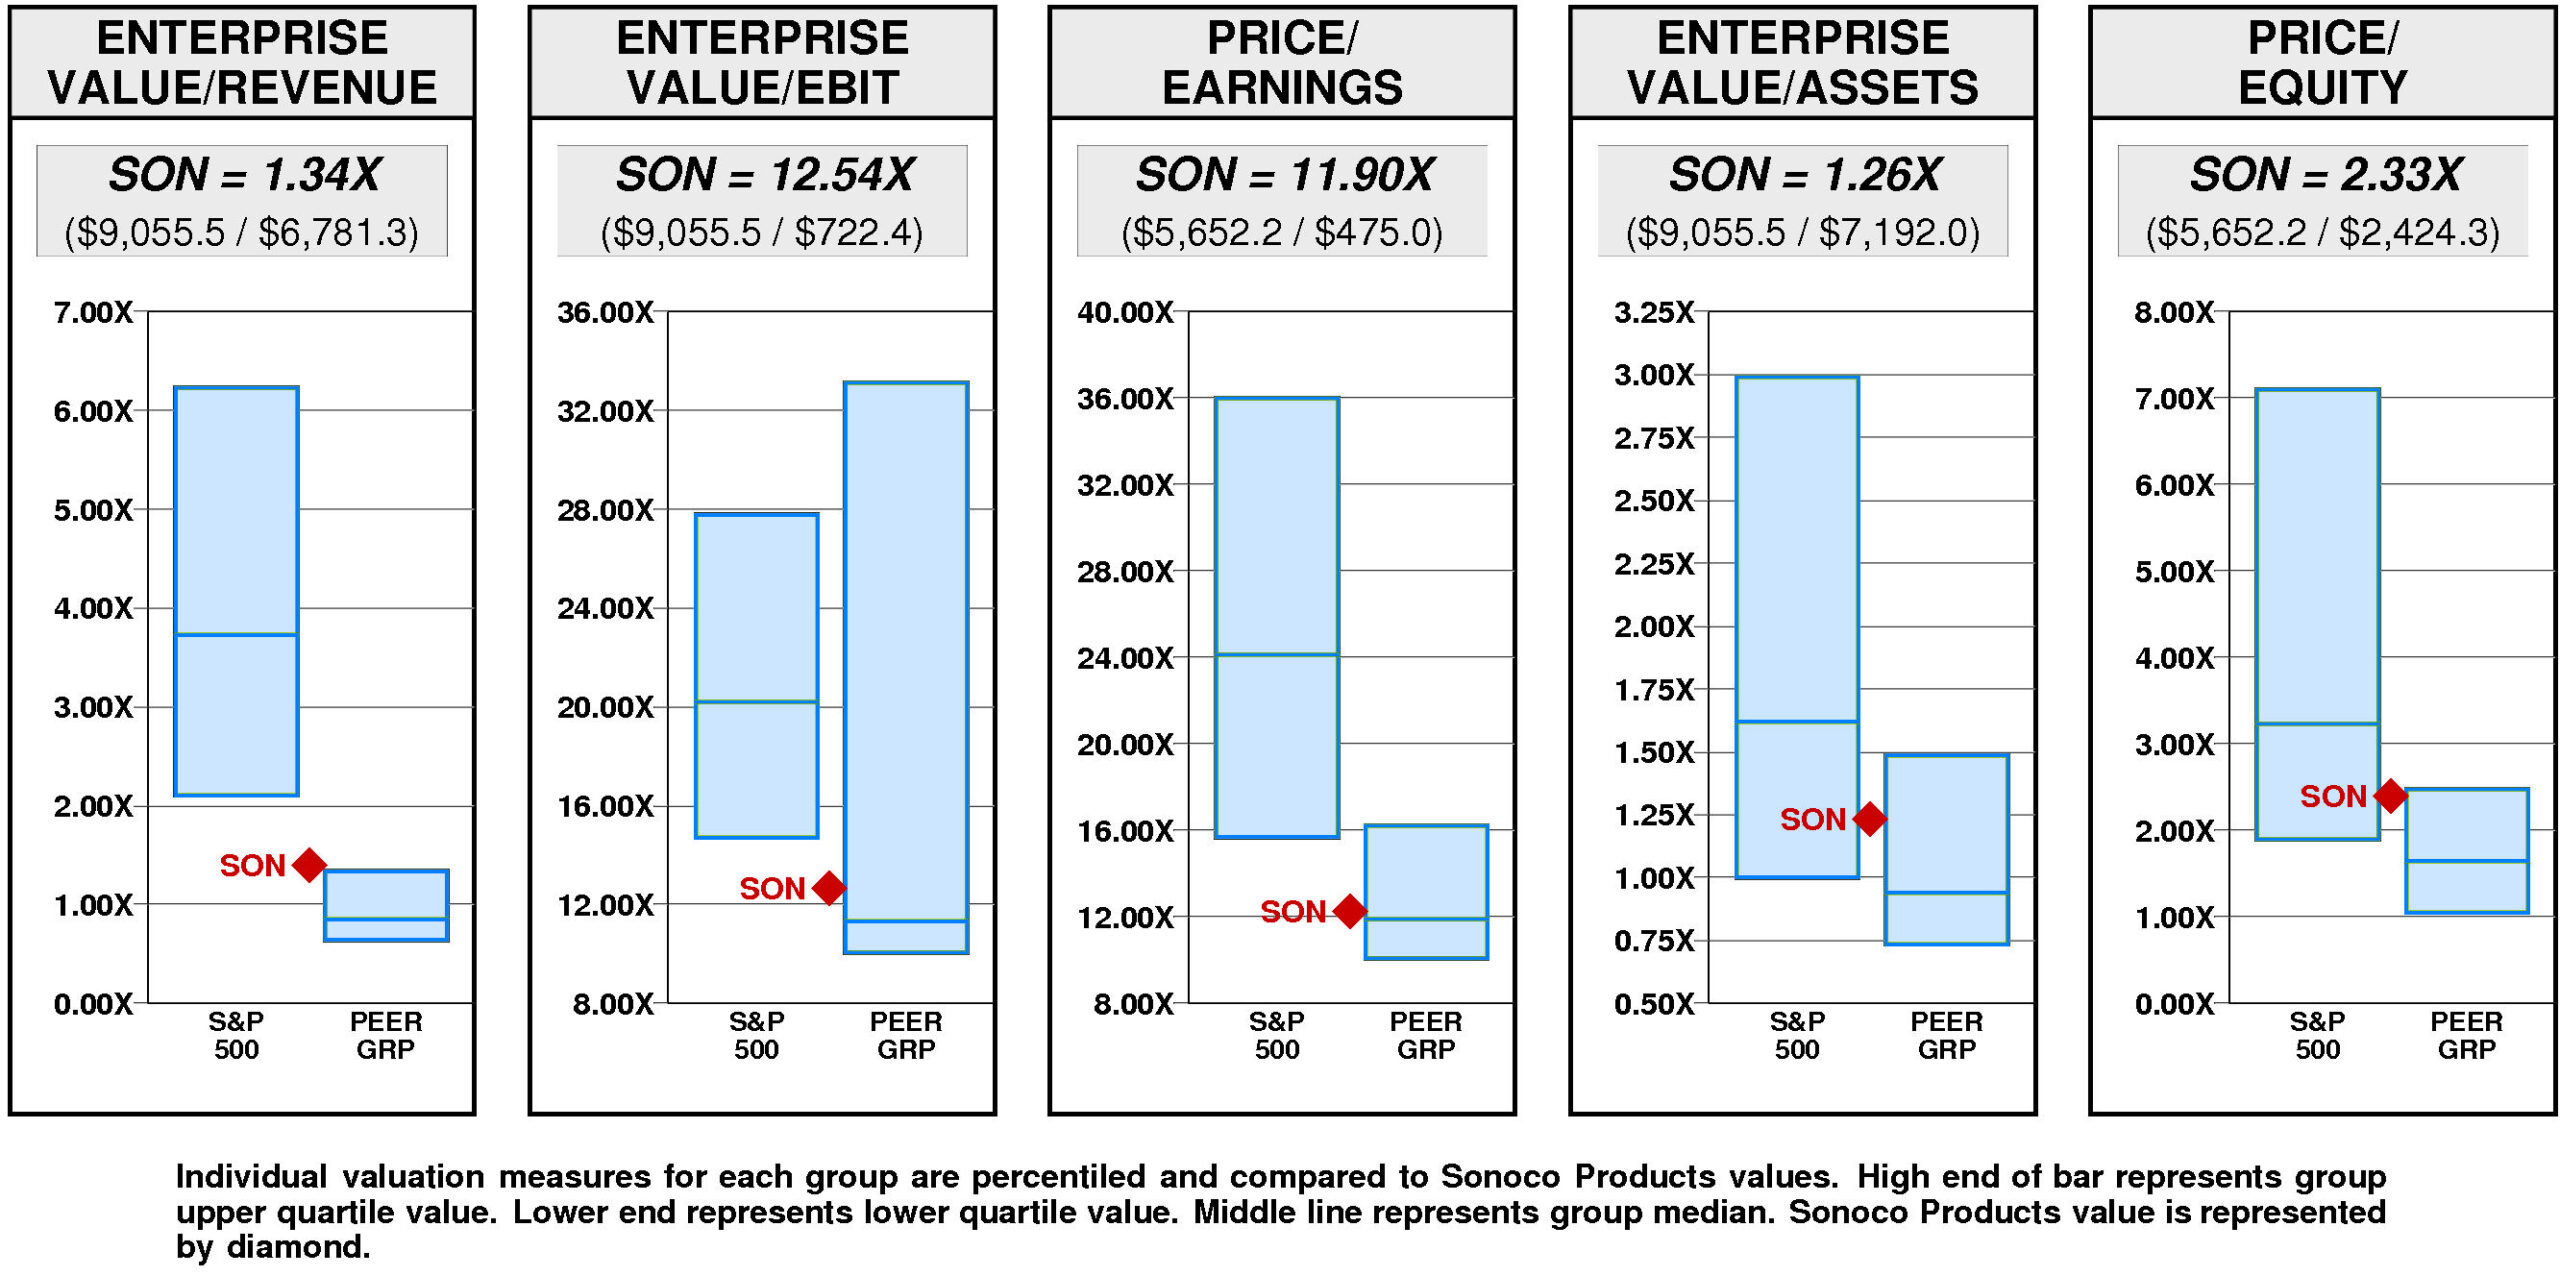
Sonoco Products has a major value gap compared to the median valuation.
For SON to achieve median valuation, its current ratio of enterprise value/revenue would have to fall from the current level of 1.34X to 0.85X. If SON's ratio of enterprise value/revenue were to fall to 0.85X, its stock price would be lower by $-33 to $24.
For SON to fall to lower quartile valuation relative to the Sonoco Products Peer Group, its current ratio of enterprise value/revenue would have to fall from the current level of 1.34X to 0.64X. If SON's ratio of enterprise value/revenue were to fall to 0.64X, its stock price would decline by $-48 from the current level of $58.
VALUE TARGETS
SON is expected to continue to be a major Value Builder reflecting capital returns that are forecasted to exceed the cost of capital.
Sonoco Products' current Price Target of $83 represents a +45% change from the current price of $57.60.
This neutral appreciation potential results in an appreciation score of 55 (45% of the universe has greater appreciation potential.)
Reinforcing this neutral Appreciation Score of 55, the neutral Power Rating of 59 contributes to an Value Trend Rating of C.
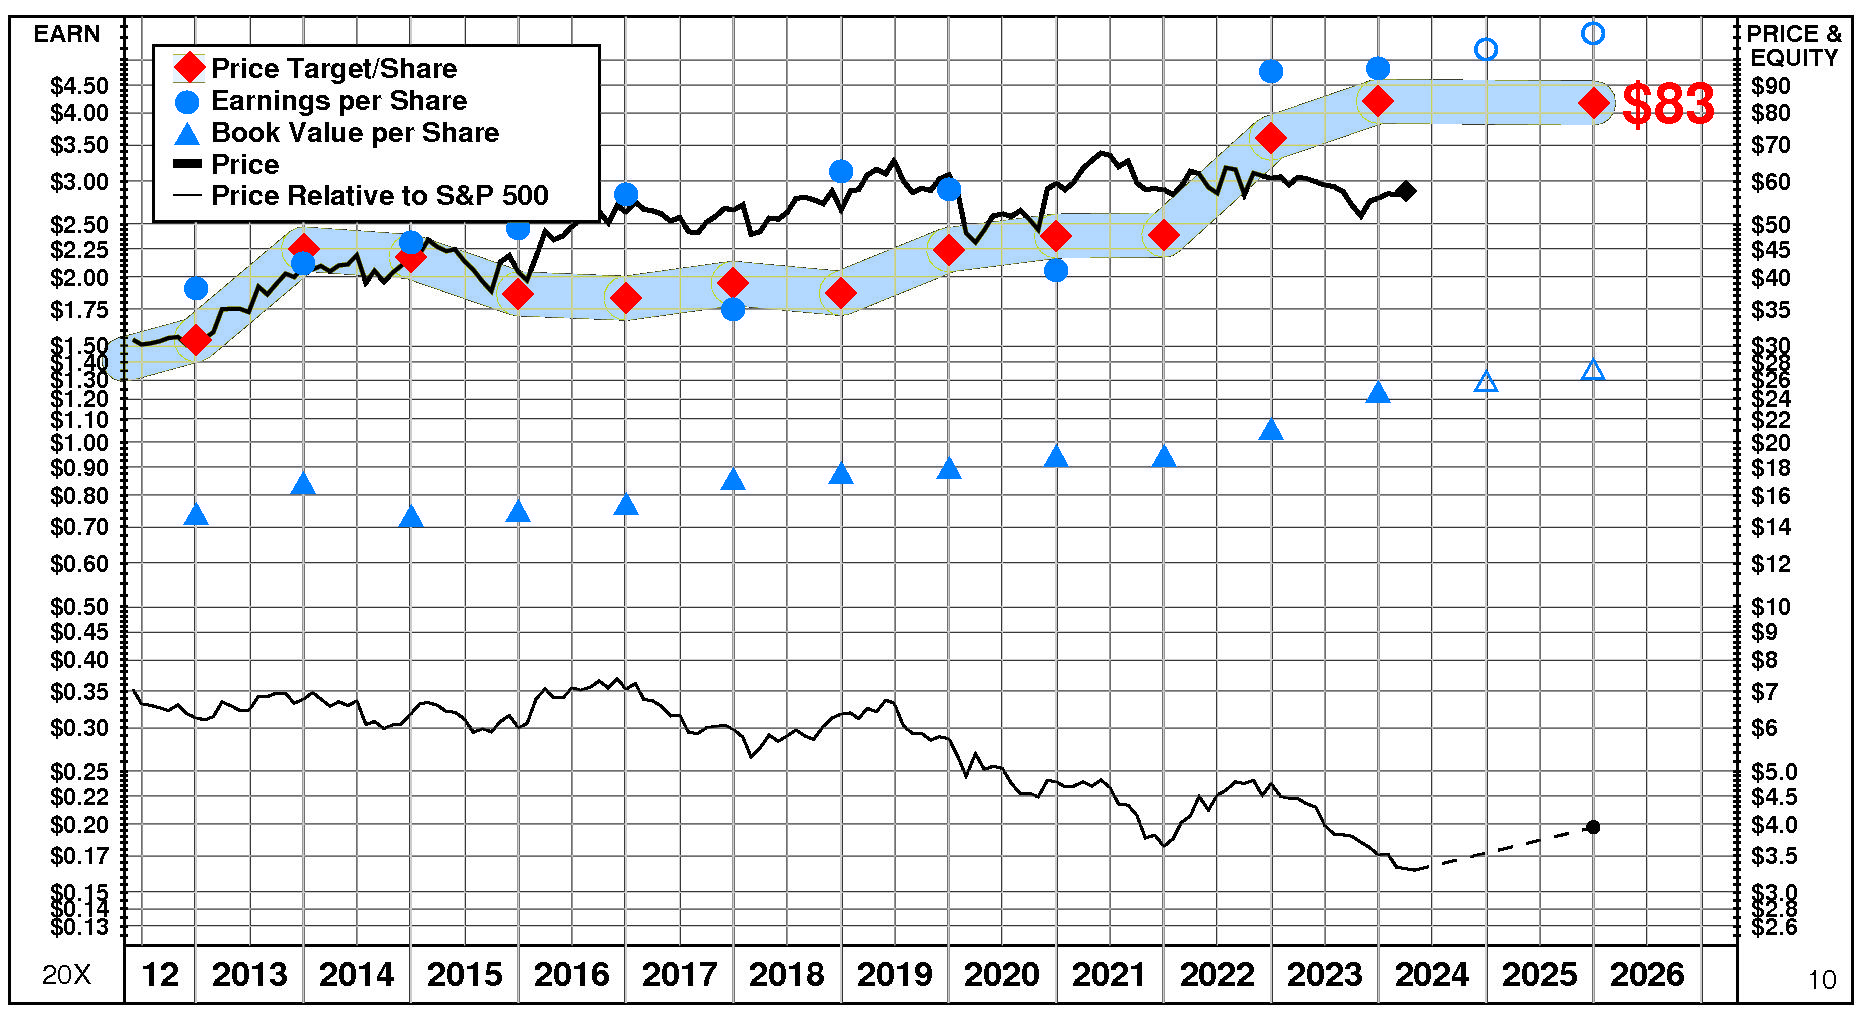
Sonoco Products' current Price Target is $83 (-1% from the 2023 Target of $84 but +45% from the 04/01/24 price of $57.60).
This plateau in the Target is the result of a +9% increase in the equity base and a -9% decrease in the price/equity multiple. The forecasted decline in growth has a large negative impact on the price/equity multiple and the forecasted decline in return on equity has a slight negative impact as well. Partially offsetting these Drivers, the forecasted decline in cost of equity has a large positive impact.
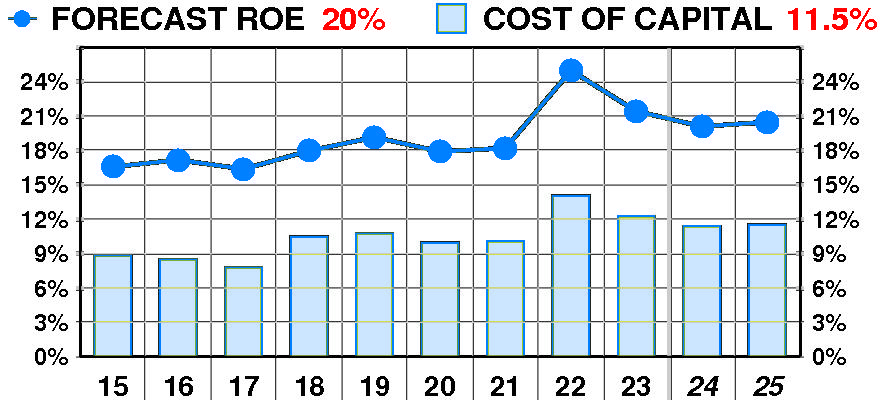
PTR's return on equity forecast is 20.5% — slightly below our recent forecasts.
Forecasted return on equity enjoyed a dramatic, variable increase between 2015 and 2023. The current forecast is above the 2017 low of 16%.
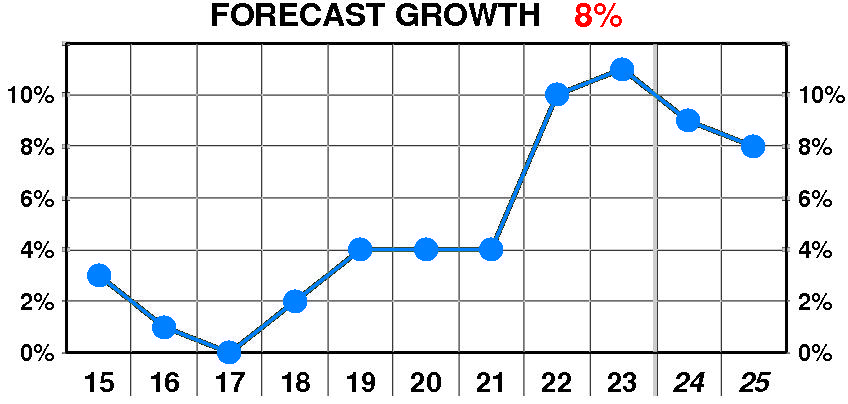
PTR's growth forecast is 8.0% — above our recent forecasts.
Forecasted growth enjoyed a dramatic, variable increase between 2015 and 2023. The current forecast is well above the 2017 low of 0%.
PTR's cost of equity forecast is 11.5% — slightly below recent levels.
Forecasted cost of equity suffered a dramatic, variable increase between 2015 and 2023. The current forecast is above the 2017 low of 7.8%.
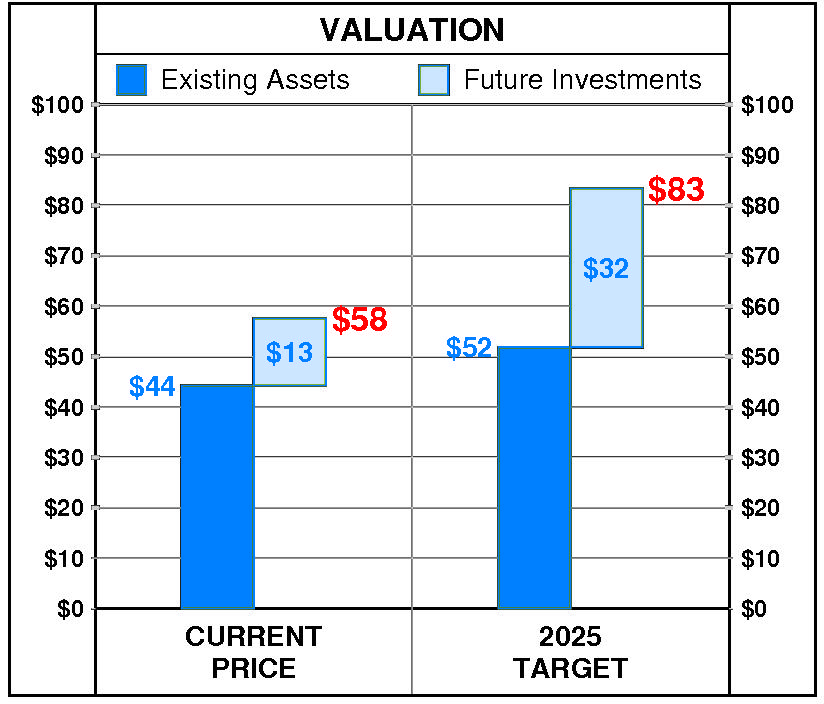
At Sonoco Products' current price of $57.60, investors are placing a positive value of $13 on its future investments. This view is consistent with the company's most recent performance that reflected a growth rate of 11.0% per year, and a return on equity of 21.4% versus a cost of equity of 12.3%.
PTR's 2025 Price Target of $83 is based on these forecasts and reflects an estimated value of existing assets of $52 and a value of future investments of $32.