![]()
BUSINESS
The Southern Company, through its subsidiaries, engages in the generation, transmission, and distribution of electricity. It operates through Gas Distribution Operations, Gas Pipeline Investments, Wholesale Gas Services, and Gas Marketing Services segments. The company also develops, constructs, acquires, owns, and manages power generation assets, including renewable energy projects and sells electricity in the wholesale market; and distributes natural gas in Illinois, Georgia, Virginia, and Tennessee, as well as provides gas marketing services, wholesale gas services, and gas pipeline investments operations.
INVESTMENT RATING
SO is expected to continue to be a major Value Builder reflecting capital returns that are forecasted to be above the cost of capital.
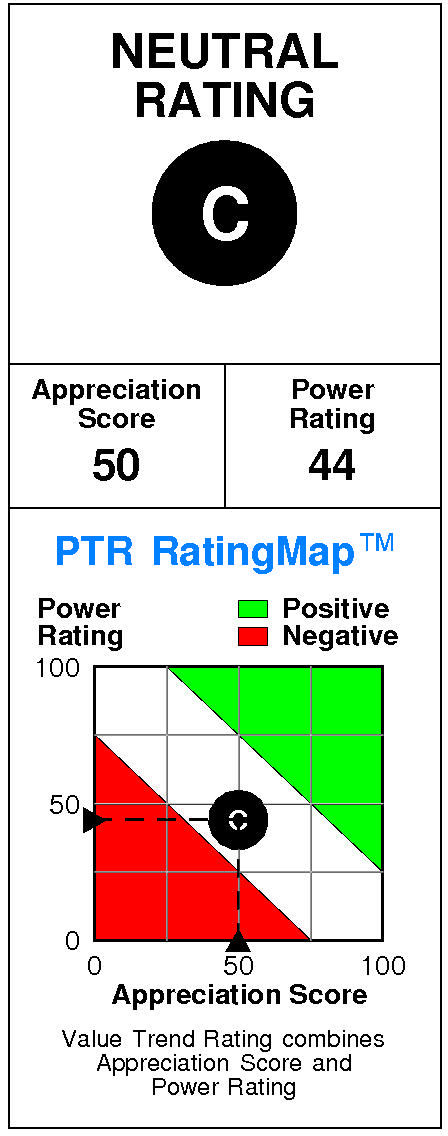
Southern has a current Value Trend Rating of C (Low Neutral).
With this rating, PTR’s two proprietary measures of a stock’s current attractiveness are providing highly consistent signals. Southern has a neutral Appreciation Score of 50 and a neutral Power Rating of 44, producing the Low Neutral Value Trend Rating.
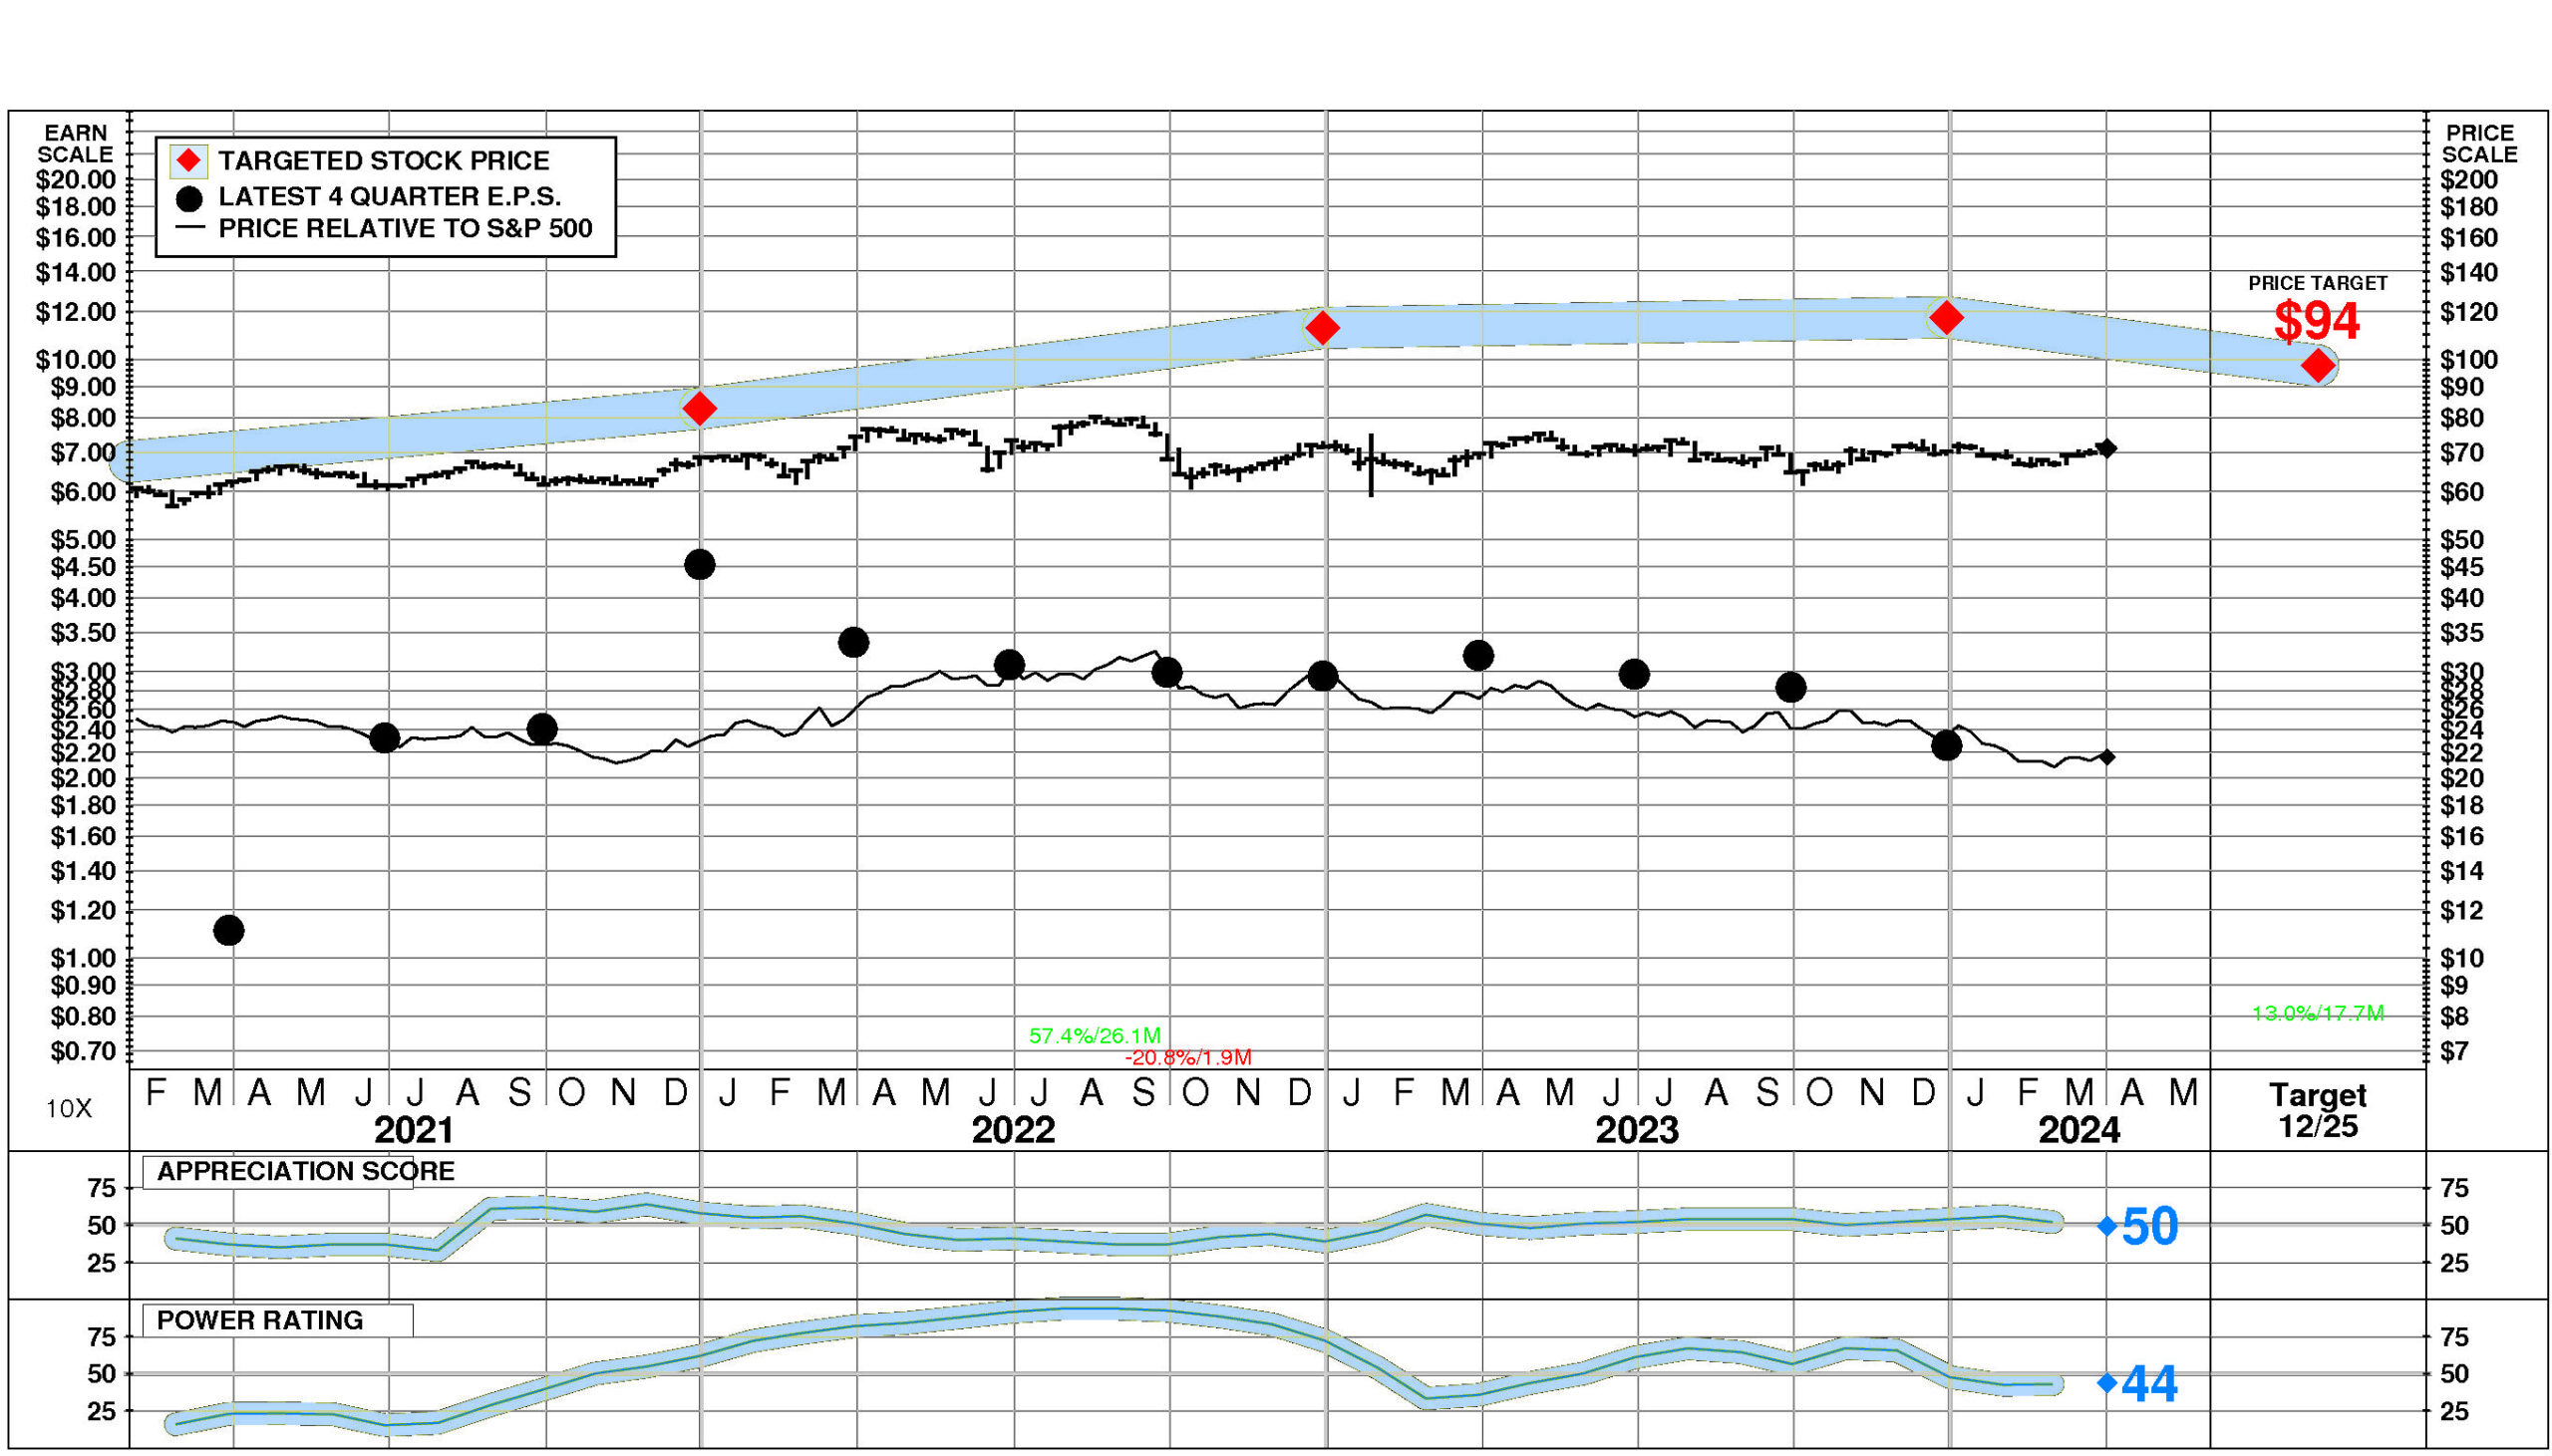
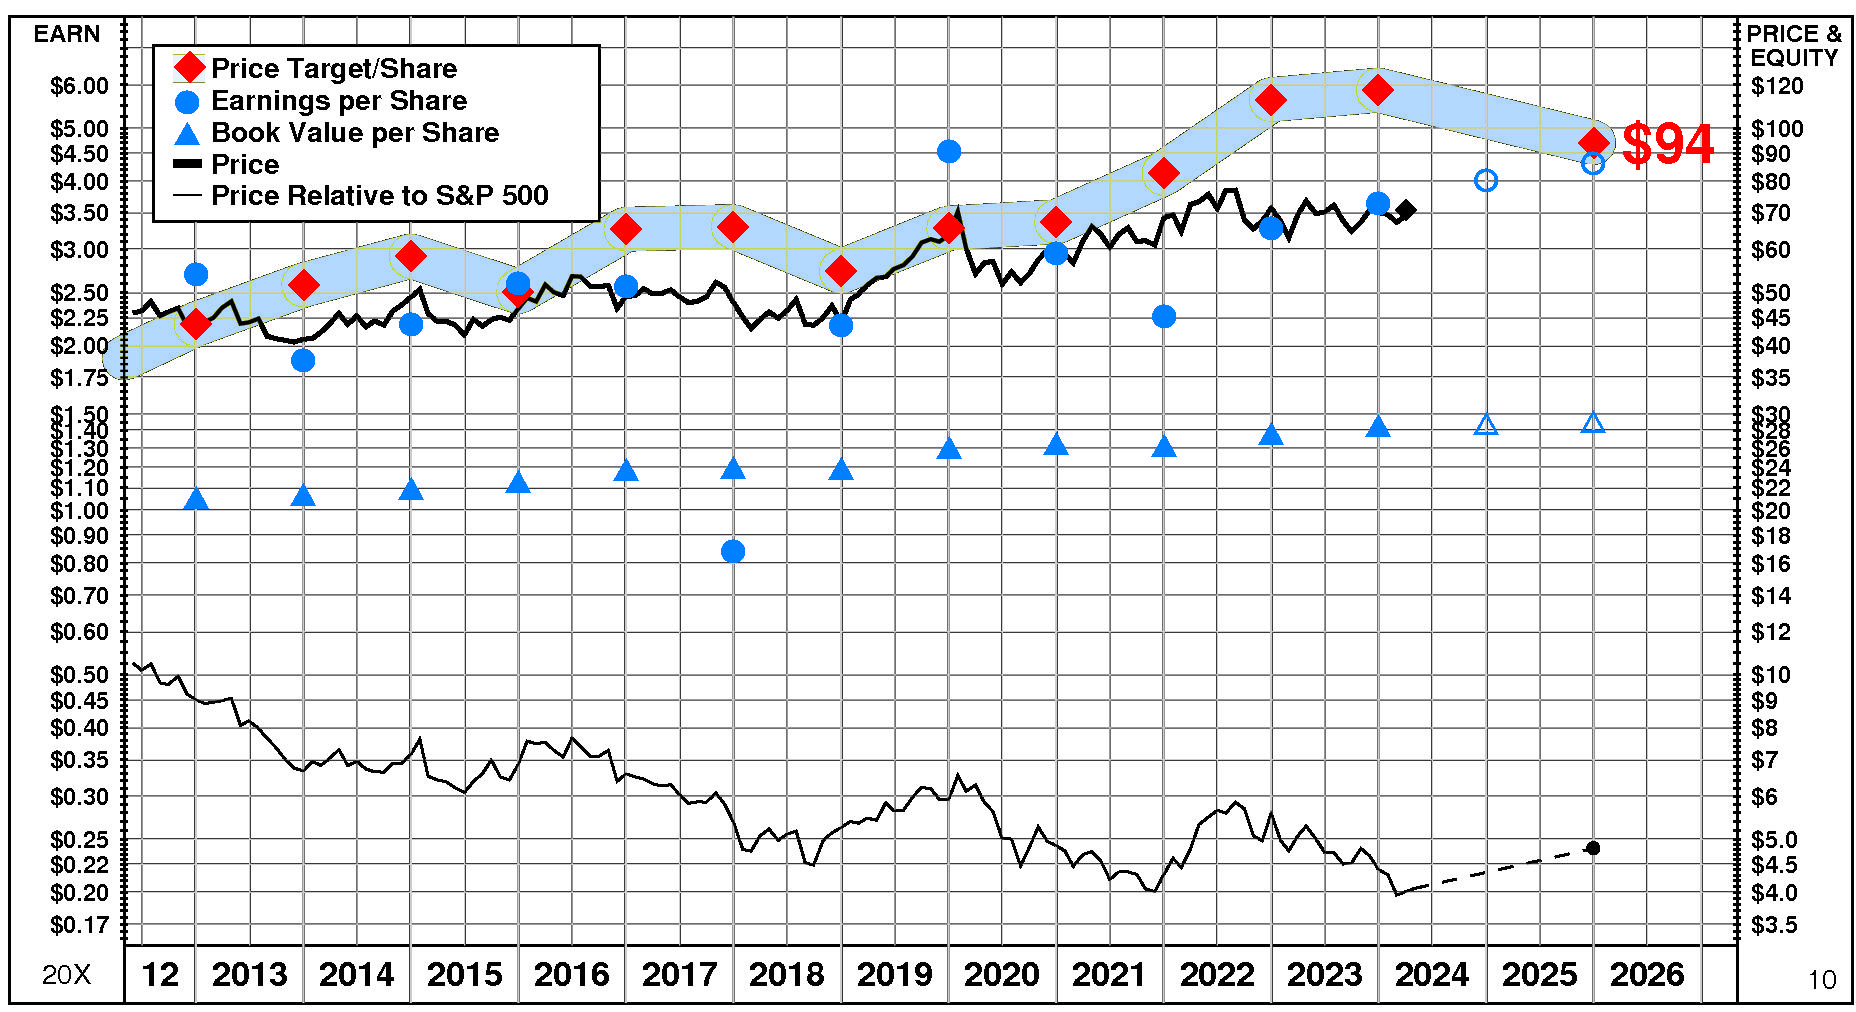
Southern’s stock is selling well below targeted value. The current stock price of $71.10 compares to targeted value 12 months forward of $98.
This neutral appreciation potential results in an appreciation score of 50 (50% of the universe has greater appreciation potential.)
Southern has a Power Rating of 44. (This neutral Power Rating indicates that SO’s chances of enjoying attractive investment performance over the near to intermediate term are only average.)
Factors contributing to this neutral Power Rating include: the Electric Services comparison group is currently in an unfavorable position; and recent price action has been neutral. An offsetting factor is earnings estimate behavior for SO has been slightly favorable recently.
INVESTMENT PROFILE
Southern’s financial strength is low. Financial strength rating is 29.
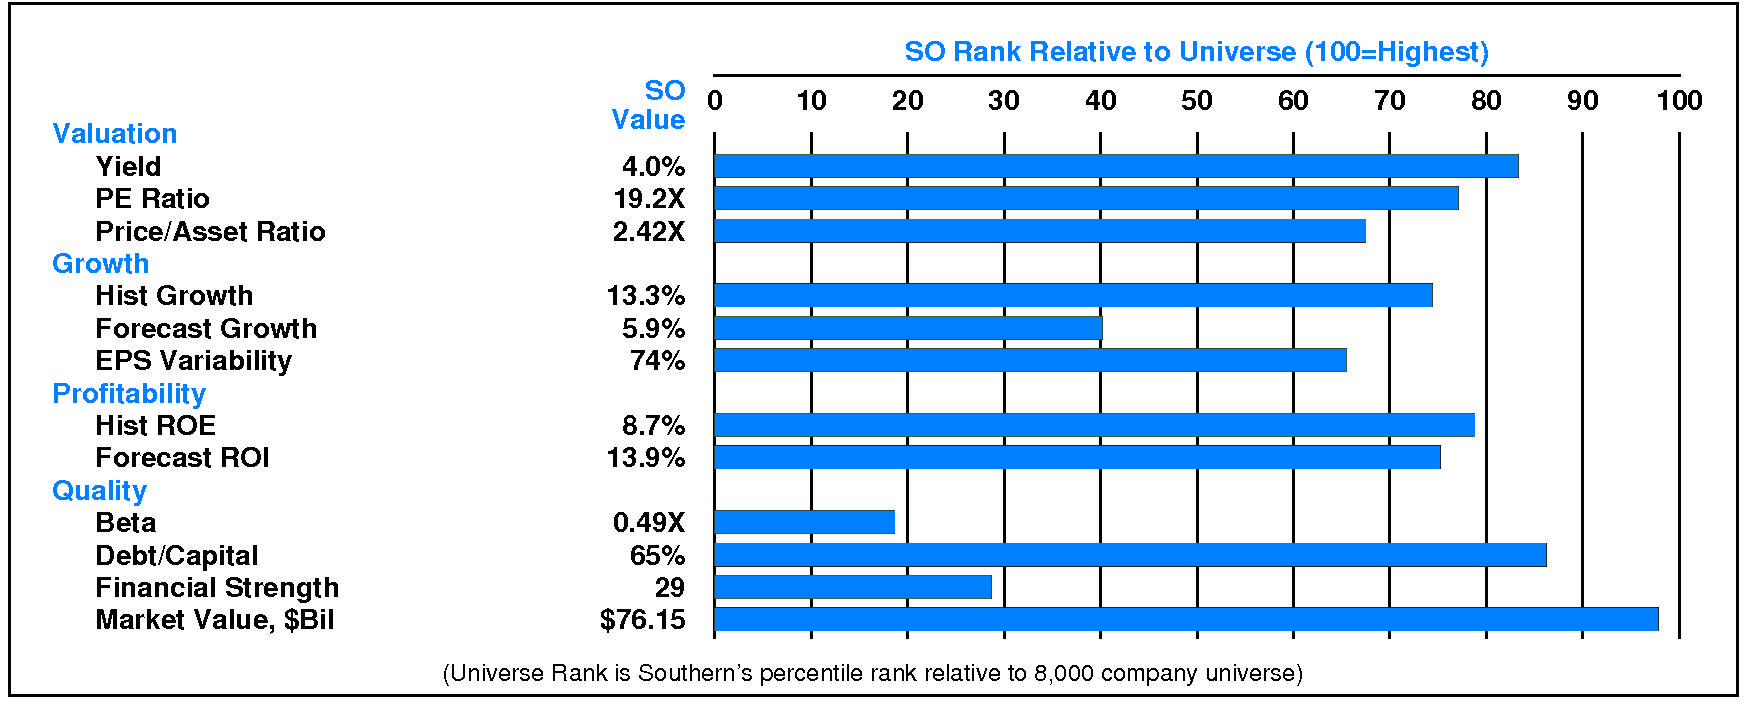
Relative to the S&P 500 Composite, Southern Co has moderate Value characteristics; its appeal is likely to be to Income-oriented investors; the perception is that SO is higher risk. Low stock price volatility is a positive for Southern. Relative weaknesses include: low financial strength, high financial leverage, low expected growth, and high earnings variability. Southern’s valuation is moderate: high dividend yield, moderate P/E ratio, and moderate price/book ratio. SO has high market capitalization.
CURRENT SIGNALS
Southern’s current operations are strong. Return on equity is rising, reflecting: widening pretax margins; rising tax keep rate; and rising leverage.
Southern’s current technical position is very weak. The stock price is in a 1.9 month down move. The stock has declined 17.2% from its prior high. The stock price is below its 200 day moving average which is in a downtrend.
ALERTS
The Southern Co (NYSE: SO). Significant positive changes in investment behavior have recently occurred: its shorter term price trend turned up.
The Southern Co (NYSE: SO). Meaningful negative changes in fundamentals have recently occurred: significant quarterly sales deceleration occurred, and significant quarterly earnings deceleration occurred.
The stock is currently rated C.
On 4/1/24, The Southern Co (NYSE: SO) stock declined slightly by -0.9%, closing at $71.10. However, this decline was accompanied by unusually low trading volume at 66% of normal. The stock has performed in line with the market over the last nine months and has risen 1.7% during the last week.
CASH FLOW
In 2023, Southern experienced a very significant reduction in cash of -$1,169 million (-61%). Sources of cash were much lower than uses. Cash generated from 2023 EBITDA totaled +$10,283 million. Non-operating sources contributed +$1,292 million (+13% of EBITDA). Cash taxes contributed +$392 million (+4% of EBITDA). Re-investment in the business amounted to -$11,973 million (-116% of EBITDA). On a net basis, debt investors contributed +$1,777 million (+17% of EBITDA) while equity investors withdrew -$2,940 million (-29% of EBITDA).
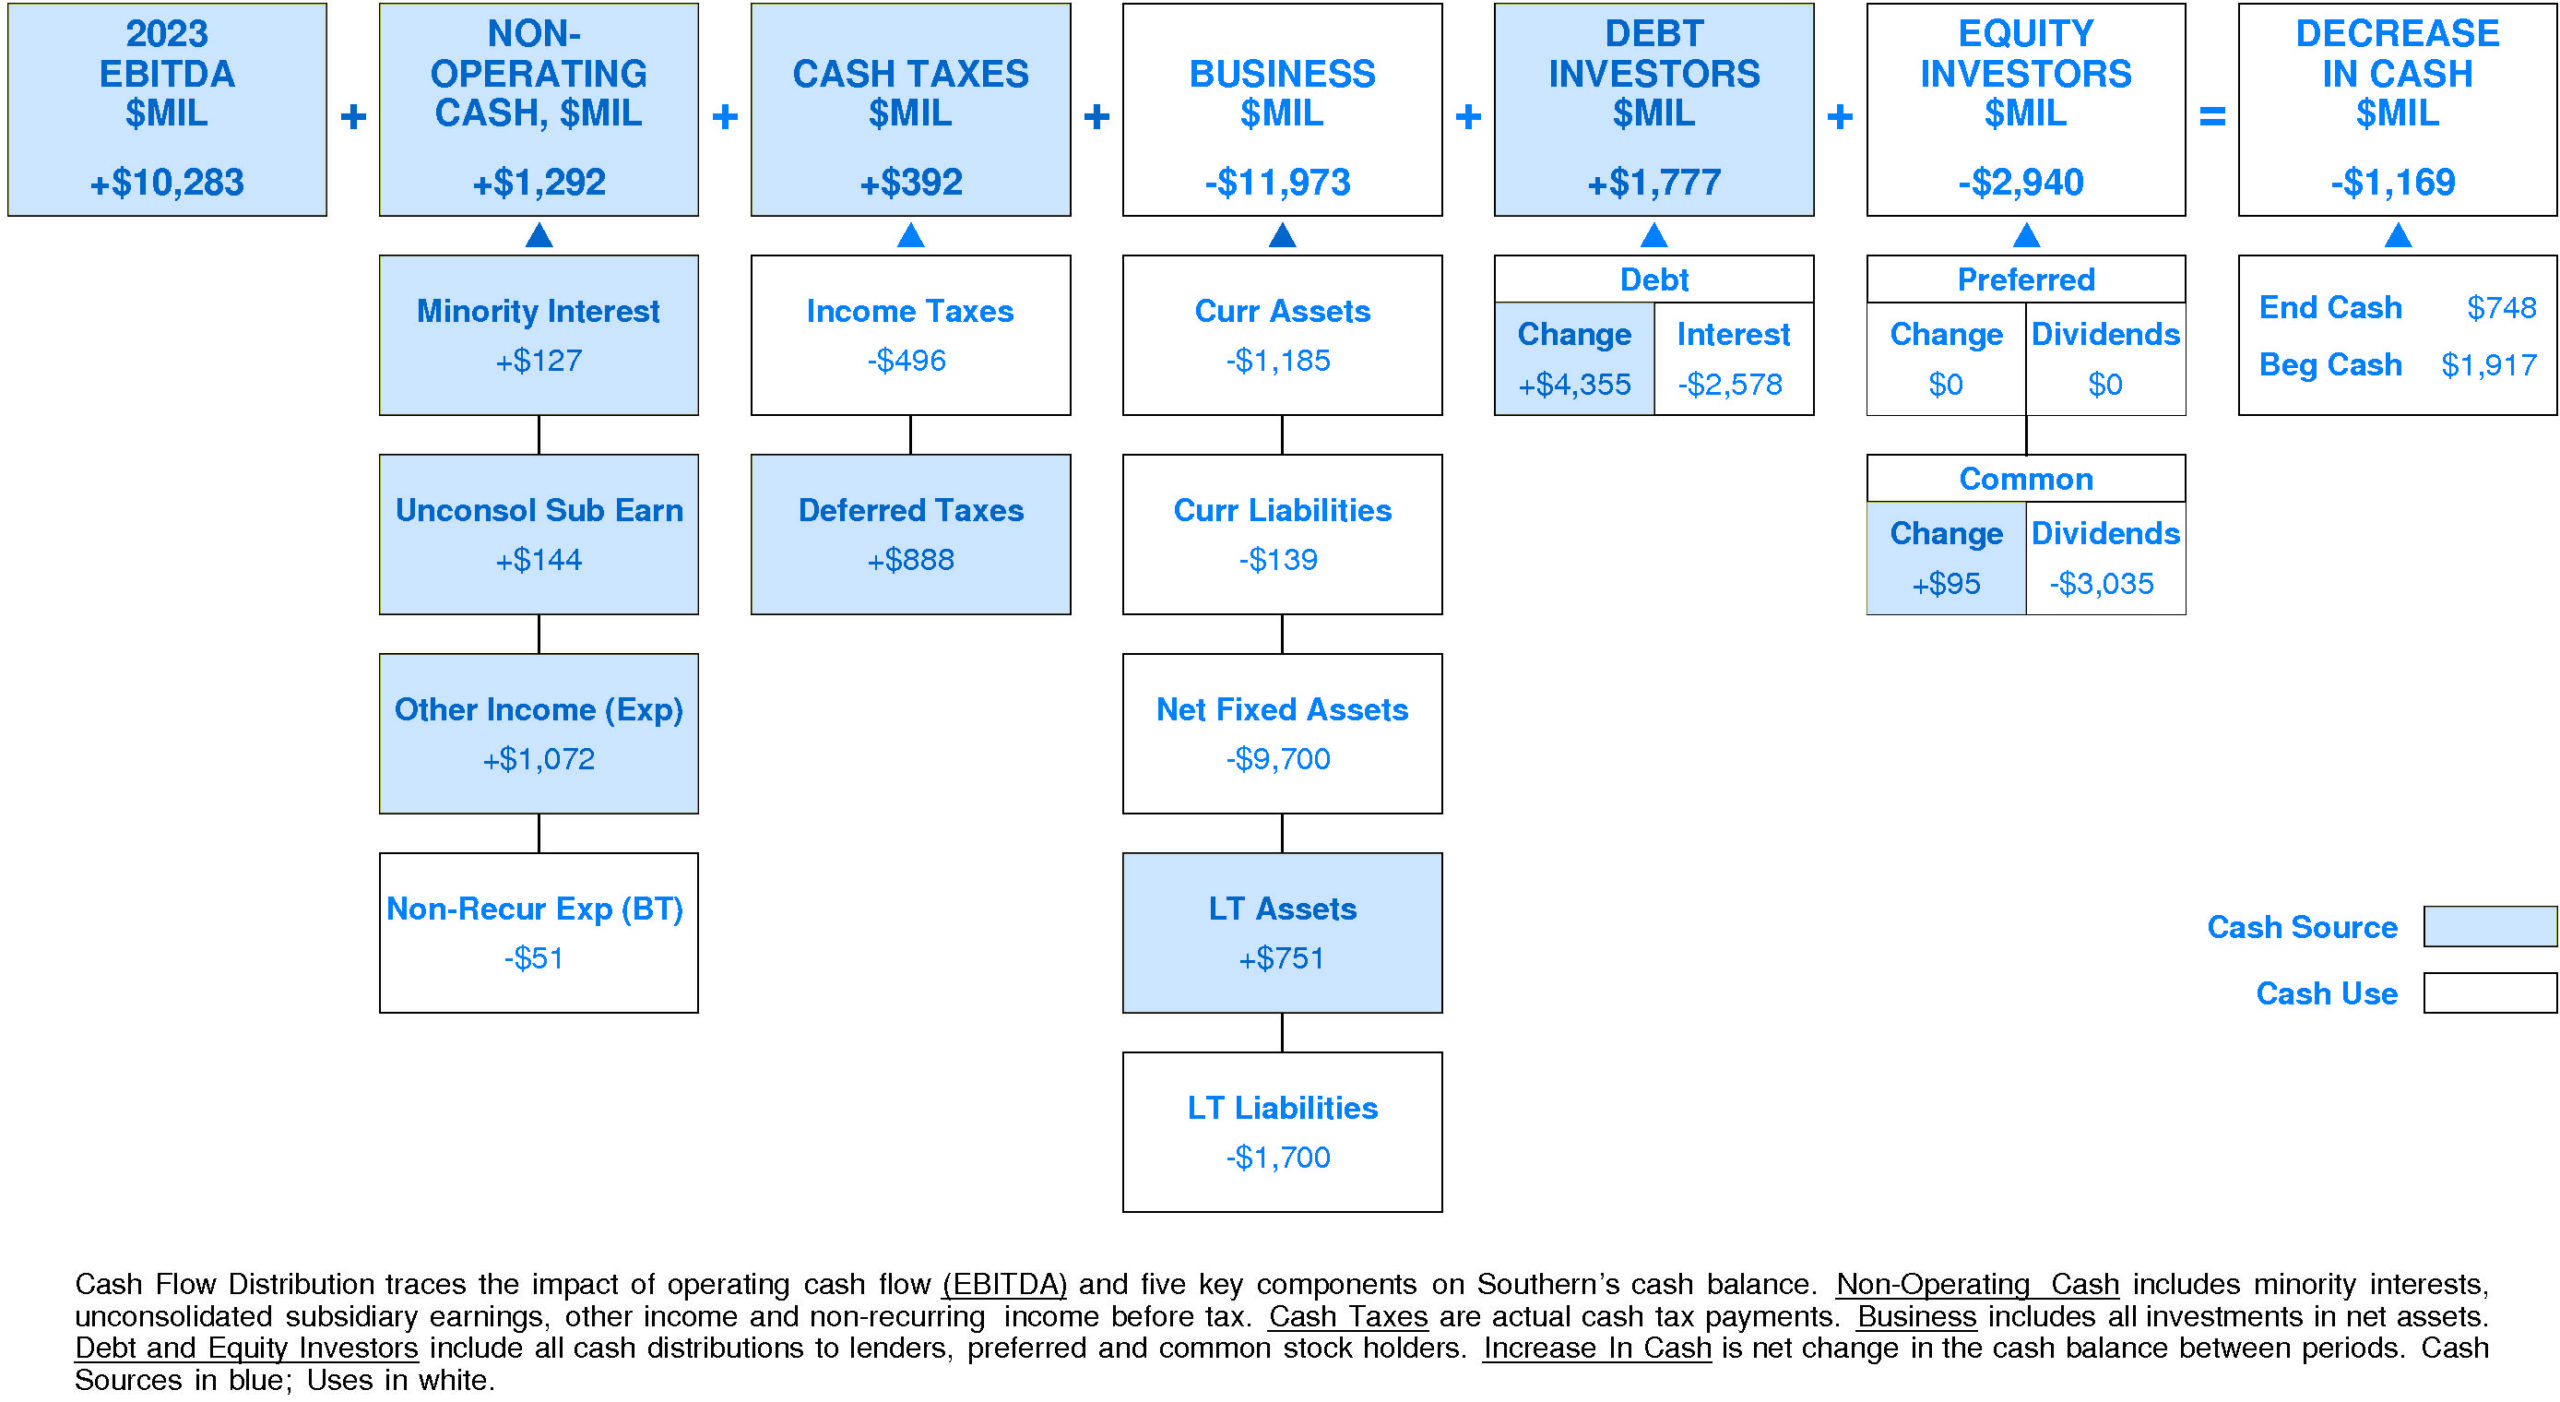
Southern’s Non-operating Income, %EBITDA has enjoyed a volatile overall uptrend over the period. This improvement was accompanied by a similar trend for the Southern Peer Group. (Since 2021 Non-operating Income, %EBITDA has sharply accelerated.) In most years, Southern was in the third quartile and second quartile. Currently, Southern is upper quartile at +13% of EBITDA (+$1,292 million).
Southern’s Cash Taxes, %EBITDA has exhibited a volatile overall uptrend over the period. This improvement was accompanied by a similar trend for the Southern Peer Group. In most years, Southern was in the second quartile and top quartile. Currently, Southern is substantially above median at +4% of EBITDA (+$392 million).
Southern’s Business Re-investment, %EBITDA has enjoyed a volatile overall uptrend over the period. This improvement was accompanied by an opposite trend for the Southern Peer Group. (Since 2020 Business Re-investment, %EBITDA has experienced a very sharp decline.) In most years, Southern was in the third quartile and second quartile. Currently, Southern is lower quartile at -116% of EBITDA (-$11,973 million).
Southern’s Debt Investors, %EBITDA has experienced a volatile overall downtrend over the period. This downtrend was accompanied by an opposite trend for the Southern Peer Group. In most years, Southern was in the second quartile and top quartile. Currently, Southern is substantially above median at +17% of EBITDA (+$1,777 million).
Southern’s Equity Investors, %EBITDA has experienced a downtrend over the period. This downtrend was accompanied by stability for the Southern Peer Group. In most years, Southern was in the third quartile and second quartile. Currently, Southern is below median at -29% of EBITDA (-$2,940 million).
Southern’s Change in Cash, %EBITDA has experienced a downtrend over the period. This downtrend was accompanied by stability for the Southern Peer Group. (Since 2021 Change in Cash, %EBITDA has accelerated sharply.) In most years, Southern was in the top quartile and second quartile. Currently, Southern is lower quartile at -11% of EBITDA (-$1,169 million).
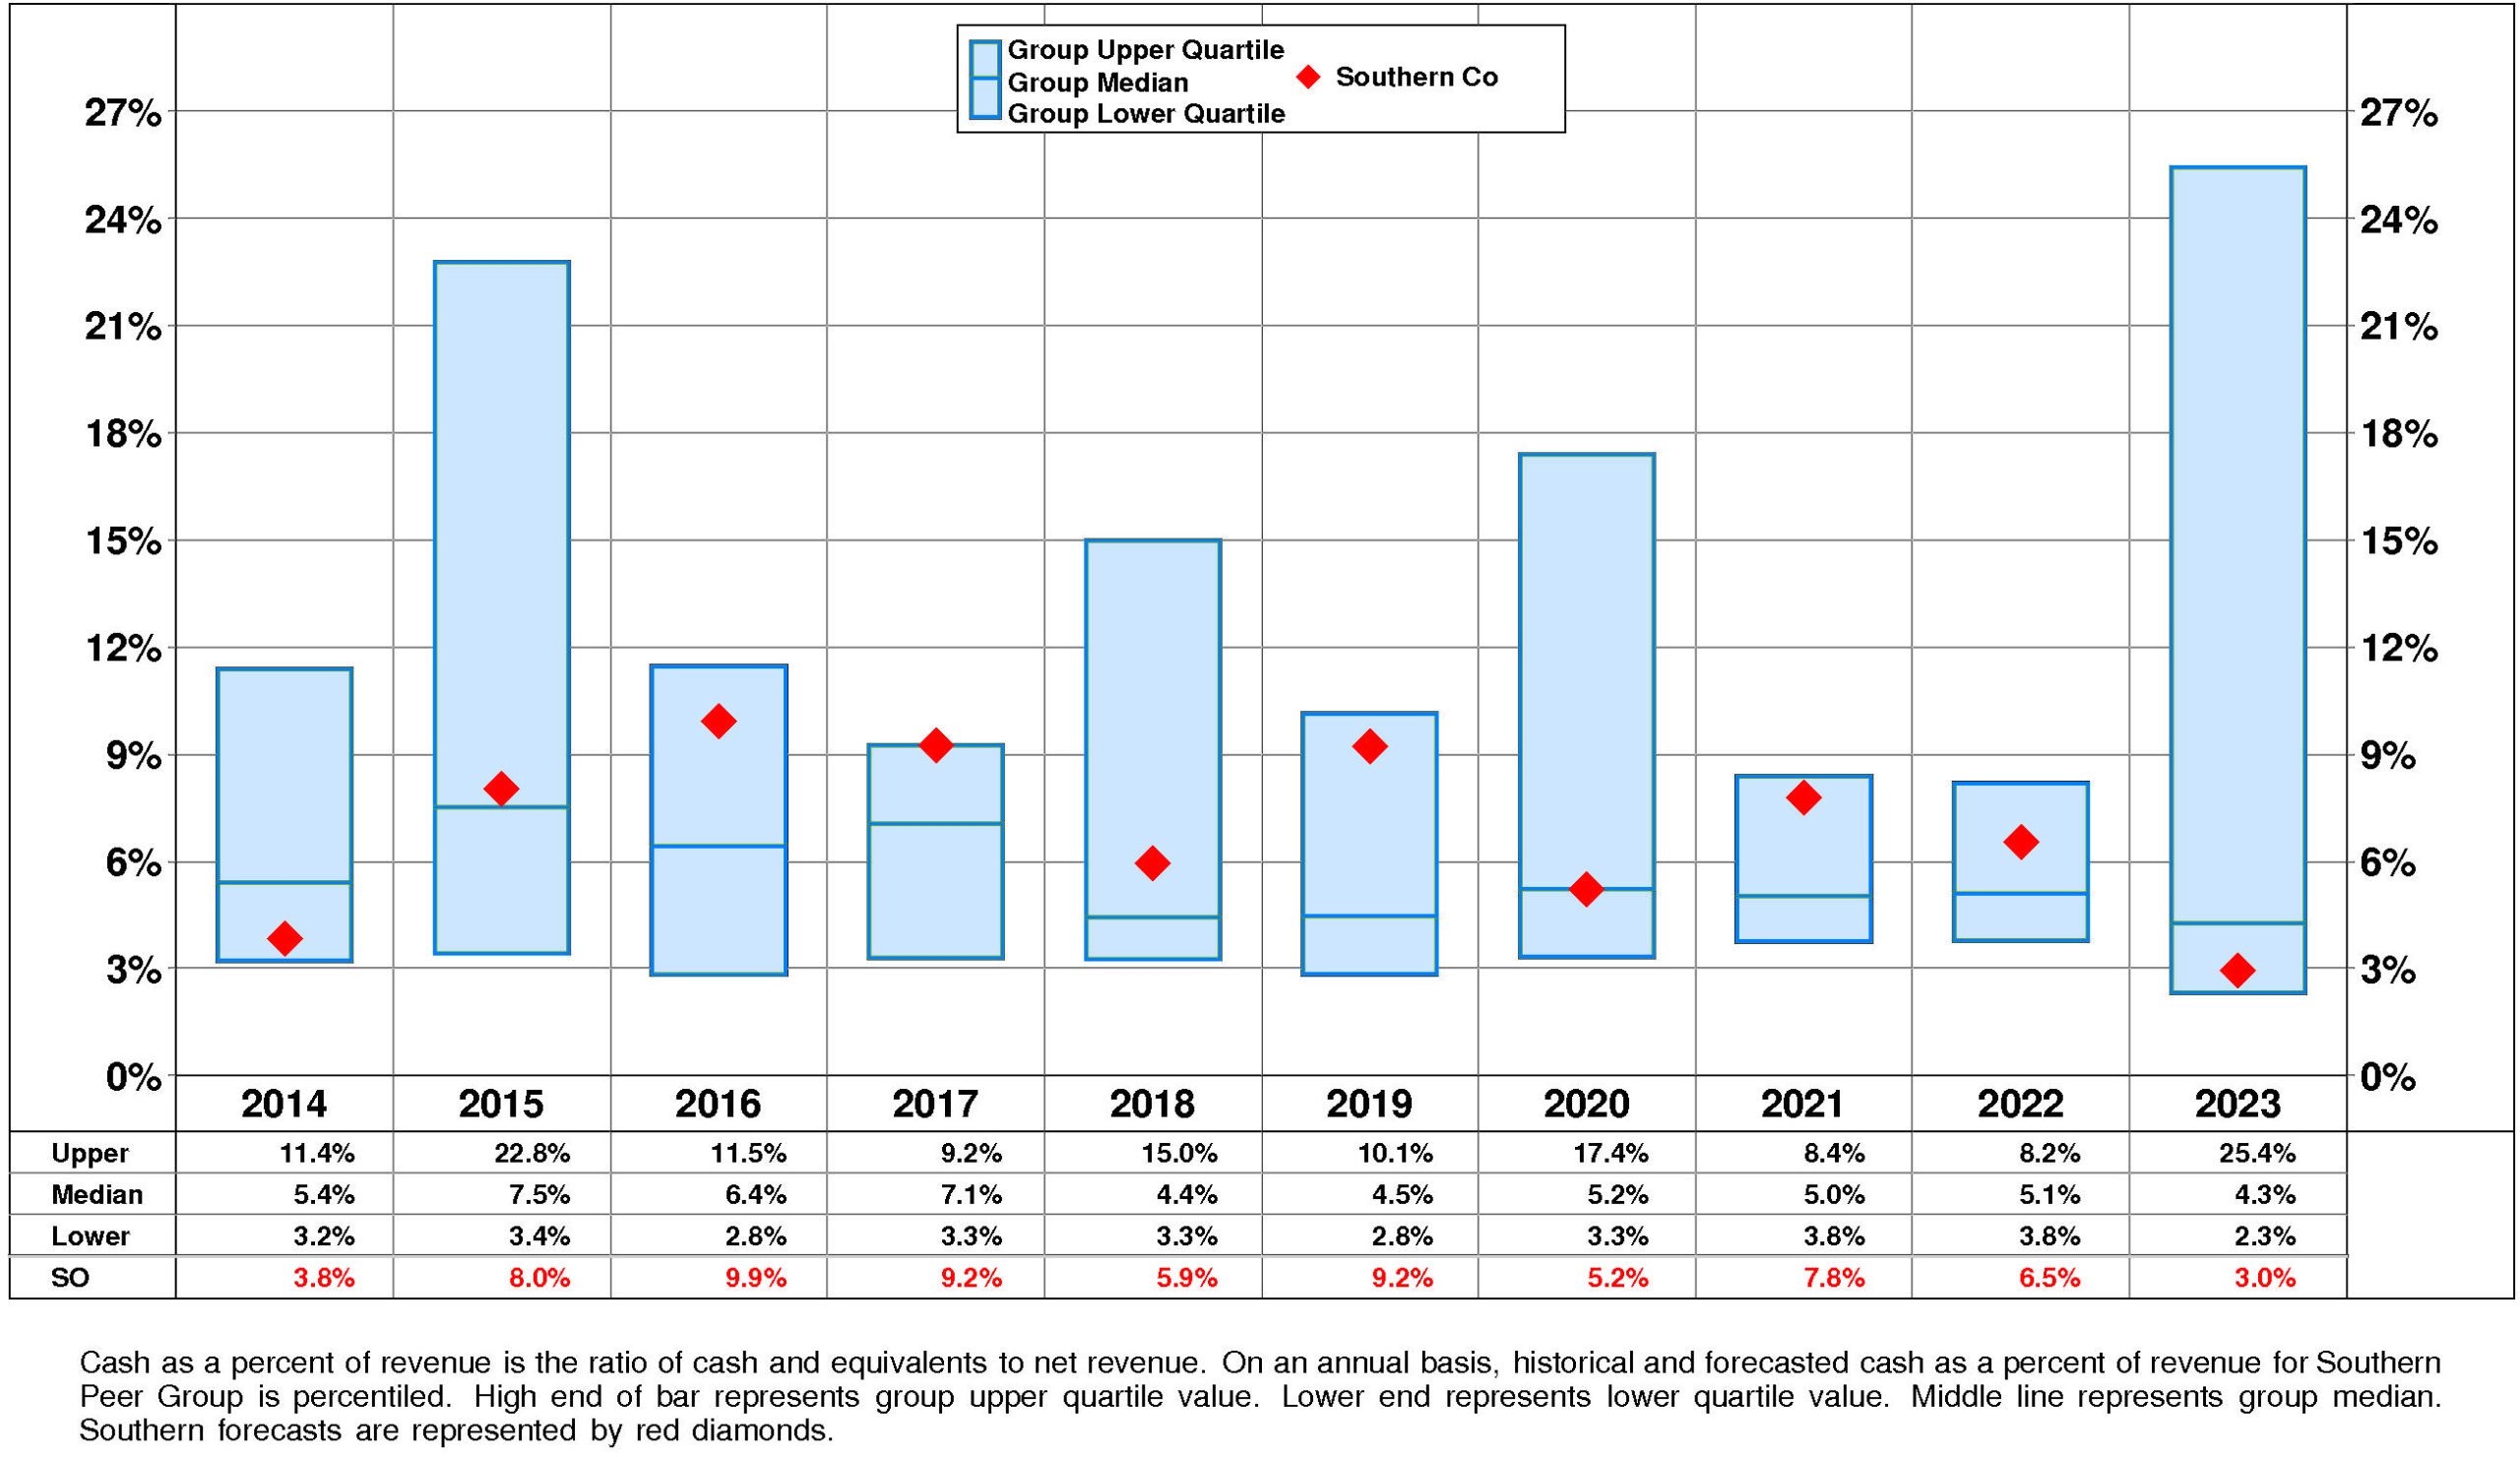
Southern’s Cash, %Revenue has exhibited little to no overall change over the period. This stability was accompanied by stability for the Southern Peer Group as well. In most years, Southern was in the second quartile and top quartile. Currently, Southern is below median at +3%.
PROFITABILITY
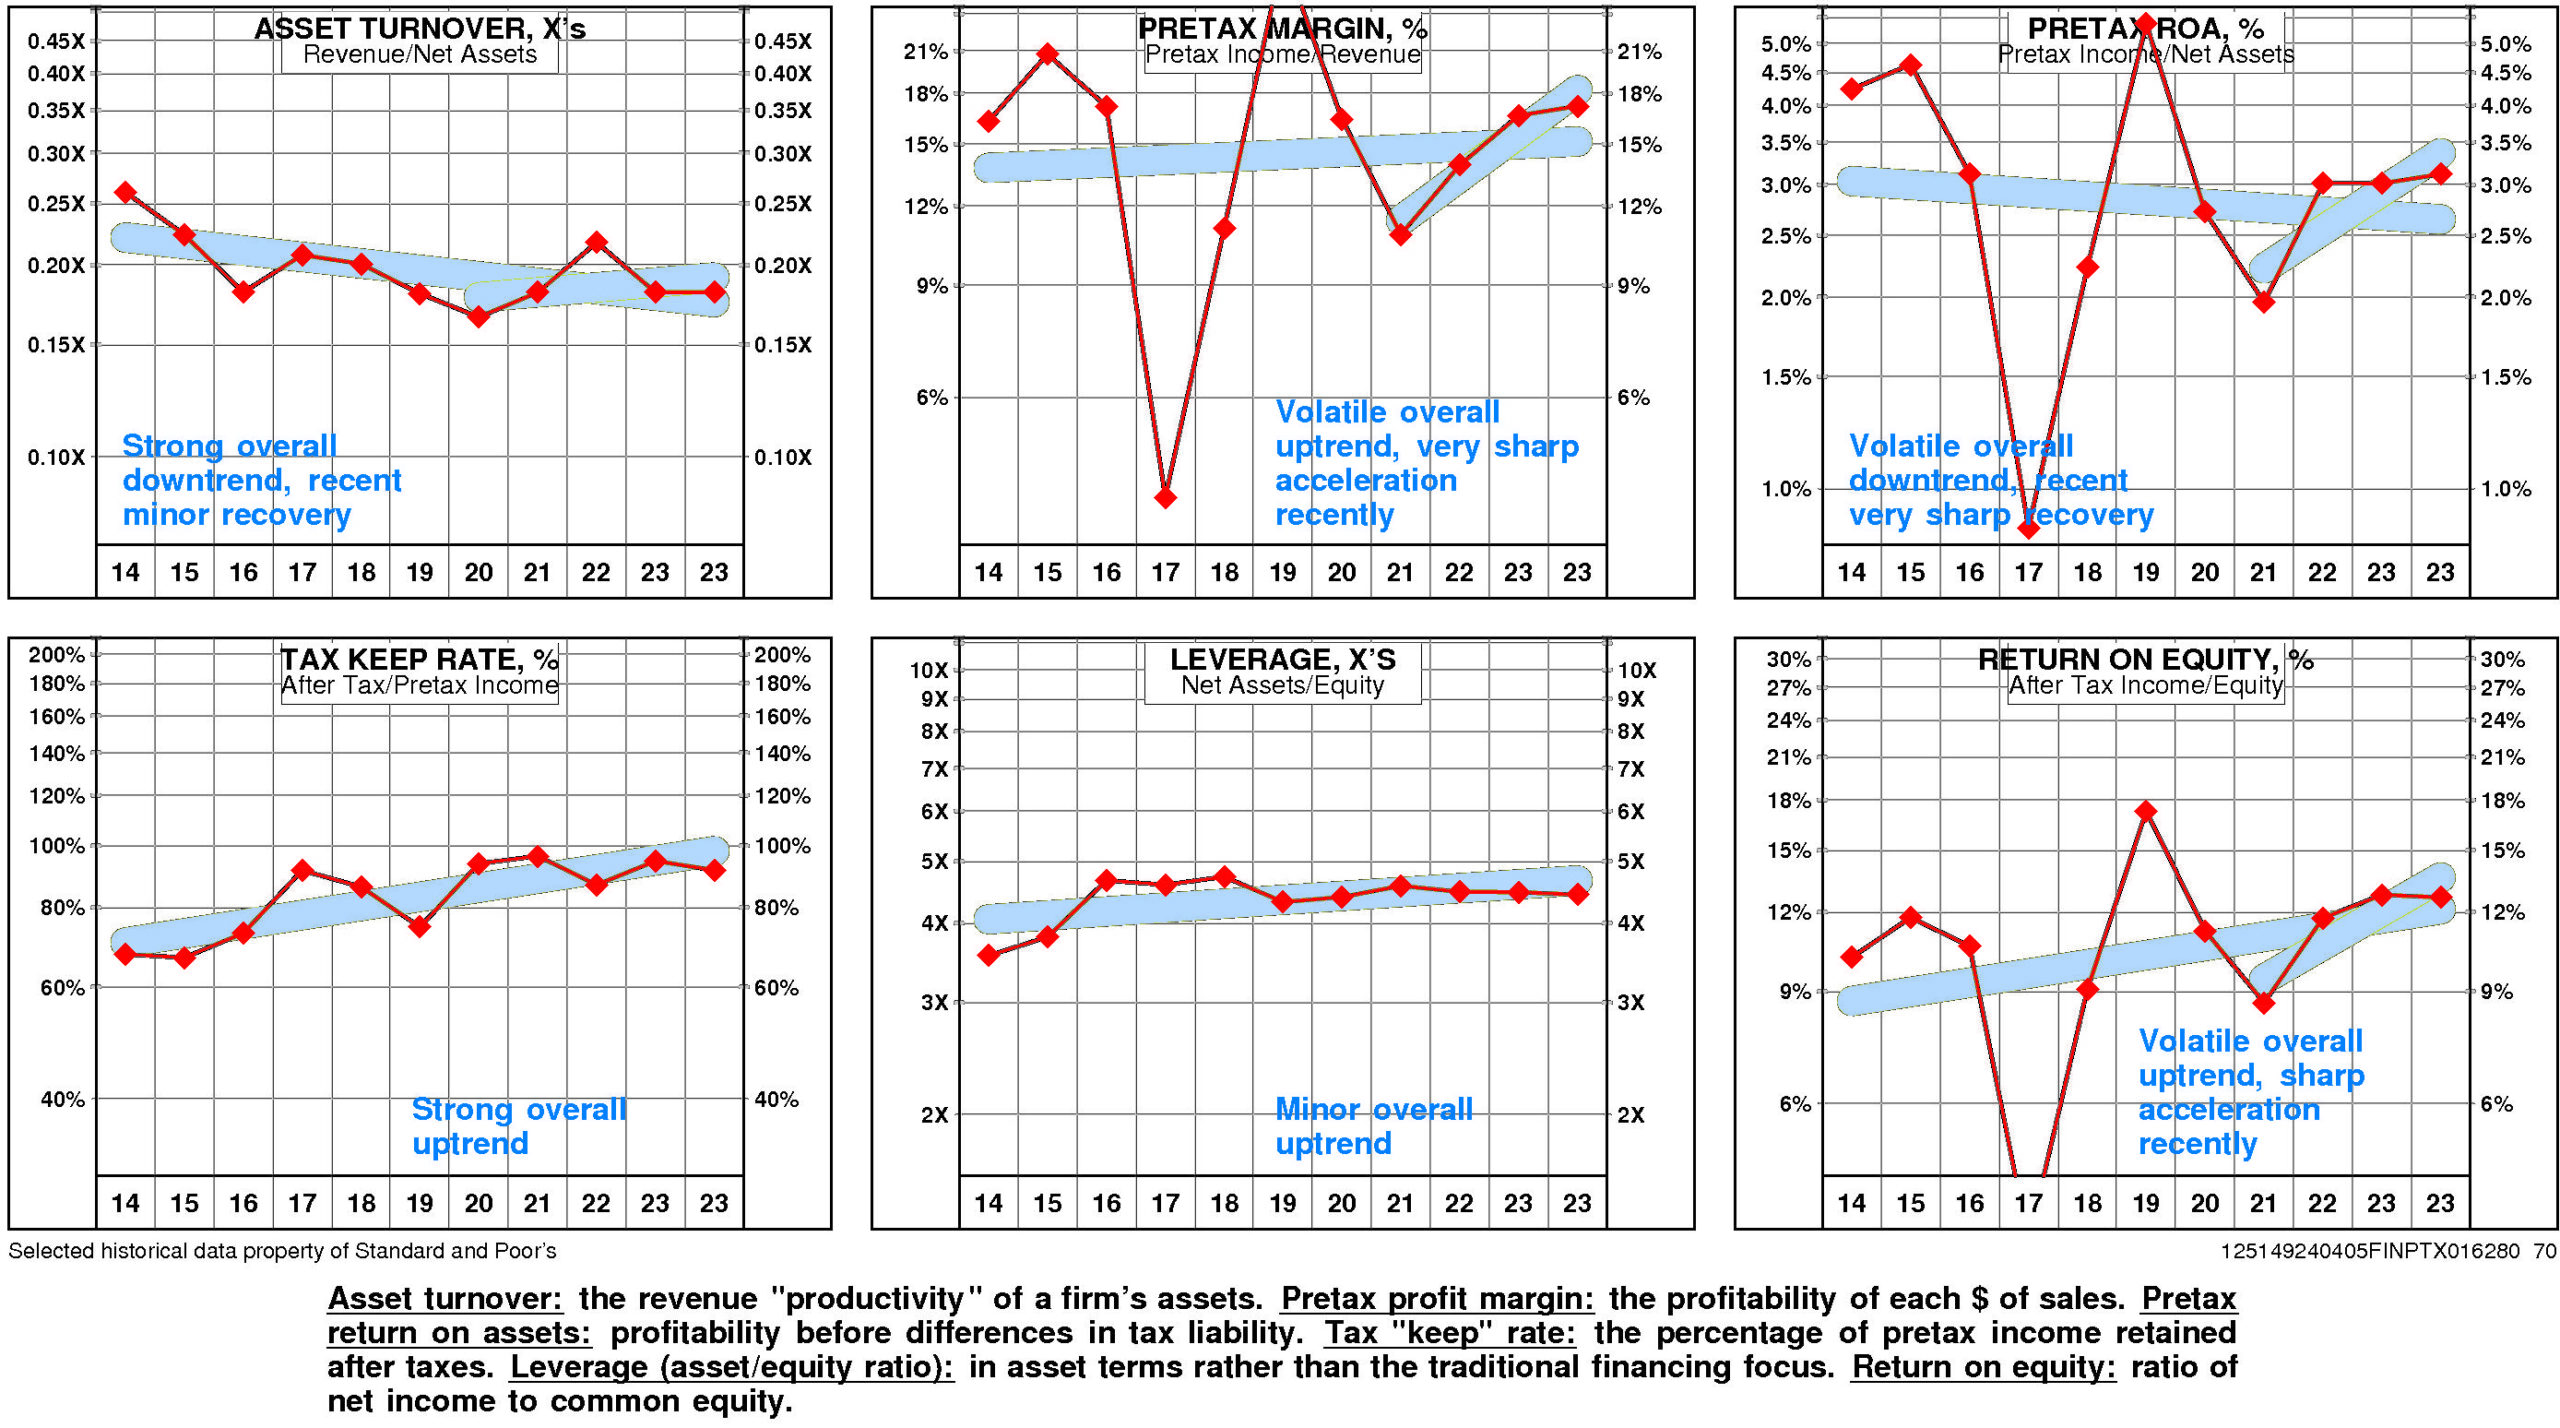
Southern’s return on equity has improved significantly since 2014. The current level of 12.6% is 1.24X the low for the period and is -26.8% from the high.
This significant improvement was due to small negative trend in pretax operating return offset by very strong positive trend in non-operating factors.
The productivity of Southern’s assets declined over the full period 2014-2023: asset turnover has suffered a strong overall downtrend even as it experienced a minor recovery after the 2020 low.
Partially offsetting this trend, however, pretax margin has exhibited a volatile overall uptrend that accelerated very sharply from the 2021 level.
Non-operating factors (income taxes and financial leverage) had a very significant positive influence on return on equity.
Southern’s return on equity is upper quartile (12.6%) for the four quarters ended December, 2023.
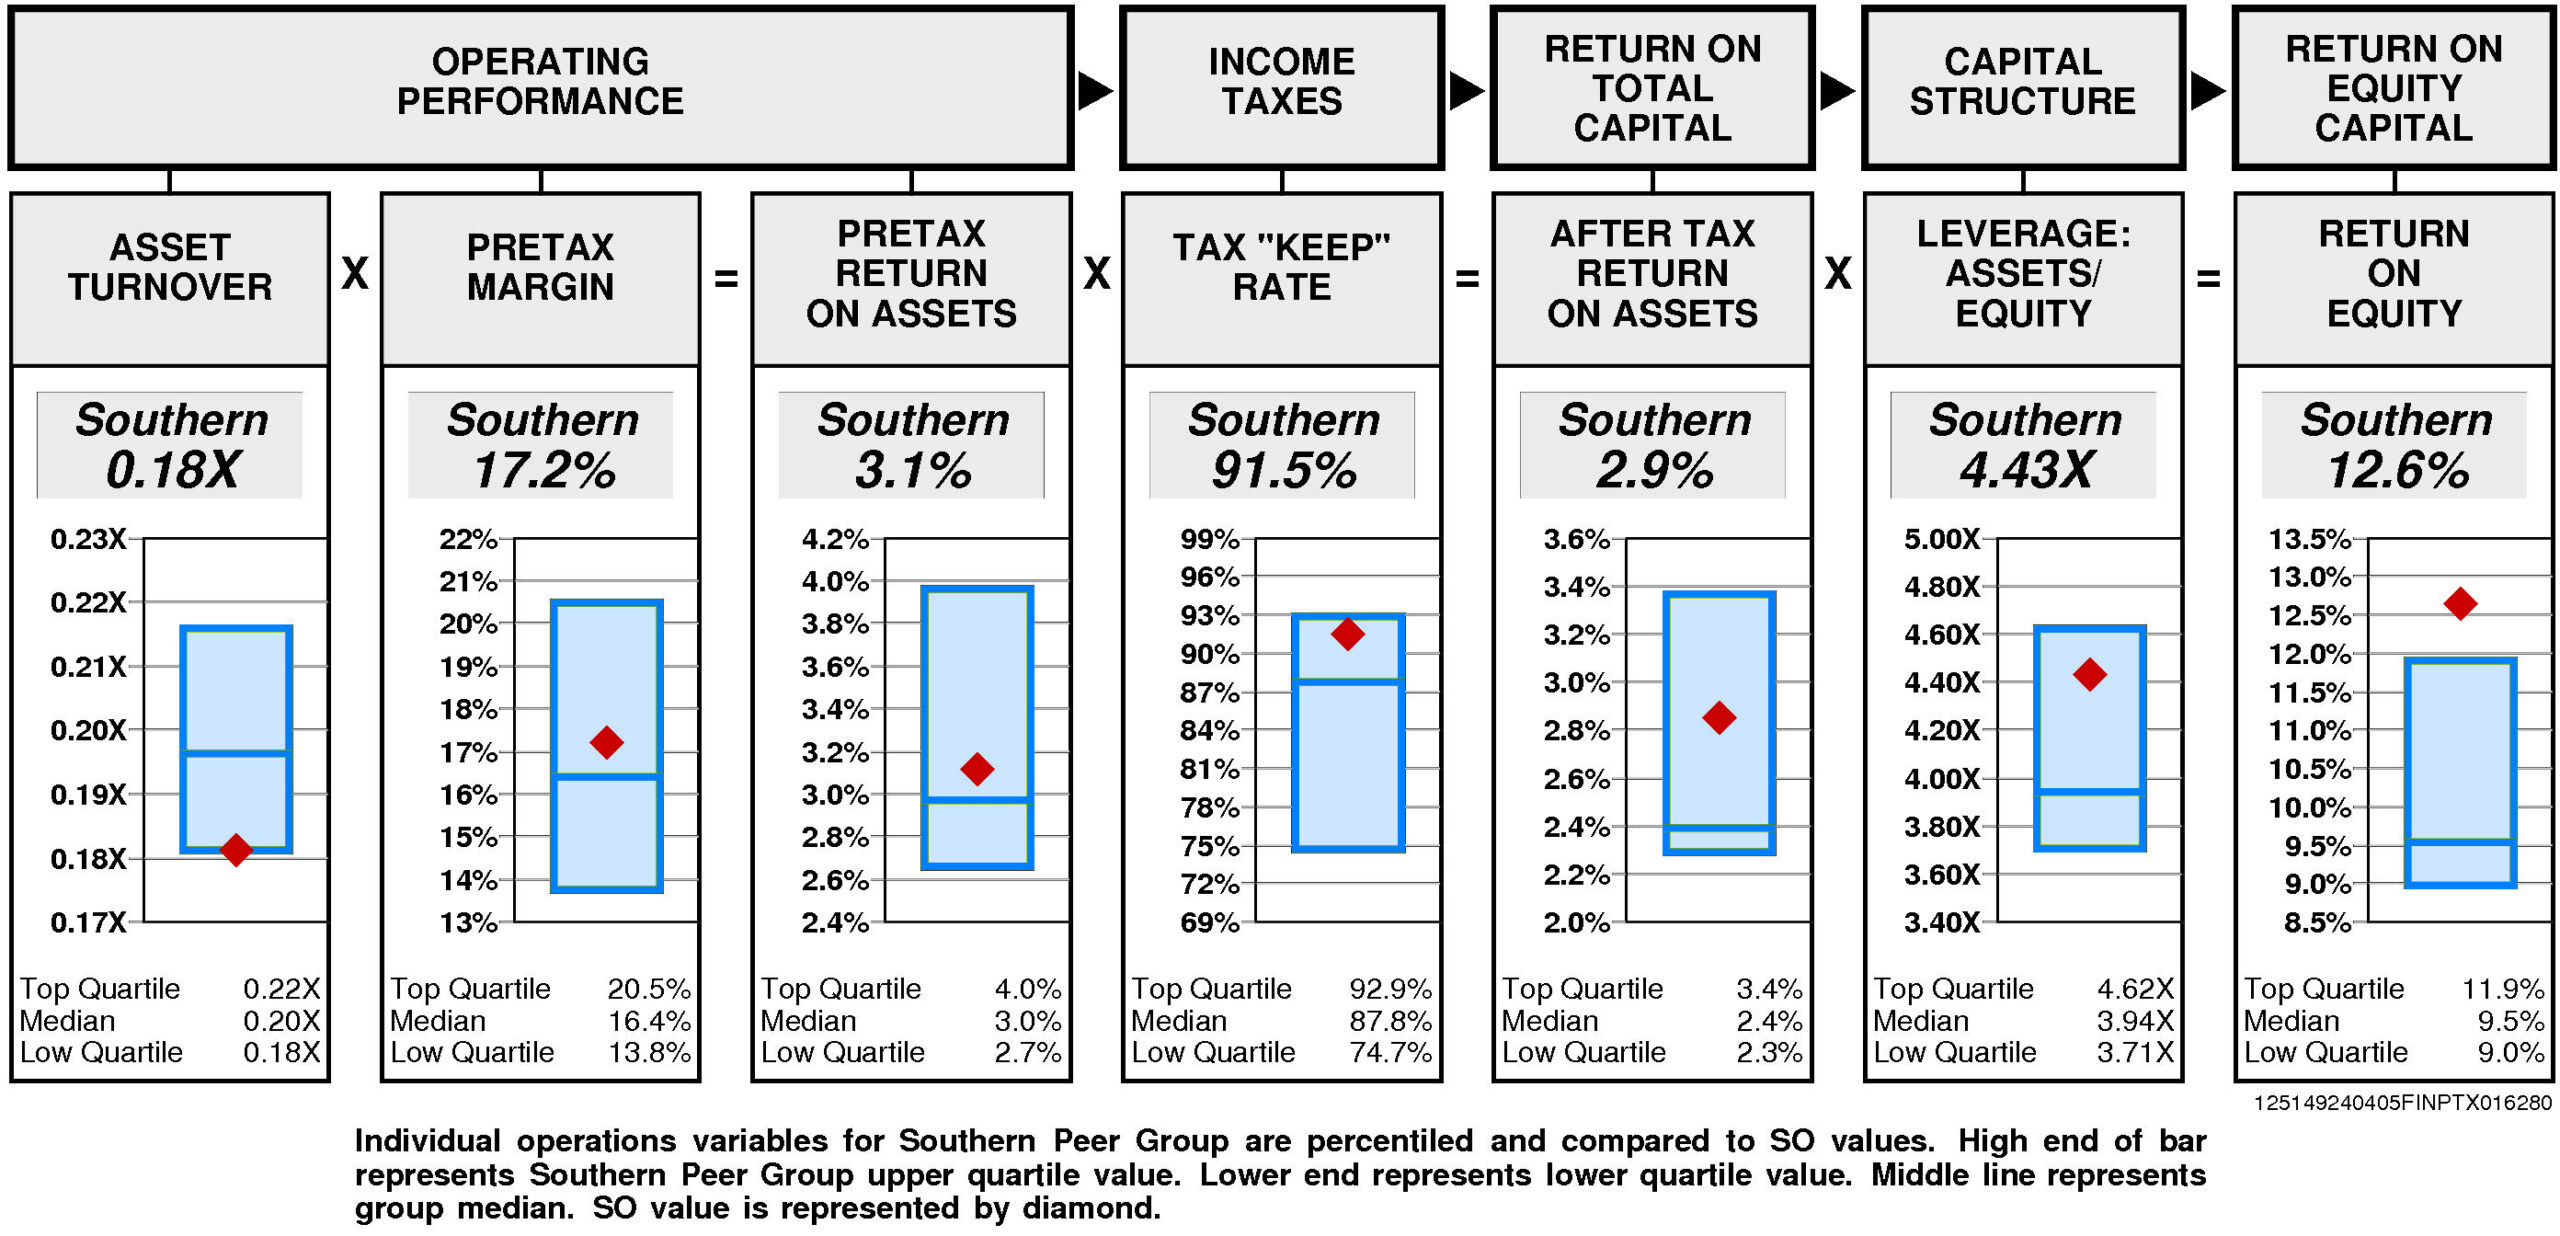
Operating performance (pretax return on assets) is slightly above median (3.1%) reflecting asset turnover that is at the lower quartile (0.18X) and slightly above median pretax margin (17.2%).
Tax “keep” rate (income tax management) is at the upper quartile (91.5%) resulting in after tax return on assets that is above median.
Financial leverage (leverage) is above median (4.43X).
GROWTH RATES
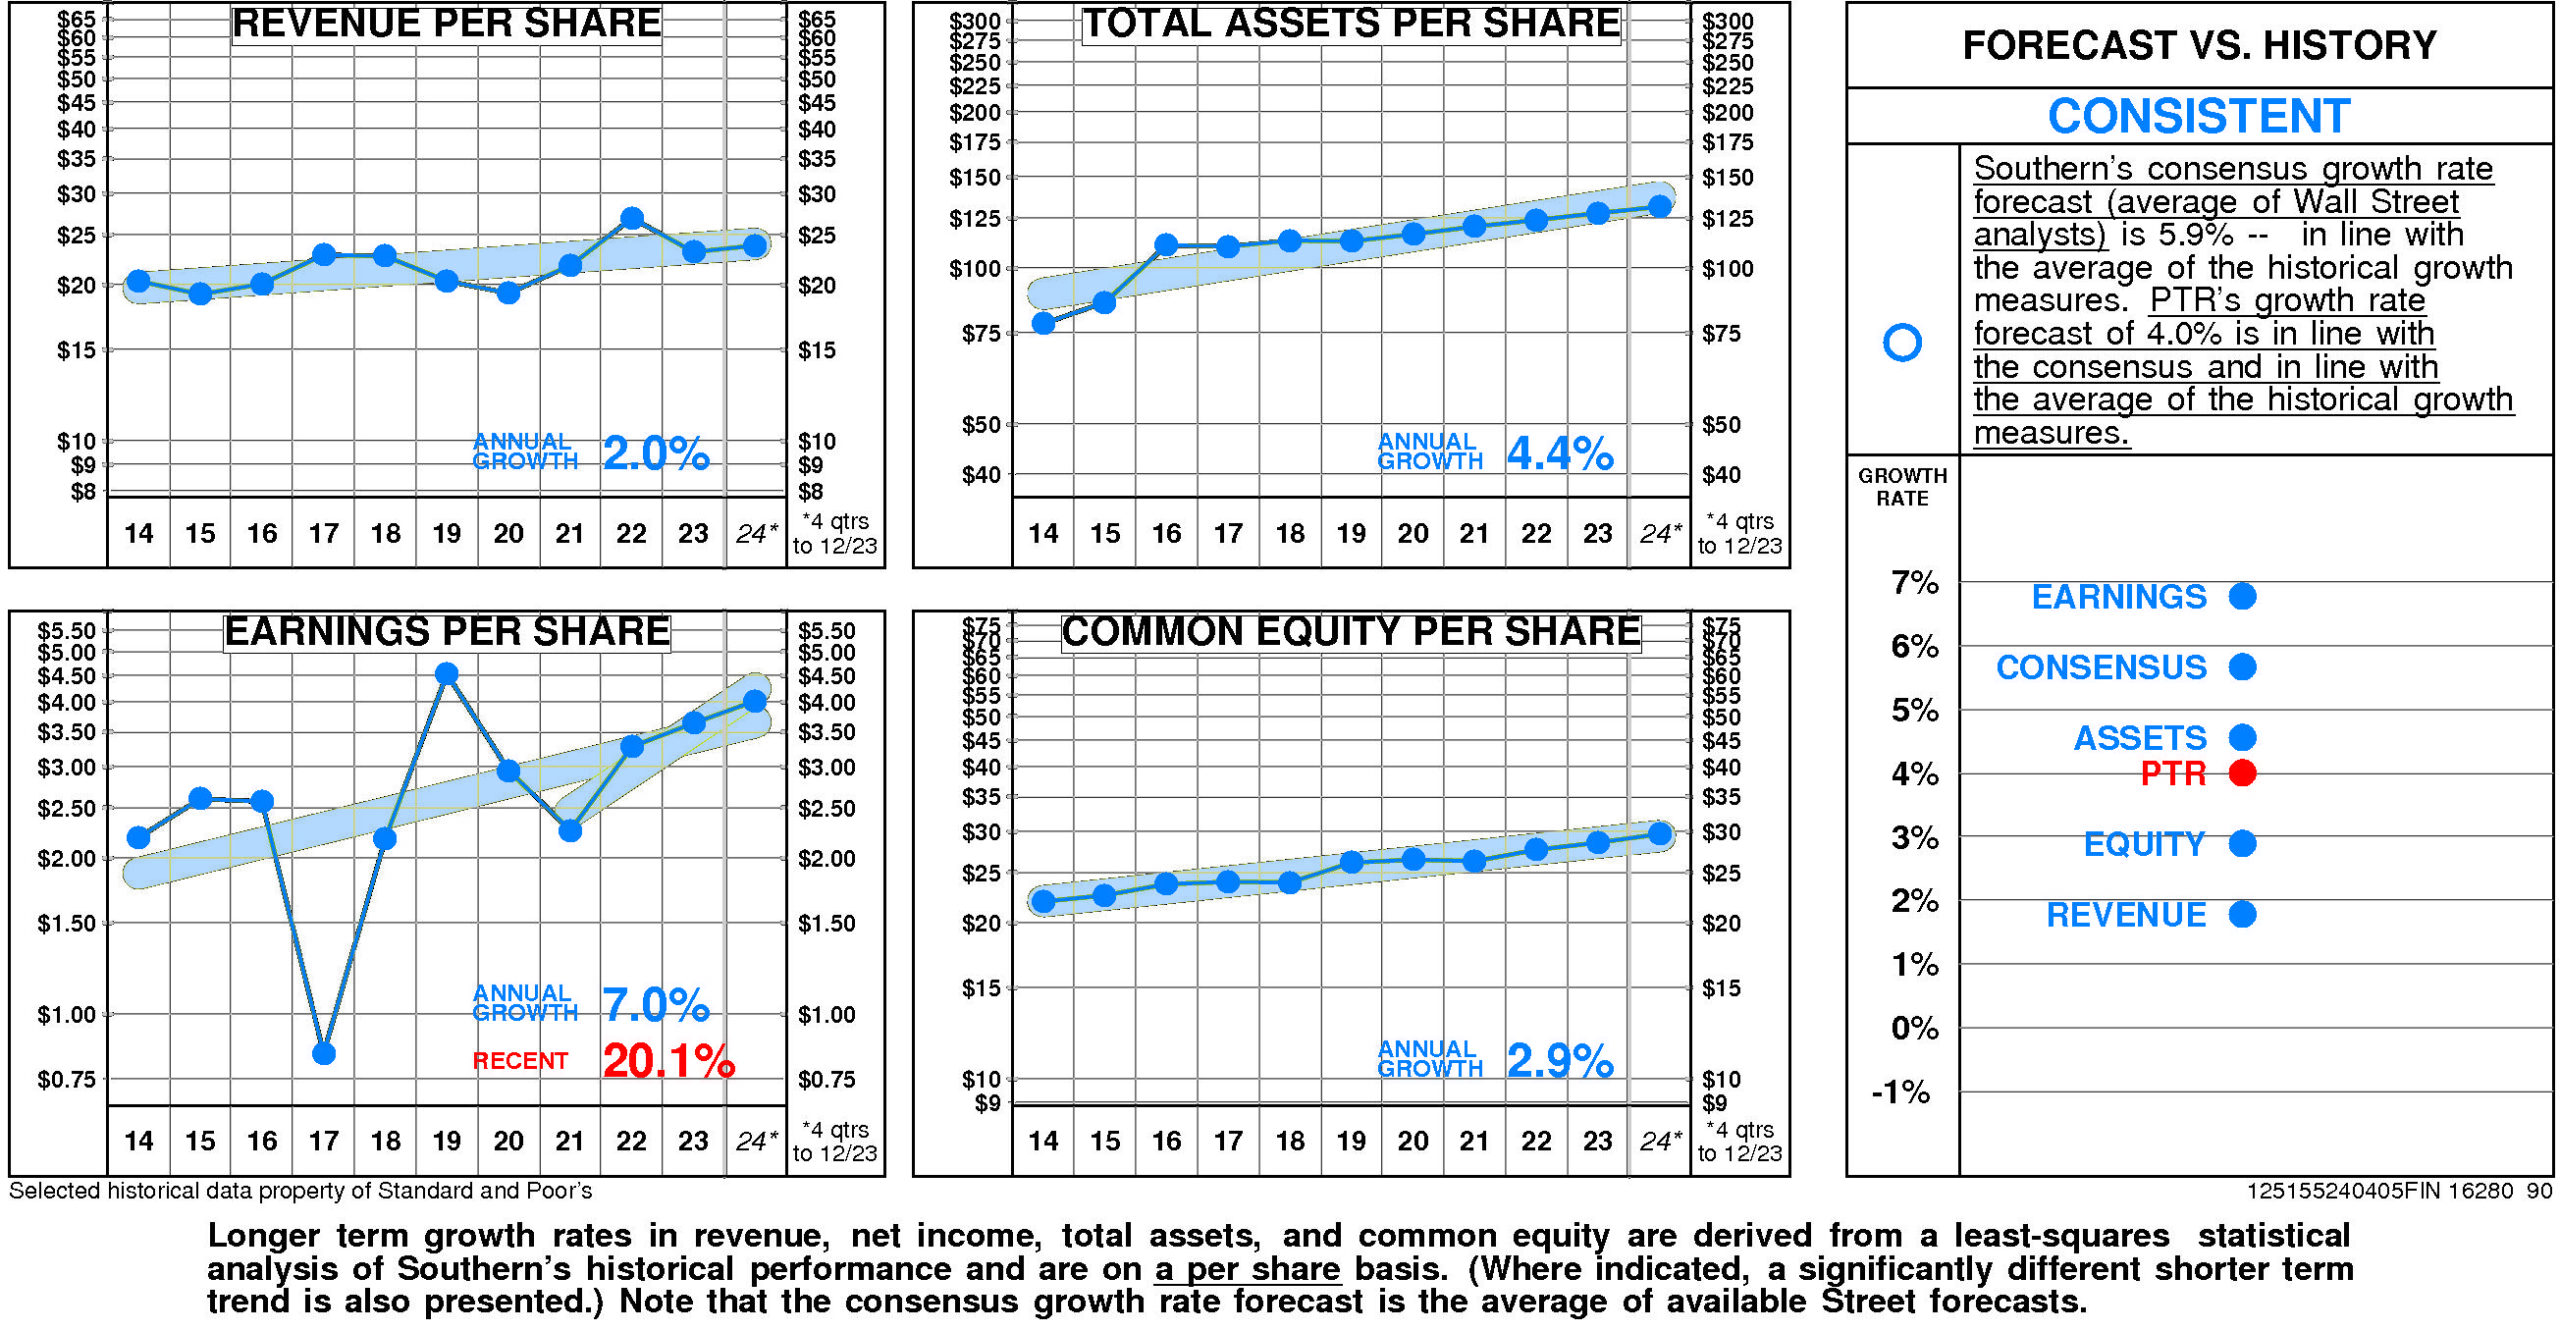
There are no significant differences between Southern’s longer term growth and growth in recent years.
Southern’s historical income statement growth has been in line with balance sheet growth. Revenue growth has paralleled asset growth; earnings growth has paralleled equity growth.
Annual revenue growth has been 2.0% per year.
Total asset growth has been 4.4% per year.
Annual E.P.S. growth has been 7.0% per year. (More recently it has been 20.1%.)
Equity growth has been 2.9% per year.
Southern’s consensus growth rate forecast (average of Wall Street analysts) is 5.9% — in line with the average of the historical growth measures.
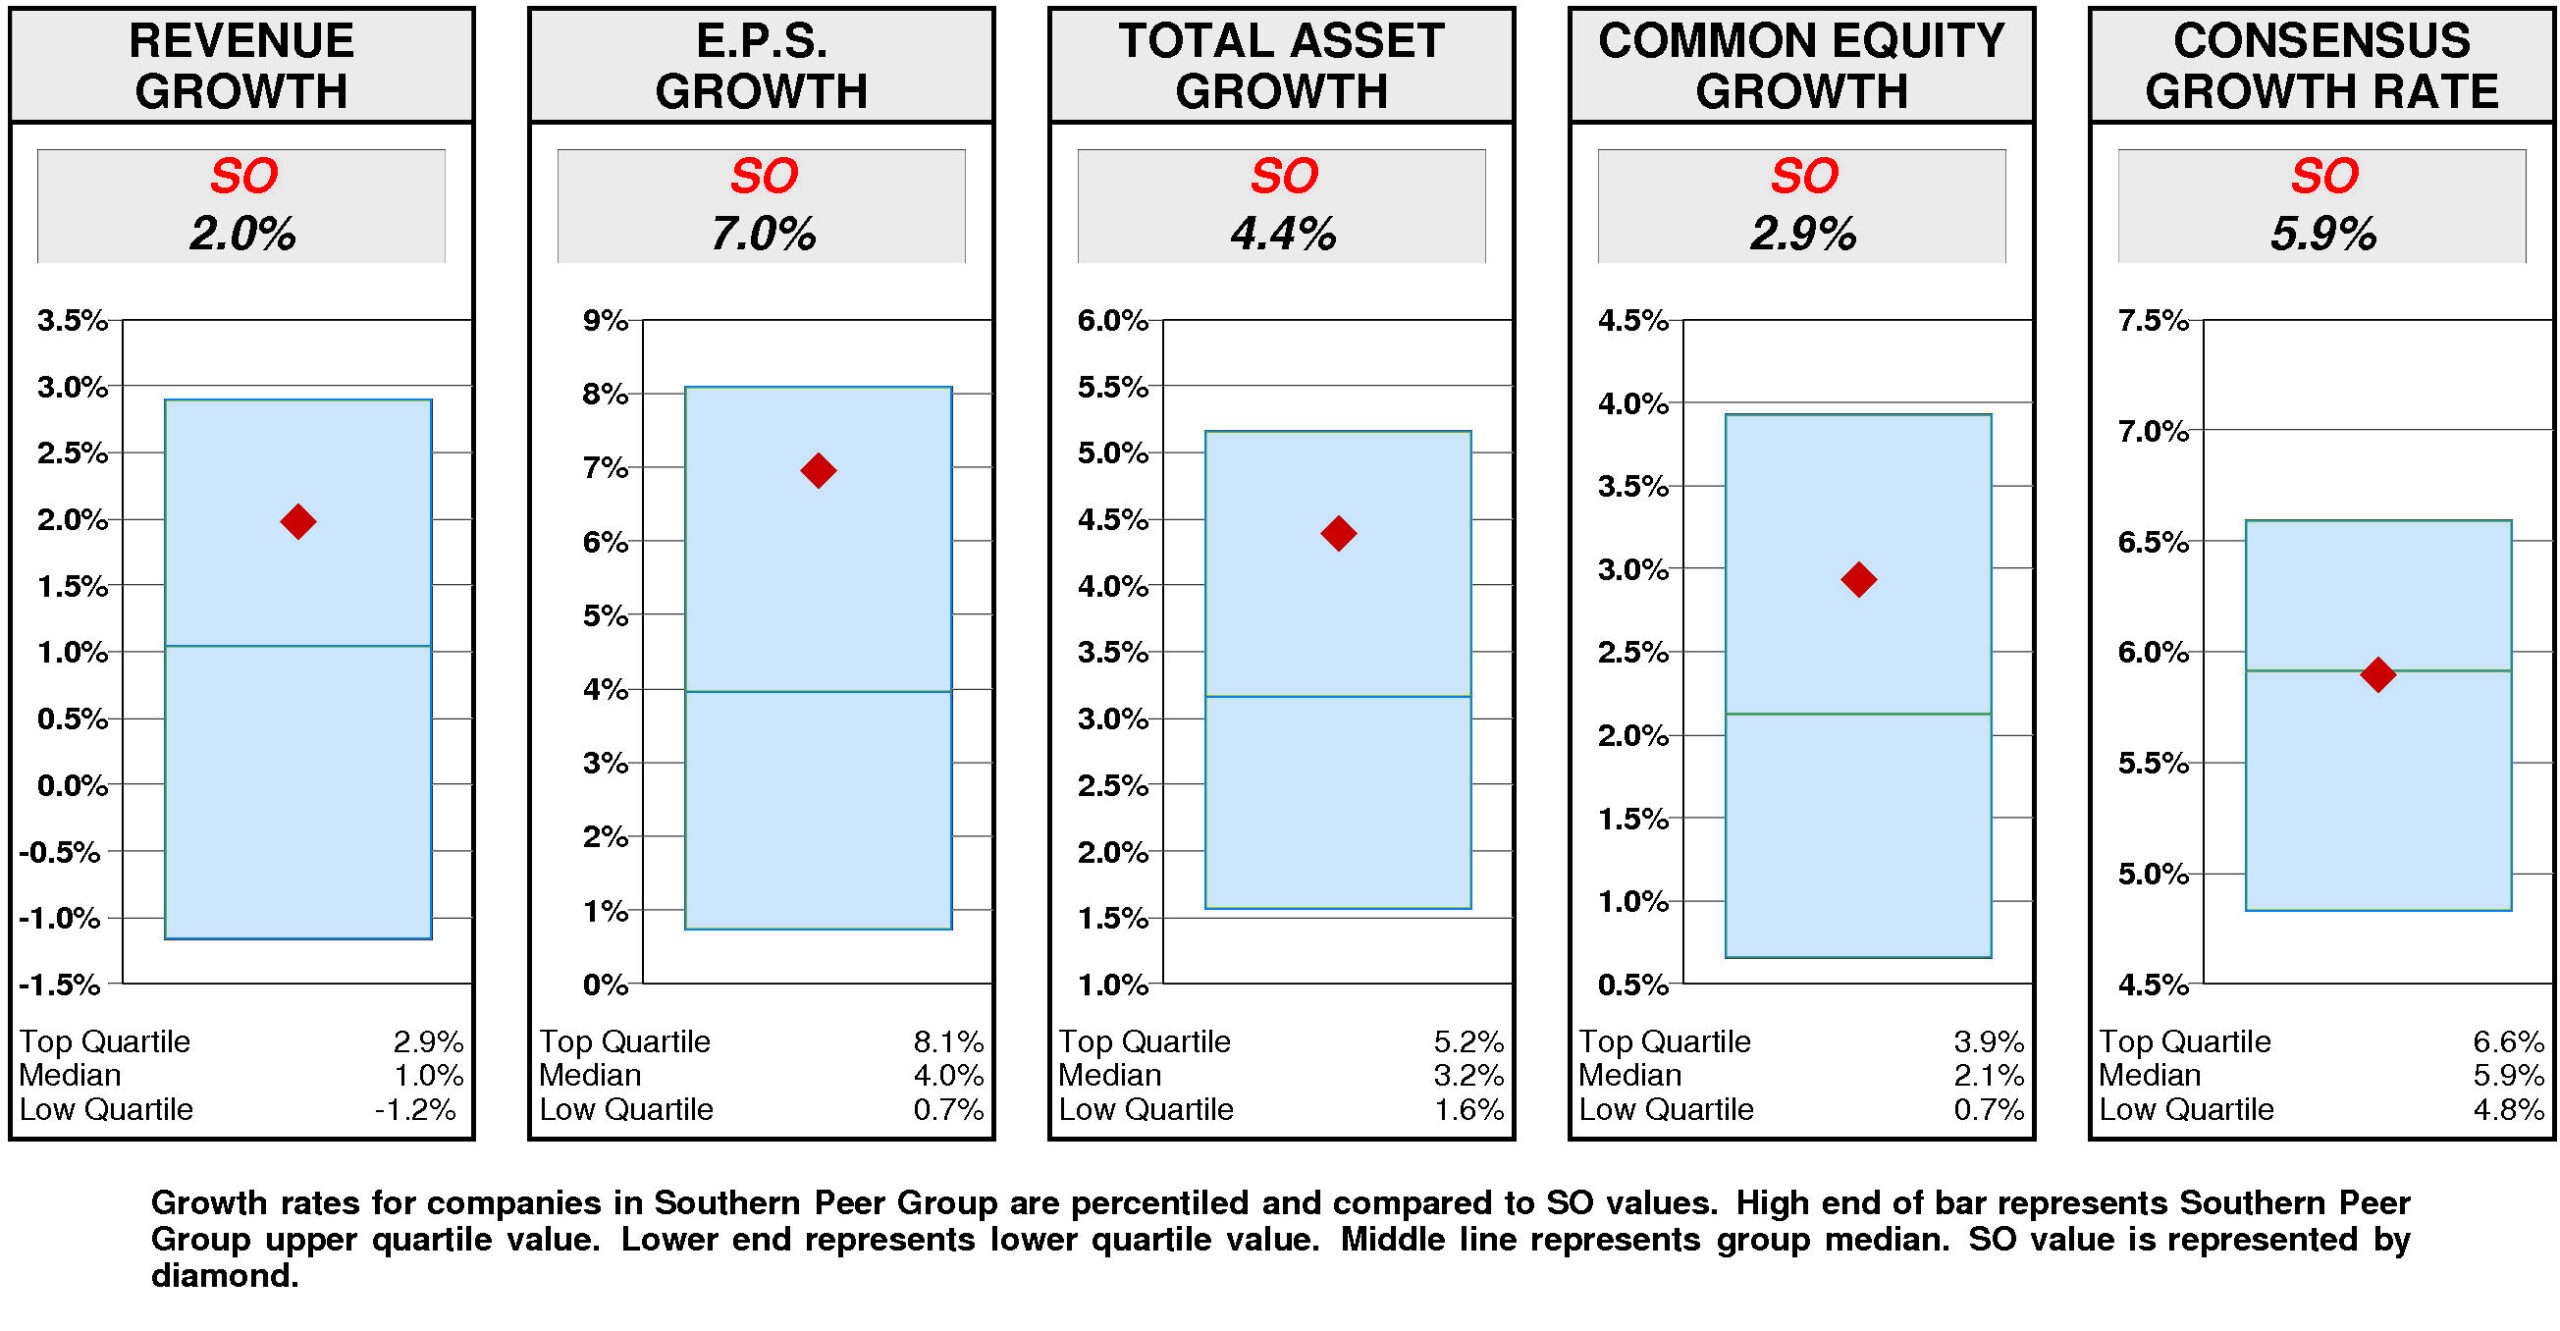
Relative to the Southern Peer Group, Southern’s historical growth measures are consistently second quartile. Revenue growth (2.0%) has been above median. Total asset growth (4.4%) has been above median. E.P.S. growth (7.0%) has been above median. Equity growth (2.9%) has been above median.
In agreement with this pattern, consensus growth forecast (5.9%) is at median.
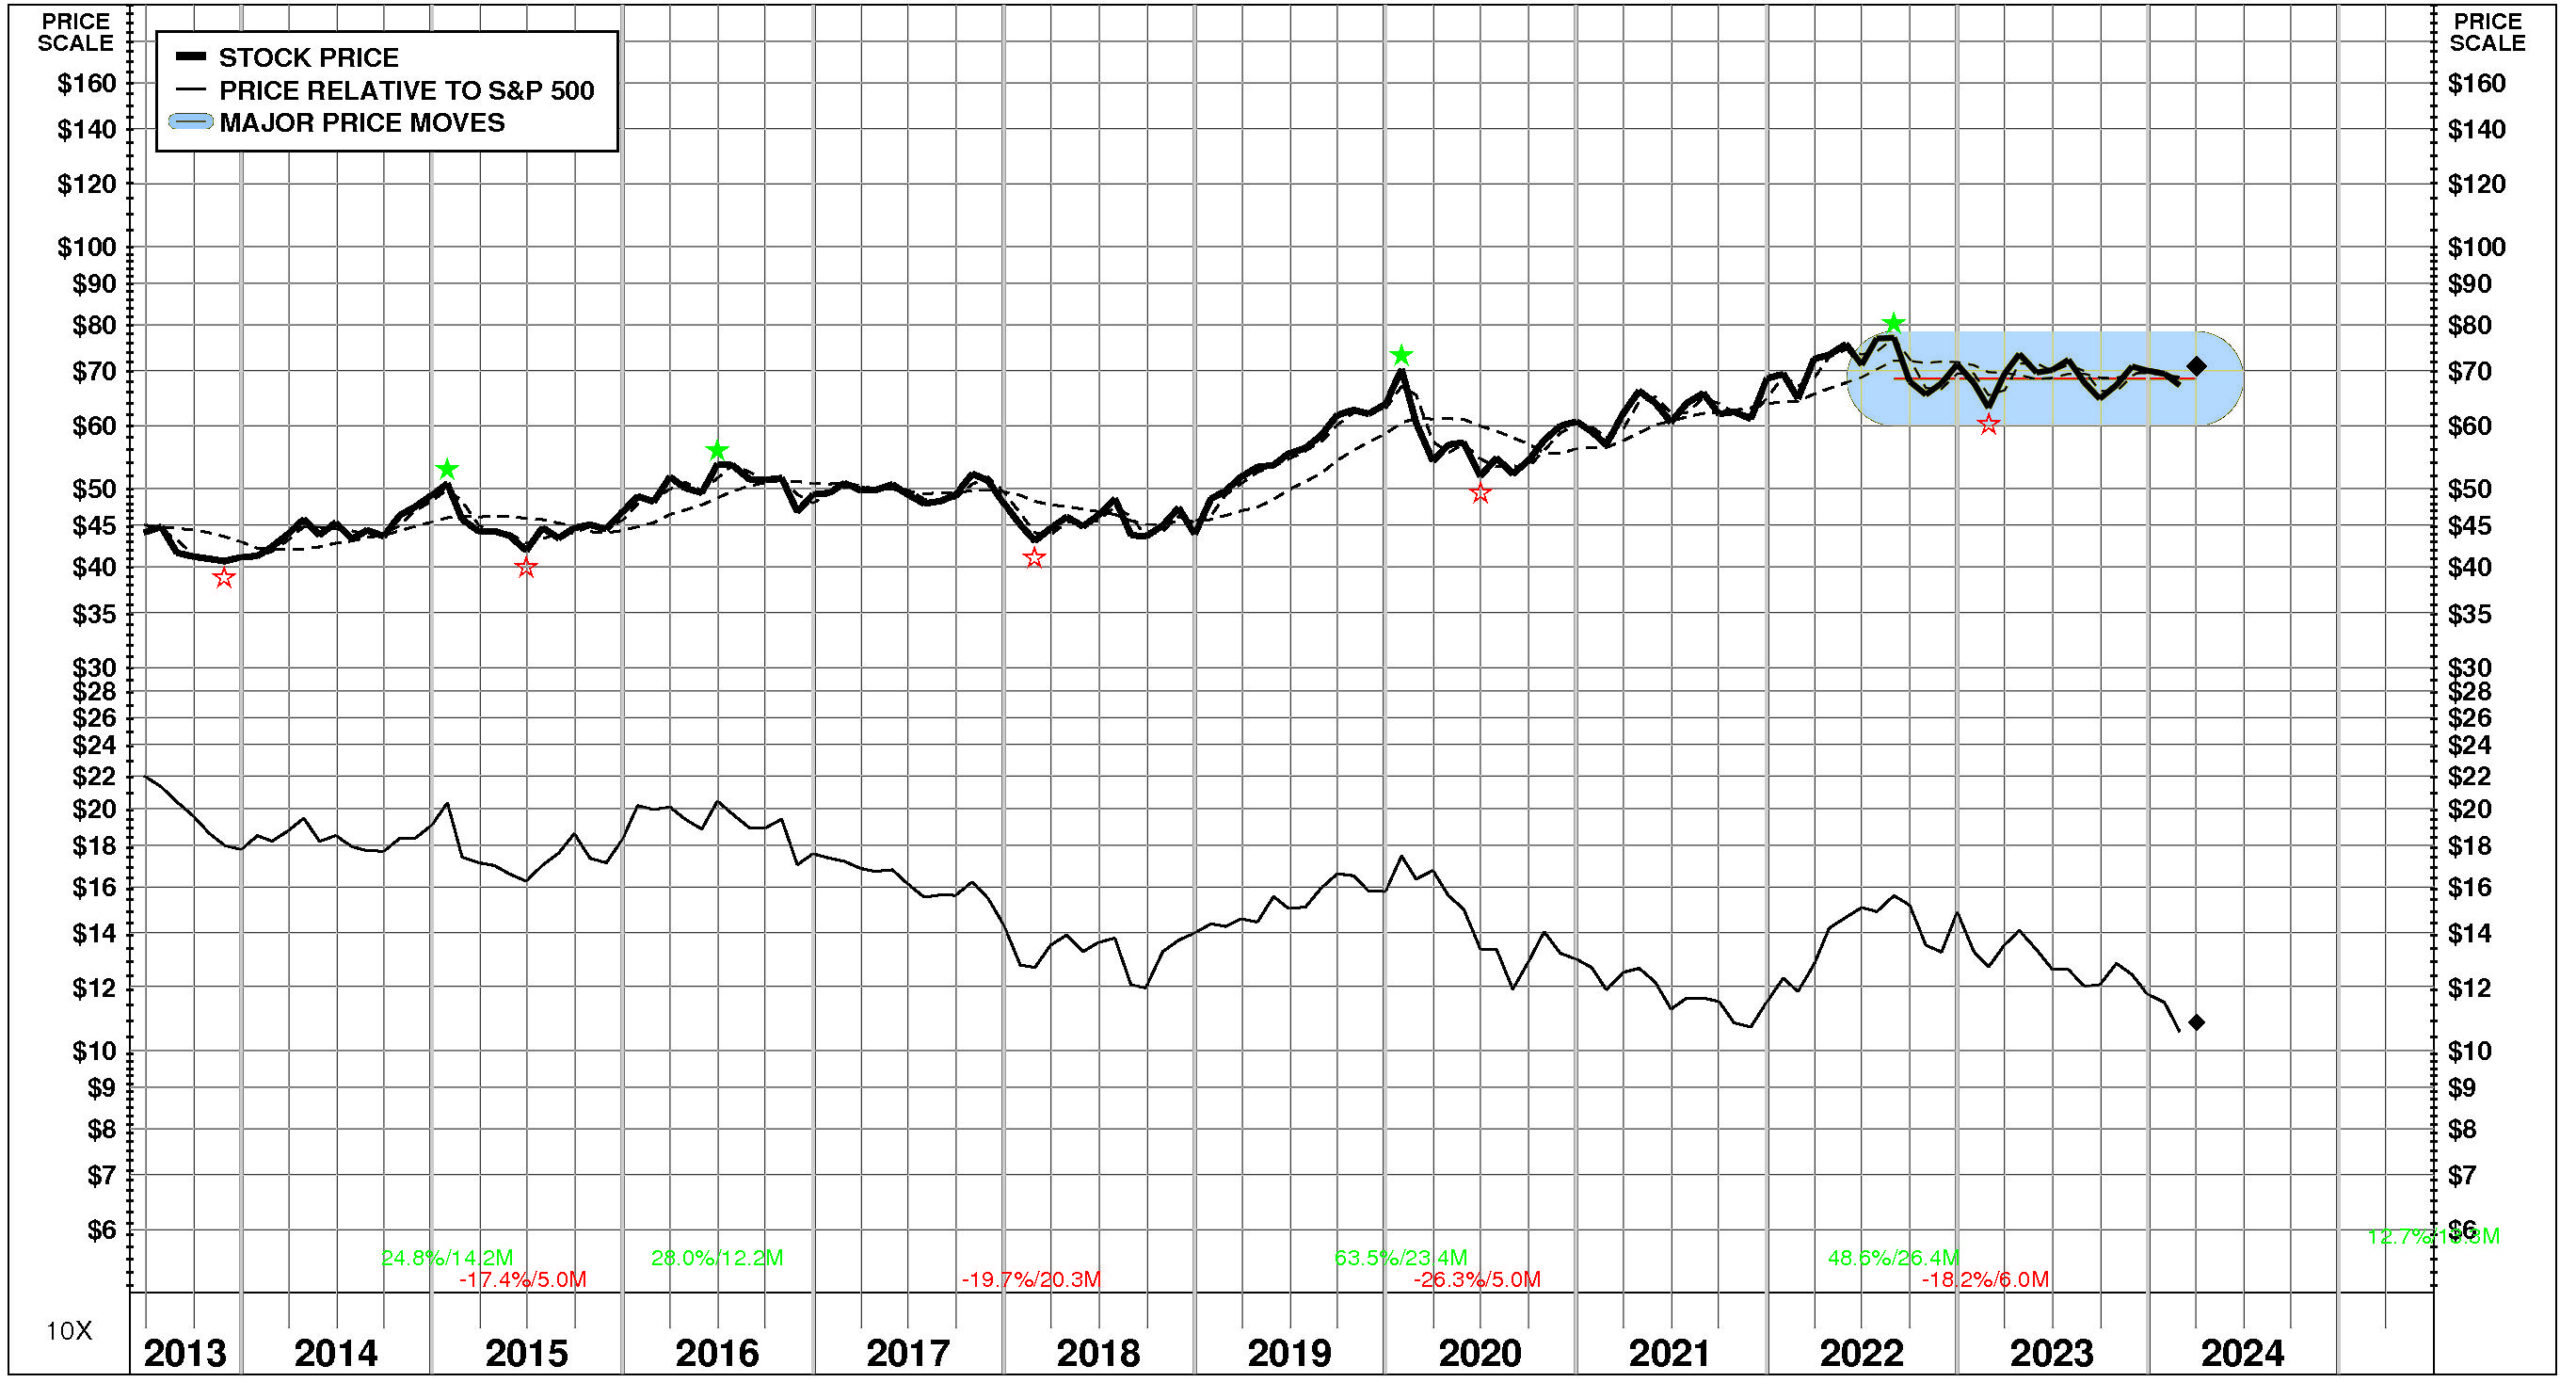
PRICE HISTORY
Over the full time period, Southern’s stock price performance has been significantly below market. Between June, 2013 and April, 2024, Southern’s stock price rose +61%; relative to the market, this was a -51% loss.
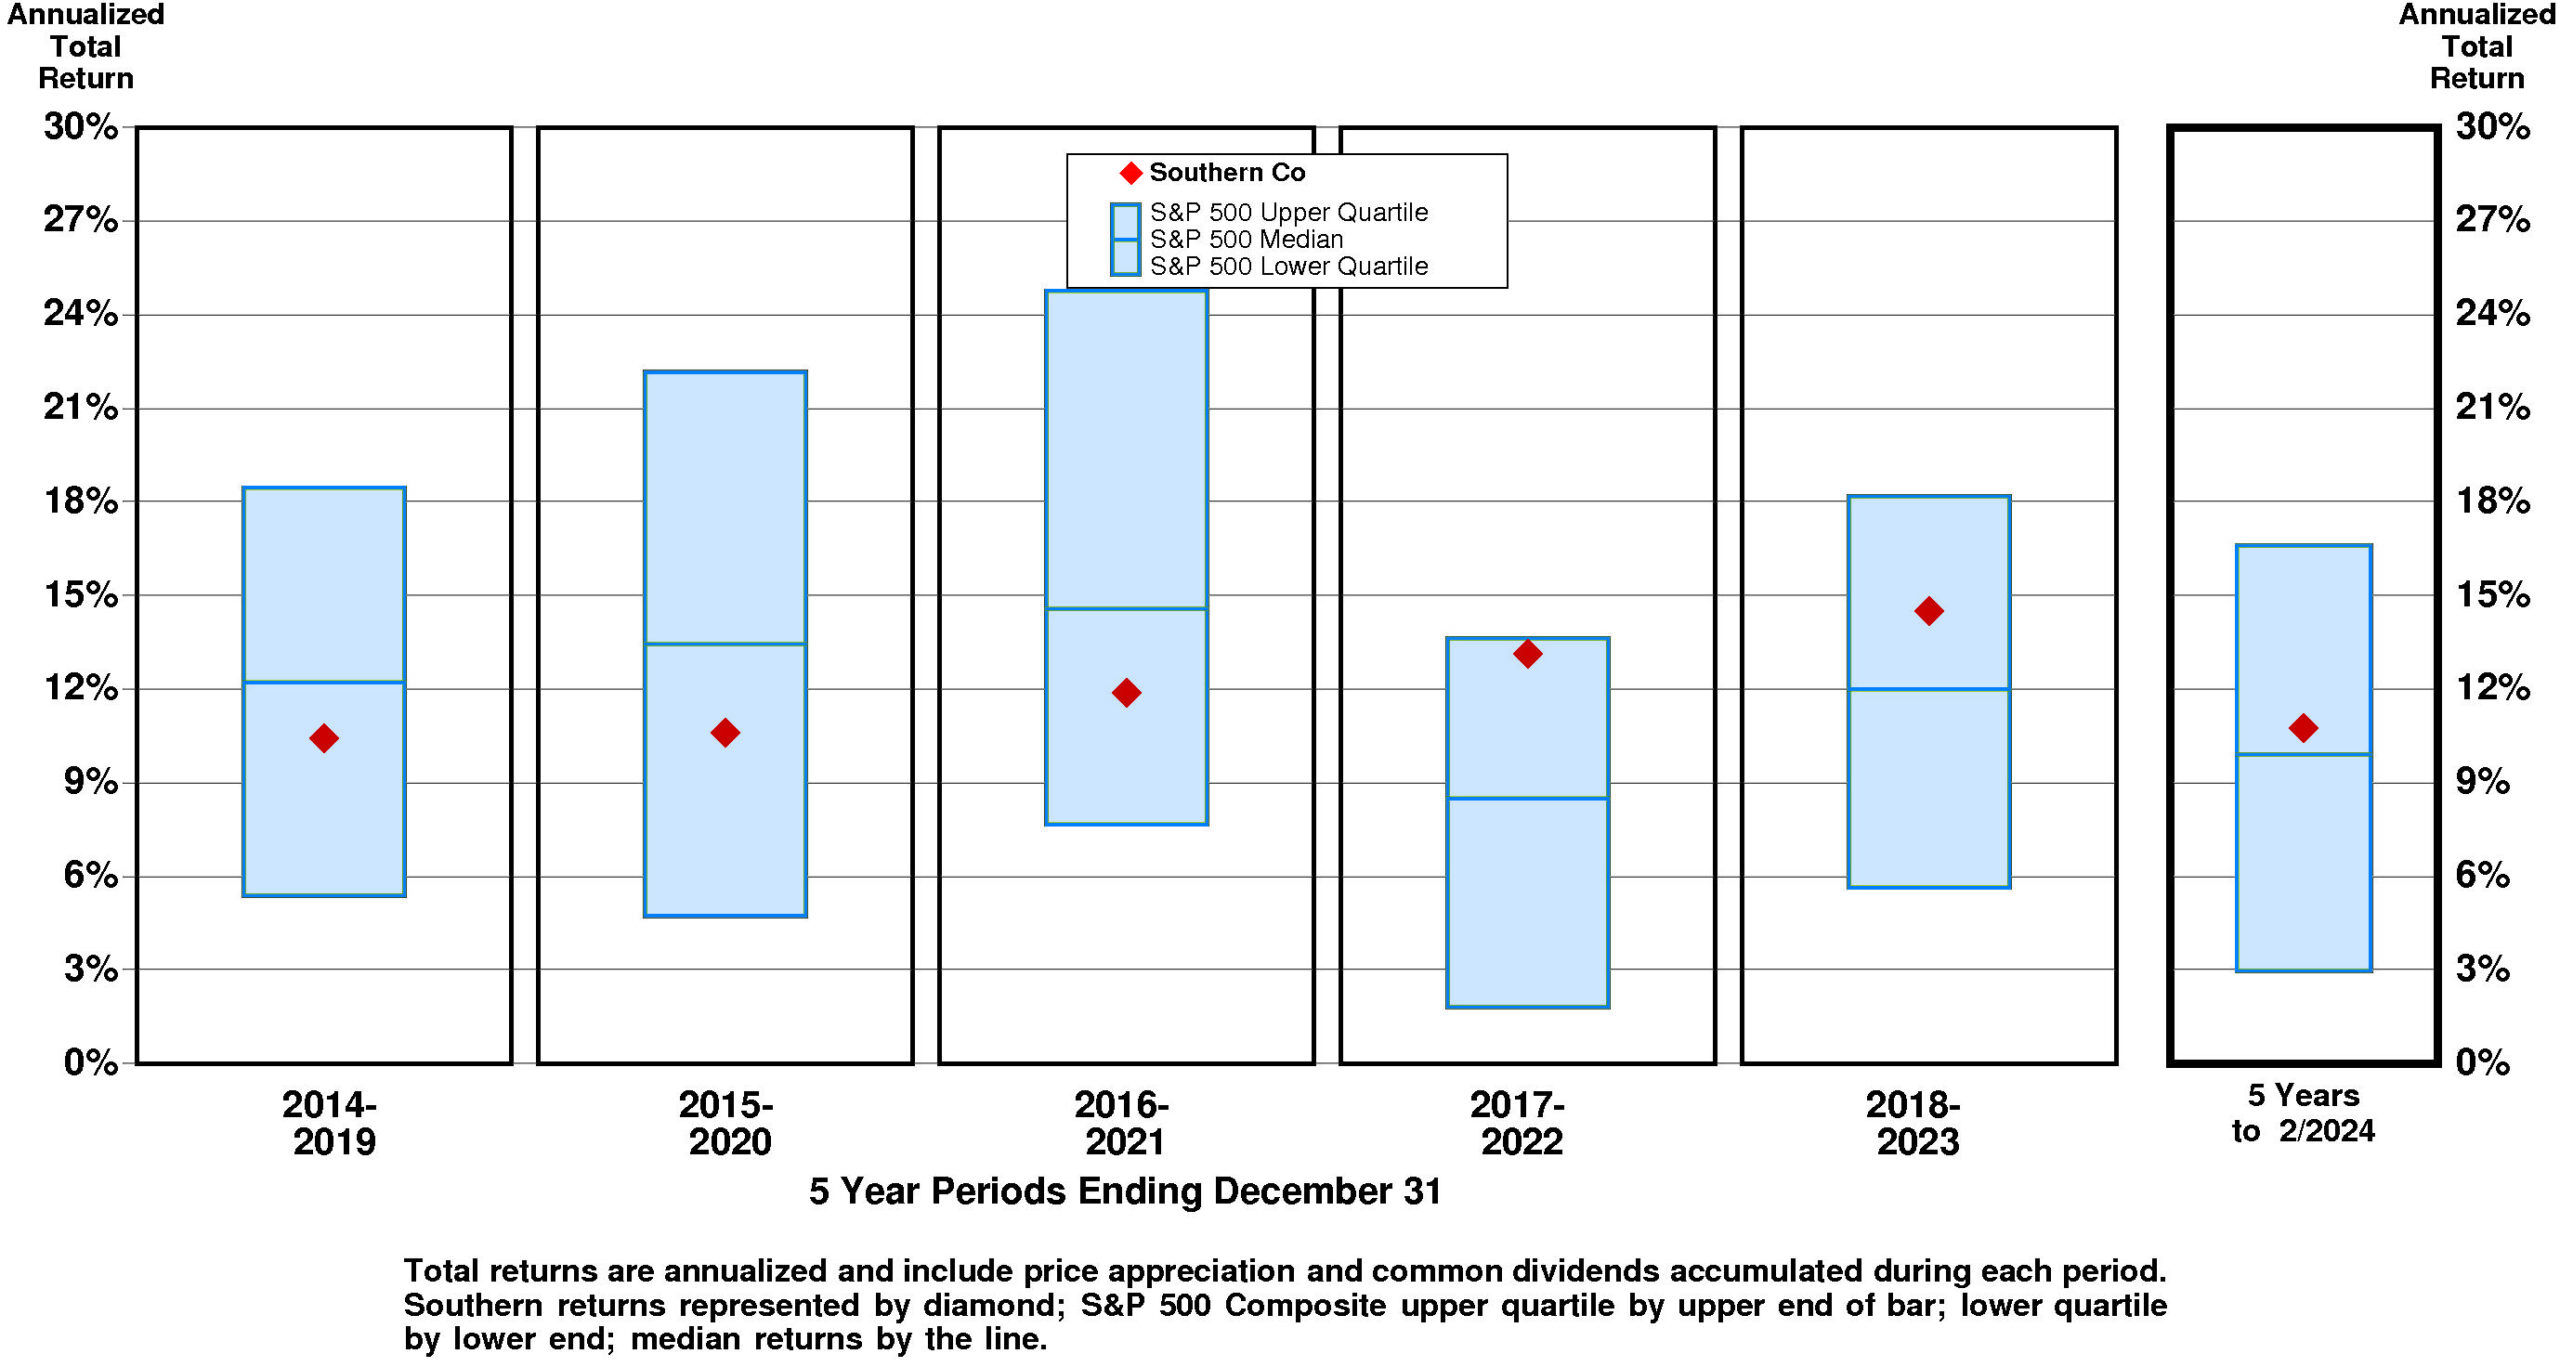
TOTAL INVESTMENT RETURNS
Current annual total return performance of 11.0% is at median relative to the S&P 500 Composite.
In addition to being at median relative to S&P 500 Composite, current annual total return performance through February, 2024 of 11.0% is upper quartile relative to Southern Co (The) Peer Group.
Current 5-year total return performance of 10.7% is slightly above median relative to the S&P 500 Composite.
Through February, 2024, with slightly above median current 5-year total return of 10.7% relative to S&P 500 Composite, Southern’s total return performance is upper quartile relative to Southern Co (The) Peer Group.
VALUATION BENCHMARKS
Relative to S&P 500 Composite, SO’s overall valuation is normal. The highest factor, the ratio of enterprise value/revenue, is above median. Ratio of enterprise value/earnings before interest and taxes is slightly above median. Price/earnings ratio is below median. Price/equity ratio is below median. The lowest factor, the ratio of enterprise value/assets, is near the lower quartile.
Relative to Southern Peer Group, SO’s overall valuation is quite high. The highest factor, the price/equity ratio, is upper quartile. Ratio of enterprise value/revenue is upper quartile. Price/earnings ratio is at the upper quartile. Ratio of enterprise value/assets is upper quartile. The lowest factor, the ratio of enterprise value/earnings before interest and taxes, is at the upper quartile.
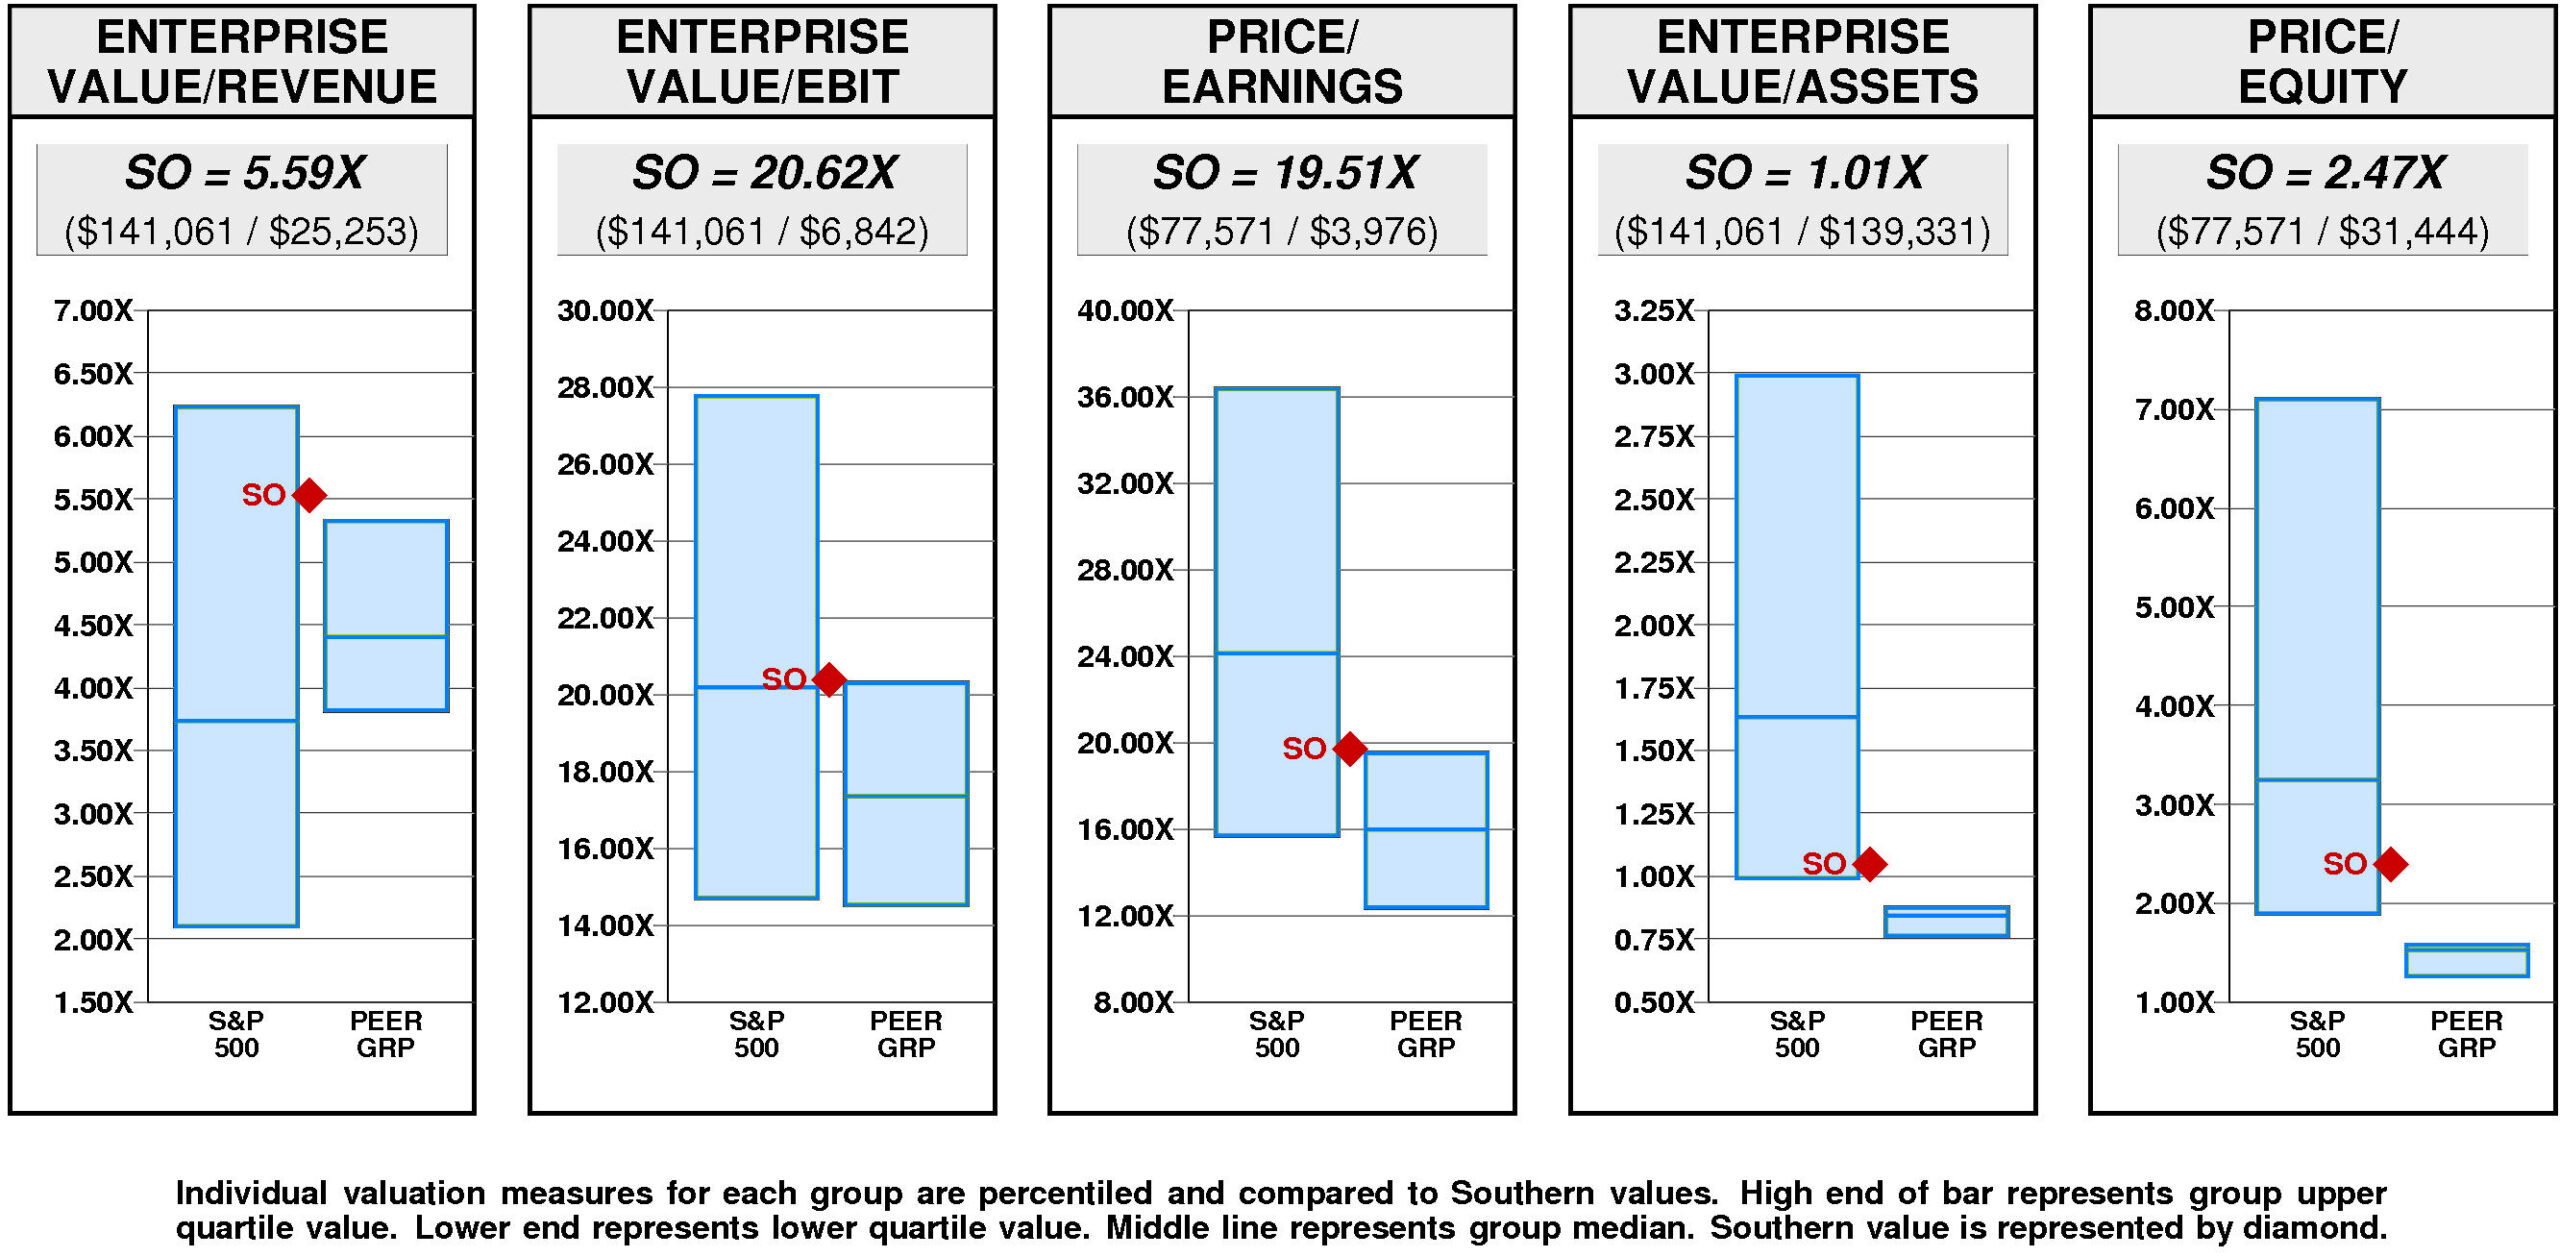
Southern has a major value gap compared to the median valuation. For SO to achieve median valuation, its current ratio of enterprise value/revenue would have to fall from the current level of 5.59X to 4.40X. If SO’s ratio of enterprise value/revenue were to fall to 4.40X, its stock price would be lower by $-27 to $44.
For SO to fall to lower quartile valuation relative to the Southern Peer Group, its current ratio of enterprise value/revenue would have to fall from the current level of 5.59X to 3.82X. If SO’s ratio of enterprise value/revenue were to fall to 3.82X, its stock price would decline by $-41 from the current level of $71.
VALUE TARGETS
SO is expected to continue to be a major Value Builder reflecting capital returns that are forecasted to be above the cost of capital.
Southern’s current Price Target of $94 represents a +32% change from the current price of $71.10.
This neutral appreciation potential results in an appreciation score of 50 (50% of the universe has greater appreciation potential.)
Reinforcing this neutral Appreciation Score of 50, the neutral Power Rating of 44 contributes to an Value Trend Rating of C.
Southern’s current Price Target is $94 (-20% from the 2023 Target of $117 but +32% from the 04/01/24 price of $71.10). This fall in the Target is the result of a +1% increase in the equity base and a -21% decrease in the price/equity multiple. The forecasted increase in cost of equity has a very large negative impact on the price/equity multiple and the forecasted decline in growth has a very large negative impact as well. Partially offsetting these Drivers, the forecasted increase in return on equity has a very large positive impact.
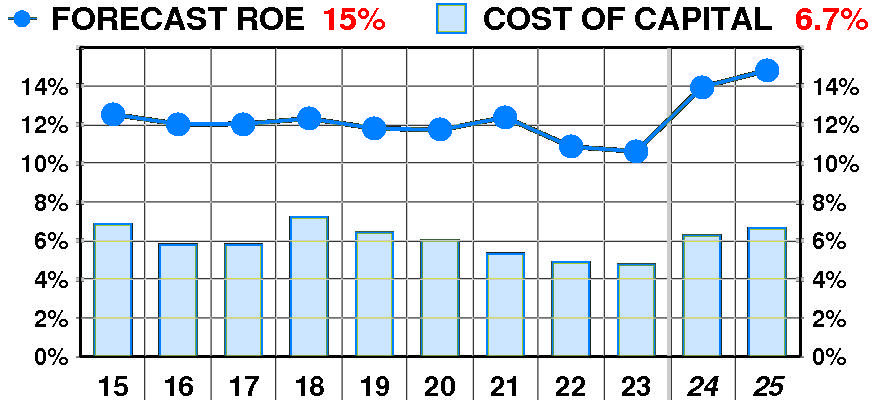
PTR’s return on equity forecast is 14.8% — slightly above our recent forecasts. Forecasted return on equity exhibited a modest, erratic decline between 2015 and 2023. The current forecast is above the 2015 peak of 13%.
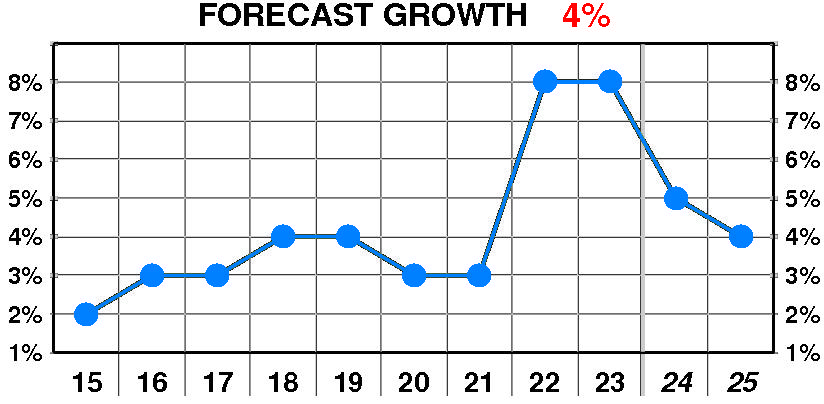
PTR’s growth forecast is 4.0% — slightly below our recent forecasts. Forecasted growth enjoyed a dramatic, variable increase between 2015 and 2023. The current forecast is steady at the 2015 low of 2%.
PTR’s cost of equity forecast is 6.7% — in line with recent levels. Forecasted cost of equity enjoyed a dramatic, erratic decline between 2015 and 2023. The current forecast is steady at the 2017 low of 5.8%.
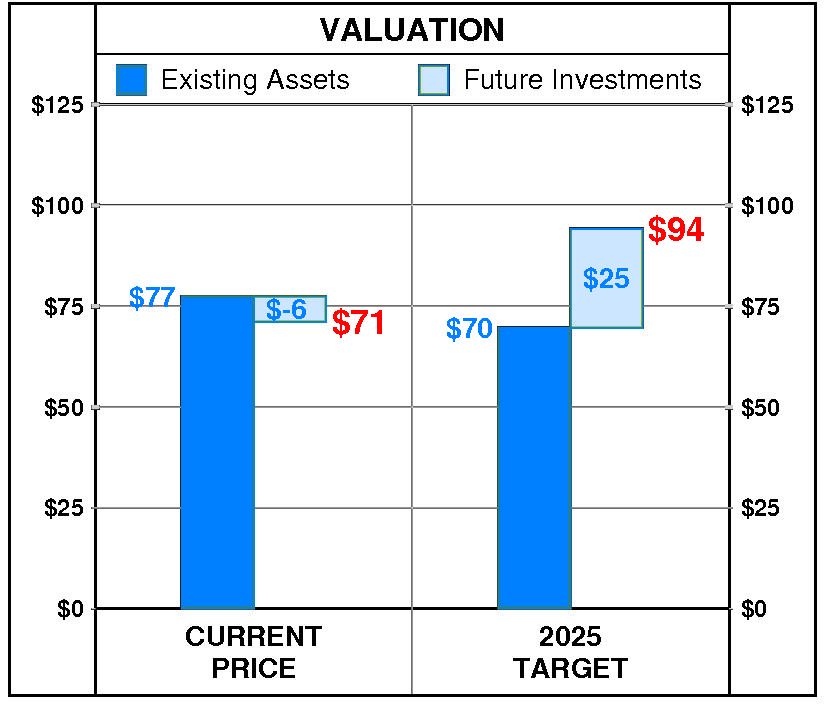
At Southern’s current price of $71.10, investors are placing a negative value of $-6 on its future investments. This view is not supported by the company’s most recent performance that reflected a growth rate of 8.0% per year, and a return on equity of 10.6% versus a cost of equity of 4.8%.
PTR’s 2025 Price Target of $94 is based on these forecasts and reflects an estimated value of existing assets of $70 and a value of future investments of $25.
Be the first to comment