
BUSINESS
Aspira Women's Health Inc., together with its subsidiaries, engages in developing and commercializing diagnostic tests for gynecologic disease in the United States. The company provides OVA1, OVERA, and OVA1plus to detect risk of ovarian malignancy in women with adnexal masses. It also offers ASPiRA GenetiX, a genetic test for the risk of gynecologic cancer. In addition, the company operates Aspira Synergy, a testing platform and cloud service for decentralized access of protein biomarker and hereditary genetic testing; and owns and operates ASPiRA LABS, a lab that specializes in applying biomarker-based technologies to address critical needs in the management of gynecologic cancers and disease. Further, its pipeline products include OVAWatch, EndoCheck, and OVAInherit. The company serves physicians, physician office laboratories, and national and regional laboratories.

INVESTMENT RATING

AWH is expected to continue to be a modest Value Eraser reflecting capital returns that are forecasted to fall short of the cost of capital.
Aspira Womens Health has a current Value Trend Rating of D (Negative).
With this rating, PTR's two proprietary measures of a stock's current attractiveness are providing very contradictory signals. Aspira Womens Health has a very low Appreciation Score of 4 but a good Power Rating of 78, with the Negative Value Trend Rating the result.
Aspira Womens Health's stock is selling significantly above targeted value.
The current stock price of $3.43 compares to targeted value 12 months forward of $1.
Aspira Womens Health's very low appreciation potential results in an appreciation score of 4 (96% of the universe has greater appreciation potential.)
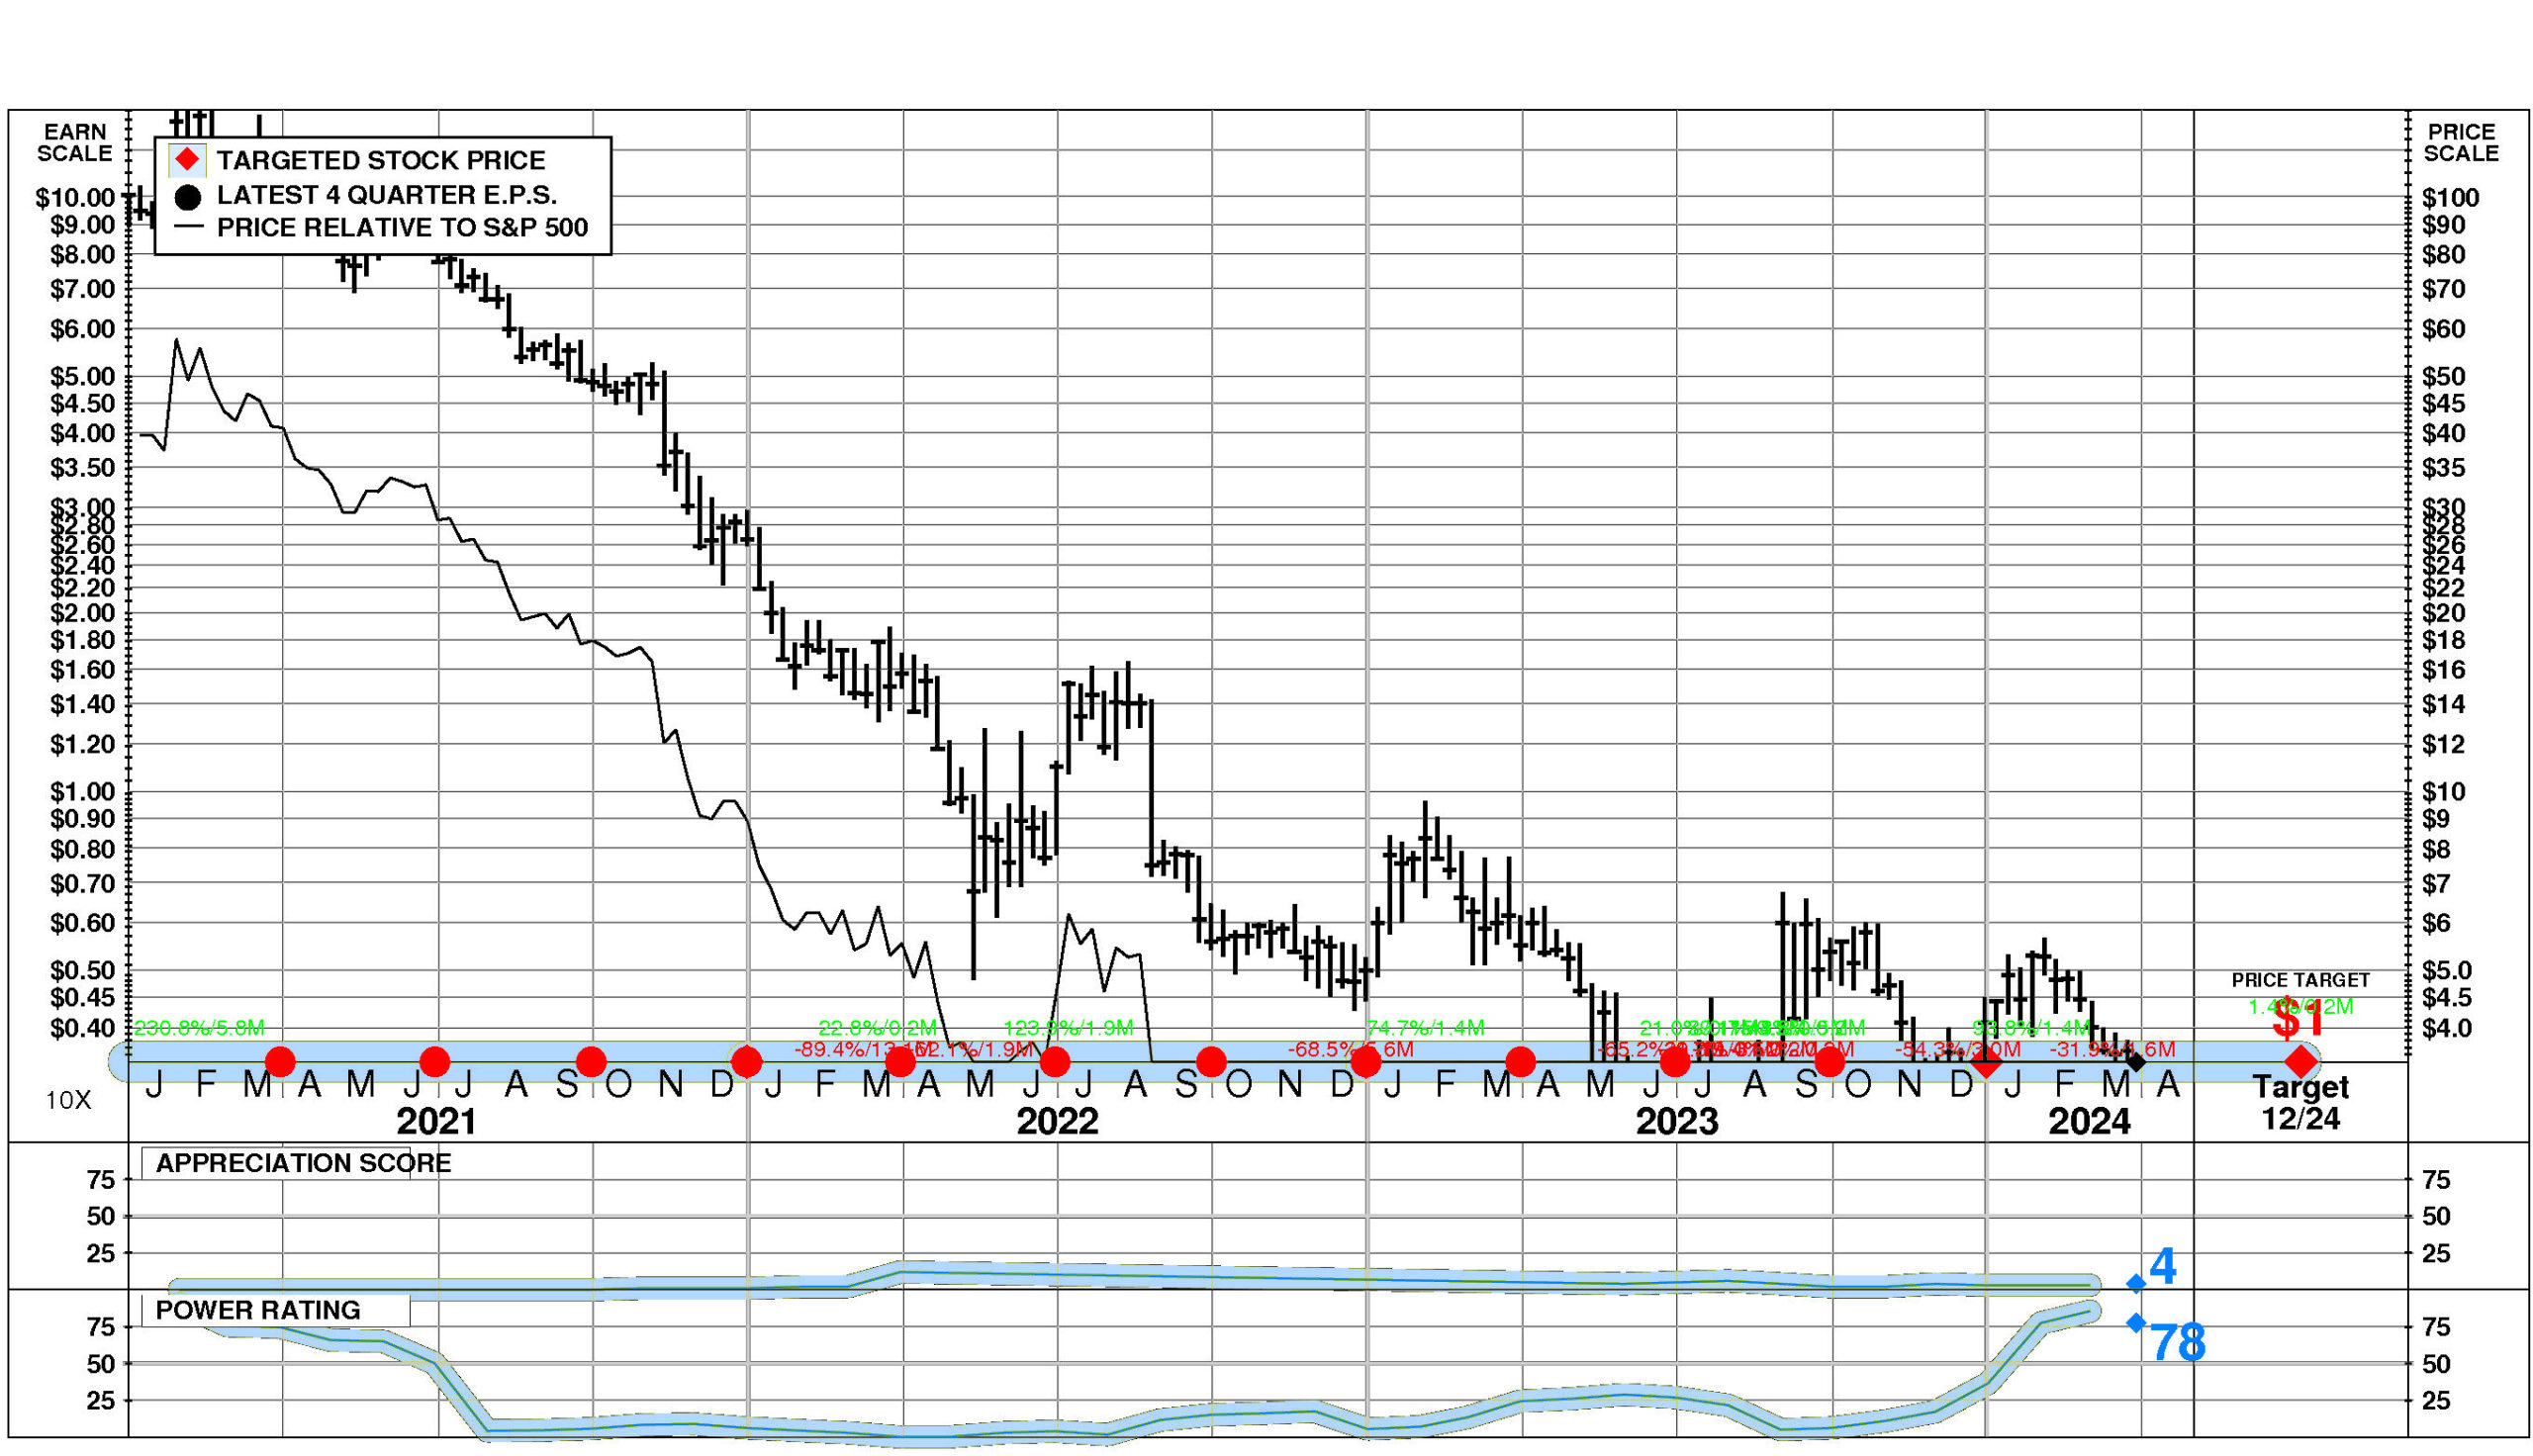
Aspira Womens Health has a Power Rating of 78.
(This good Power Rating indicates that AWH has a better chance of achieving attractive investment performance over the near to intermediate term than all but 22% of companies in the universe.)
Factors contributing to this good Power Rating include: recent price action has been favorable; and the recent trend in AWH's earnings estimates has been favorable. An offsetting factor is the In Vitro, In Vivo Diagnostics comparison group is in an extremely unfavorable position currently.
INVESTMENT PROFILE
AWH's financial strength is low. Financial strength rating is 21.
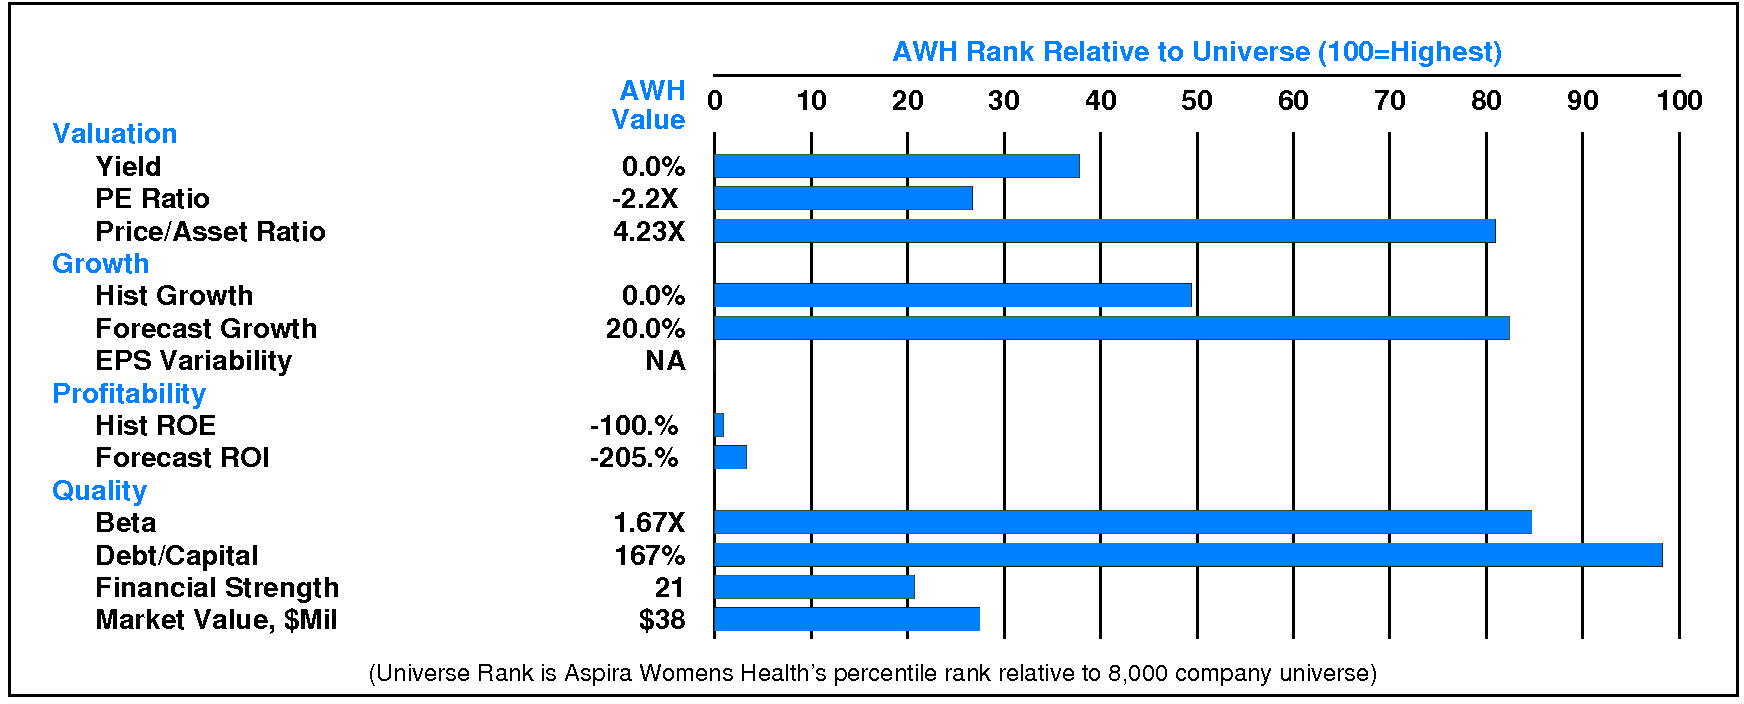
Relative to the S&P 500 Composite, Aspira Womens Health Inc has slightly more Value than Growth characteristics; its appeal is likely to be to Capital Gain-oriented investors; the perception is that AWH is extremely high risk.
High expected growth is a positive for AWH. Relative weaknesses include: low historical profitability, low financial strength, high stock price volatility, high financial leverage, and low historical growth. AWH's valuation is moderate: low dividend yield, low P/E ratio, and moderate price/book ratio. AWH has unusually low market capitalization.
CURRENT SIGNALS
Aspira Womens Health's current operations are eroding.
Return on equity is falling, reflecting: declining pretax margin; and falling leverage.
Aspira Womens Health's current technical position is neutral.
The stock price is in a 1.6 month down move. The stock has declined 24.2% from its prior high. The 200 day moving average is in an uptrend. The stock price is below its 200 day moving average.
ALERTS
The stock is currently rated D.
Aspira Womens Health Inc (NASDAQ: AWH) stock closed at $3.43 on 3/27/24 after a modest decline of -2.0%. However, below average trading volume at 78% of normal accompanied the decline. The stock has declined -3.4% during the last week but has been exceptionally strong relative to the market over the last nine months.
CASH FLOW
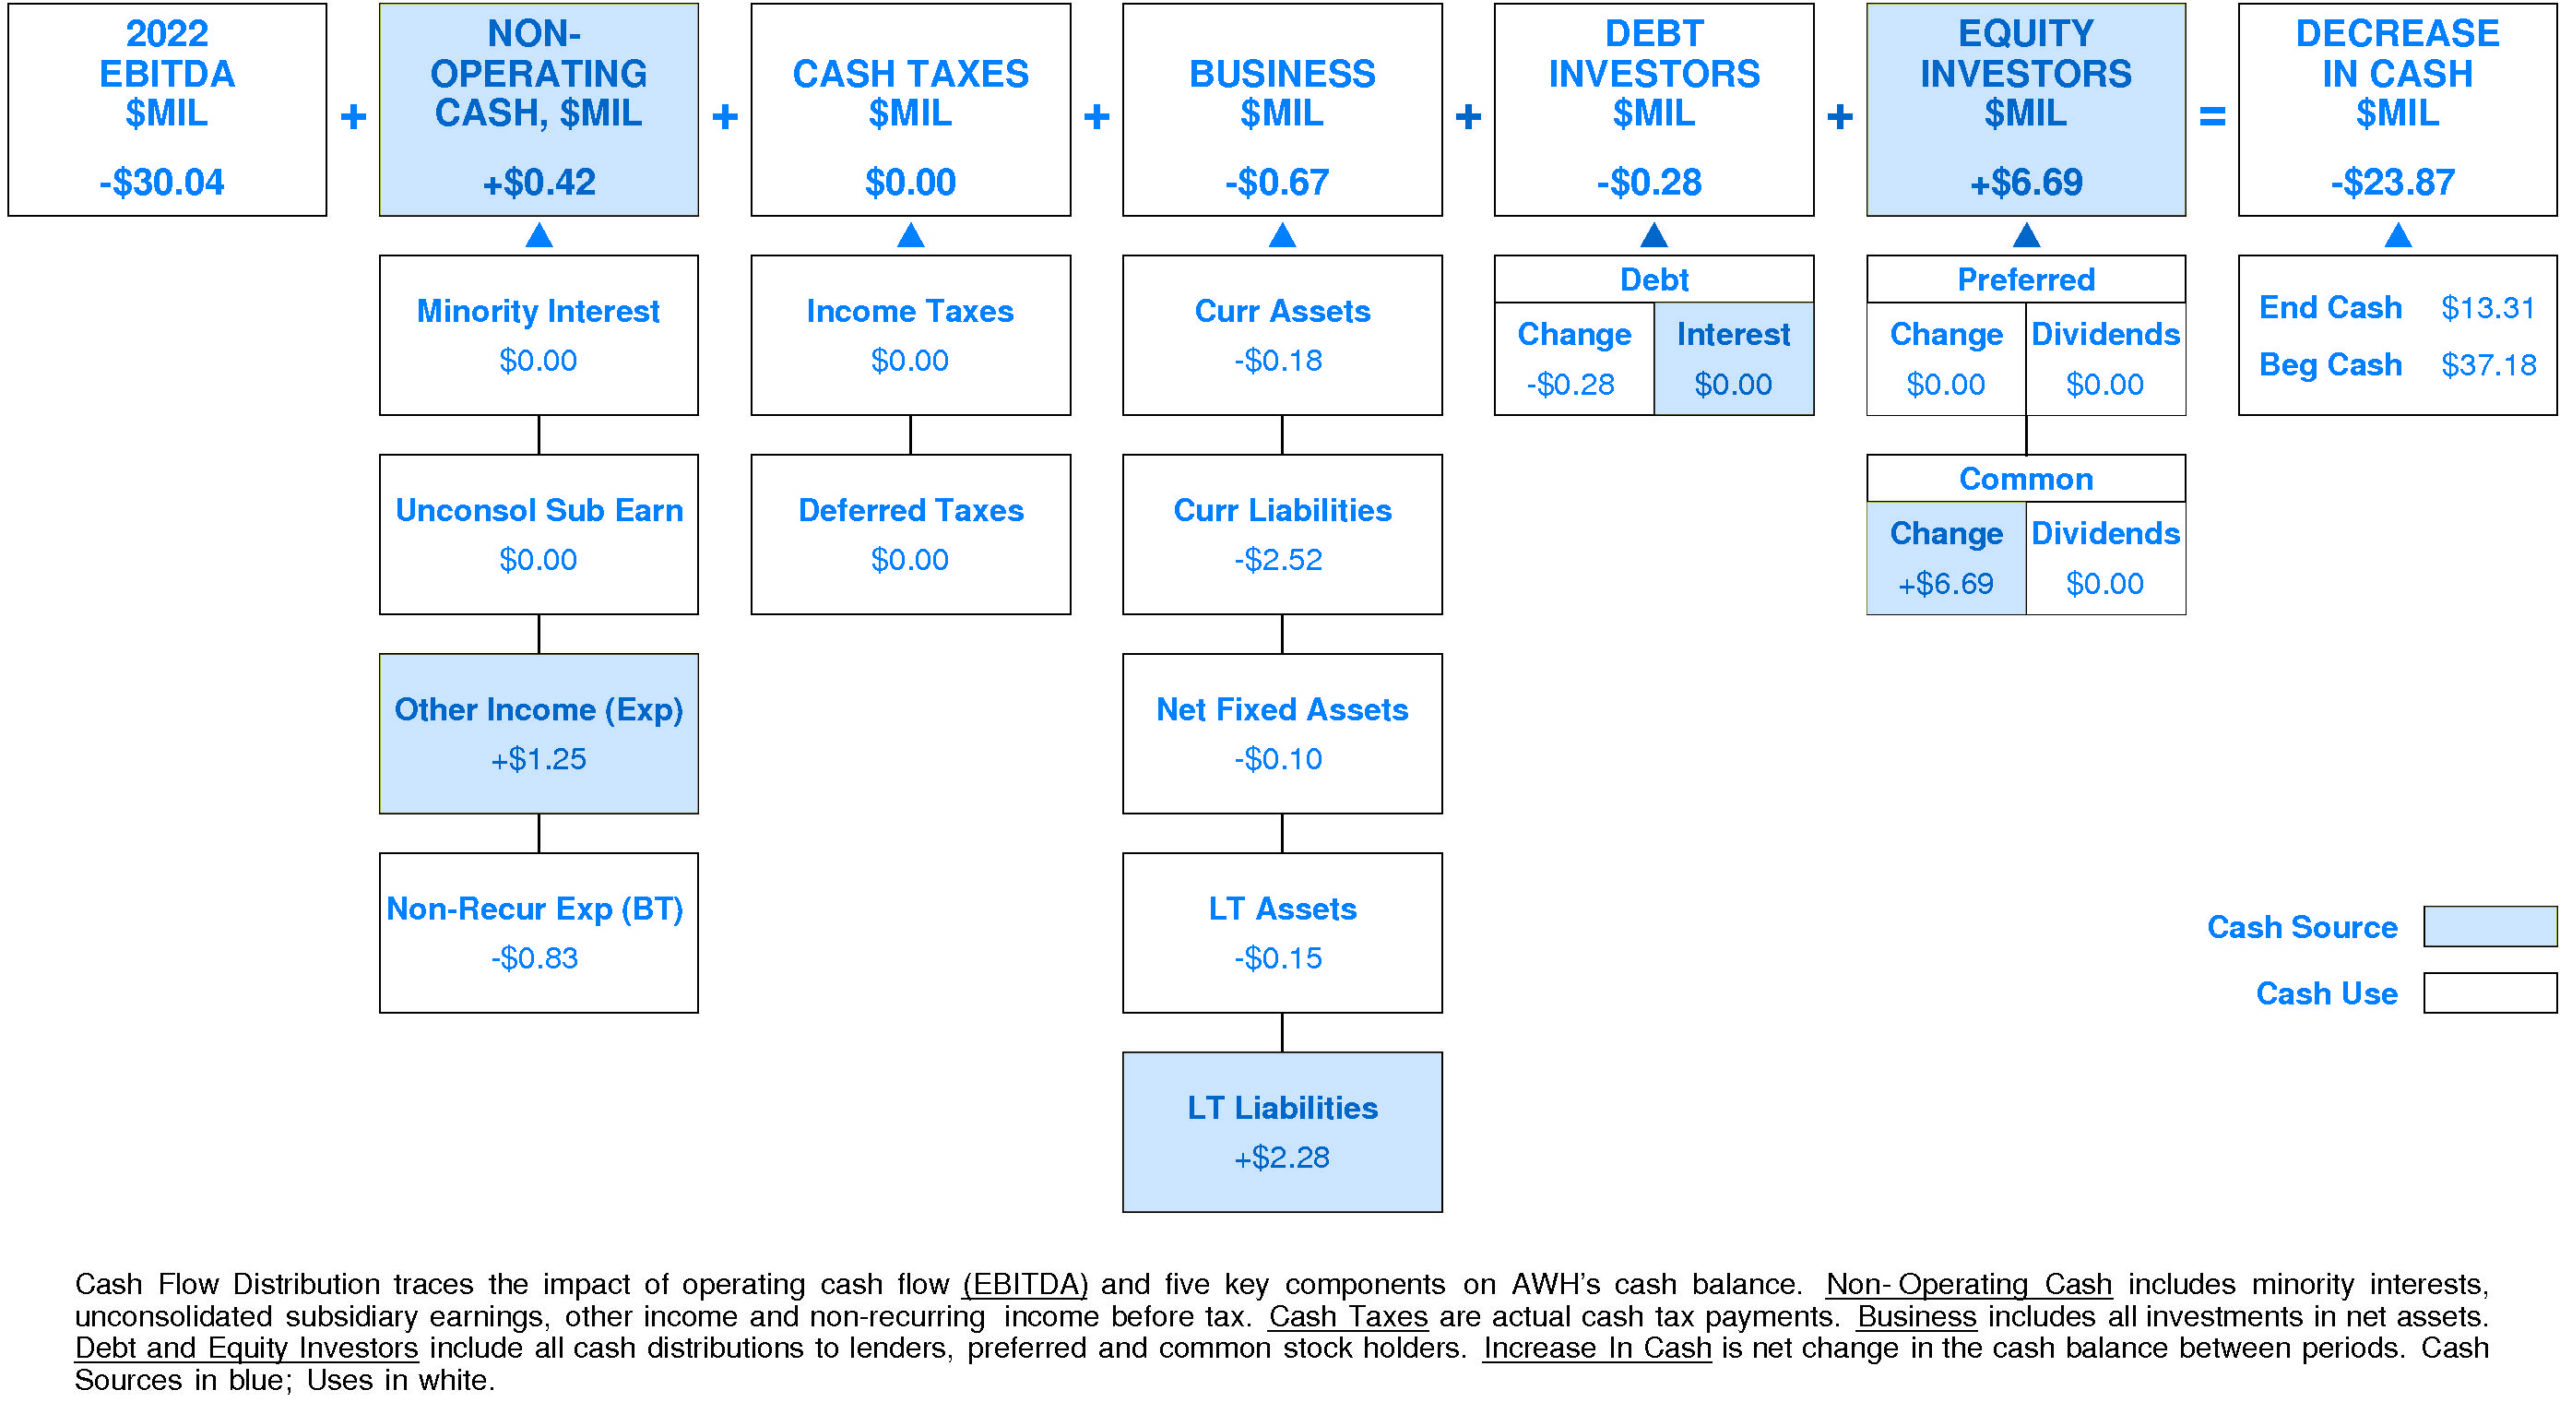
In 2022, Aspira Womens Health experienced a very significant reduction in cash of -$23.87 million (-64%). Sources of cash were much lower than uses.
Cash consumed from 2022 EBITDA totaled -$30.04 million. Non-operating sources contributed +$0.42 million (-1% of EBITDA). In 2022, there were no cash taxes paid. Re-investment in the business amounted to -$0.67 million (+2% of EBITDA). On a net basis, debt investors received -$0.28 million (+1% of EBITDA) while equity investors supplied +$6.69 million (-22% of EBITDA).
AWH's Non-operating Income, %EBITDA has exhibited little to no overall change over the period.
This stability was accompanied by stability for the Aspira Womens Health Peer Group as well. In most years, Aspira Womens Health was in the top quartile and lower quartile. Currently, Aspira Womens Health is below median at -1% of EBITDA (+$0.42 million).
AWH's Cash Taxes, %EBITDA has exhibited little to no overall change over the period.
This stability was accompanied by stability for the Aspira Womens Health Peer Group as well. In most years, Aspira Womens Health was in the second quartile and top quartile. Currently, Aspira Womens Health is slightly above median at 0% of EBITDA ( $0.00 million).
AWH's Business Re-investment, %EBITDA has experienced a downtrend over the period.
This downtrend was accompanied by an opposite trend for the Aspira Womens Health Peer Group. In most years, Aspira Womens Health was in the third quartile and second quartile. Currently, Aspira Womens Health is below median at +2% of EBITDA (-$0.67 million).
AWH's Debt Investors, %EBITDA has exhibited little to no overall change over the period.
This stability was accompanied by stability for the Aspira Womens Health Peer Group as well. In most years, Aspira Womens Health was in the second quartile and third quartile. Currently, Aspira Womens Health is slightly below median at +1% of EBITDA (-$0.28 million).
AWH's Equity Investors, %EBITDA has enjoyed a volatile overall uptrend over the period.
This improvement was accompanied by a similar trend for the Aspira Womens Health Peer Group. In most years, Aspira Womens Health was in the second quartile and top quartile. Currently, Aspira Womens Health is slightly above median at -22% of EBITDA (+$6.69 million).
AWH's Change in Cash, %EBITDA has experienced a volatile overall uptrend over the period.
This improvement was accompanied by a similar trend for the Aspira Womens Health Peer Group. In most years, Aspira Womens Health was in the second quartile and top quartile. Currently, Aspira Womens Health is substantially above median at +79% of EBITDA (-$23.87 million).
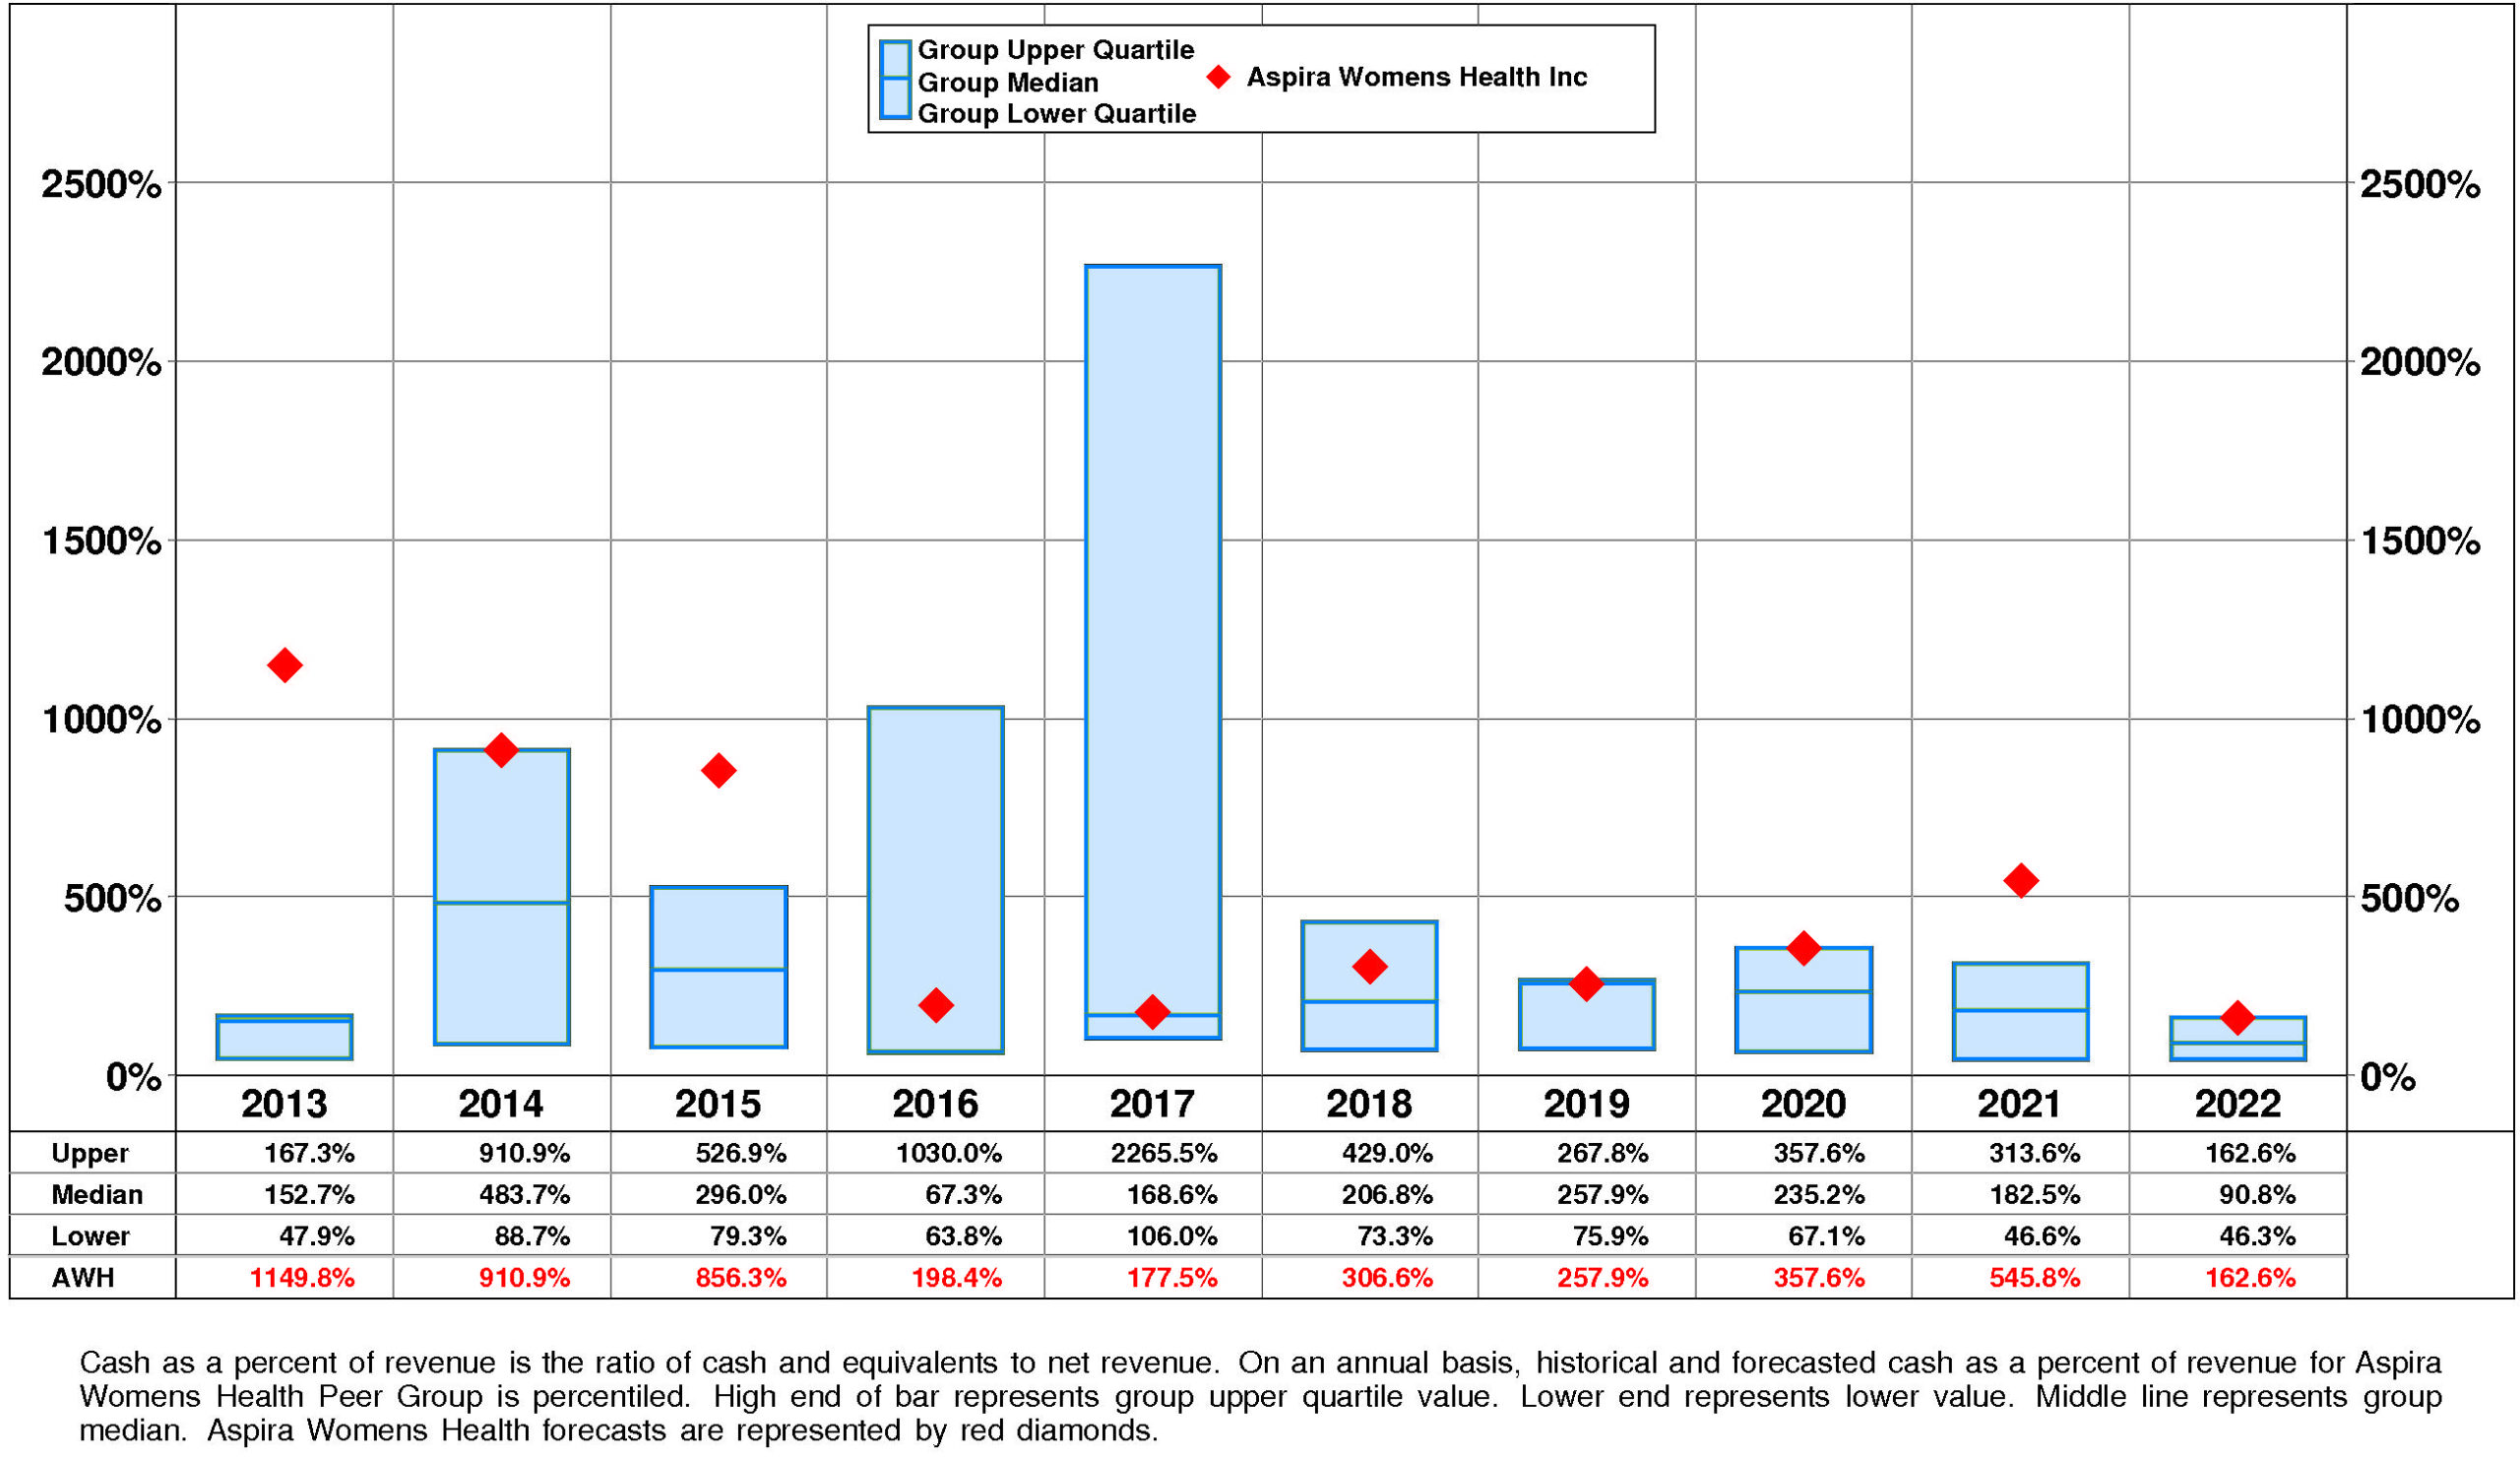
AWH's Cash, %Revenue has suffered a very strong overall downtrend over the period.
This downtrend was accompanied by a similar trend for the Aspira Womens Health Peer Group. In most years, Aspira Womens Health was in the top quartile and second quartile. Currently, Aspira Womens Health is at the upper quartile at +163%.
PROFITABILITY
AWH's operating performance since 2023 is unavailable.
The productivity of AWH's assets rose over the full period 2013-2023: asset turnover has enjoyed a very strong overall uptrend that accelerated very sharply after the 2021 level.
�
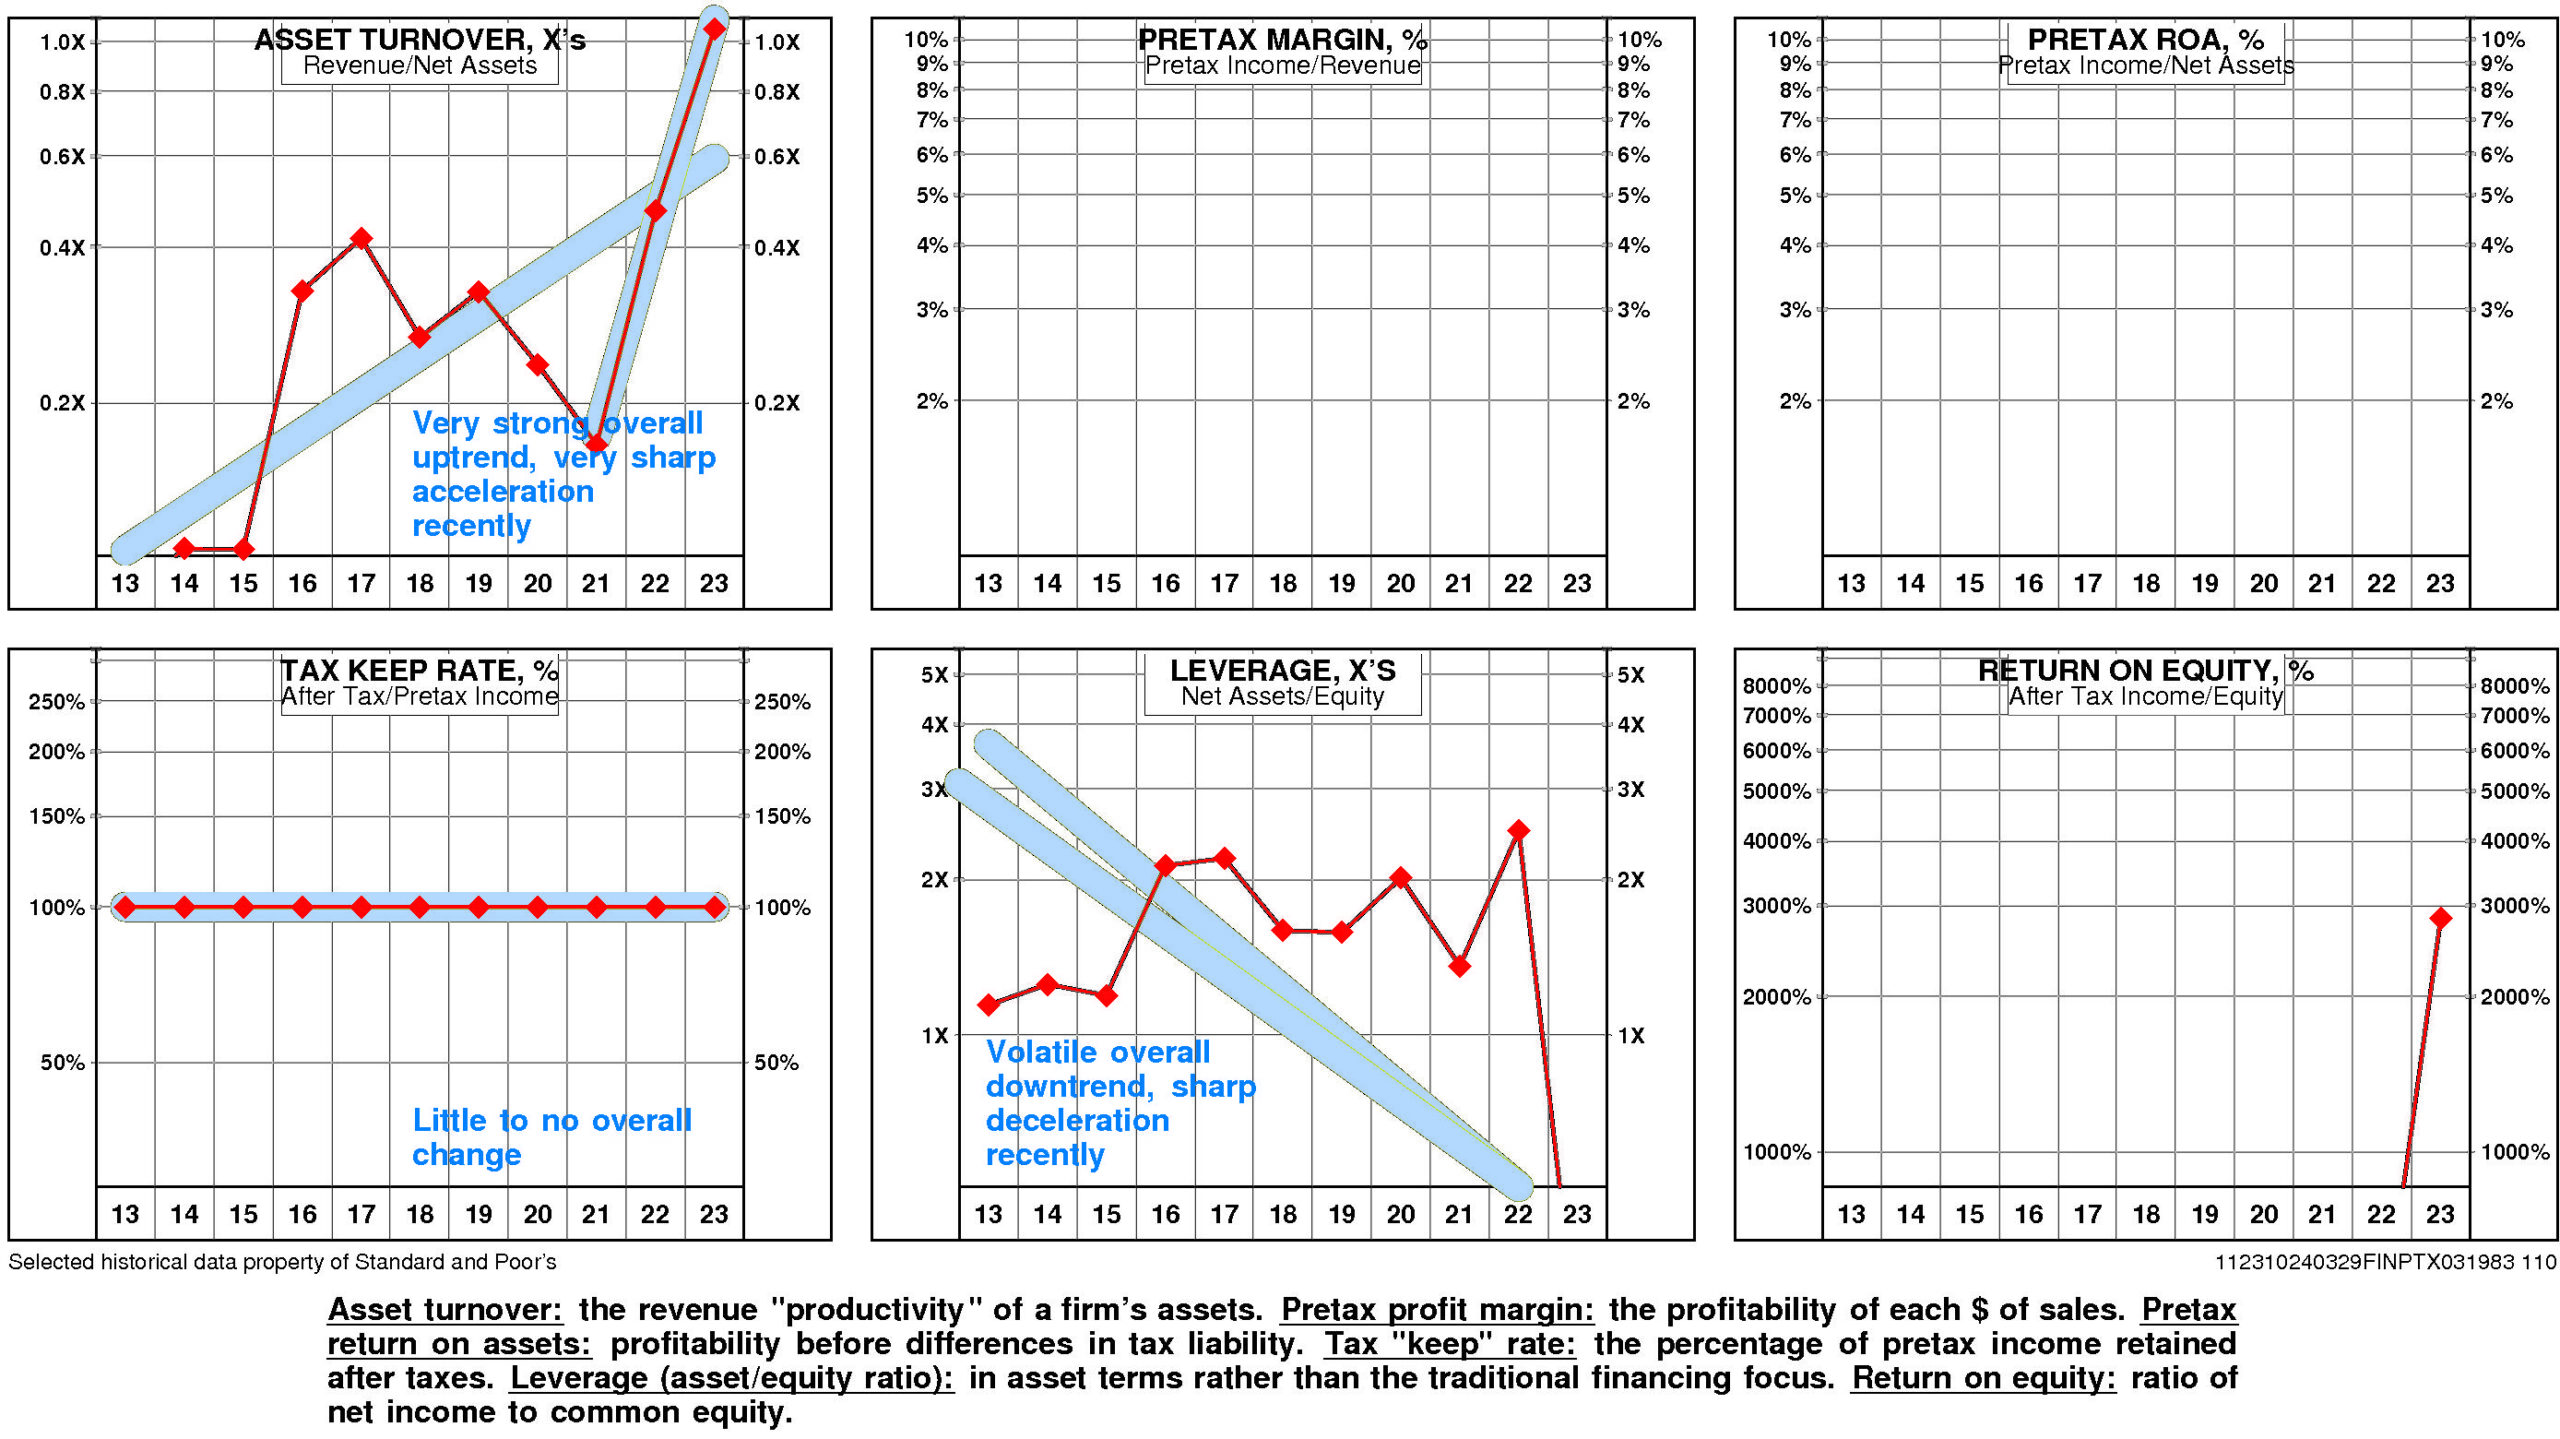
AWH's return on equity is upper quartile (2837.%) for the four quarters ended September, 2023.
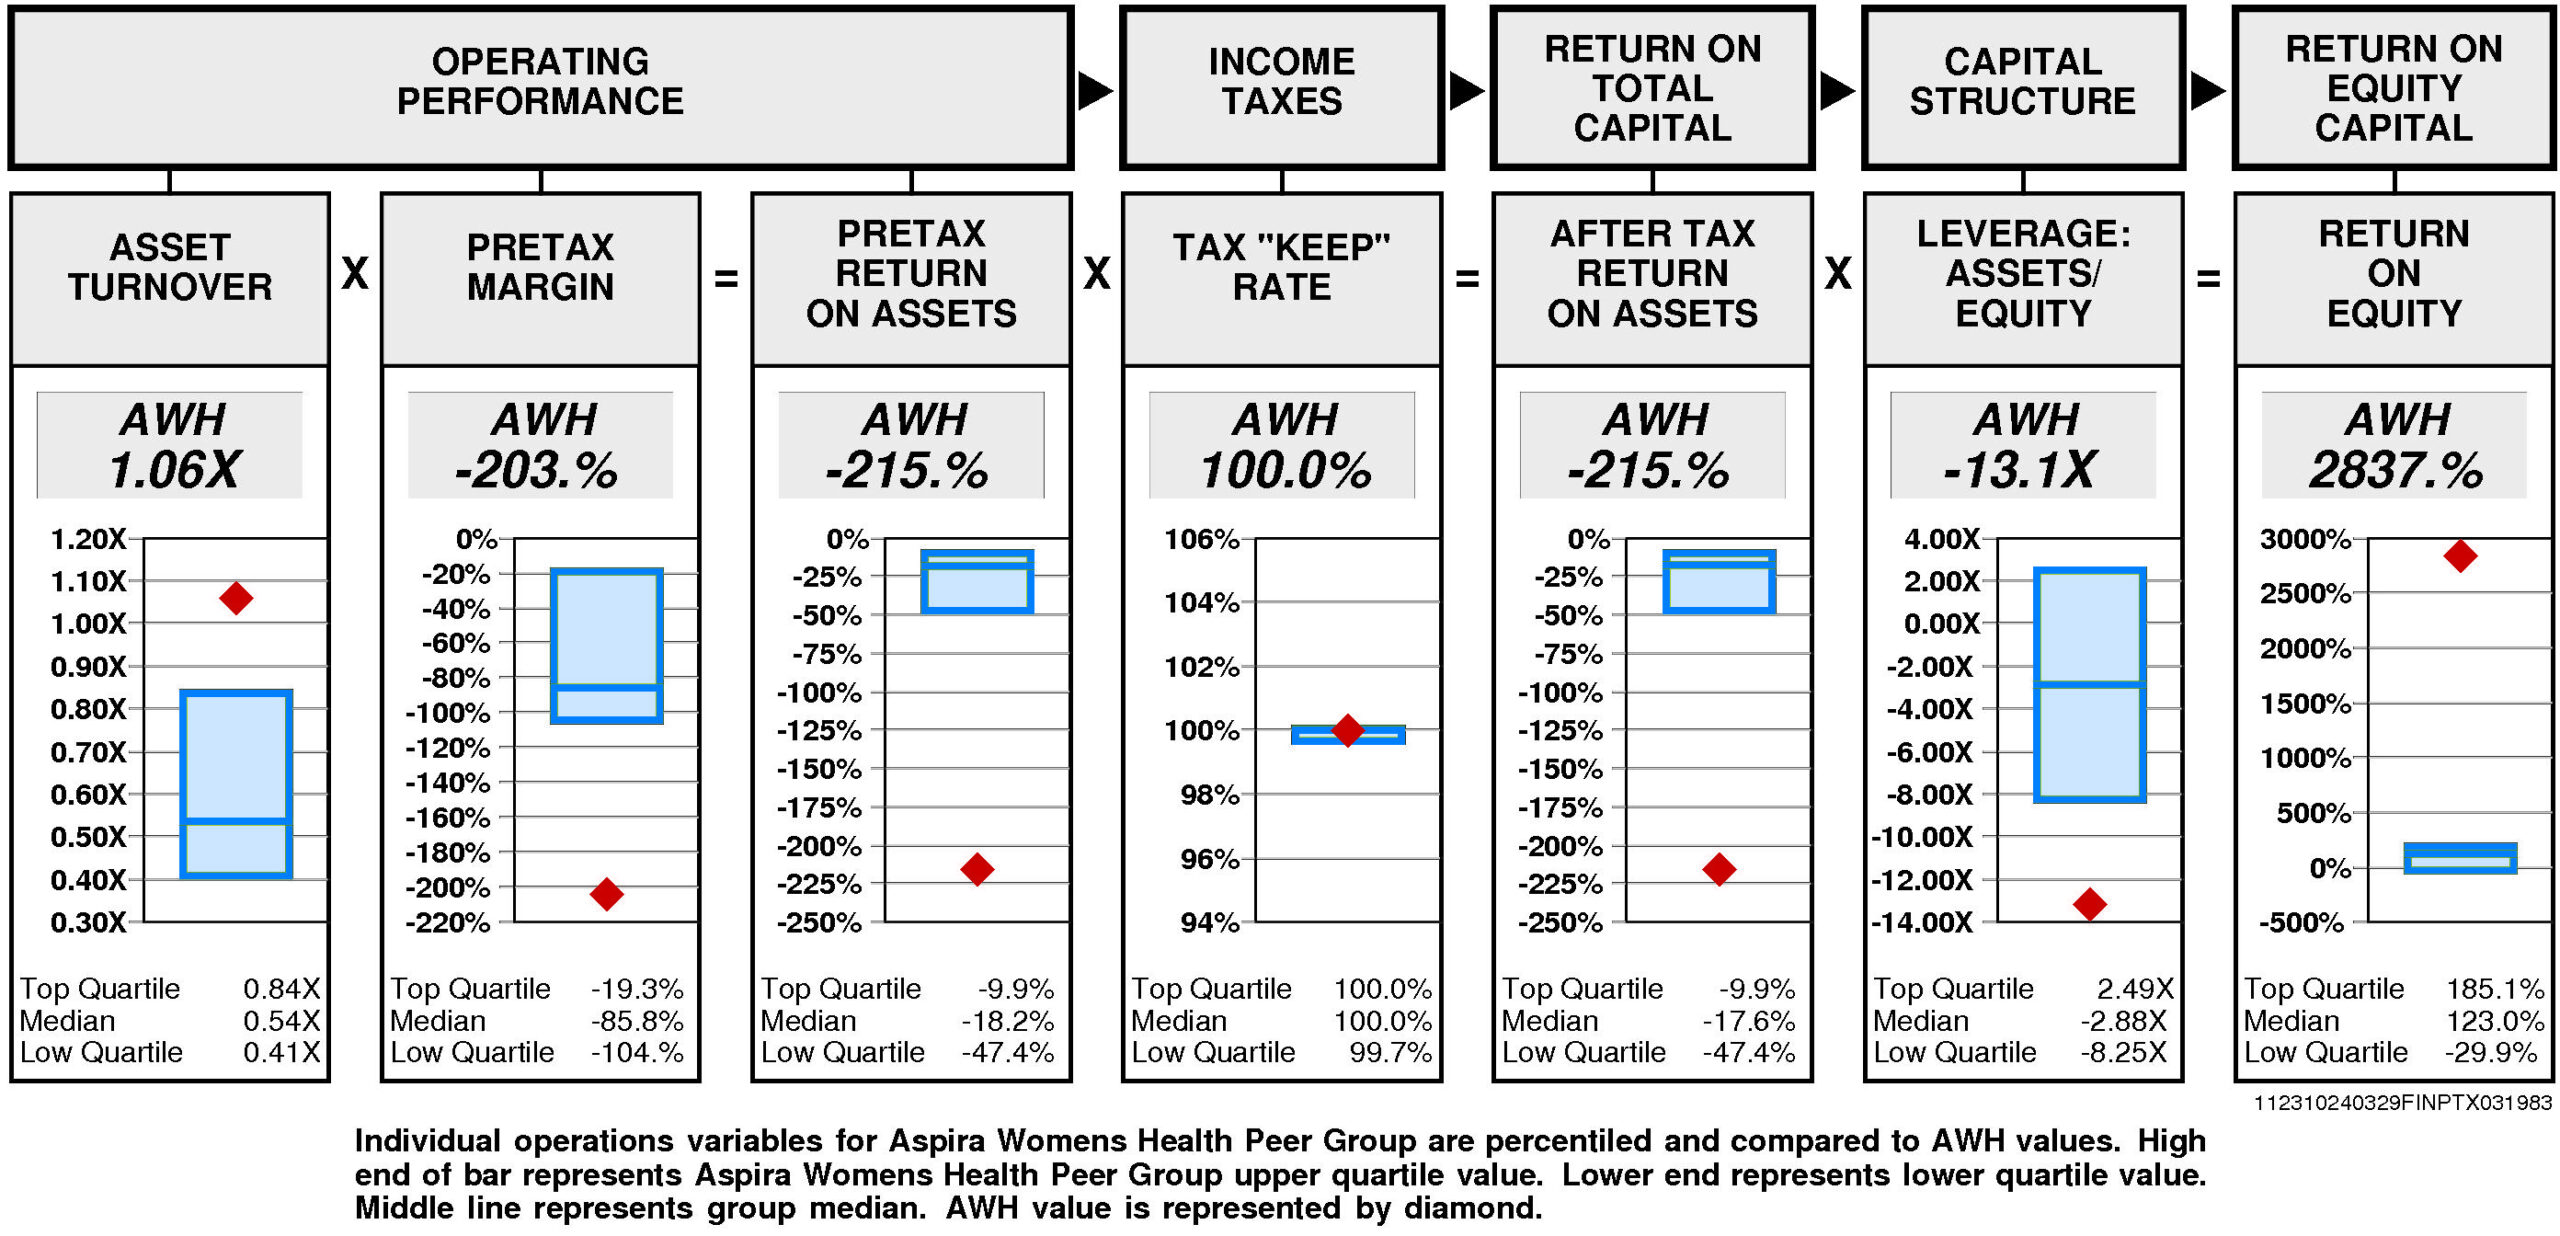
Operating performance (pretax return on assets) is lower quartile (-215.%) reflecting asset turnover that is upper quartile (1.06X) and lower quartile pretax margin (-203.%).
Tax “keep” rate (income tax management) is at the upper quartile (100.0%) resulting in after tax return on assets that is lower quartile.
Financial leverage (leverage) is lower quartile (-13.1X).
GROWTH RATES
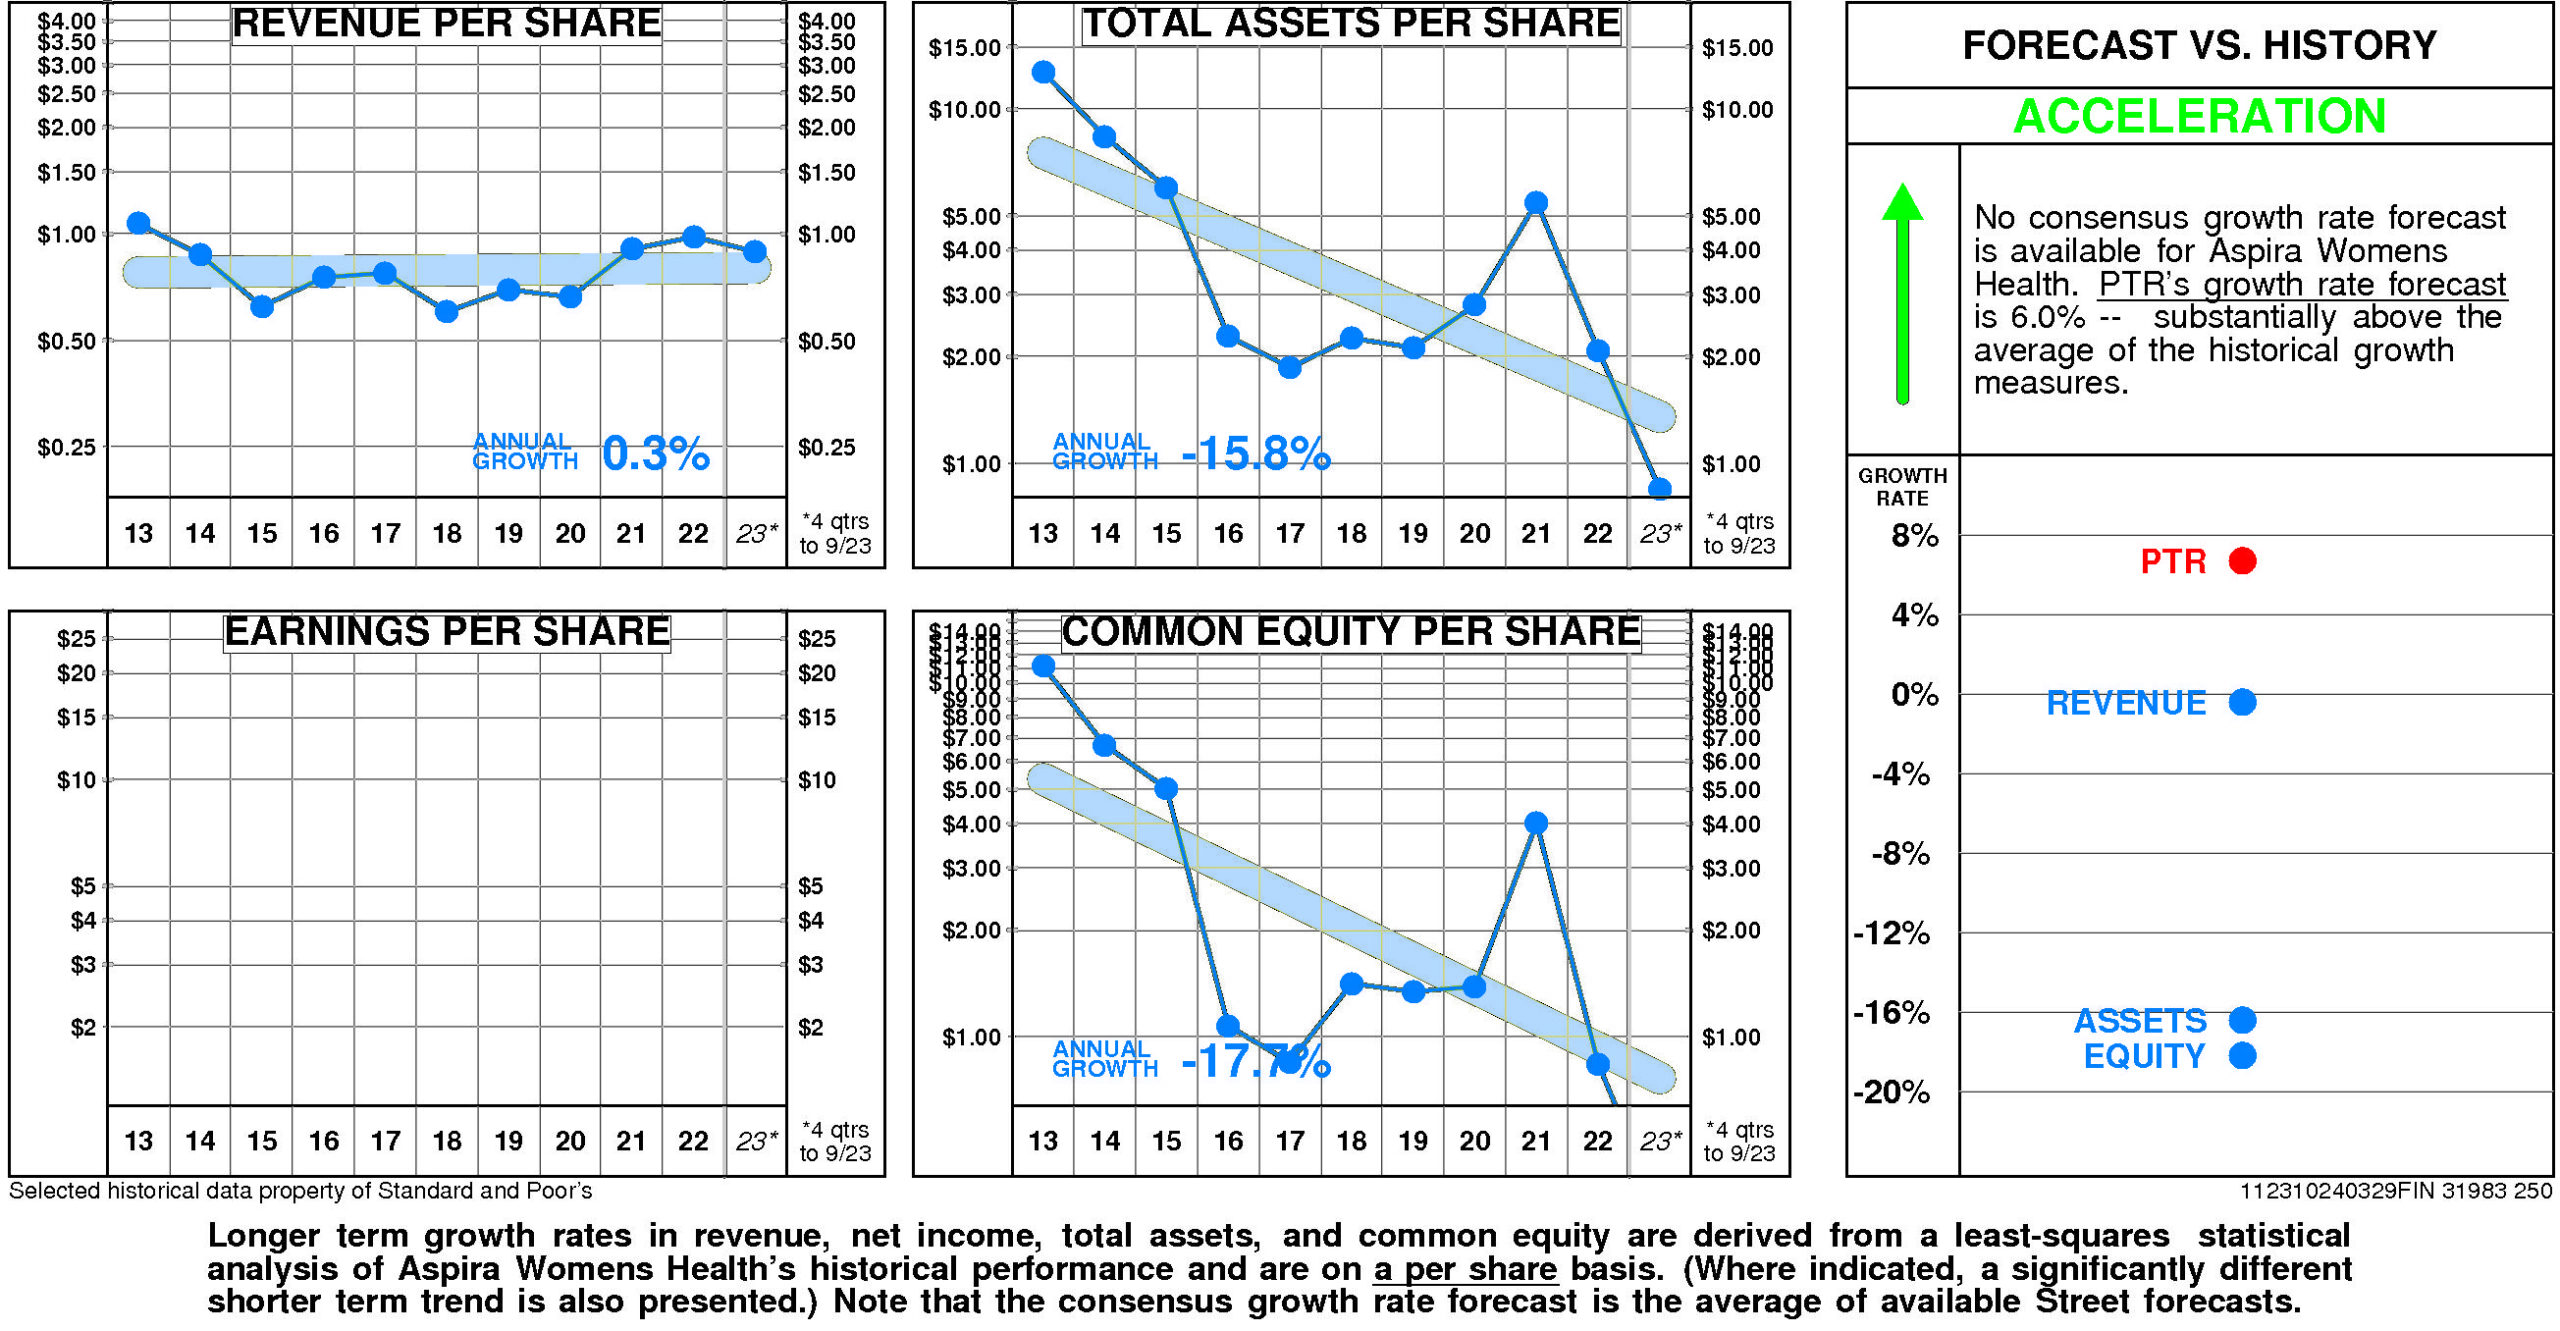
There are no significant differences between Aspira Womens Health's longer term growth and growth in recent years.
Aspira Womens Health's historical income statement and balance sheet growth are not available.
Annual revenue growth
has been 0.3% per year.
Total asset growth
has been -15.8% per year.
Annual E.P.S. growth
is not available.
Equity growth
has been -17.7% per year.
No consensus growth rate forecast is available for Aspira Womens Health.
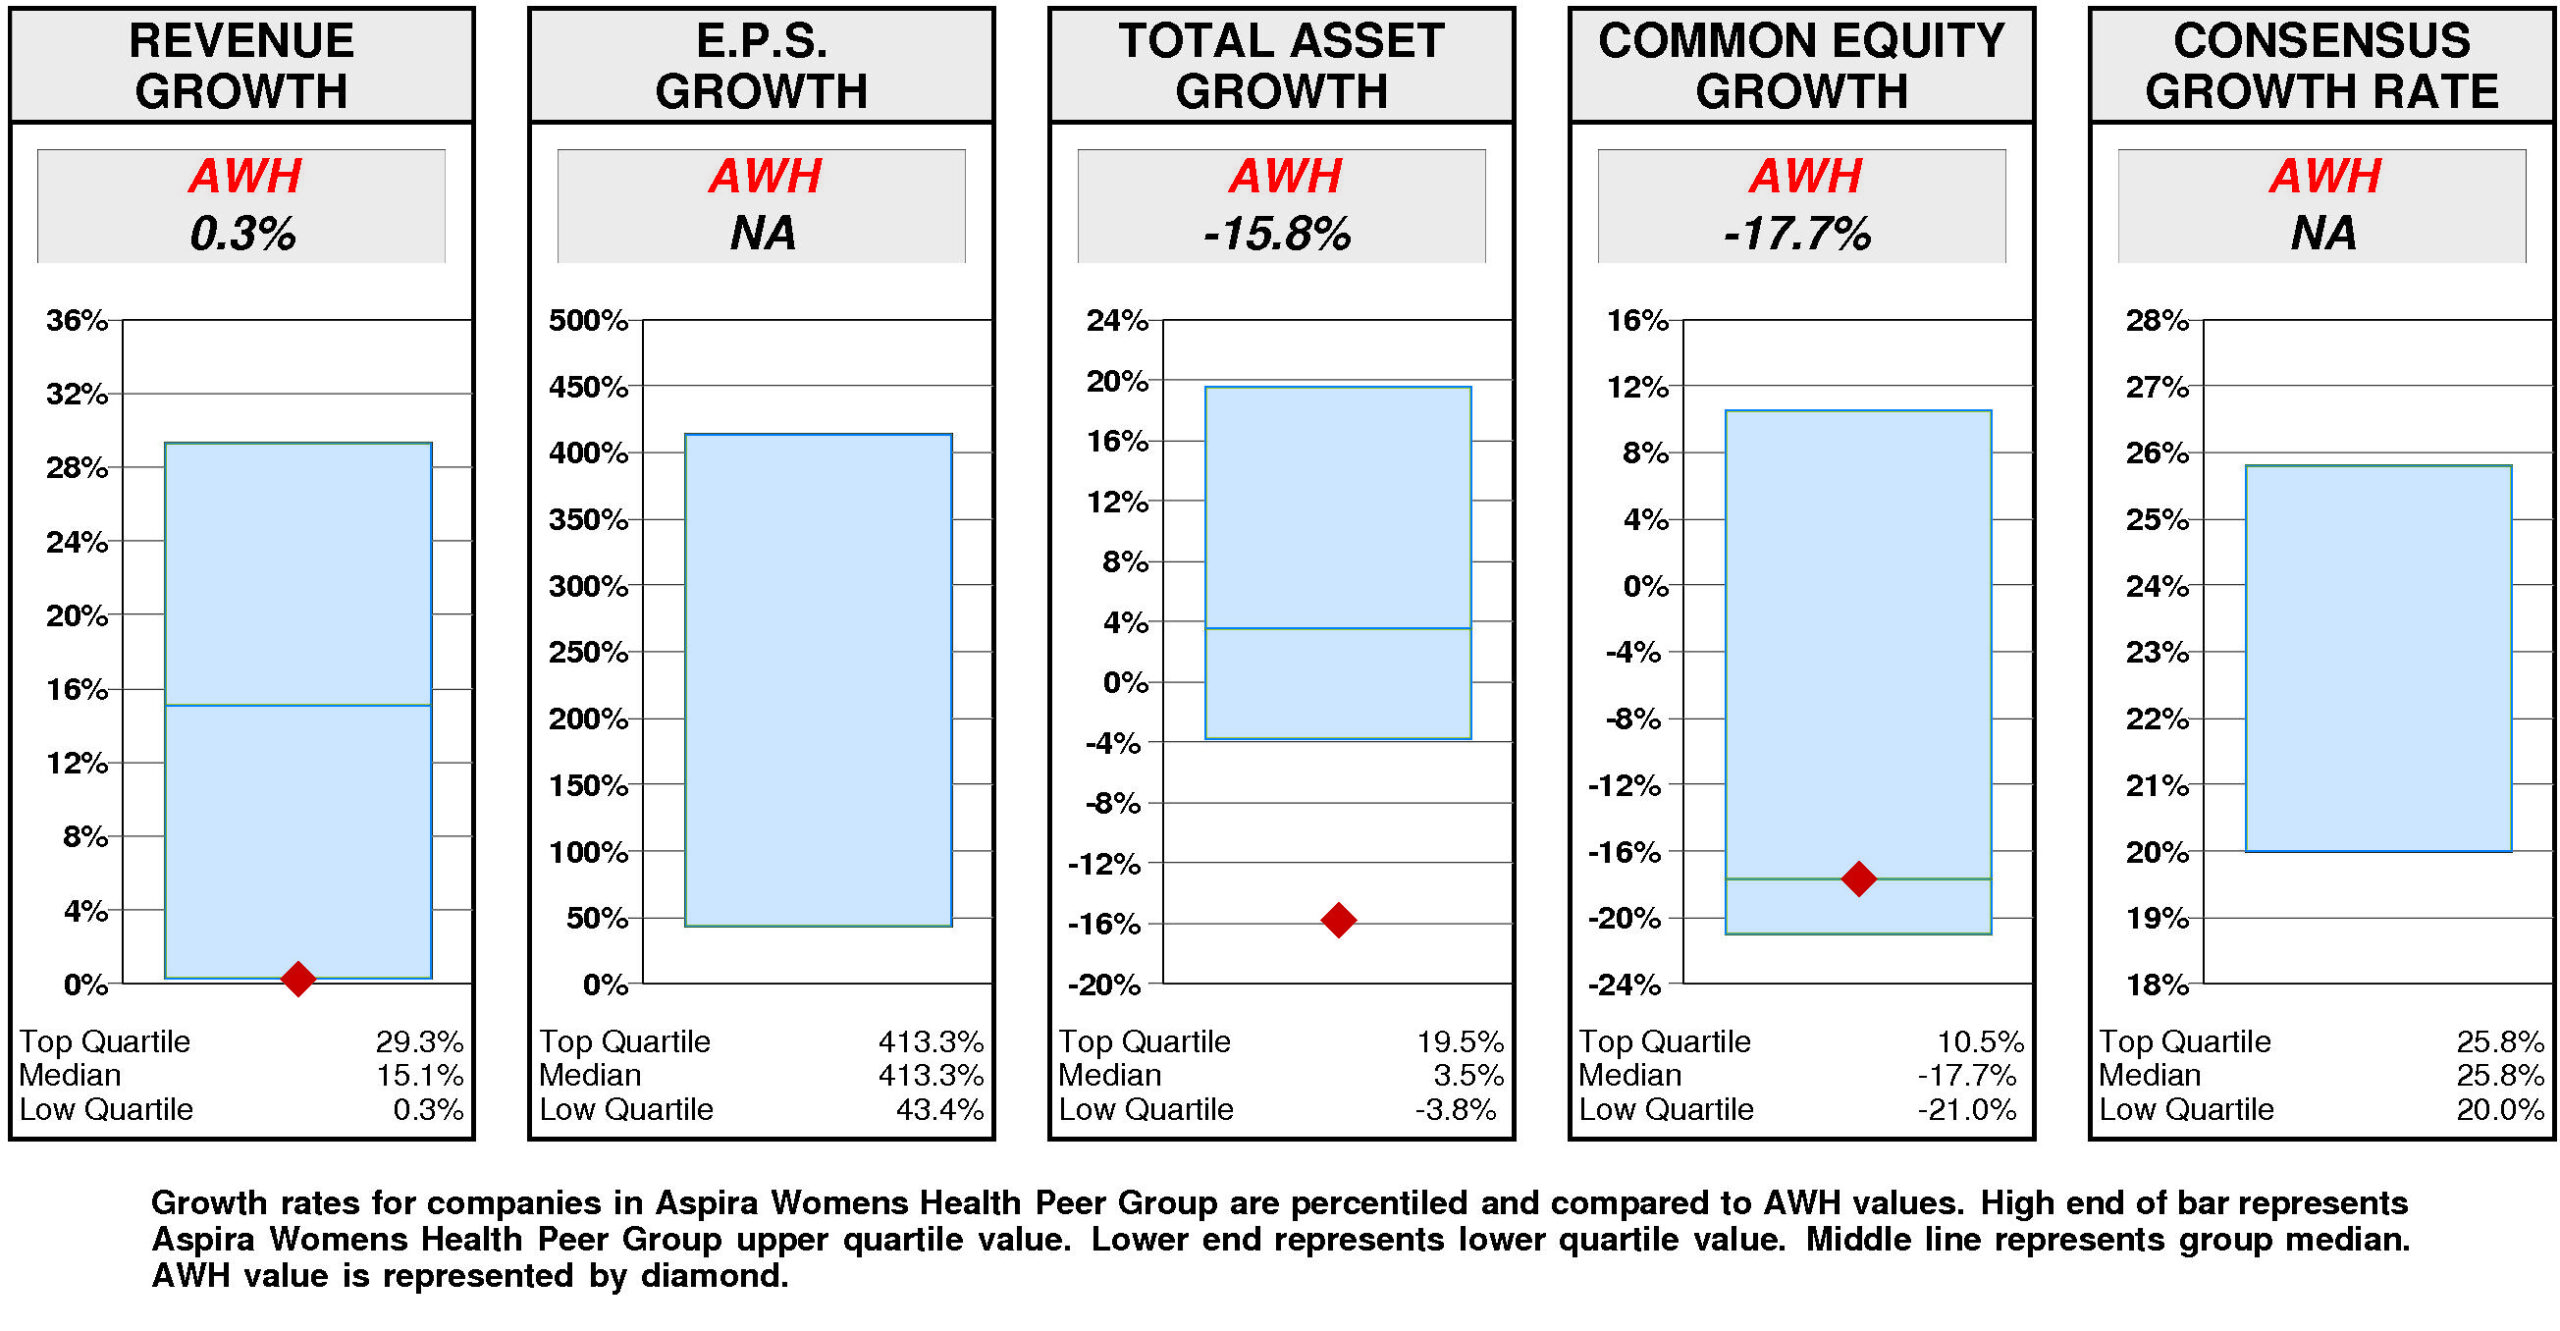
Relative to the Aspira Womens Health Peer Group, Aspira Womens Health's historical growth measures are highly erratic.
Equity growth (-17.7%) has been slightly above median. Revenue growth (0.3%) has been at the lower quartile. Total asset growth (-15.8%) has been lower quartile. E.P.S. growth is unavailable.
Consensus growth forecast is unavailable.
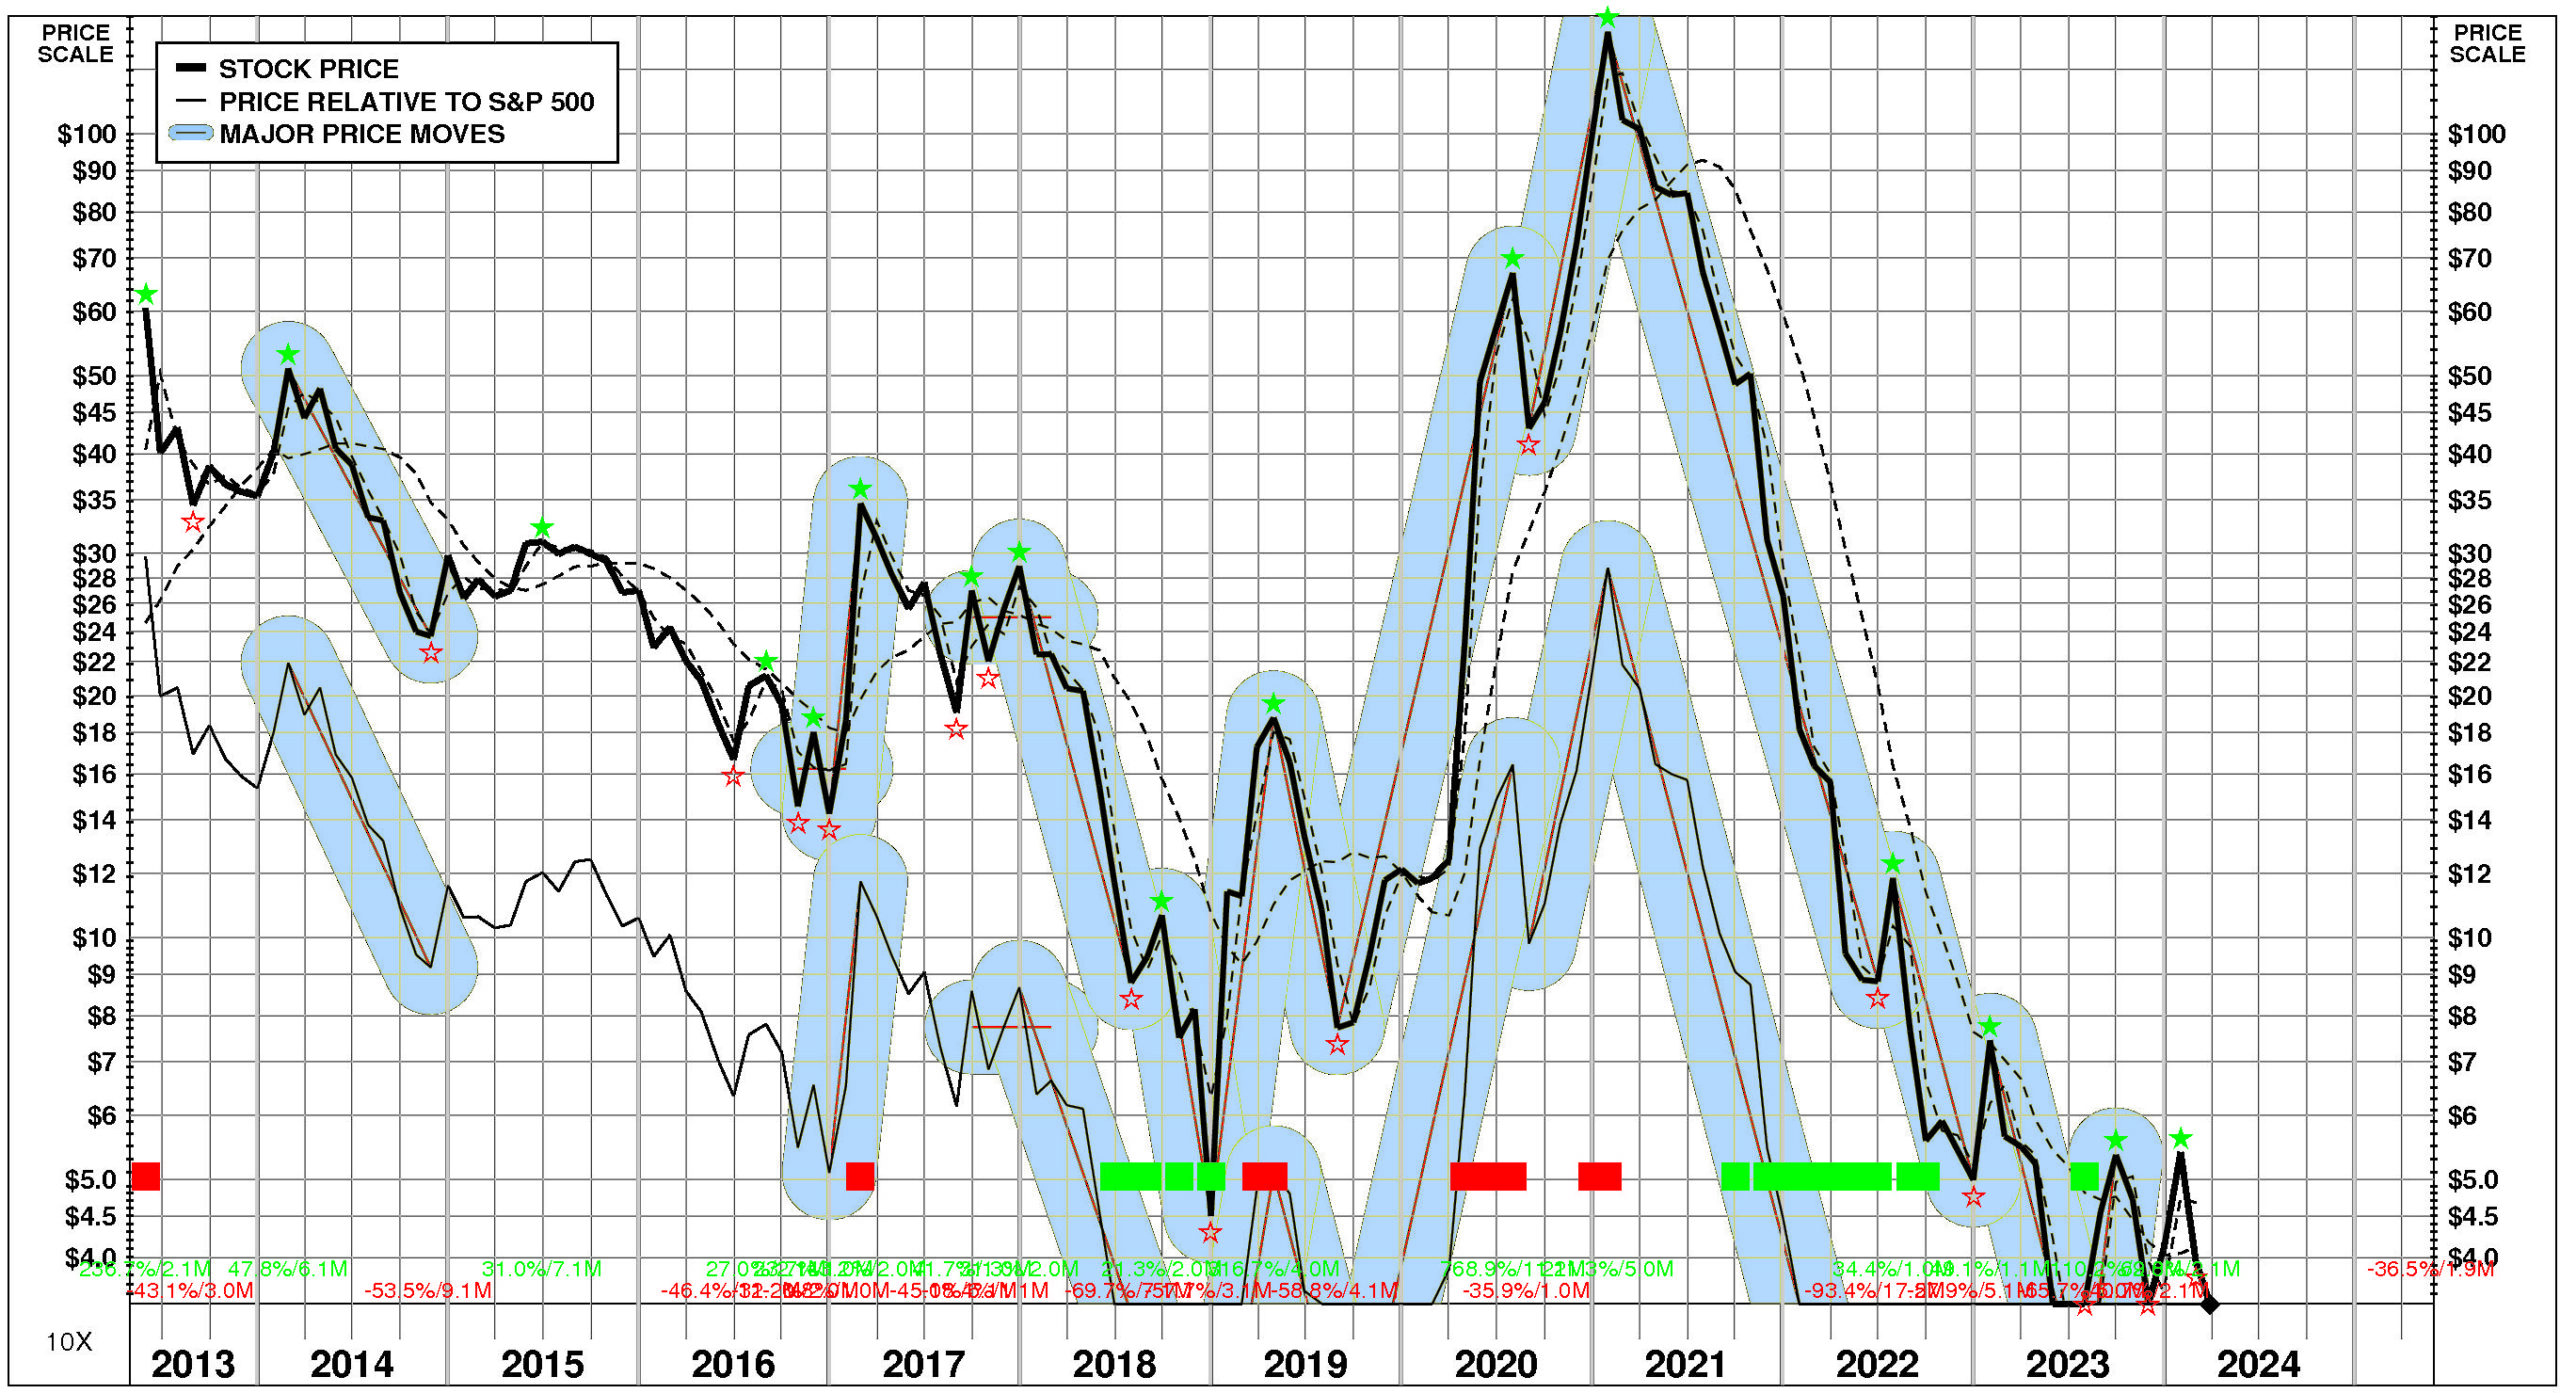
PRICE HISTORY
Over the full time period, Aspira Womens Health's stock price performance has been extremely volatile and significantly below market.
Between May, 2013 and March, 2024, Aspira Womens Health's stock price fell -94%; relative to the market, this was a -98% loss. Significant price moves during the period: 1) July, 2023 – September, 2023: +110%; 2) January, 2023 – July, 2023: -66%; 3) July, 2022 – December, 2022: -58%; 4) January, 2021 – June, 2022: -93%; 5) August, 2020 – January, 2021: +211%; and 6) August, 2019 – July, 2020: +769%.
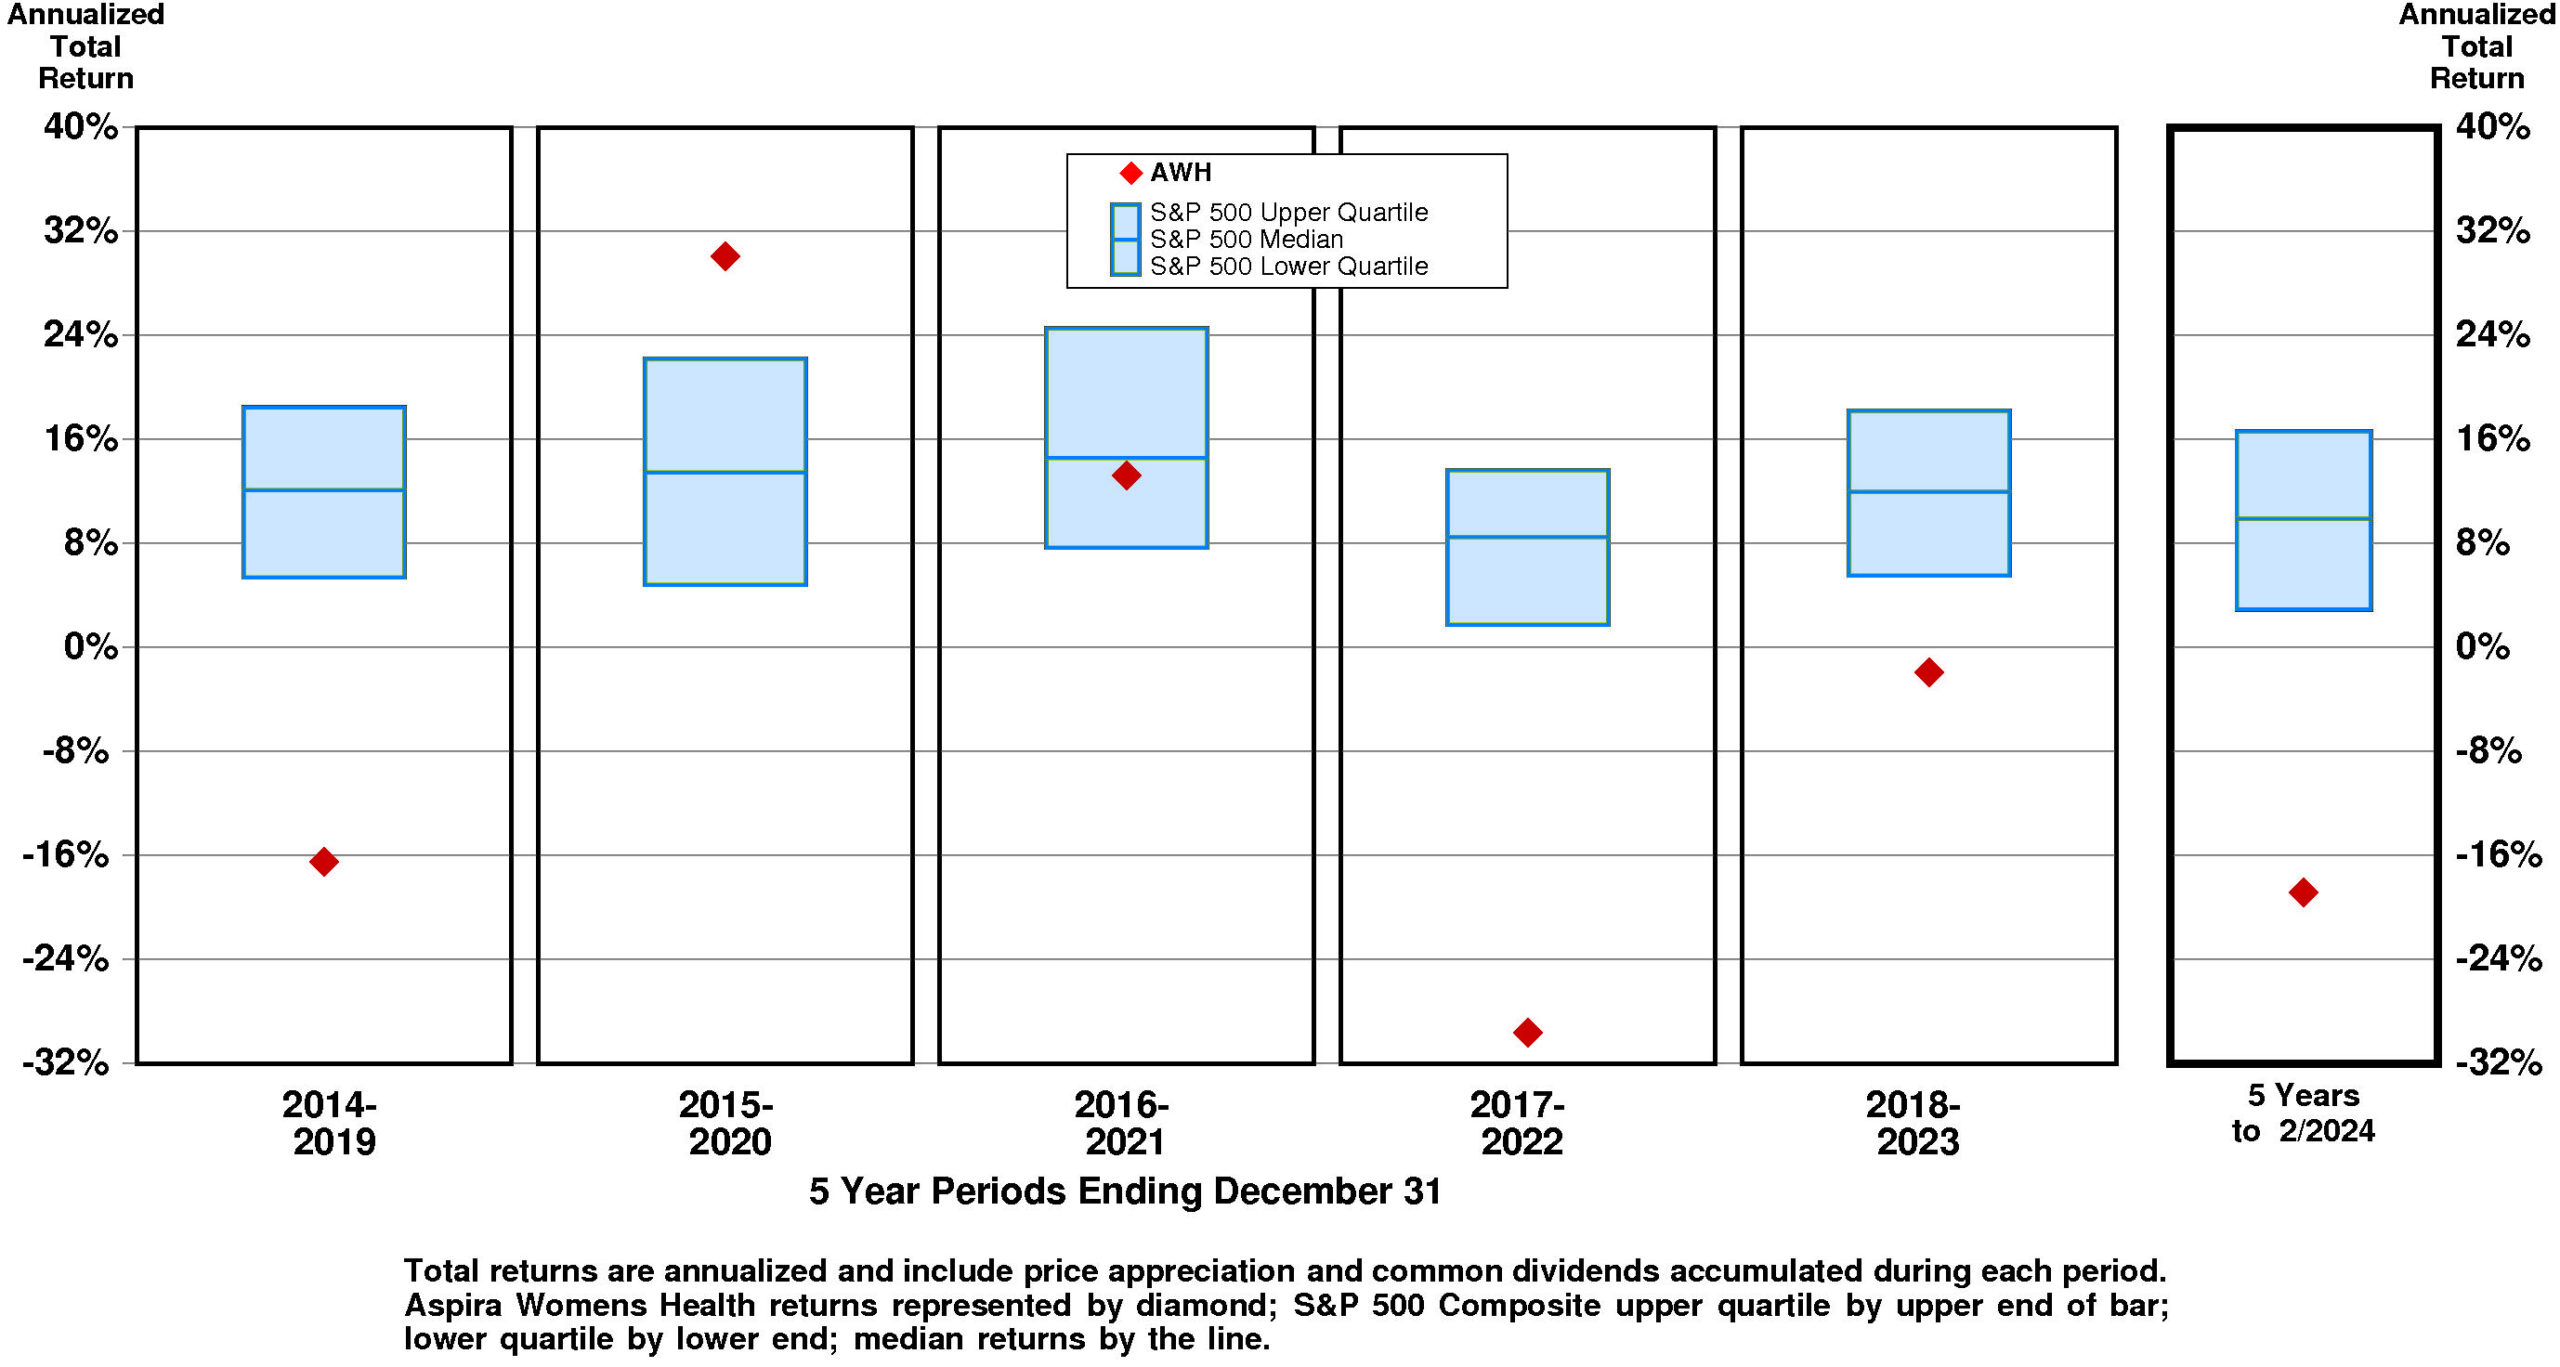
TOTAL INVESTMENT RETURNS
Current annual total return performance of -30.0% is lower quartile relative to the S&P 500 Composite.
In addition to being lower quartile relative to S&P 500 Composite, current annual total return performance through February, 2024 of -30.0% is below median relative to Aspira Womens Health Inc Peer Group.
Current 5-year total return performance of -18.9% is lower quartile relative to the S&P 500 Composite.
Through February, 2024, with lower quartile current 5-year total return of -18.9% relative to S&P 500 Composite, Aspira Womens Health's total return performance is slightly above median relative to Aspira Womens Health Inc Peer Group.
VALUATION BENCHMARKS
Relative to S&P 500 Composite, AWH's overall valuation is quite high.
Ratio of enterprise value/assets is upper quartile. Ratio of enterprise value/revenue is slightly above median. Price/equity ratio is unavailable. Price/earnings ratio is unavailable. Ratio of enterprise value/earnings before interest and taxes is unavailable.
Relative to Aspira Womens Health Peer Group, AWH's overall valuation is normal.
Ratio of enterprise value/assets is near the upper quartile. Ratio of enterprise value/revenue is below median. Price/equity ratio is unavailable. Price/earnings ratio is unavailable. Ratio of enterprise value/earnings before interest and taxes is unavailable.

Aspira Womens Health has no value gap compared to the median valuation.
For AWH to rise to median valuation, its current ratio of enterprise value/revenue would have to rise from the current level of 4.12X to 4.82X. If AWH's ratio of enterprise value/revenue were to rise to 4.82X, its stock price would be lower by $1 to $4.
For AWH to hit lower quartile valuation relative to the Aspira Womens Health Peer Group, its current ratio of enterprise value/revenue would have to fall from the current level of 4.12X to 3.68X. If AWH's ratio of enterprise value/revenue were to fall to 3.68X, its stock price would decline by $-0 from the current level of $3.43.
VALUE TARGETS
AWH is expected to continue to be a modest Value Eraser reflecting capital returns that are forecasted to fall short of the cost of capital.
Aspira Womens Health's current Price Target of $1 represents a -78% change from the current price of $3.43.
Aspira Womens Health's very low appreciation potential results in an appreciation score of 4 (96% of the universe has greater appreciation potential.)
Notwithstanding this low Appreciation Score of 4, the high Power Rating of 78 results in an Value Trend Rating of D.
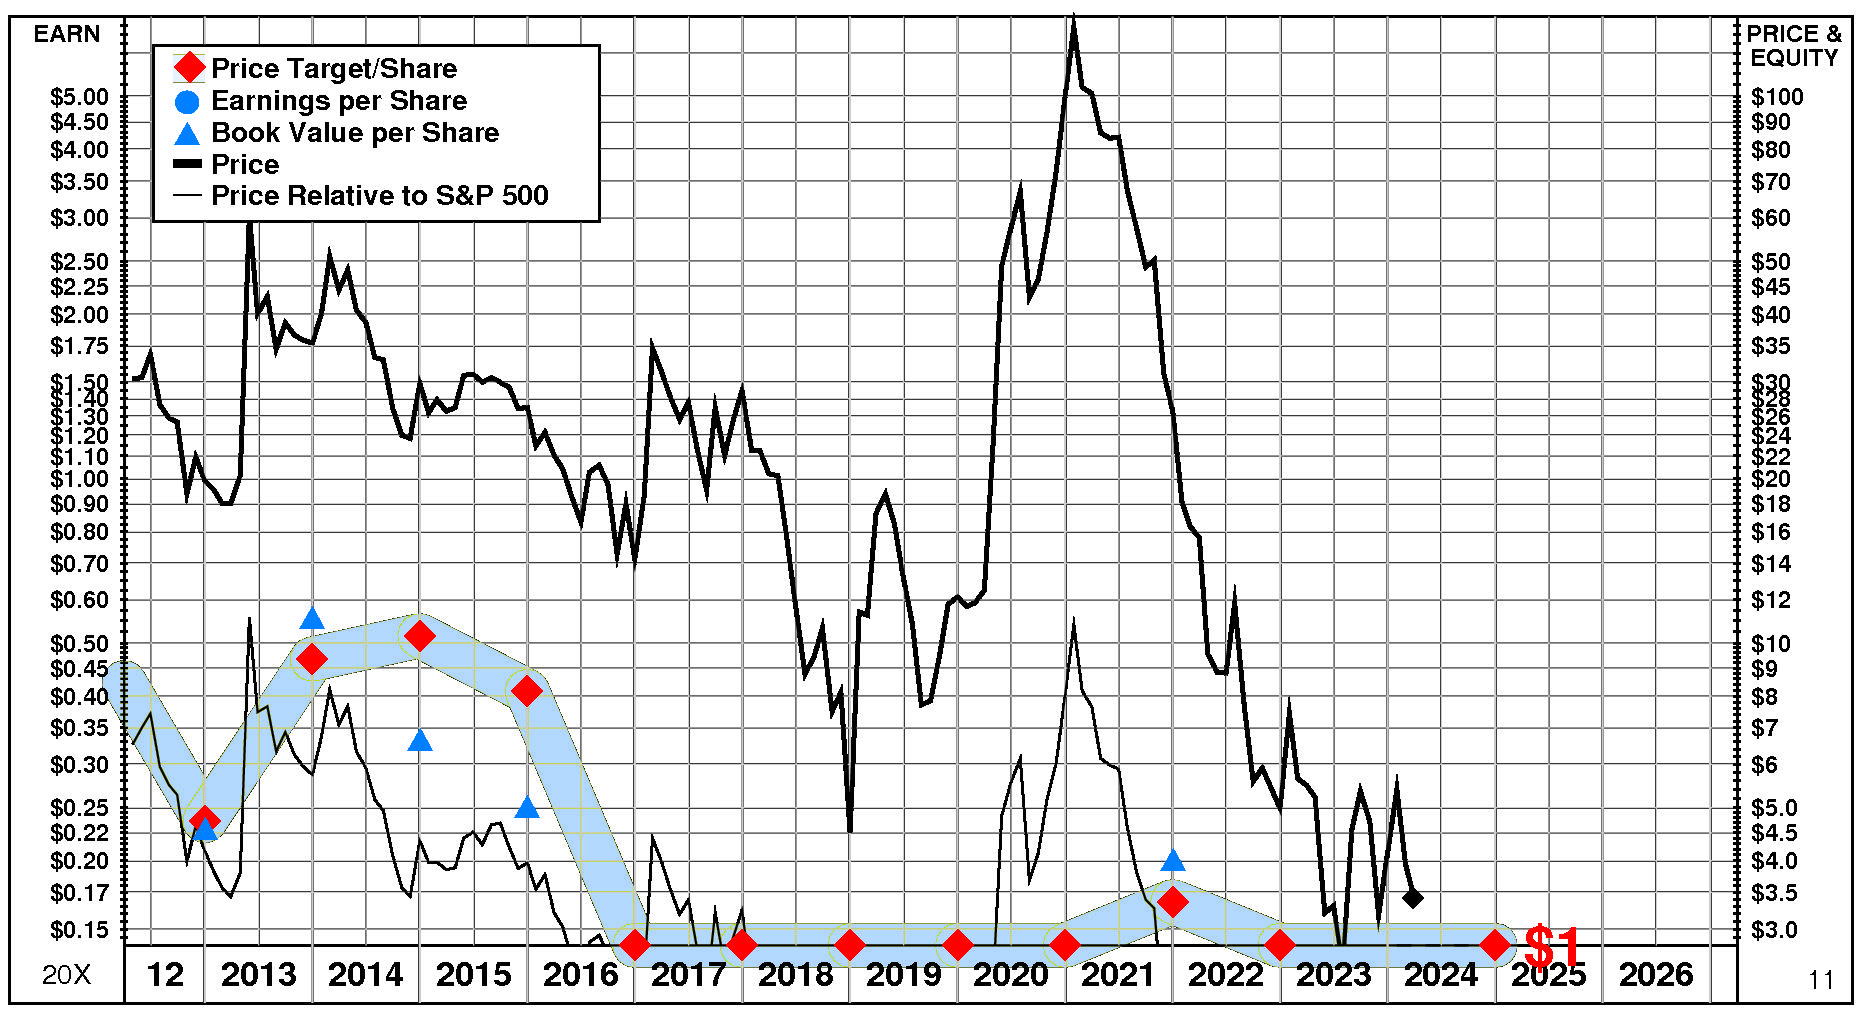
Aspira Womens Health's current Price Target is $1 (+6% from the 2022 Target of $1 but -78% from the 03/27/24 price of $3.43).
This slight rise in the Target is the result of a +6% increase in the equity base and a +0% change in the price/equity multiple. None of the Value Drivers has an impact on the price/equity multiple. The forecasted decline in growth has no impact on the multiple. The forecasted decline in cost of equity also has no impact and the flat return on equity didn't either.
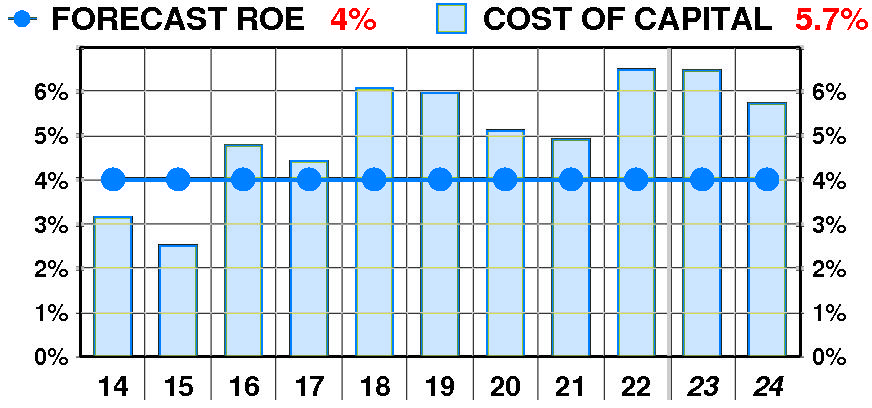
PTR's return on equity forecast is 4.0% — in line with our recent forecasts.
Forecasted return on equity erratic but little changed between 2014 and 2022. The current forecast is steady at the 2014 low of 4%.
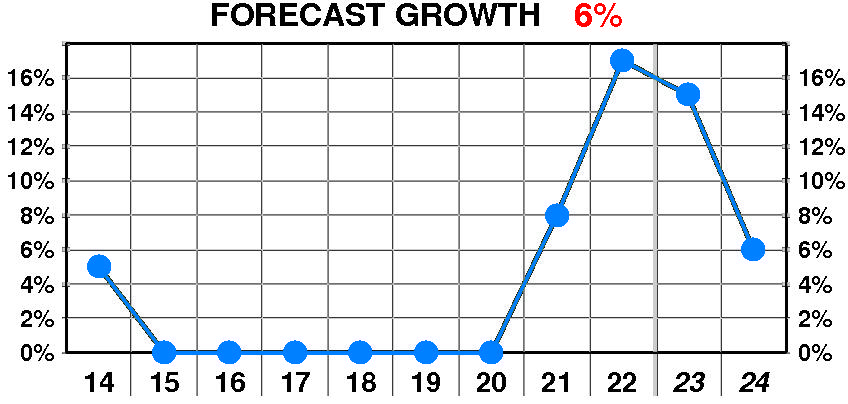
PTR's growth forecast is 6.0% — above our recent forecasts.
Forecasted growth enjoyed a dramatic, variable increase between 2014 and 2022. The current forecast is well above the 2020 low of 0%.
PTR's cost of equity forecast is 5.7% — in line with recent levels.
Forecasted cost of equity suffered a dramatic, erratic increase between 2014 and 2022. The current forecast is above the 2015 low of 2.5%.
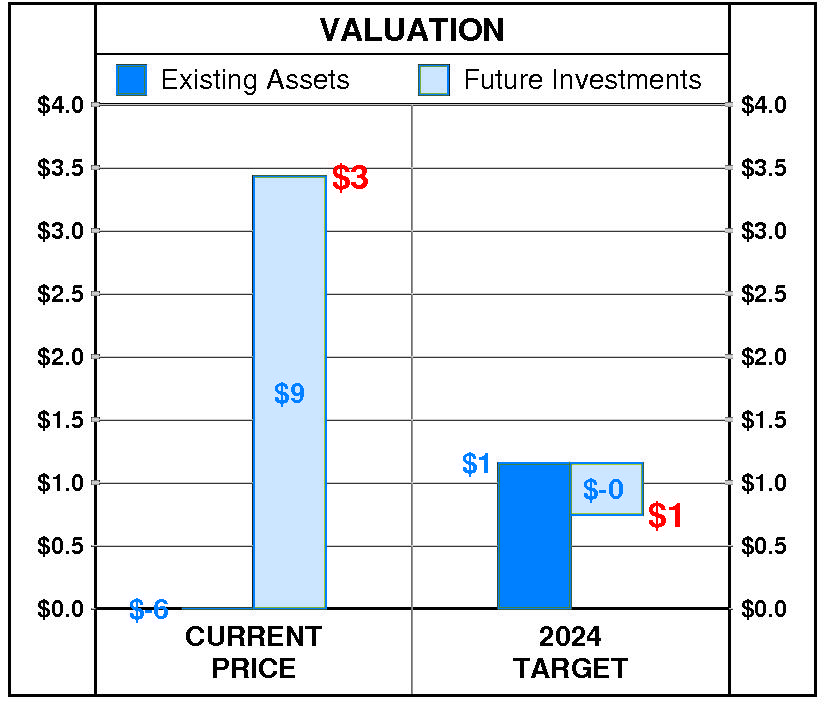
At Aspira Womens Health's current price of $3.43, investors are placing a positive value of $9 on its future investments. This view is not supported by the company's most recent performance that reflected a growth rate of 17.0% per year, and a return on equity of 4.0% versus a cost of equity of 6.5%.
PTR's 2024 Price Target of $1 is based on these forecasts and reflects an estimated value of existing assets of $1 and a value of future investments of $-0.