![]()
BUSINESS
Moody’s Corporation operates as an integrated risk assessment firm worldwide. It operates in two segments, Moody’s Investors Service and Moody’s Analytics. The Moody’s Investors Service segment publishes credit ratings and provides assessment services on various debt obligations, programs and facilities, and entities that issue such obligations, such as various corporate, financial institution, and governmental obligations, as well as and structured finance securities. This segment provides ratings in approximately 140 countries. Its ratings are disseminated through press releases to the public through electronic media, including the internet and real-time information systems used by securities traders and investors.
INVESTMENT RATING
Reflecting future returns on capital that are forecasted to be above the cost of capital, MCO is expected to continue to be a major Value Builder.
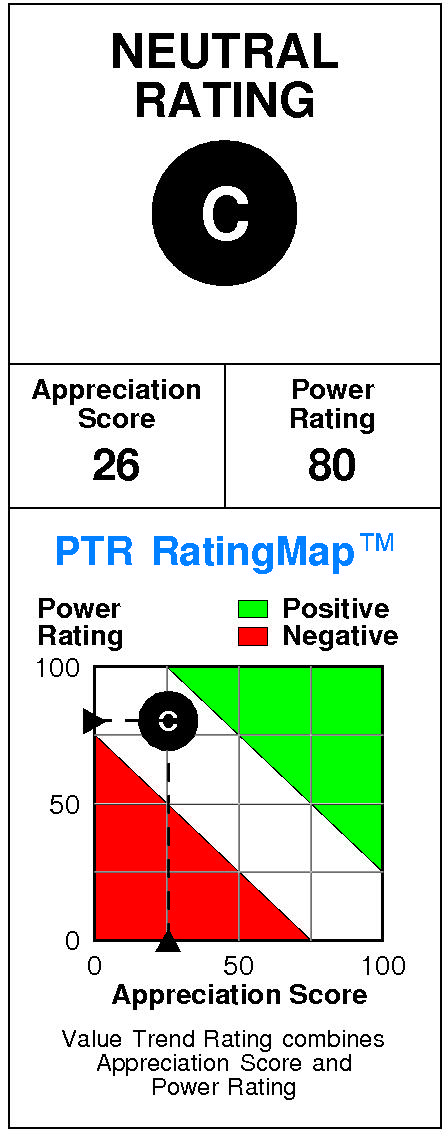
Moody’s has a current Value Trend Rating of C (Neutral).
The Value Trend Rating reflects very contradictory signals from PTR’s two proprietary measures of a stock’s attractiveness. Moody’s has a poor Appreciation Score of 26 but a good Power Rating of 80, leading to the Neutral Value Trend Rating.
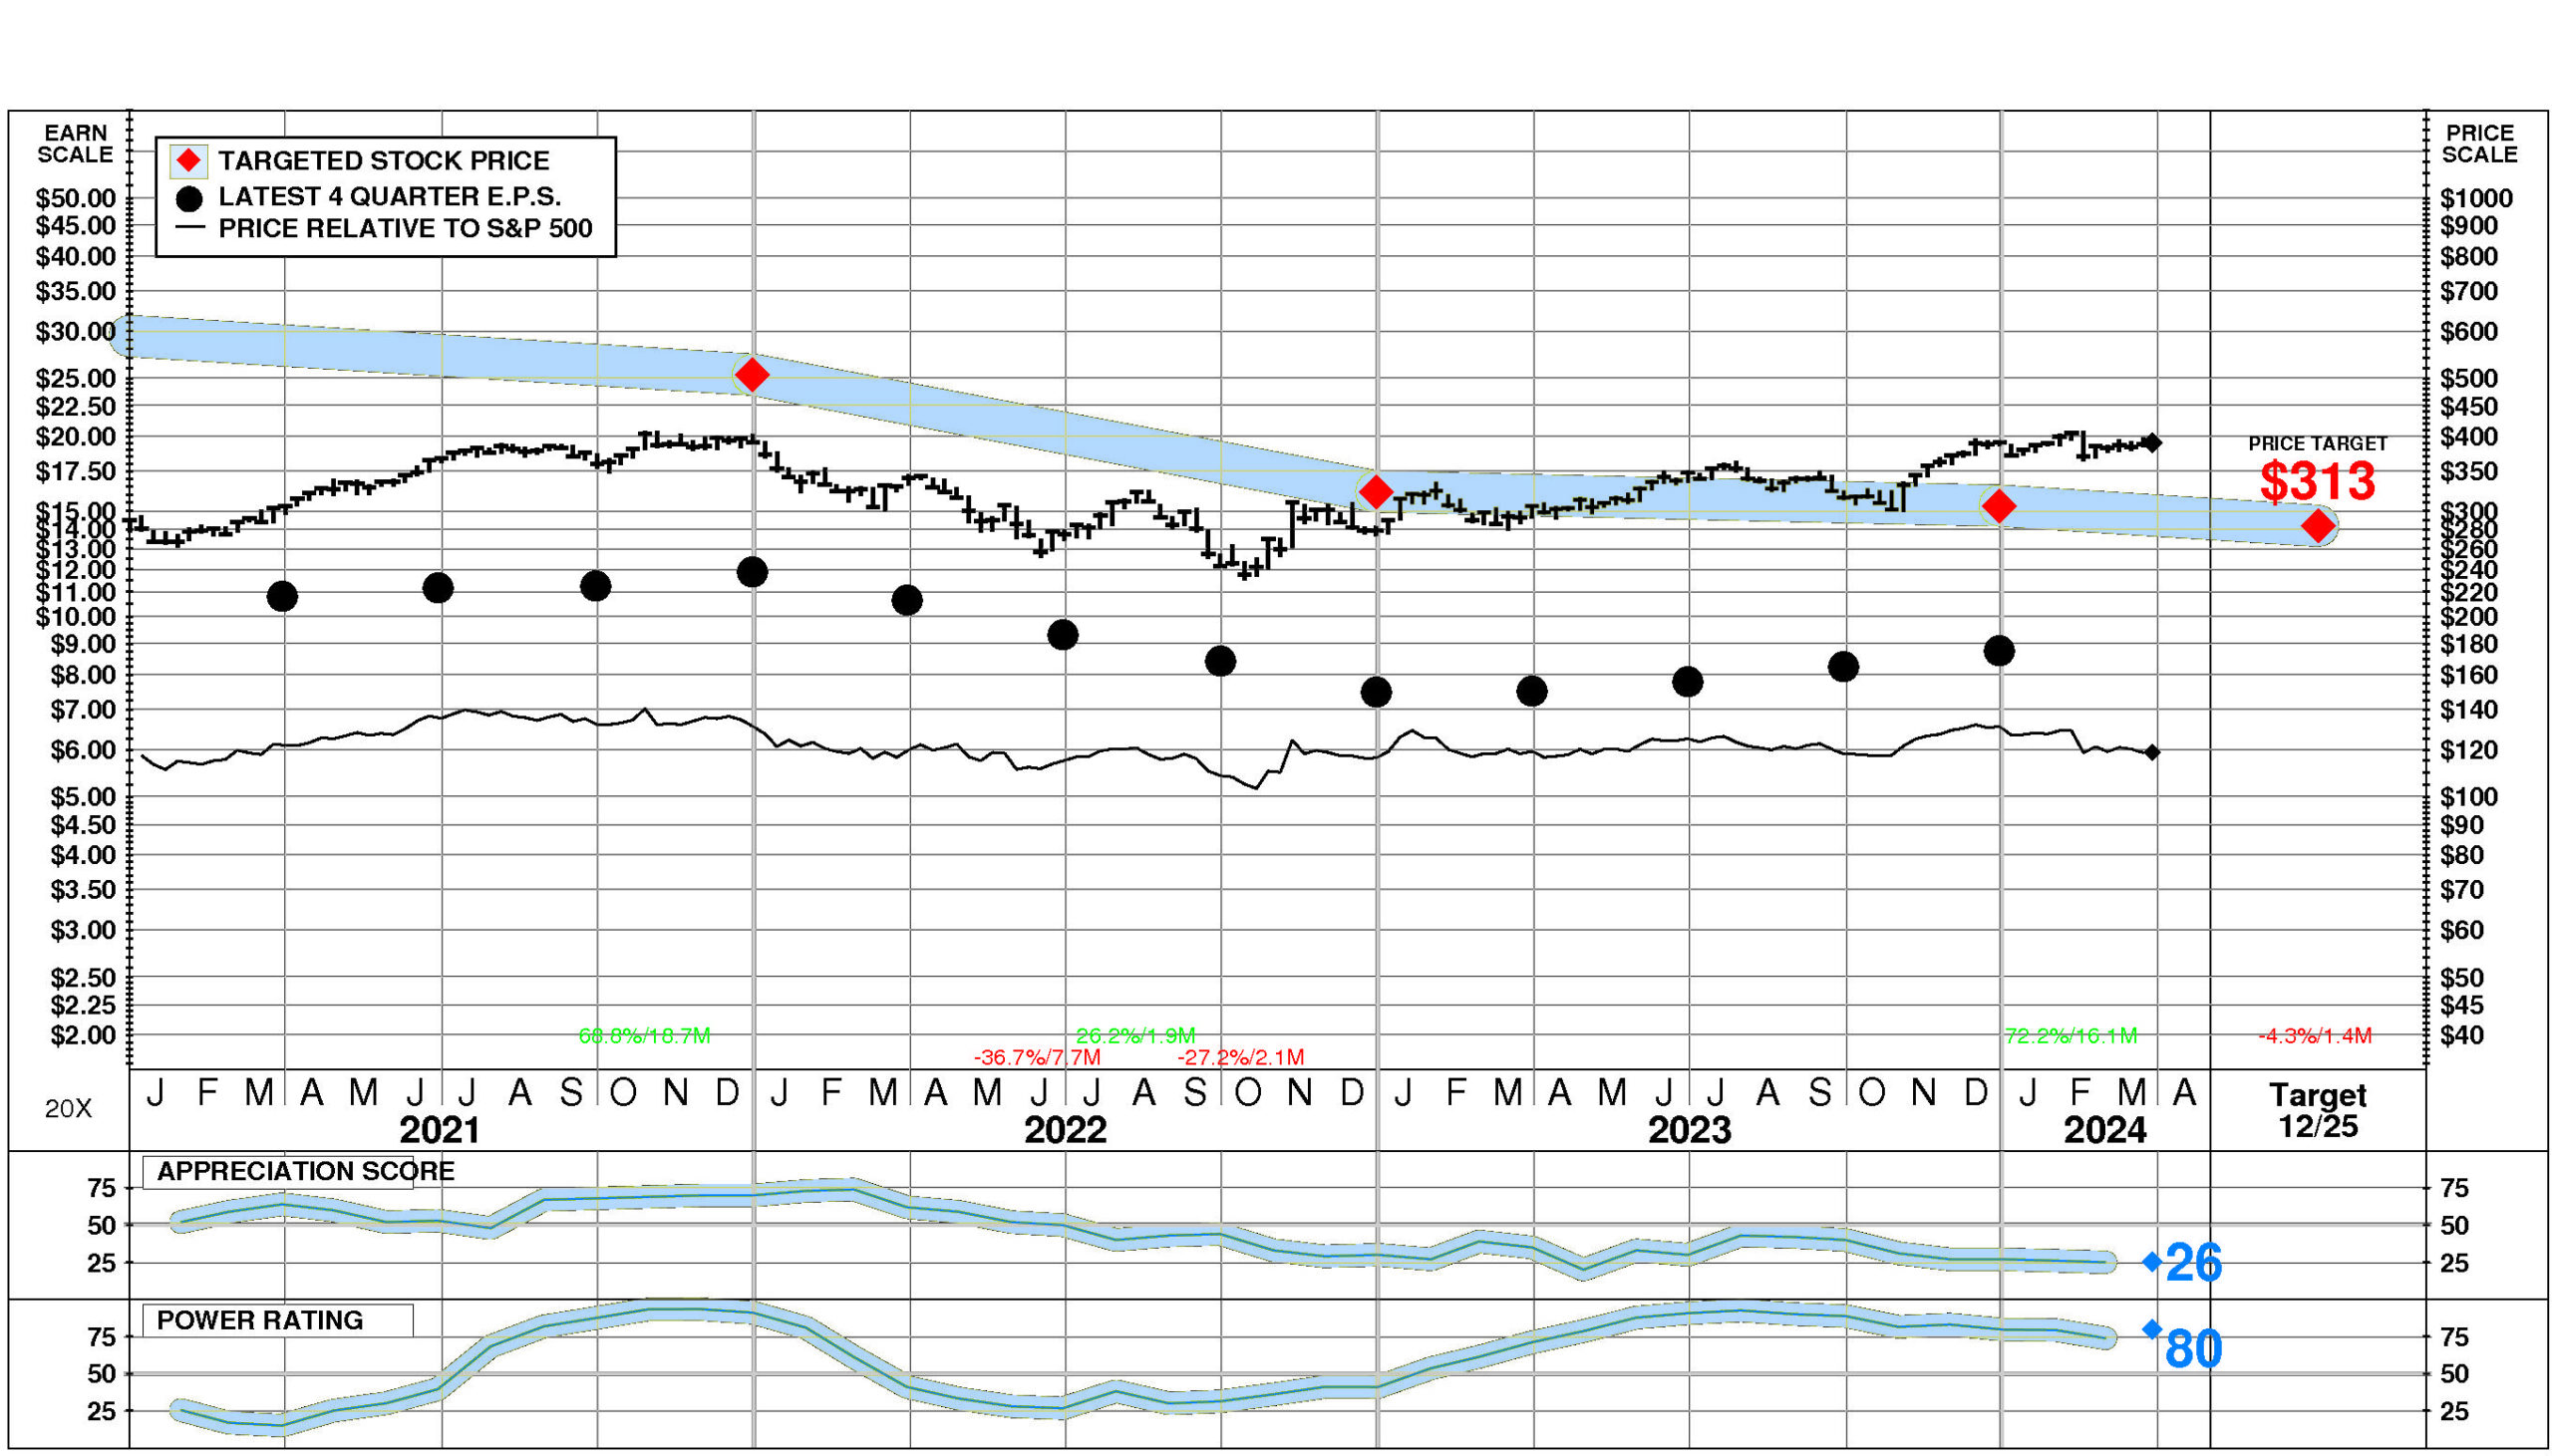
Moody’s stock is selling well above targeted value. The current stock price of $390.24 compares to targeted value 12 months forward of $283.
This low appreciation potential results in an appreciation score of 26 (74% of the universe has greater appreciation potential.)
Moody’s has a Power Rating of 80. (This good Power Rating indicates that MCO has a better chance of achieving attractive investment performance over the near to intermediate term than all but 20% of companies in the universe.)
Factors contributing to this good Power Rating include: recent price action has been favorable; the comparison group is currently in a modestly favorable position; and earnings estimate behavior for MCO has been slightly favorable recently.
INVESTMENT PROFILE
Moody’s financial strength is exceptional. Financial strength rating is 92.
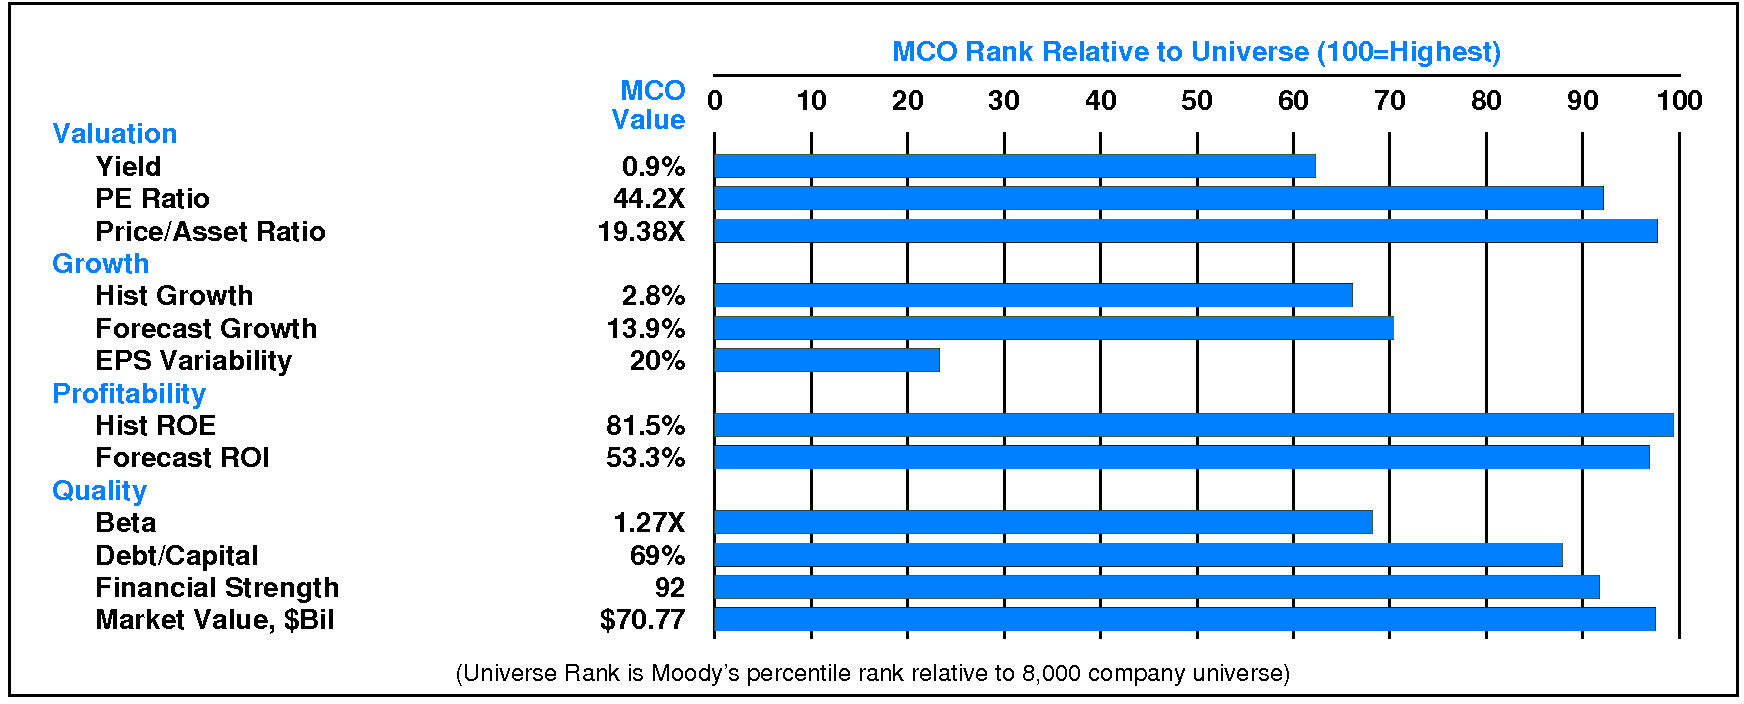
Relative to the S&P 500 Composite, Moody’s Corp. has significant Growth characteristics; its appeal is likely to be to investors heavily oriented toward Capital Gains; the perception is that MCO is normal risk. Relative weaknesses include: high stock price volatility, high financial leverage, and low historical growth. Moody’s valuation is high: moderate dividend yield, high P/E ratio, and high price/book ratio. MCO has high market capitalization.
CURRENT SIGNALS
Moody’s current operations are eroding. Return on equity is falling, reflecting: falling asset utilization; declining pretax margin; and falling leverage.
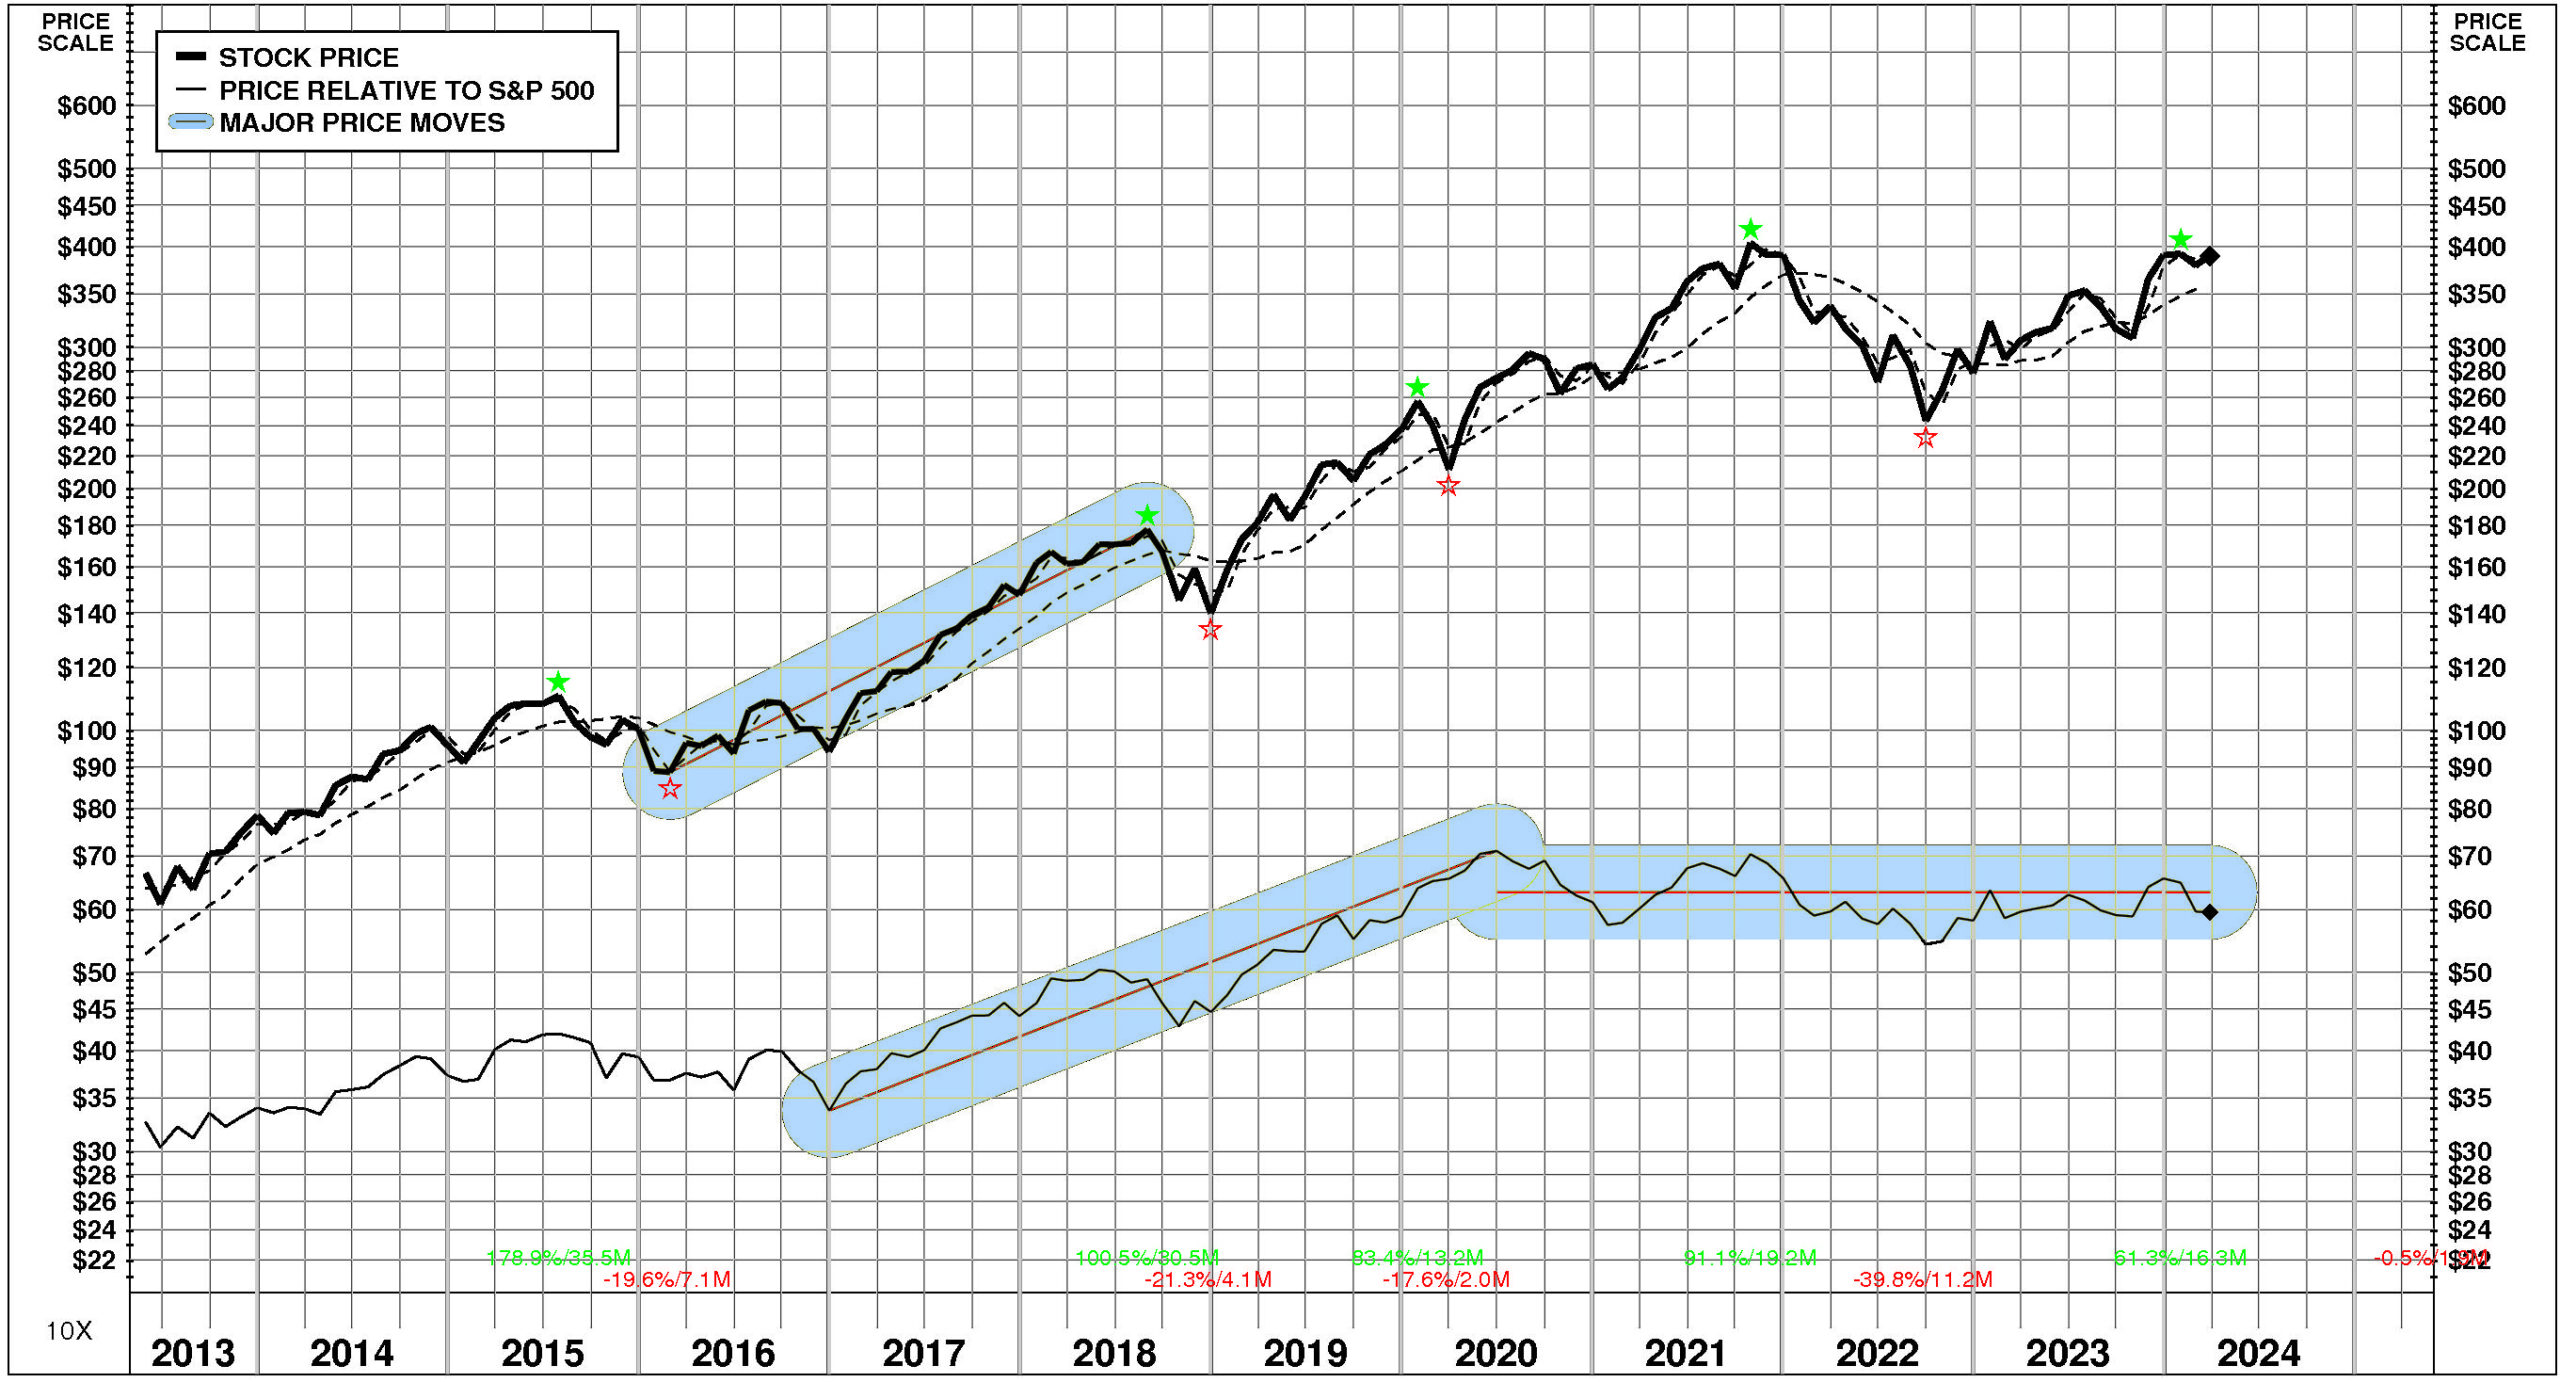
Moody’s current technical position is very strong. The stock price is in a 16.1 month up move. The stock has appreciated 72.2% from its prior low. The stock price is above its 200 day moving average which is in an uptrend.
ALERTS
Moody’s Corp. (NYSE: MCO) has recently enjoyed slight positive changes in fundamentals: significant quarterly earnings acceleration occurred.
The stock is currently rated C.
Moody’s Corp. (NYSE: MCO) stock declined slightly by -0.2% on 3/27/24. The stock closed at $390.24. However, trading volume in this decline was unusually low at 65% of normal. The stock has been strong relative to the market over the last nine months and has risen 0.8% during the last week.
CASH FLOW
In 2023, Moody’s generated a significant increase in cash of +$334 million (+18%). Sources of cash were larger than uses. Cash generated from 2023 EBITDA totaled +$2,597 million. Non-operating sources contributed +$6 million (+0% of EBITDA). Cash taxes consumed -$382 million (-15% of EBITDA). Re-investment in the business amounted to -$335 million (-13% of EBITDA). On a net basis, debt investors removed -$744 million (-29% of EBITDA) while equity investors pulled out -$808 million (-31% of EBITDA).
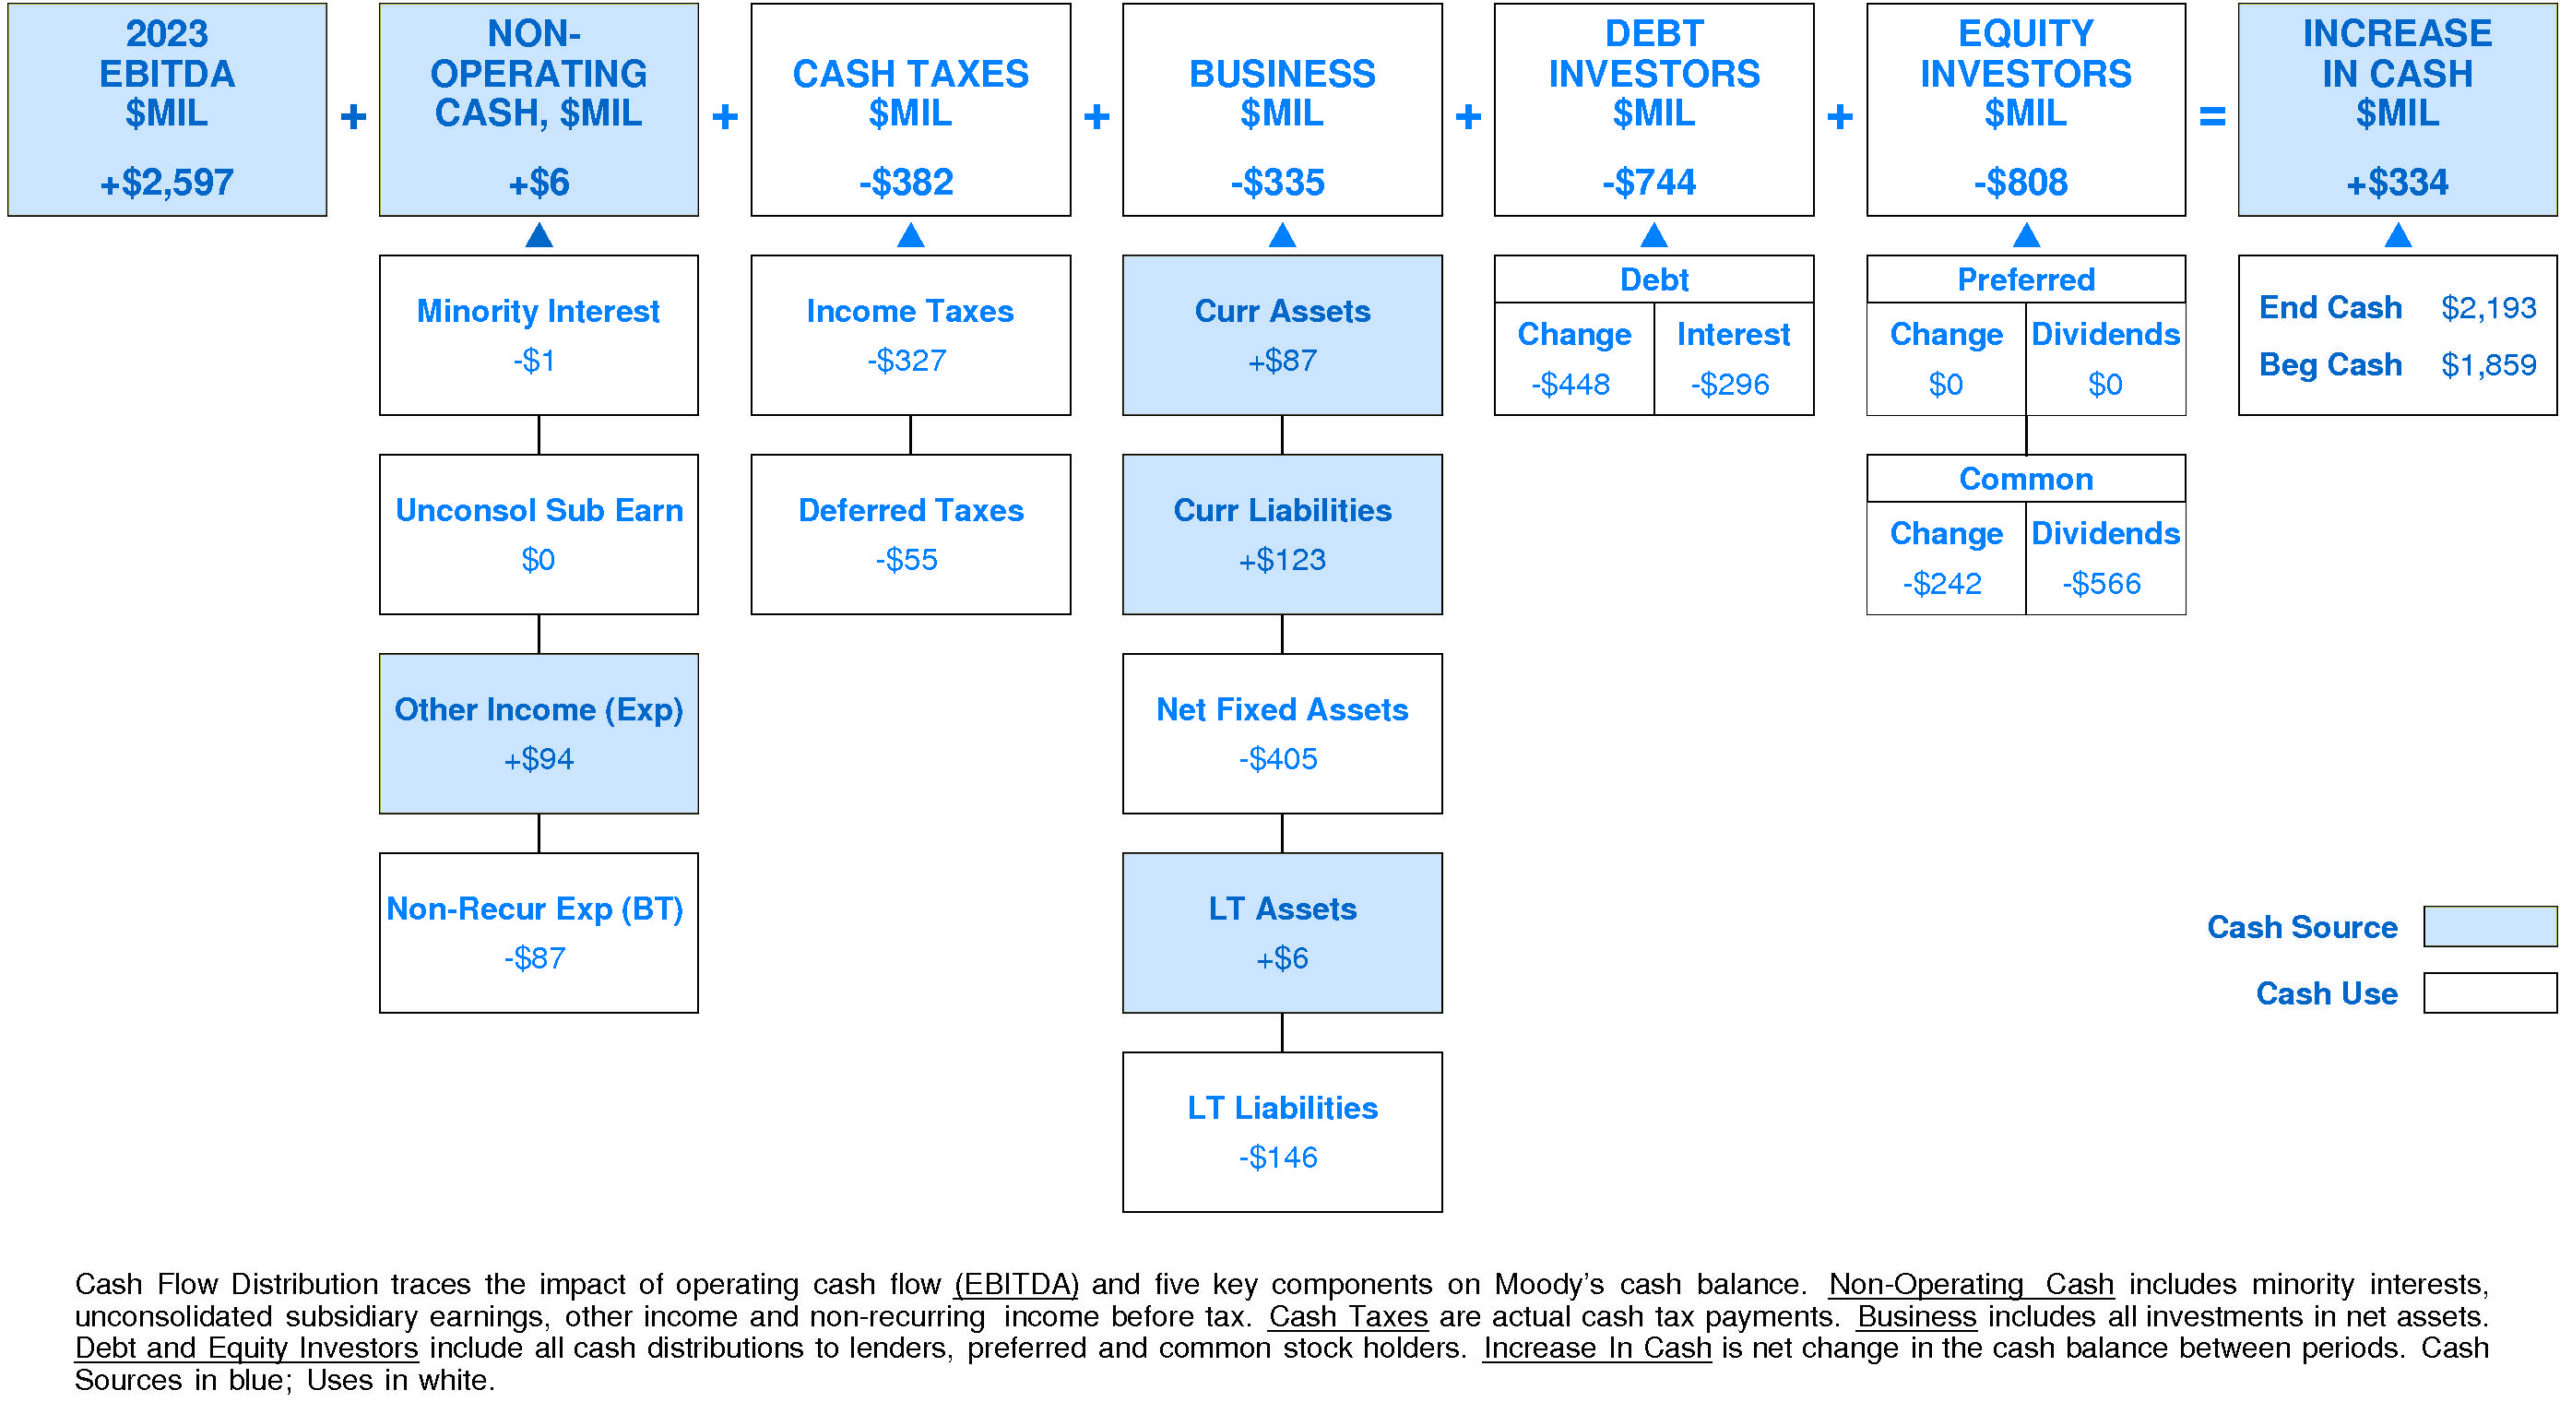
Moody’s Non-operating Income, %EBITDA has exhibited a volatile overall uptrend over the period. This improvement was accompanied by stability for the Moody’s Peer Group. In most years, Moody’s was in the top quartile and third quartile. Currently, Moody’s is slightly above median at +0% of EBITDA (+$6 million).
Moody’s Cash Taxes, %EBITDA has exhibited a very small overall uptrend over the period. This improvement was accompanied by a similar trend for the Moody’s Peer Group. In most years, Moody’s was in the third quartile and second quartile. Currently, Moody’s is at the upper quartile at -15% of EBITDA (-$382 million).
Moody’s Business Re-investment, %EBITDA has exhibited little to no overall change over the period. This stability was accompanied by a downtrend for the Moody’s Peer Group. In most years, Moody’s was in the top quartile and lower quartile. Currently, Moody’s is substantially above median at -13% of EBITDA (-$335 million).
Moody’s Debt Investors, %EBITDA has experienced a volatile overall downtrend over the period. This downtrend was accompanied by a similar trend for the Moody’s Peer Group. (Since 2021 Debt Investors, %EBITDA has accelerated very sharply.) In most years, Moody’s was in the top quartile and third quartile. Currently, Moody’s is lower quartile at -29% of EBITDA (-$744 million).
Moody’s Equity Investors, %EBITDA has enjoyed a volatile overall uptrend over the period. This improvement was accompanied by a similar trend for the Moody’s Peer Group. In most years, Moody’s was in the top quartile and second quartile. Currently, Moody’s is substantially above median at -31% of EBITDA (-$808 million).
Moody’s Change in Cash, %EBITDA has exhibited a volatile overall uptrend over the period. This improvement was accompanied by an opposite trend for the Moody’s Peer Group. (Since 2021 Change in Cash, %EBITDA has accelerated very sharply.) In most years, Moody’s was in the top quartile and lower quartile. Currently, Moody’s is at the upper quartile at +13% of EBITDA (+$334 million).
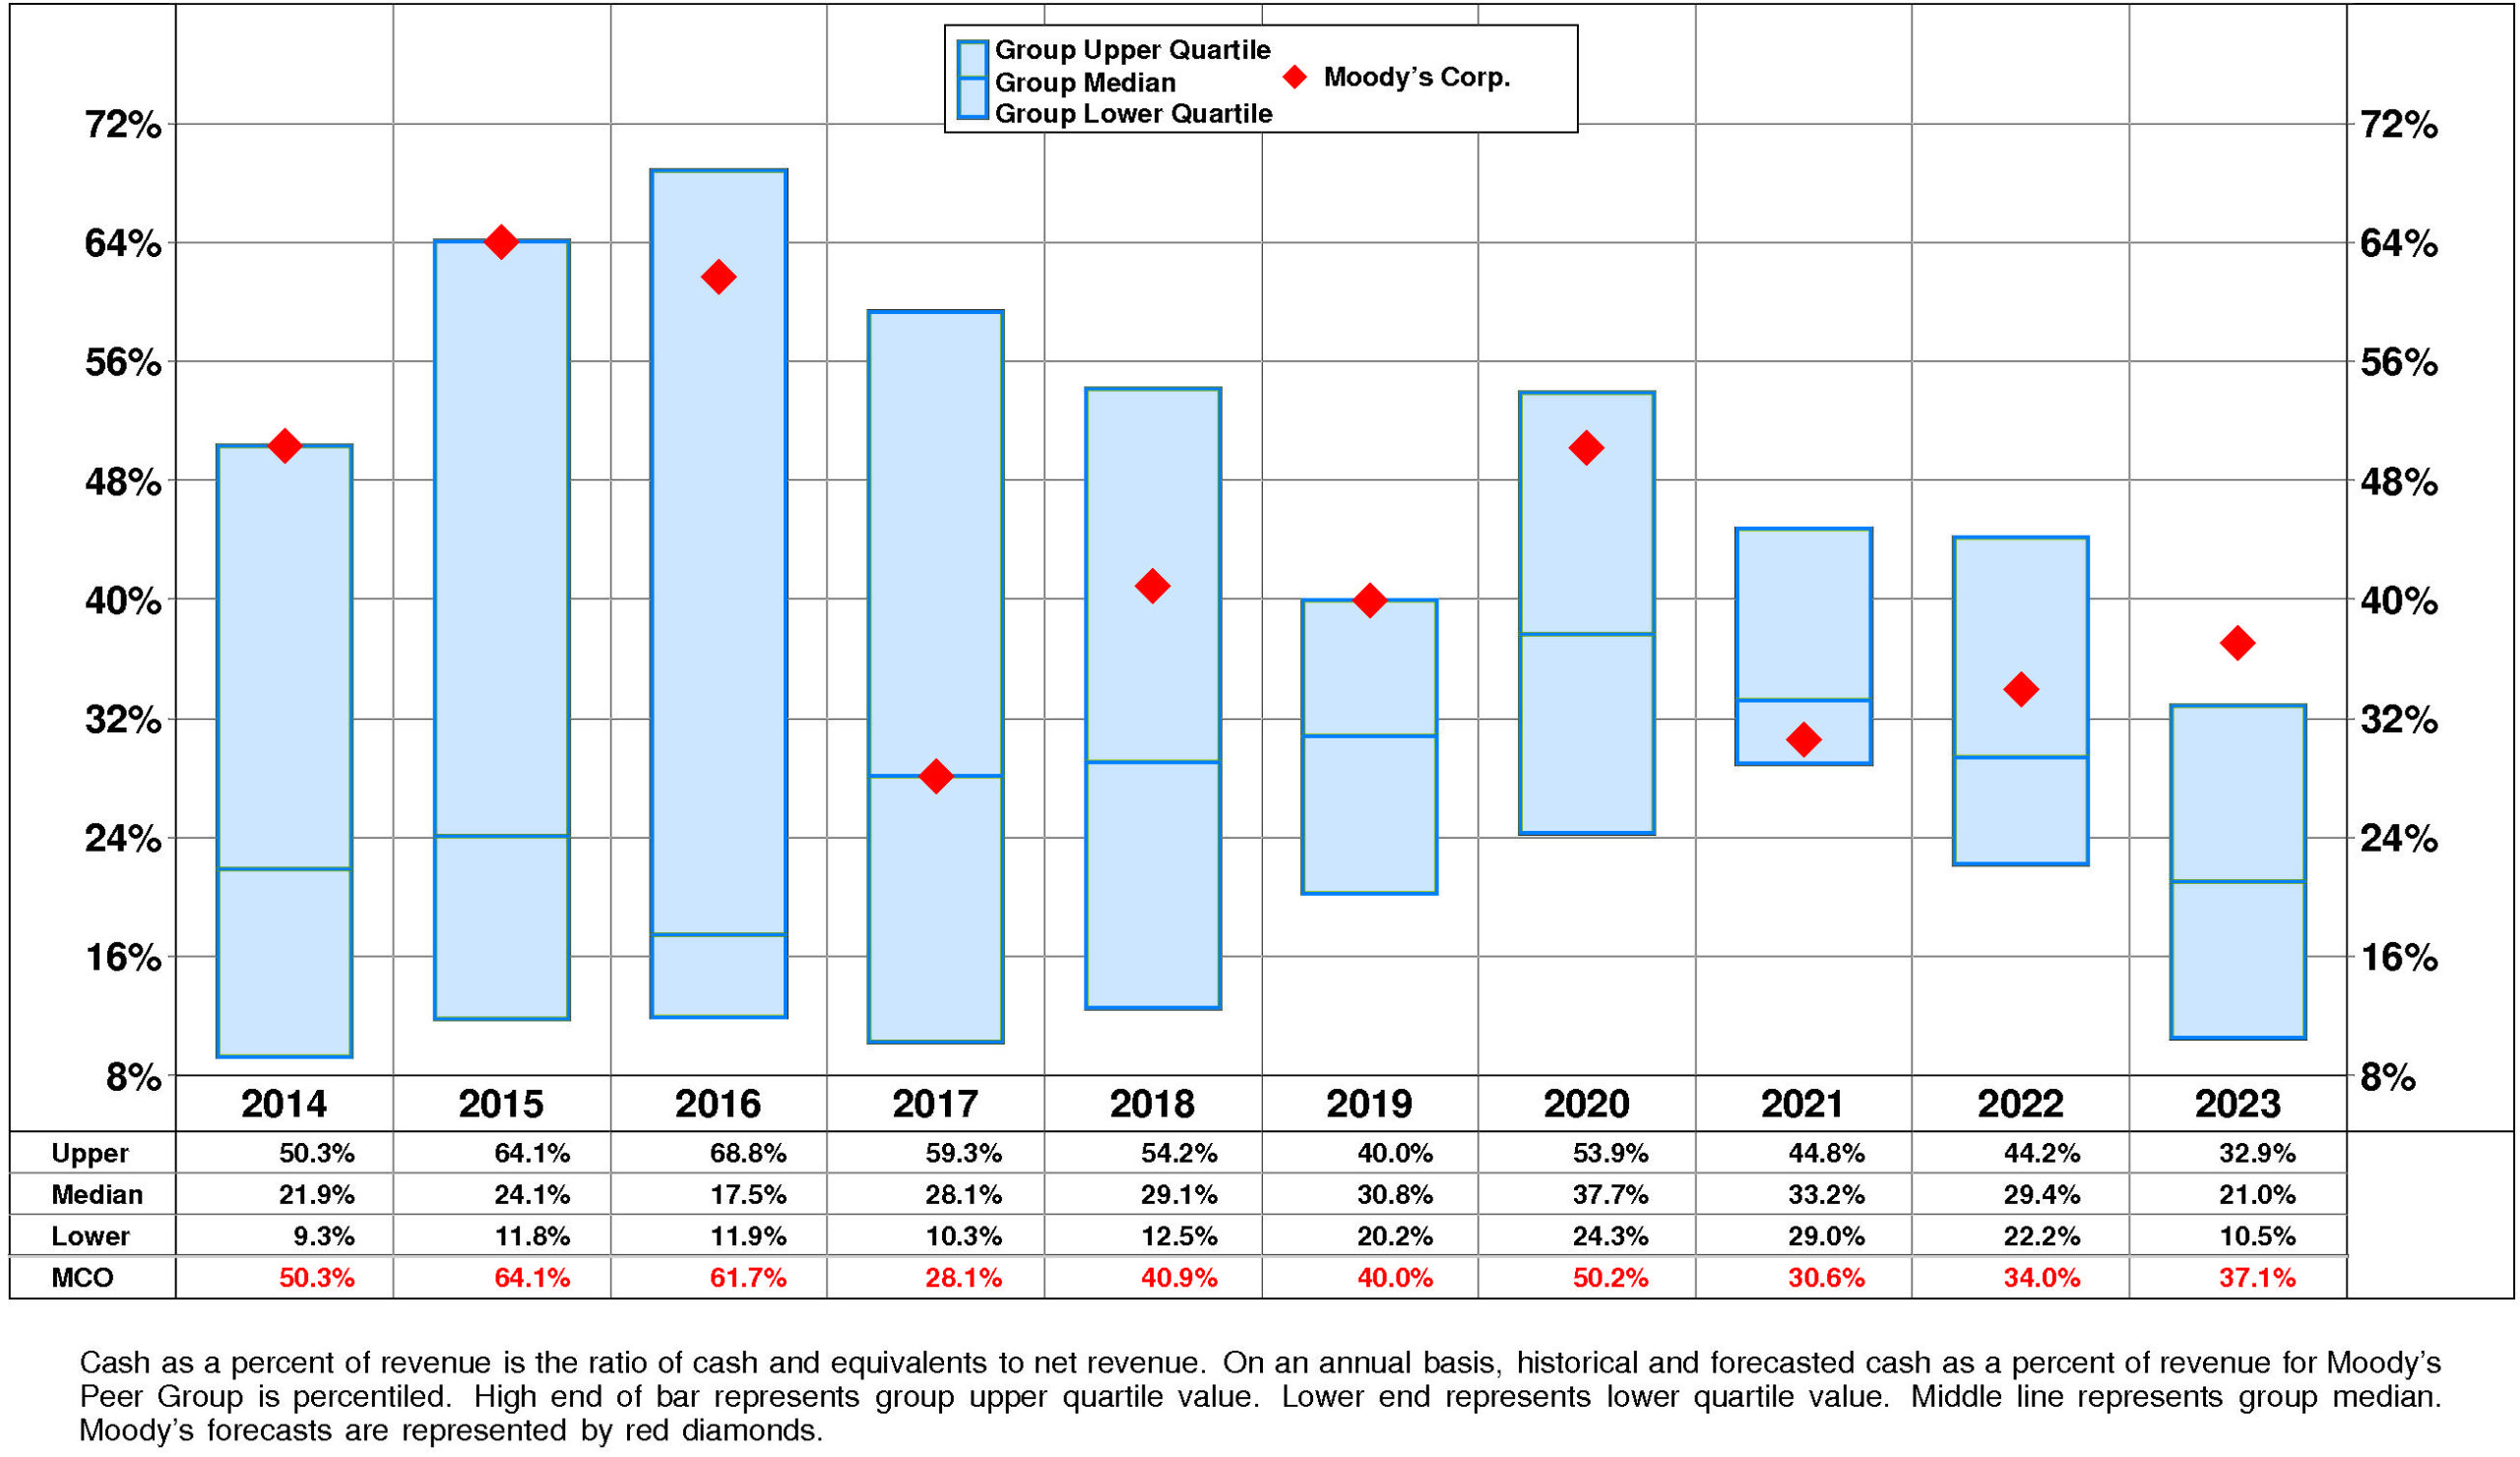
Moody’s Cash, %Revenue has suffered a strong overall downtrend over the period. This downtrend was accompanied by an opposite trend for the Moody’s Peer Group. (Since 2021 Cash, %Revenue has experienced a sharp recovery.) In most years, Moody’s was in the top quartile and second quartile. Currently, Moody’s is upper quartile at +37%.
PROFITABILITY
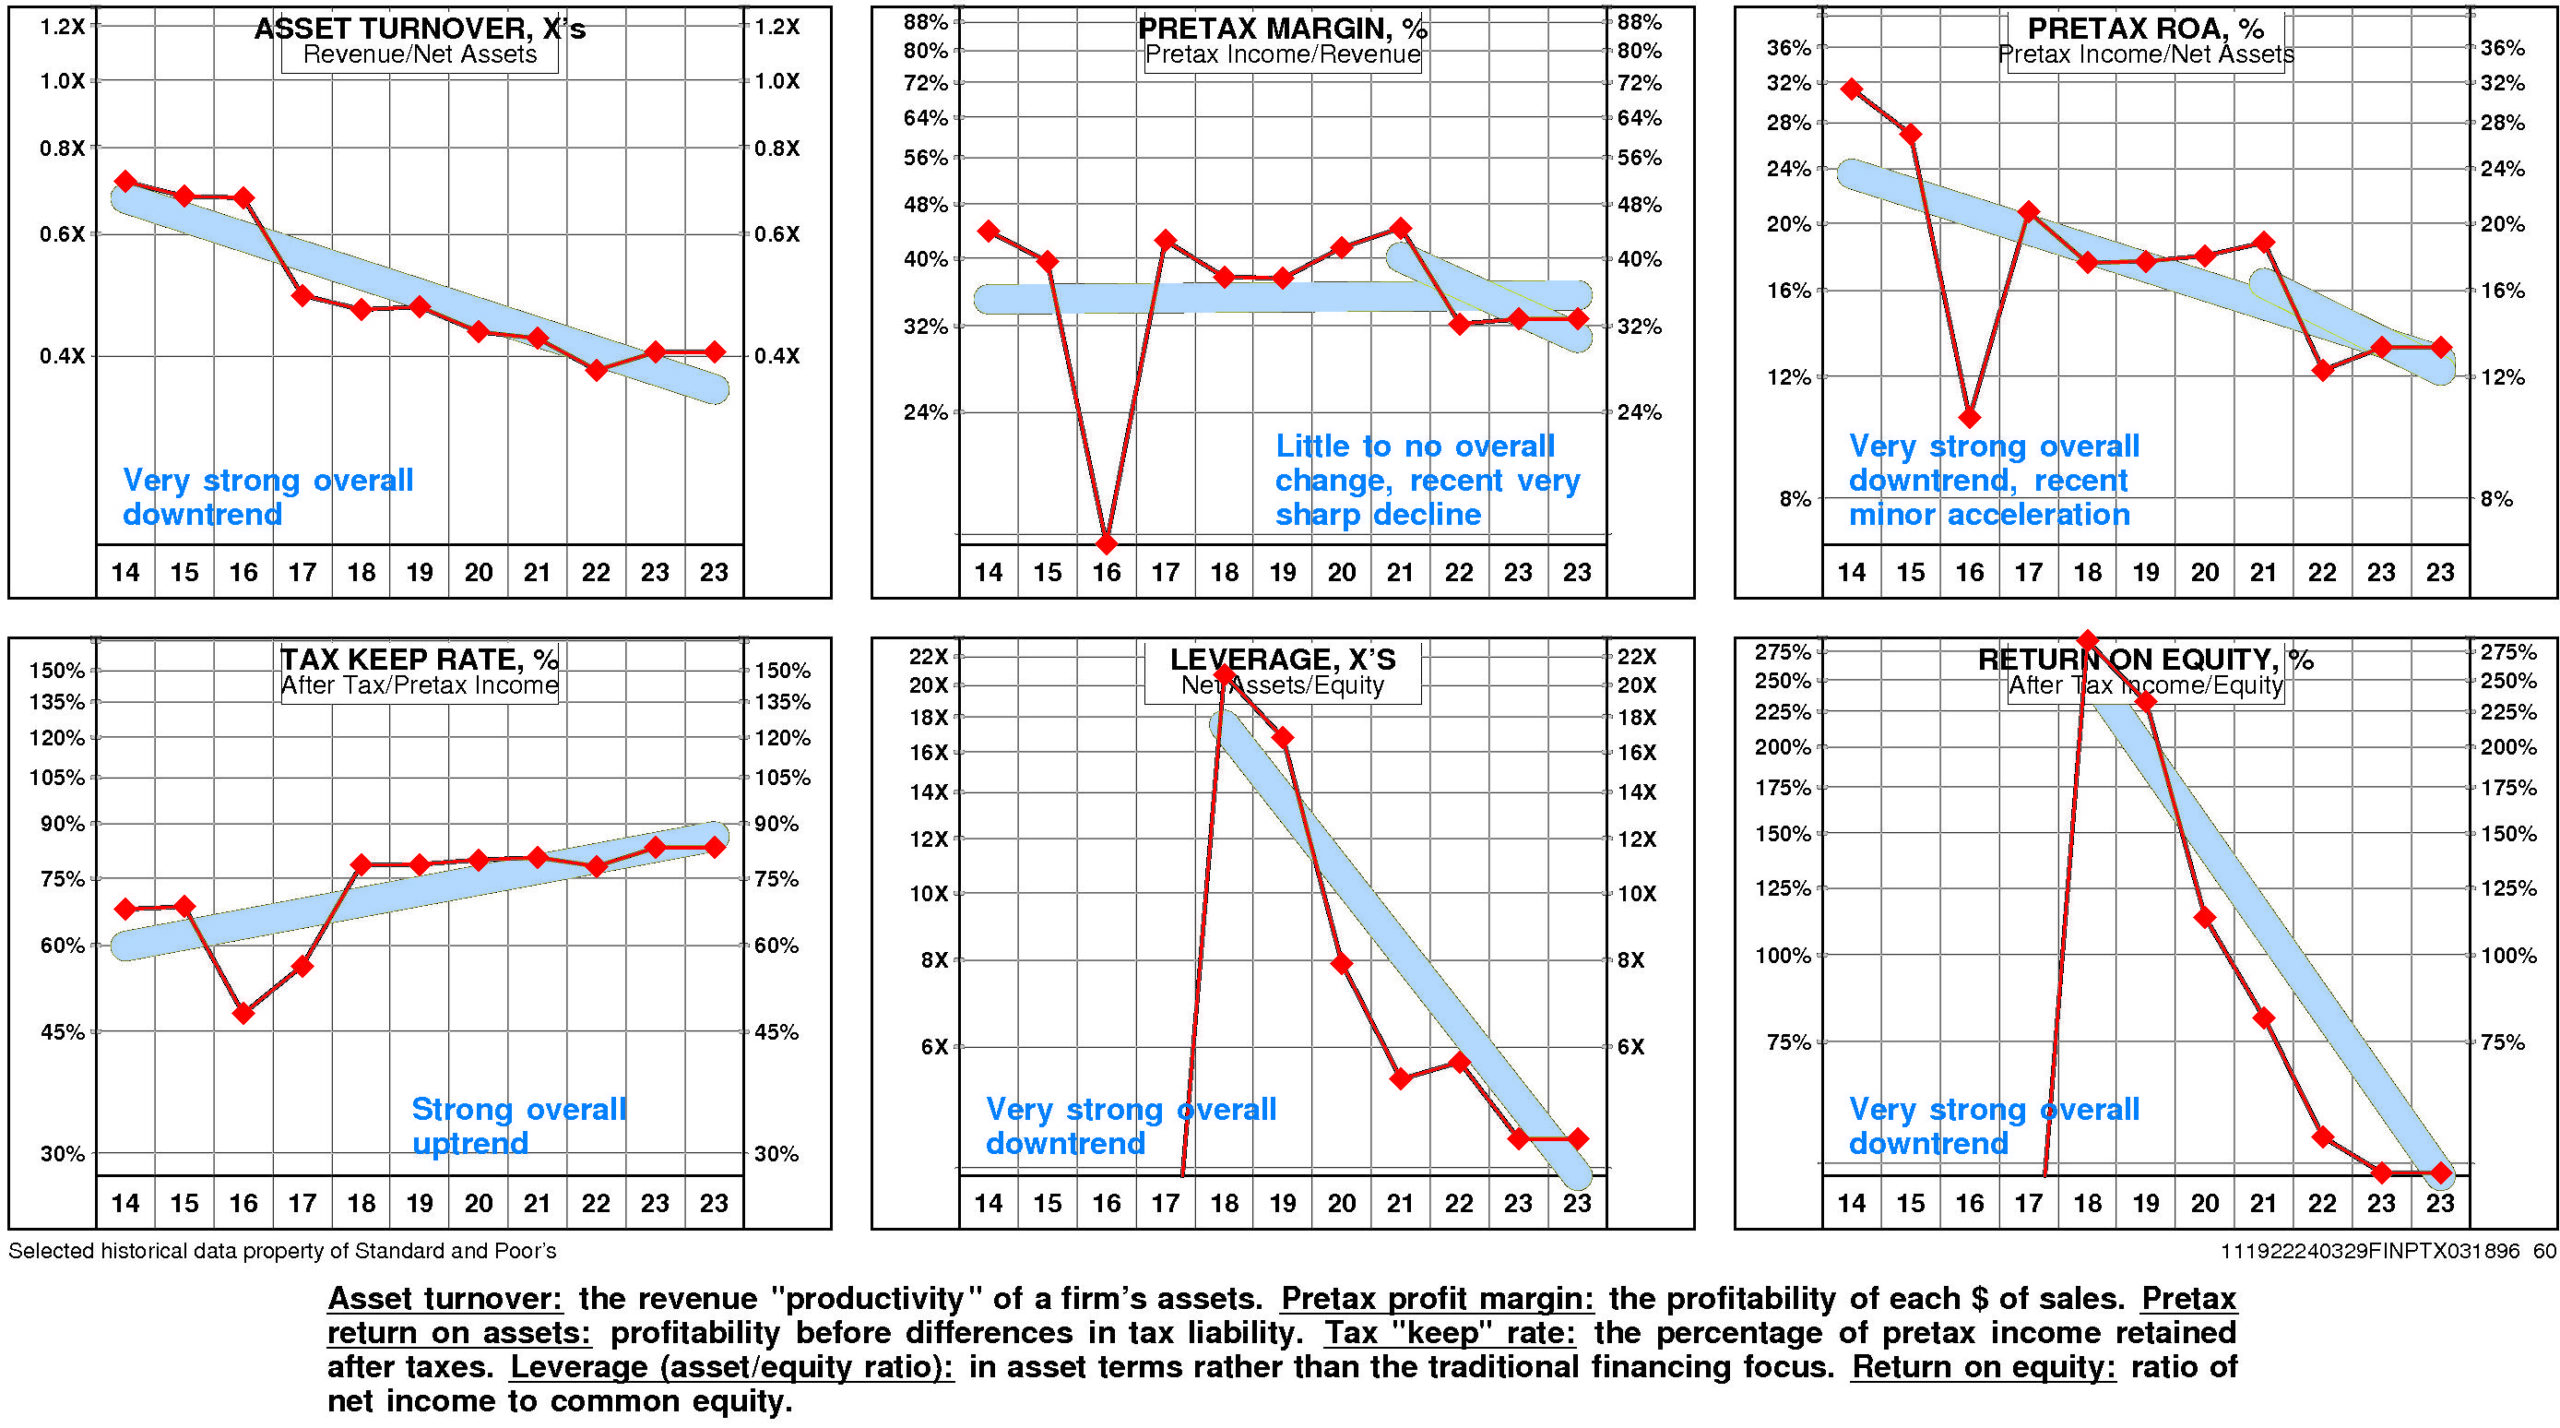
Moody’s return on equity has eroded very significantly since 2018. The current level of 48.4% is at the low for the period and is -83.0% from the high.
Moody’s very strong negative trend in pretax operating return significantly augmented by a very strong negative trend in non-operating factors is a significant analytical factor.
The productivity of Moody’s assets declined over the full period 2014-2023: asset turnover has suffered a very strong overall downtrend.
Additionally, pretax margin has exhibited little to no overall change but it experienced a very sharp decline from the 2021 level.
Non-operating factors (income taxes and financial leverage) had a significant negative influence on return on equity.
Moody’s return on equity is at the upper quartile (48.4%) for the four quarters ended December, 2023.
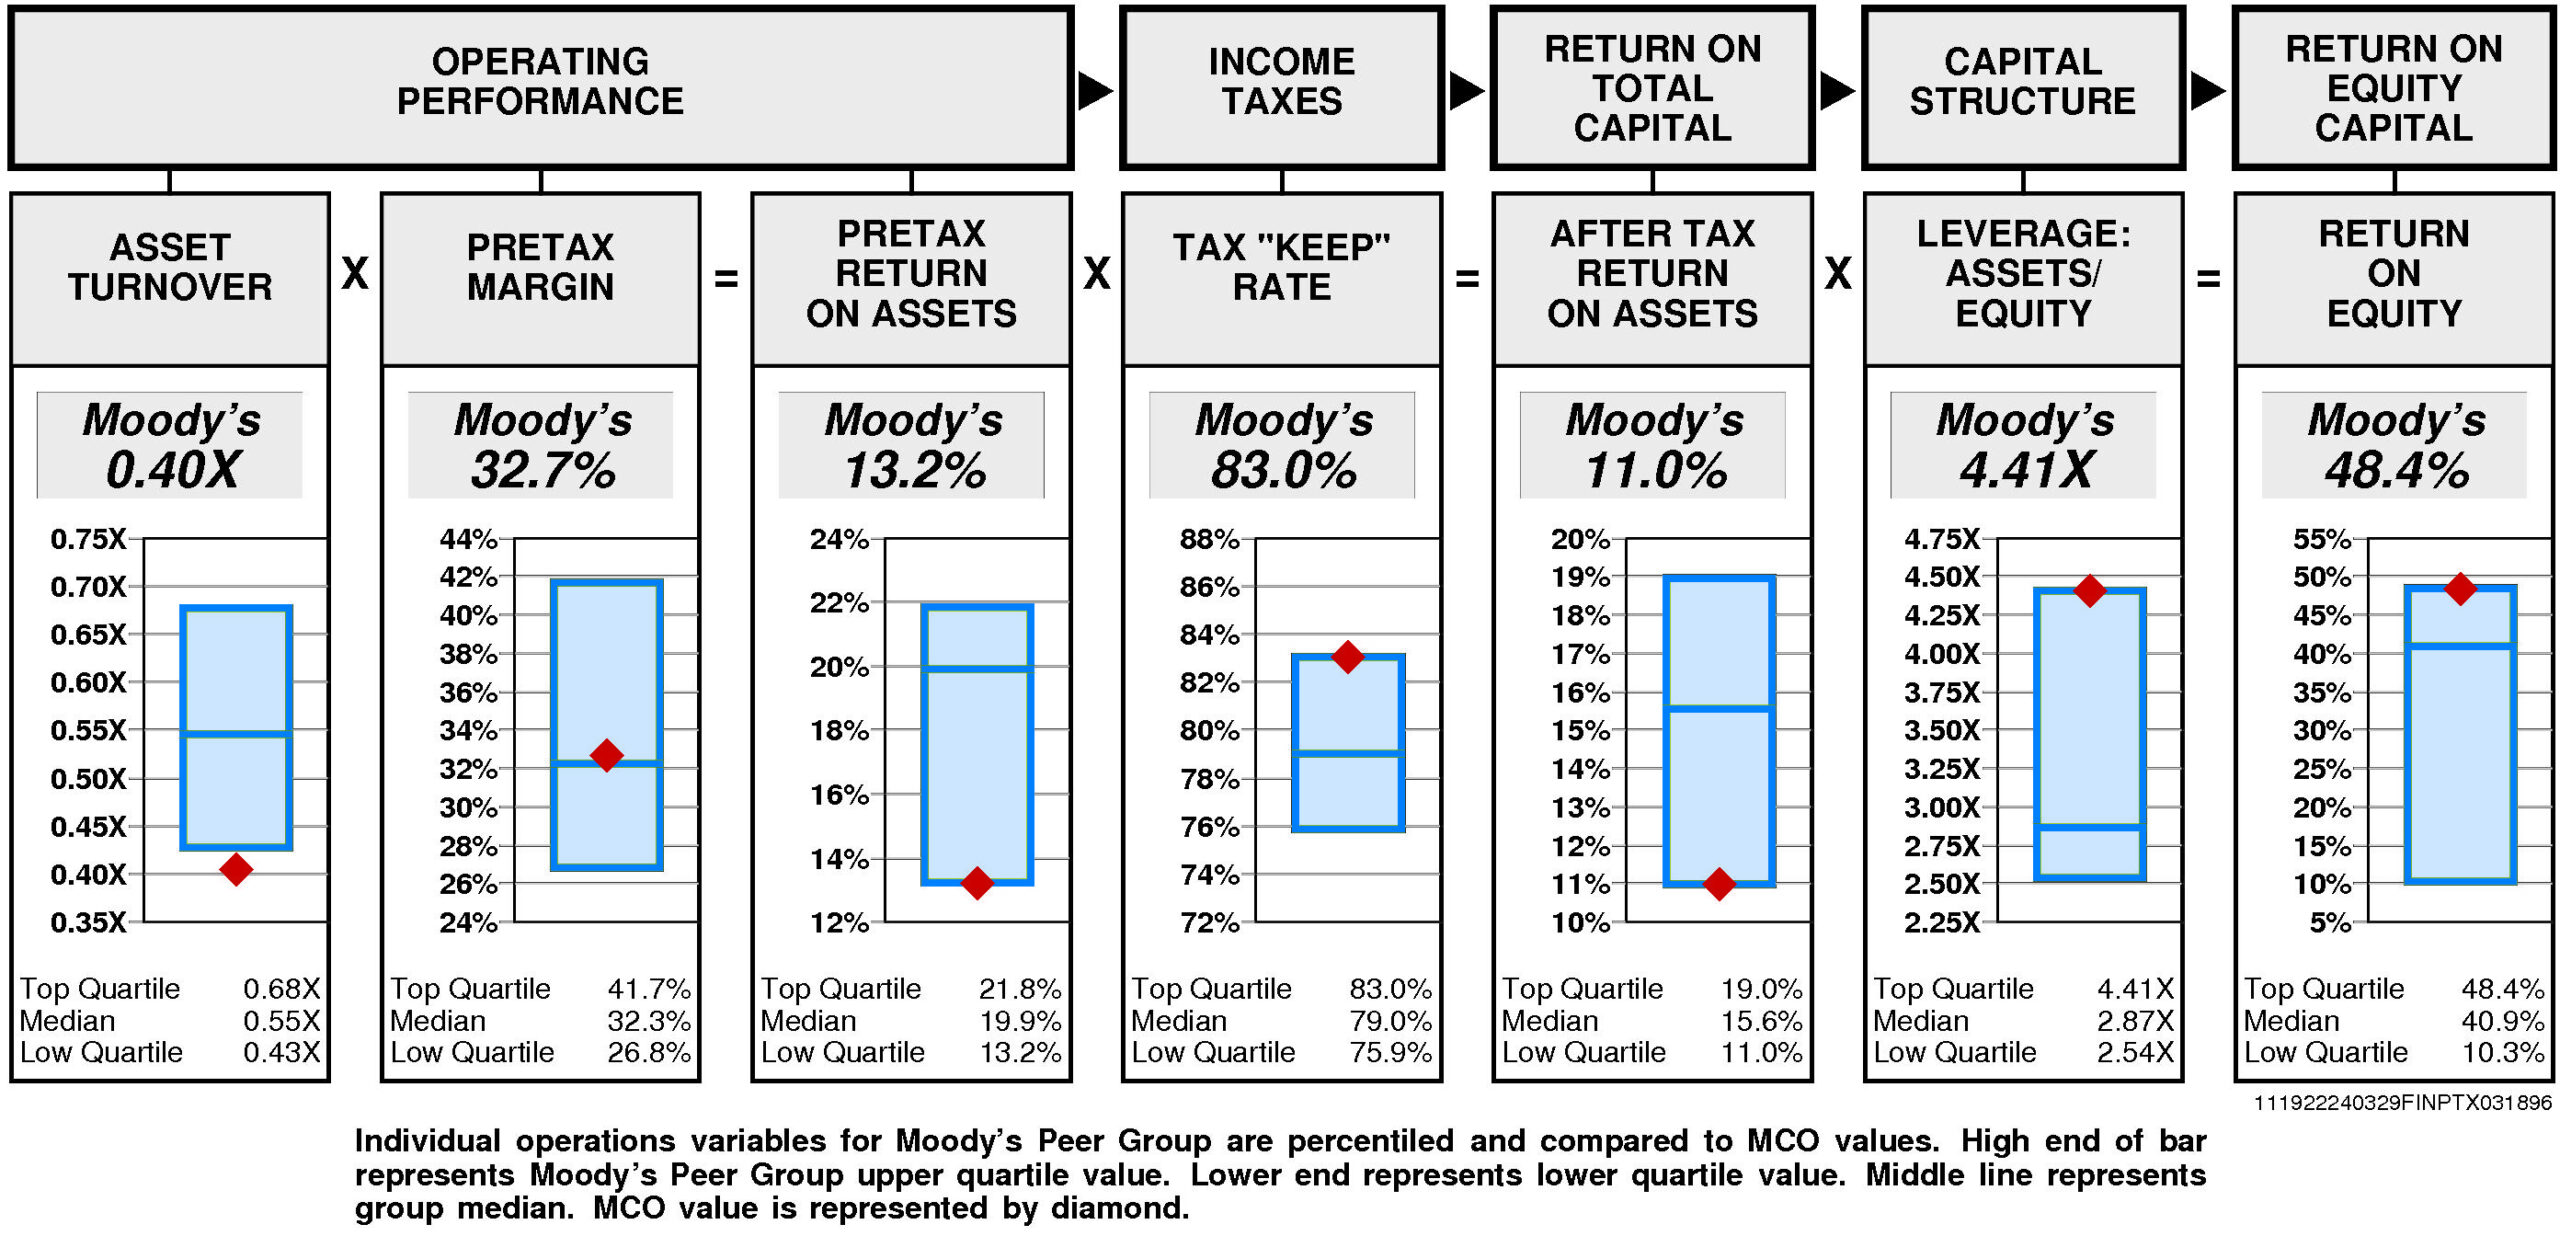
Operating performance (pretax return on assets) is at the lower quartile (13.2%) reflecting asset turnover that is lower quartile (0.40X) and at median pretax margin (32.7%).
Tax “keep” rate (income tax management) is at the upper quartile (83.0%) resulting in after tax return on assets that is at the lower quartile.
Financial leverage (leverage) is at the upper quartile (4.41X).
GROWTH RATES
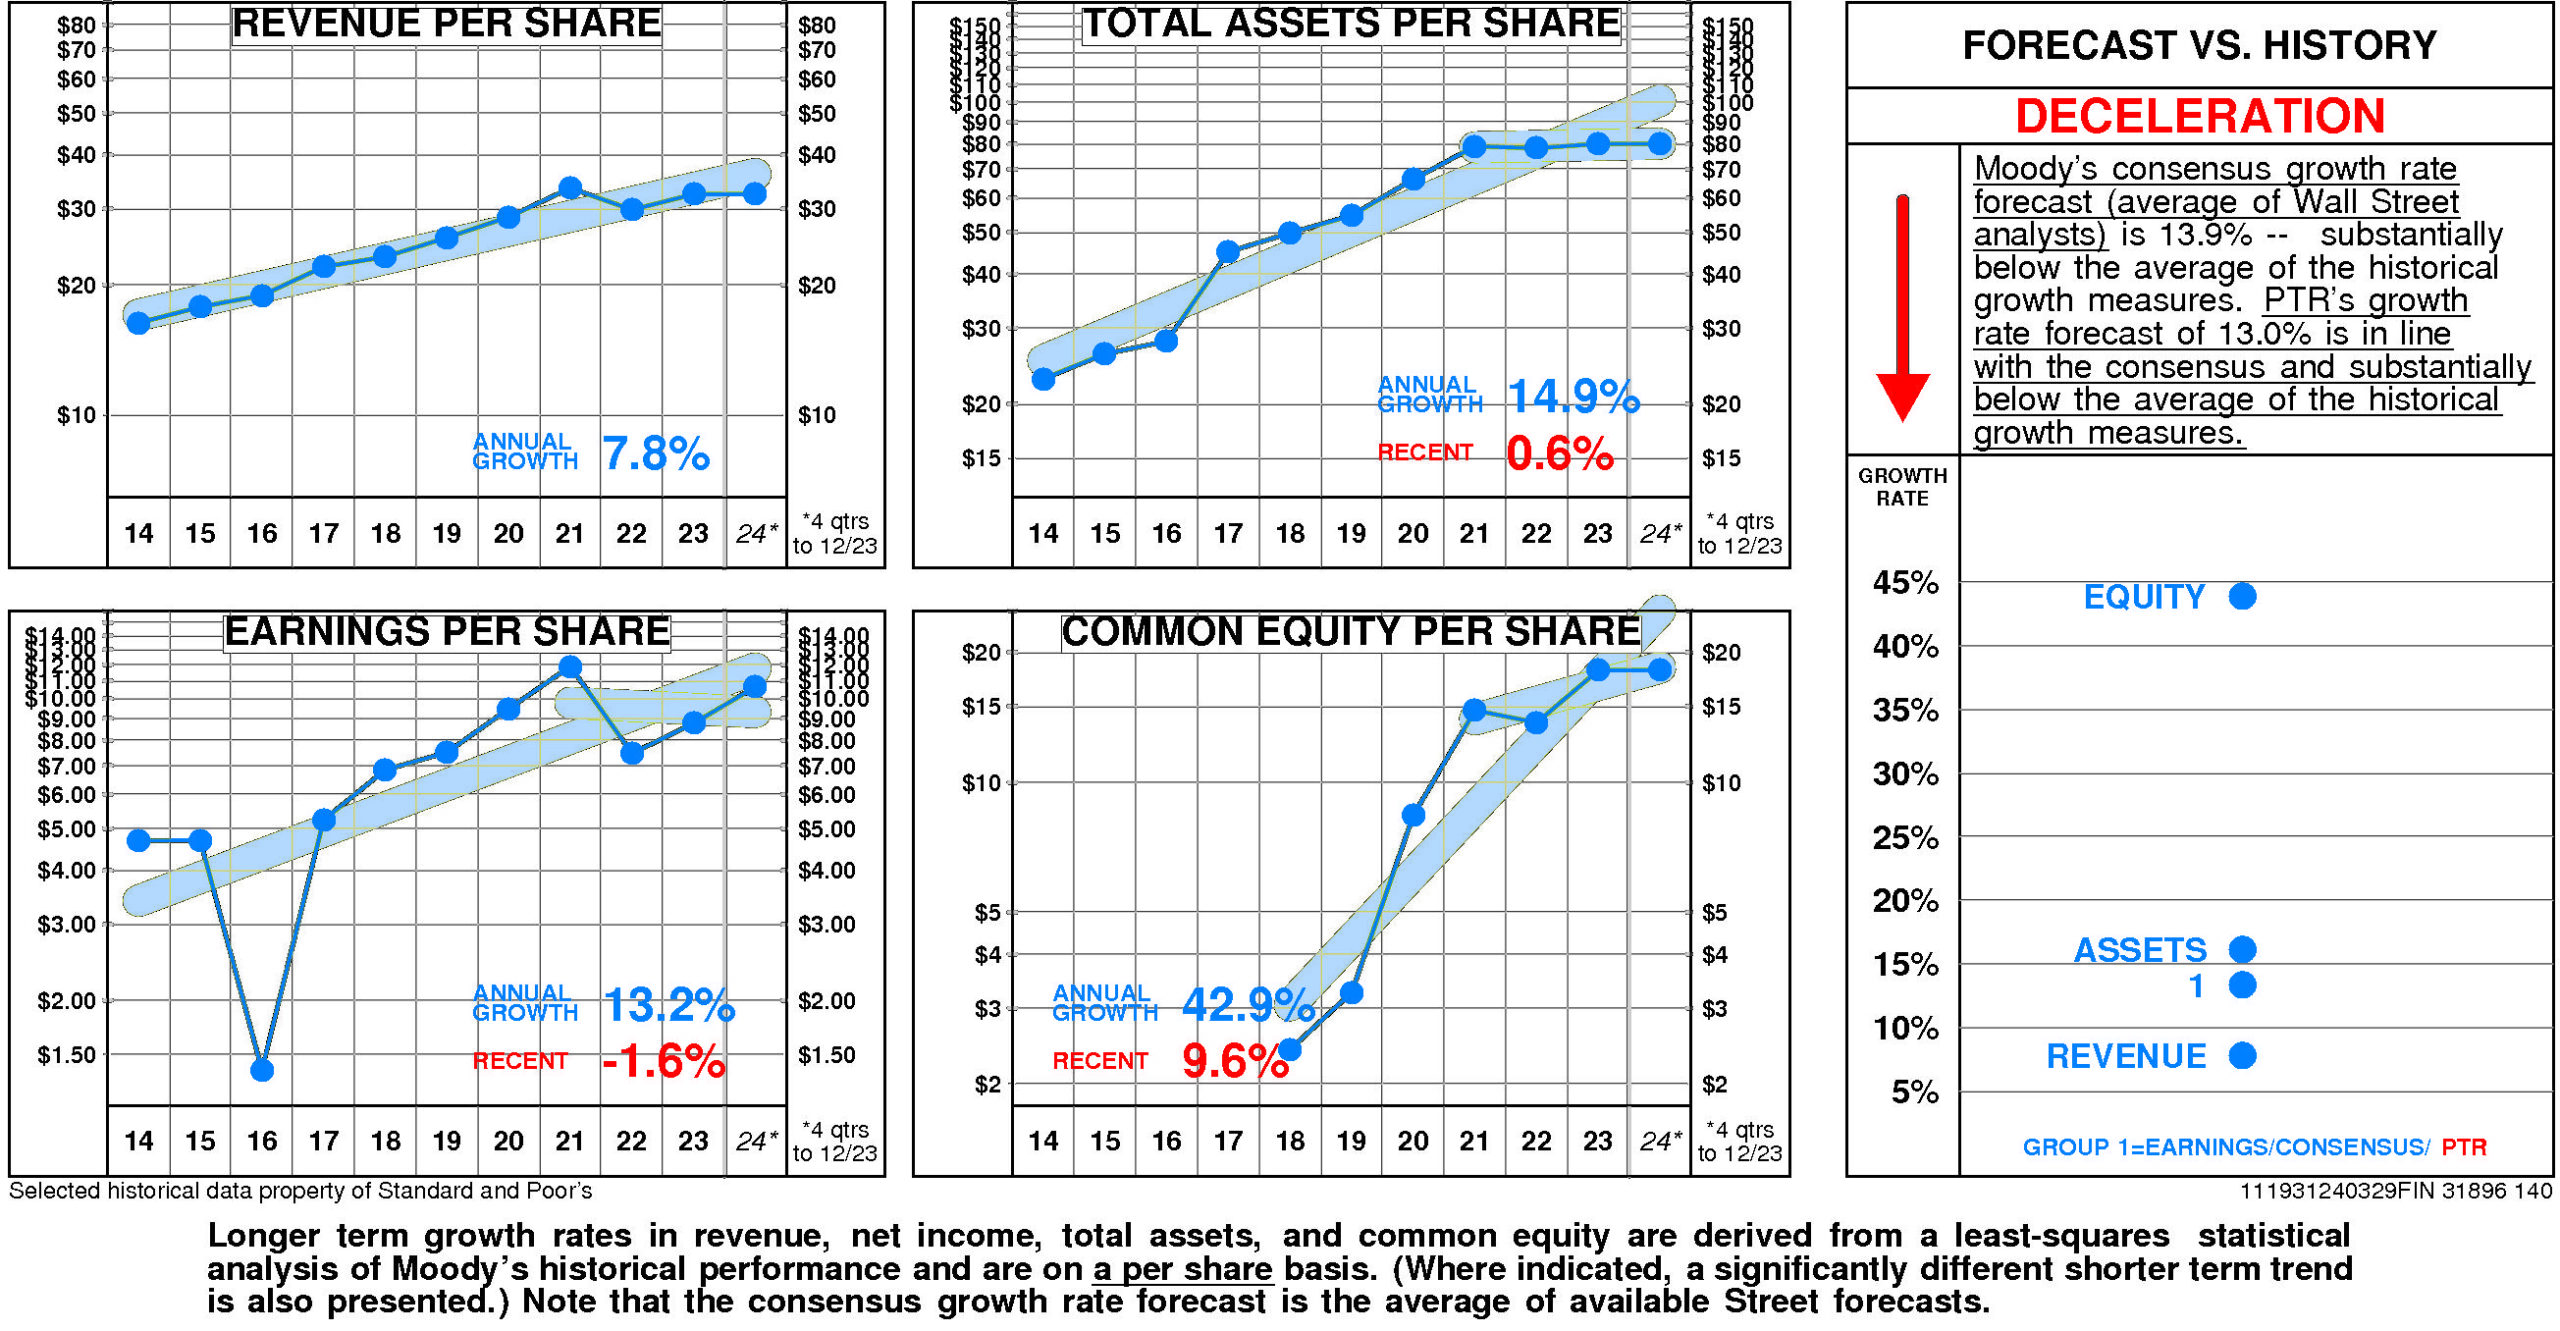
Overall, Moody’s growth rate has slowed very considerably in recent years.
Moody’s historical income statement growth has been lower than balance sheet growth. Revenue growth has fallen short of asset growth; earnings growth has fallen short of equity growth.
Annual revenue growth has been 7.8% per year.
Total asset growth has been 14.9% per year. (More recently it has been 0.6%.)
Annual E.P.S. growth has been 13.2% per year. (More recently it has been -1.6%.)
Equity growth has been 42.9% per year. (More recently it has been 9.6%.)
Moody’s consensus growth rate forecast (average of Wall Street analysts) is 13.9% — substantially below the average of the historical growth measures.
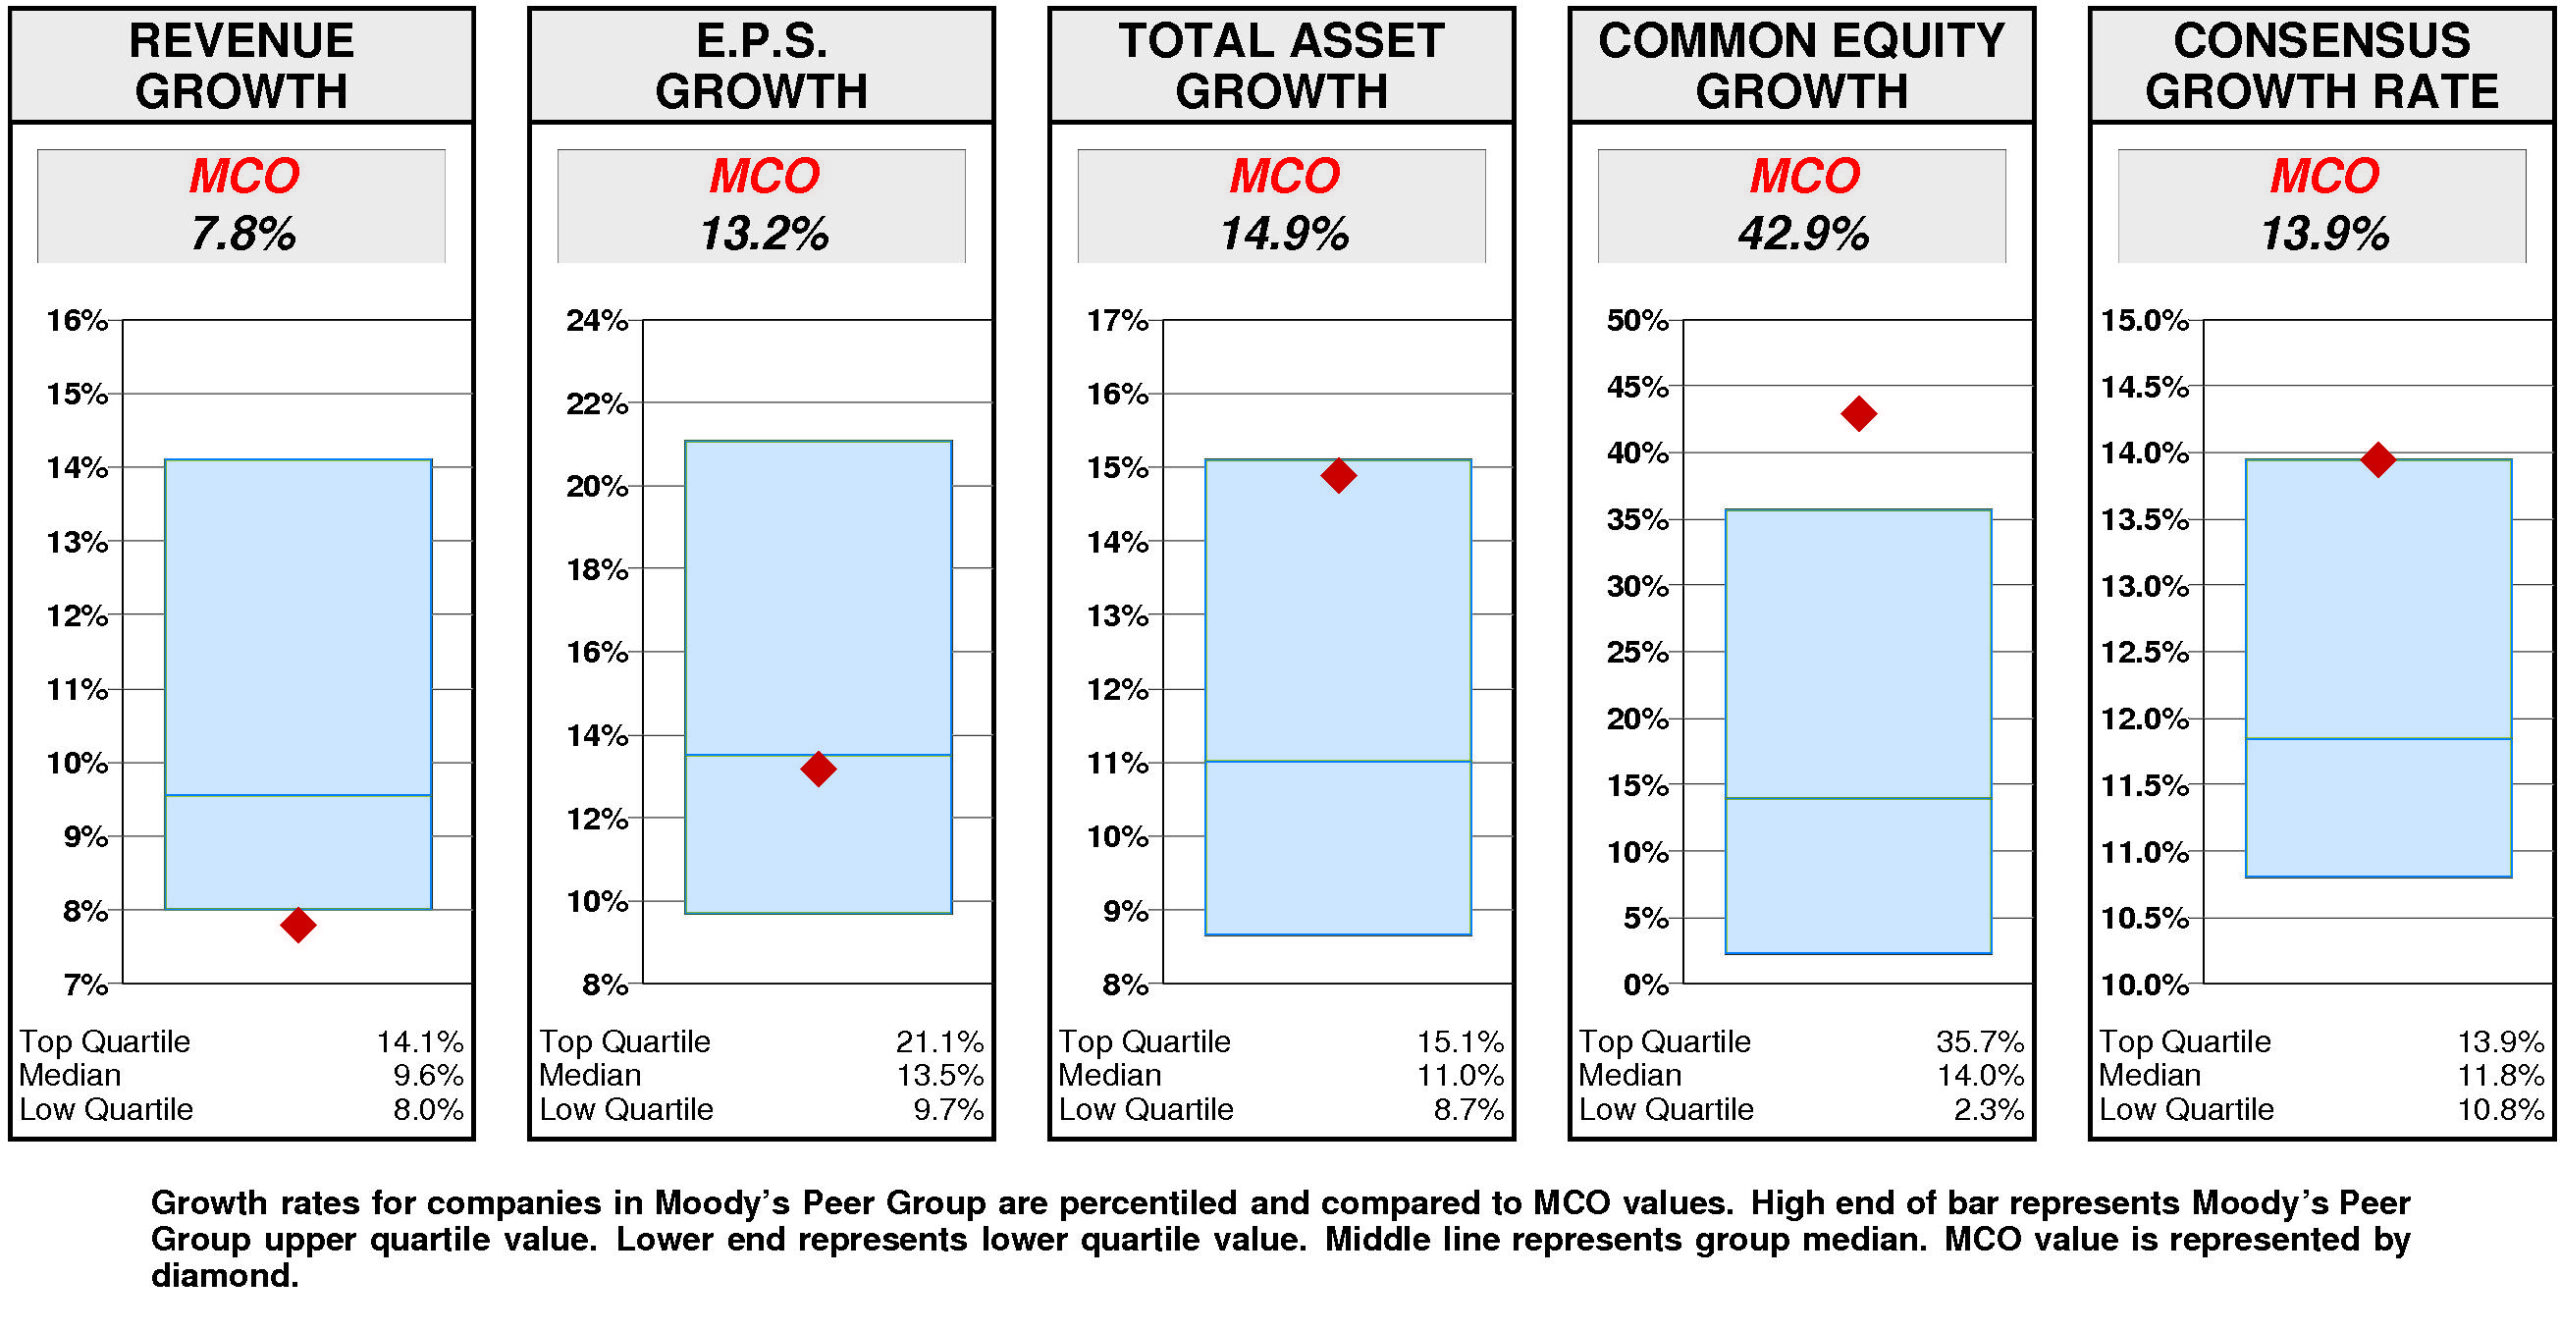
Relative to the Moody’s Peer Group, Moody’s historical growth measures are highly erratic. Equity growth (42.9%) has been upper quartile. Total asset growth (14.9%) has been at the upper quartile. E.P.S. growth (13.2%) has been slightly below median. Revenue growth (7.8%) has been lower quartile.
Consensus growth forecast (13.9%) is at the upper quartile.
PRICE HISTORY
Over the full time period, Moody’s stock price performance has been variable and superior. Between May, 2013 and March, 2024, Moody’s stock price rose +487%; relative to the market, this was a +82% gain. Significant price move during the period: 1) February, 2016 – August, 2018: +100%.
TOTAL INVESTMENT RETURNS
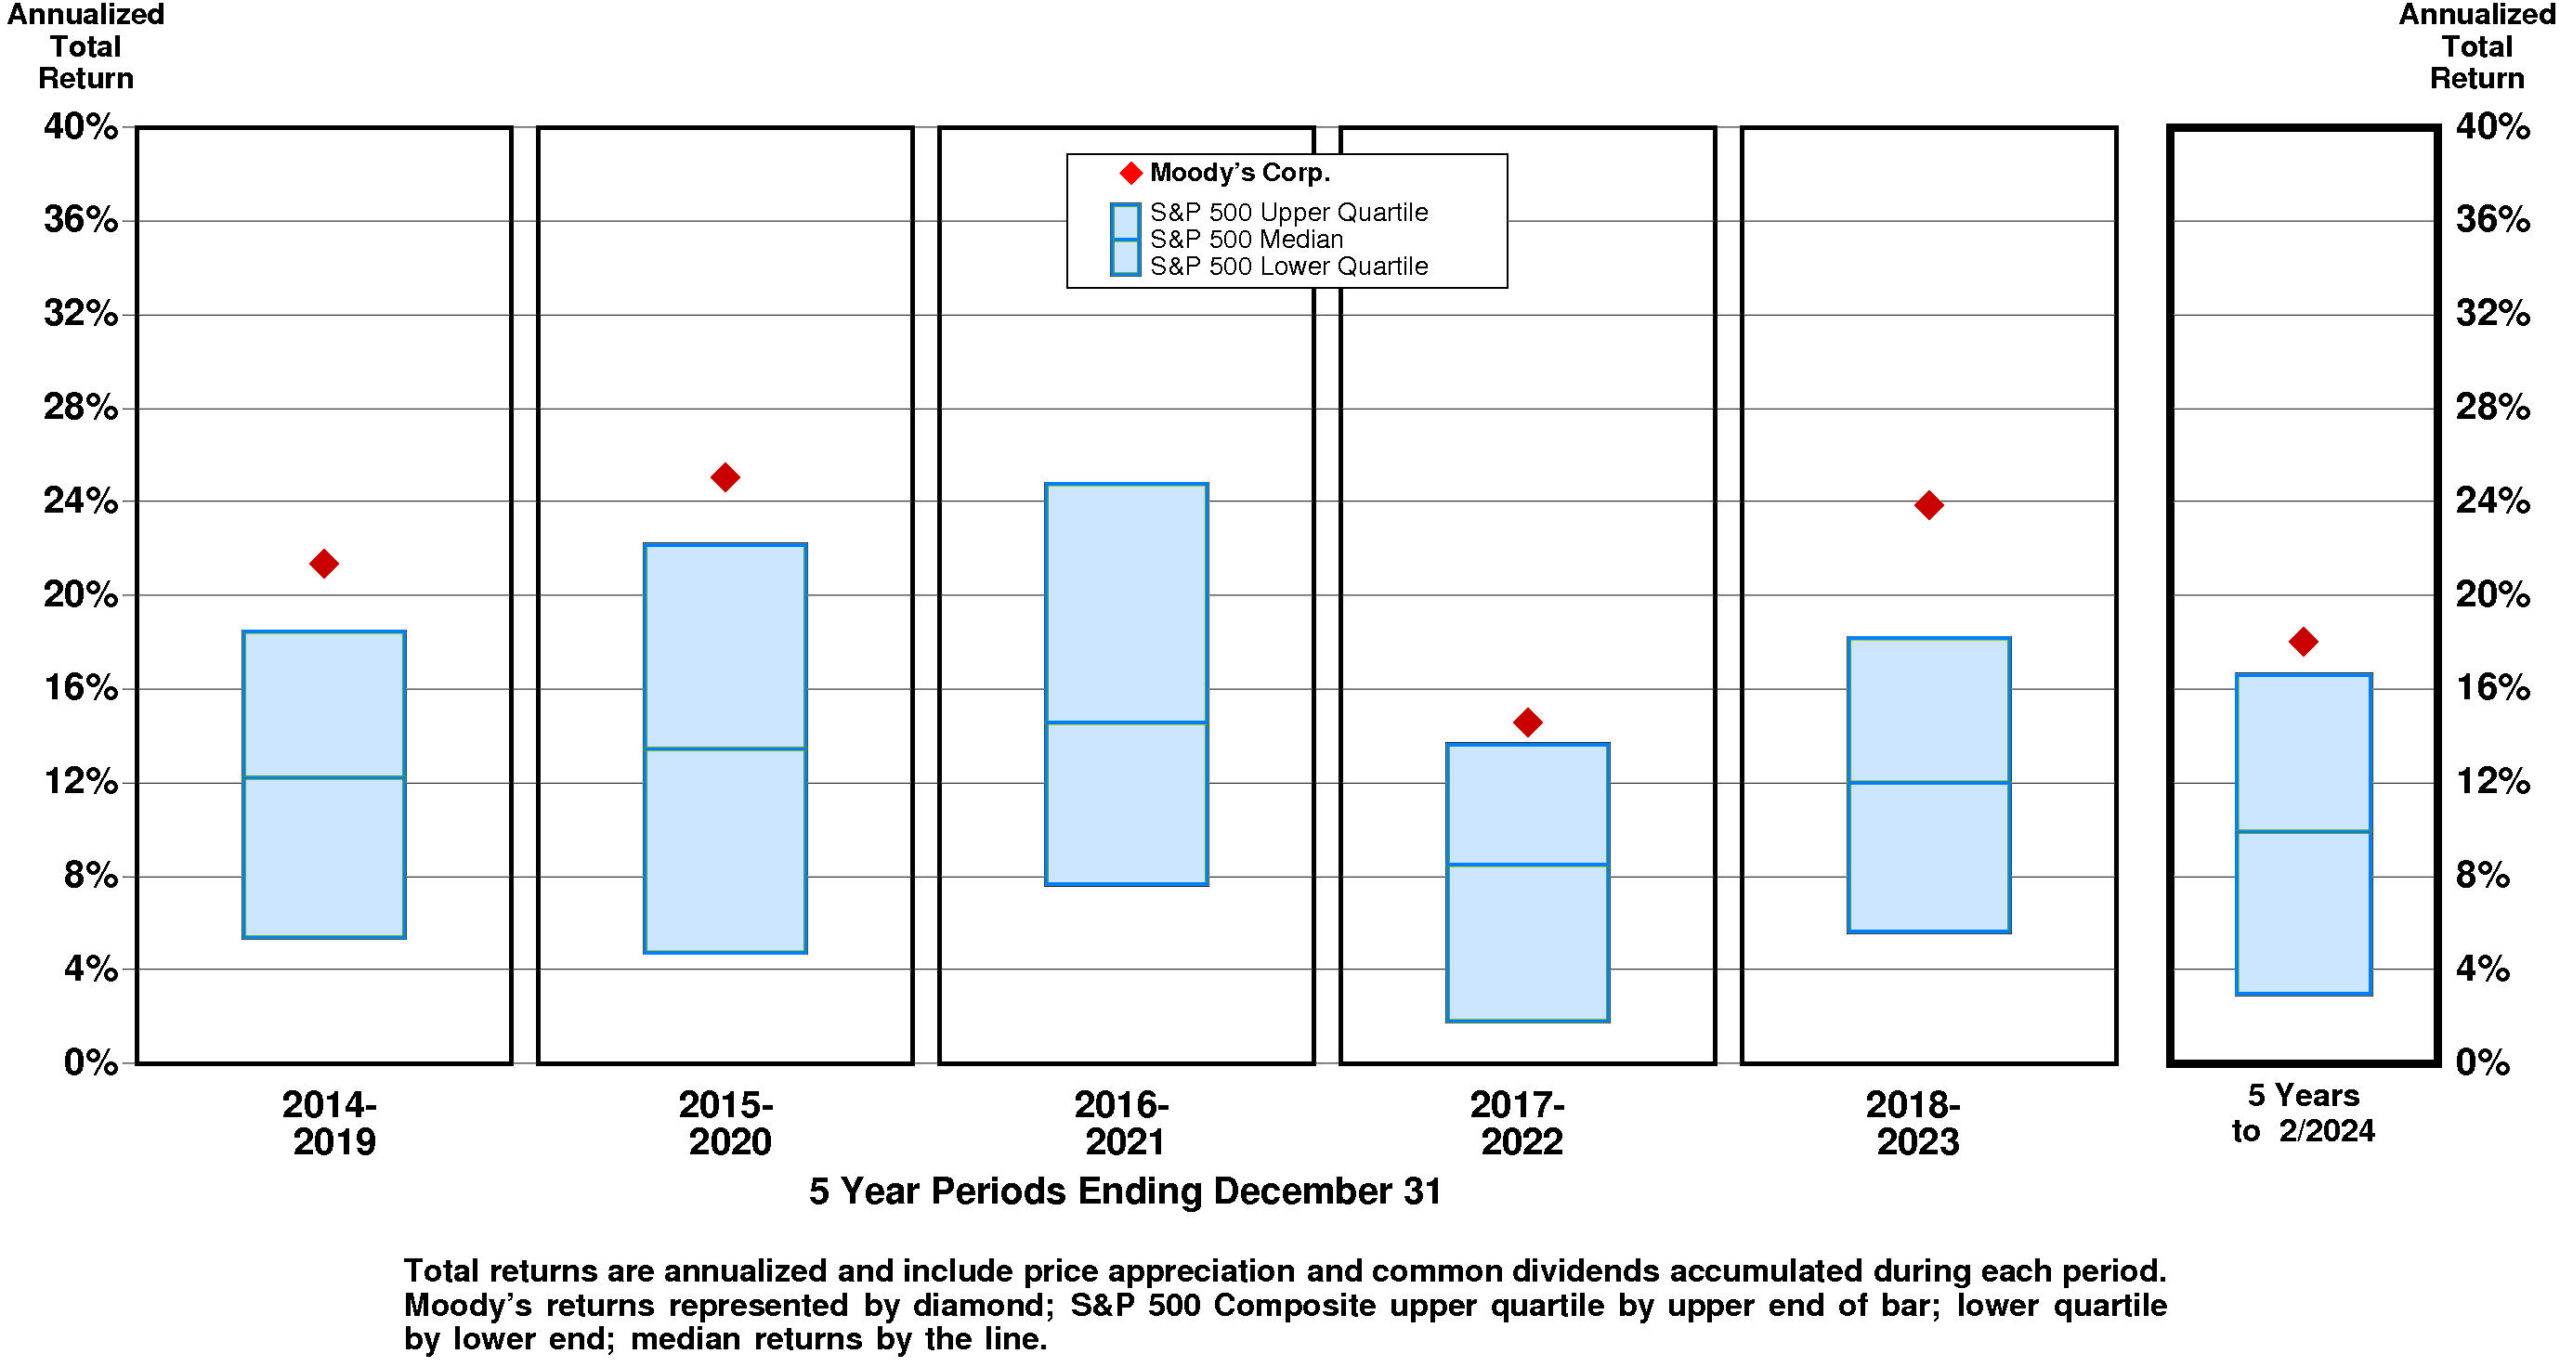
Current annual total return performance of 32.0% is upper quartile relative to the S&P 500 Composite.
In addition to being upper quartile relative to S&P 500 Composite, current annual total return performance through February, 2024 of 32.0% is at the upper quartile relative to Moody’s Corp. Peer Group.
Current 5-year total return performance of 18.0% is upper quartile relative to the S&P 500 Composite.
Through February, 2024, with upper quartile current 5-year total return of 18.0% relative to S&P 500 Composite, Moody’s total return performance is slightly above median relative to Moody’s Corp. Peer Group.
VALUATION BENCHMARKS
Relative to S&P 500 Composite, MCO’s overall valuation is exceptionally high. All five factors are upper quartile. The highest factor is the price/equity ratio, followed by the ratio of enterprise value/revenue, then by the ratio of enterprise value/assets, then by the price/earnings ratio. The lowest factor is the ratio of enterprise value/earnings before interest and taxes.
Relative to Moody’s Peer Group, MCO’s overall valuation is high. The highest factor, the price/equity ratio, is at the upper quartile. Ratio of enterprise value/revenue is at the upper quartile. Price/earnings ratio is above median. Ratio of enterprise value/earnings before interest and taxes is at the upper quartile. The lowest factor, the ratio of enterprise value/assets, is at median.
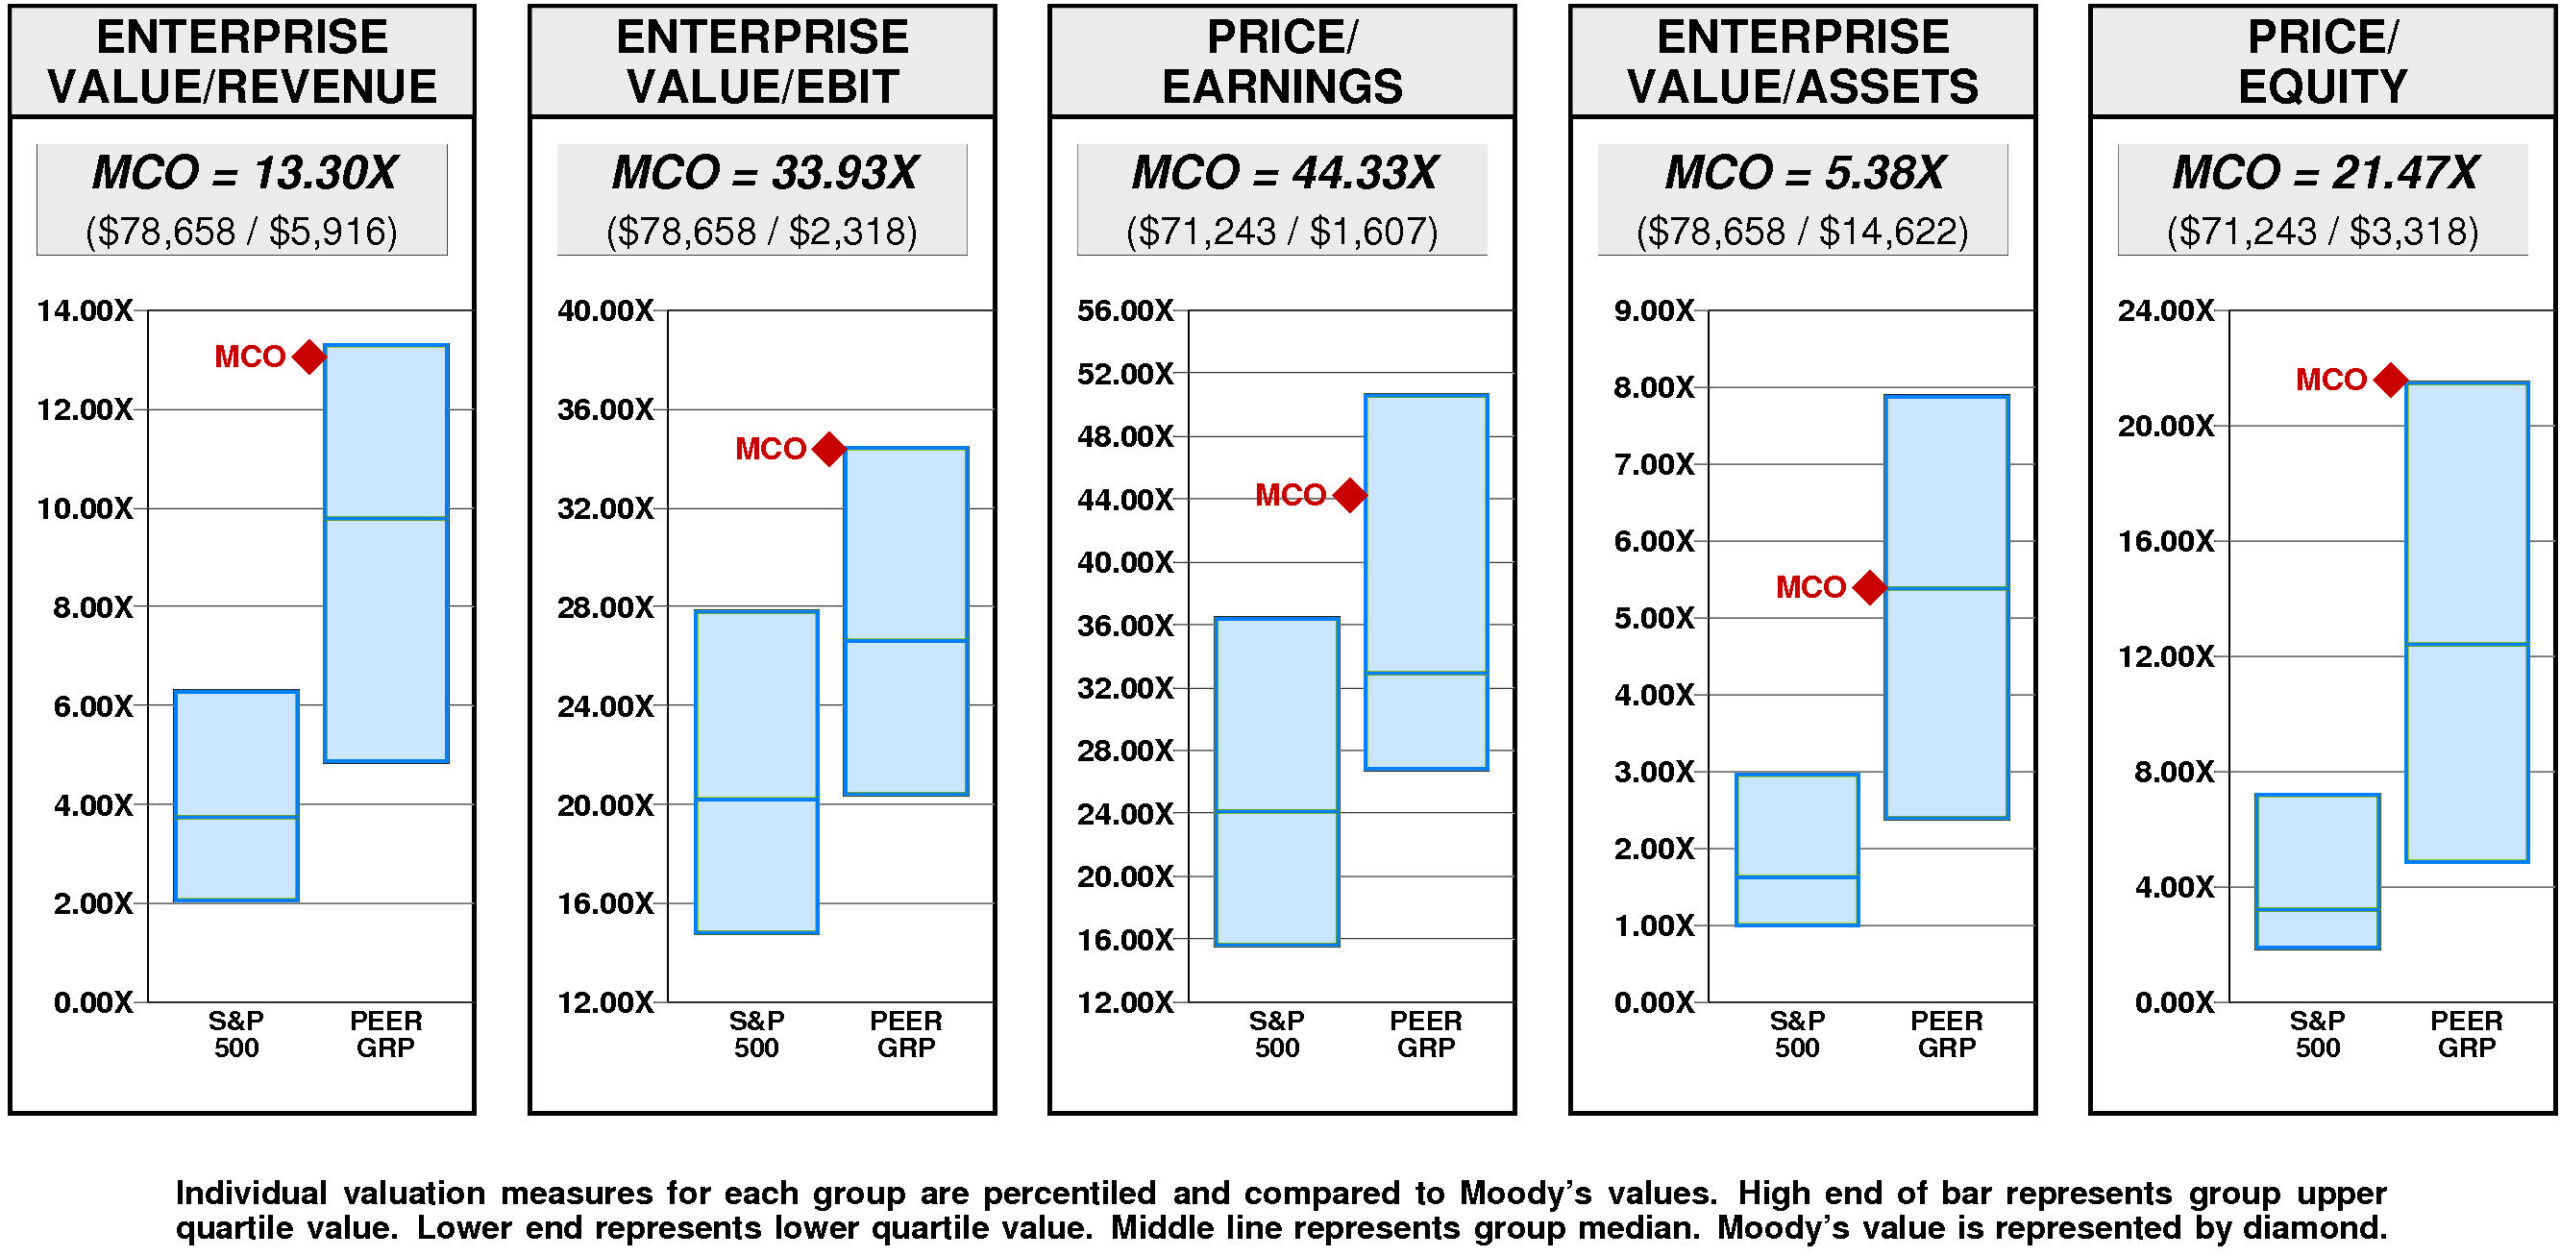
Moody’s has a very large value gap compared to the median valuation. For MCO to achieve median valuation, its current ratio of enterprise value/revenue would have to fall from the current level of 13.30X to 9.79X. If MCO’s ratio of enterprise value/revenue were to fall to 9.79X, its stock price would be lower by $-114 to $276.
For MCO to fall to lower quartile valuation relative to the Moody’s Peer Group, its current ratio of enterprise value/revenue would have to fall from the current level of 13.30X to 4.88X. If MCO’s ratio of enterprise value/revenue were to fall to 4.88X, its stock price would decline by $-273 from the current level of $390.
VALUE TARGETS
Reflecting future returns on capital that are forecasted to be above the cost of capital, MCO is expected to continue to be a major Value Builder.
Moody’s current Price Target of $313 represents a -20% change from the current price of $390.24.
This low appreciation potential results in an appreciation score of 26 (74% of the universe has greater appreciation potential.)
Notwithstanding this low Appreciation Score of 26, the high Power Rating of 80 results in an Value Trend Rating of C.
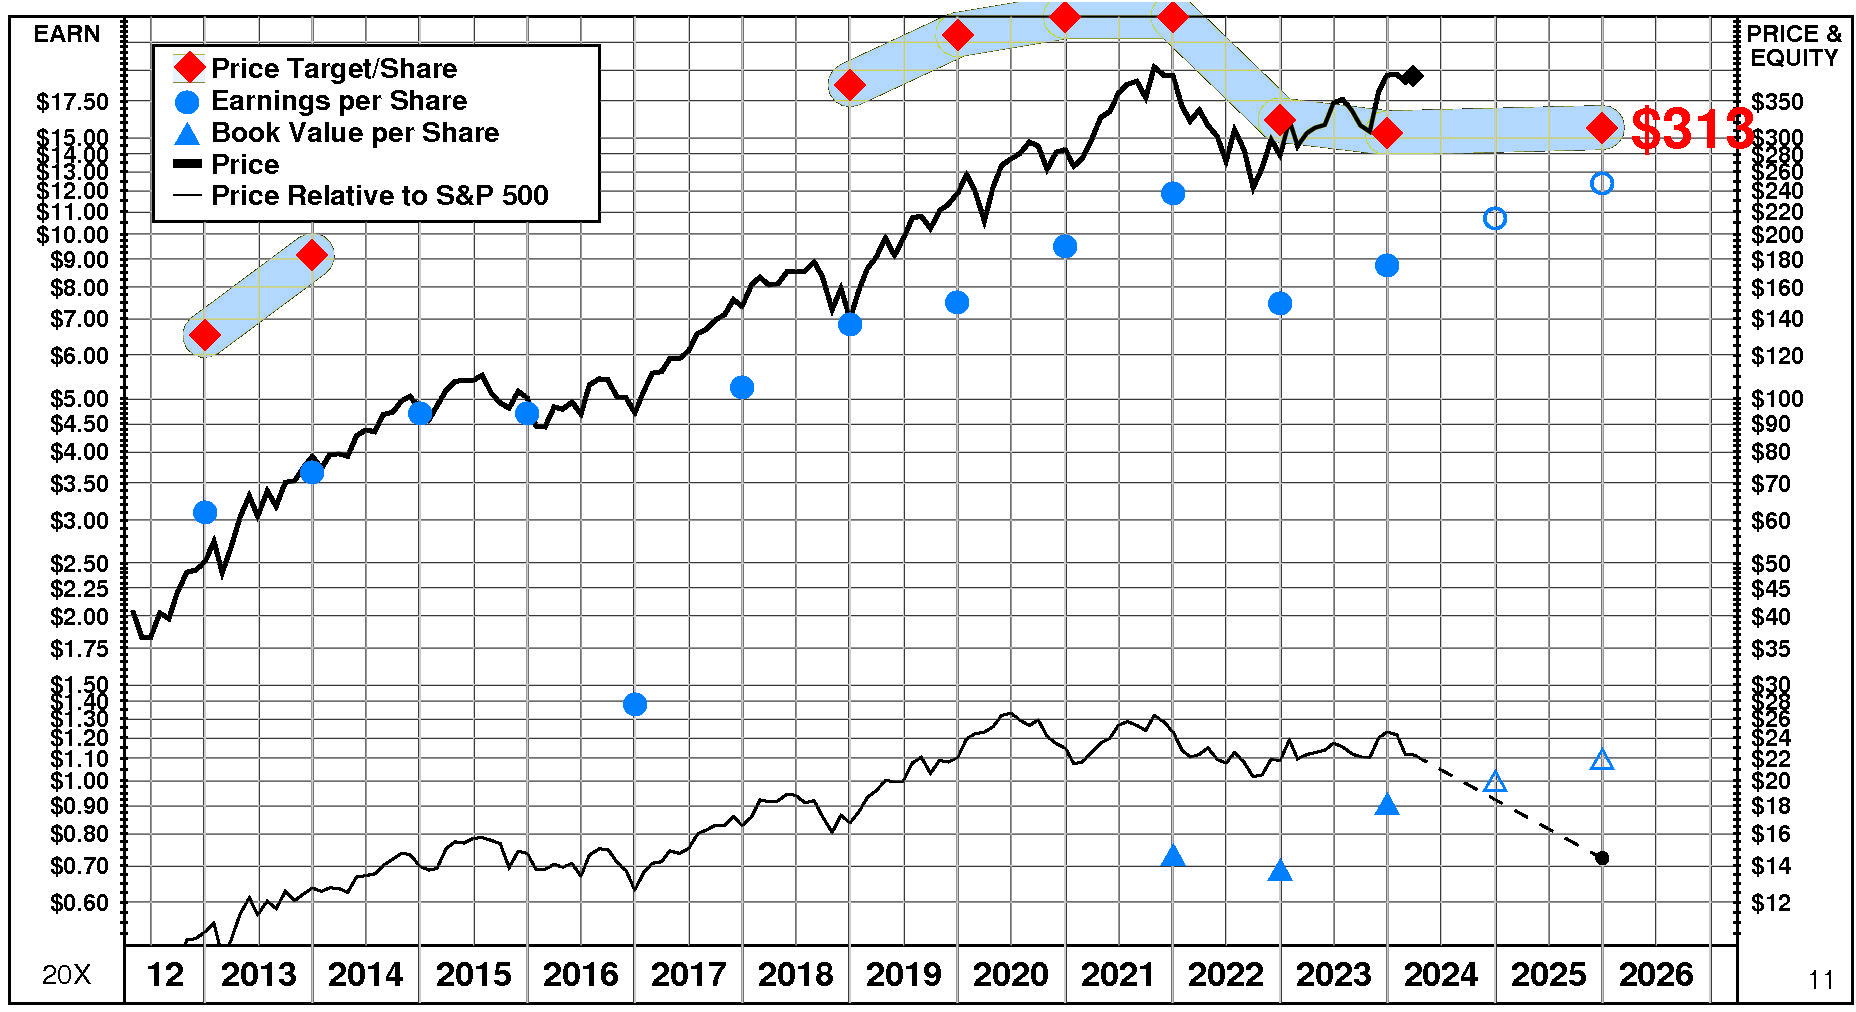
Moody’s current Price Target is $313 (+2% from the 2023 Target of $306 but -20% from the 03/27/24 price of $390.24). This plateau in the Target is the result of a +22% increase in the equity base and a -16% decrease in the price/equity multiple. The forecasted increase in return on equity has a slight positive impact on the price/equity multiple and the forecasted decline in cost of equity has a slight positive impact as well. More than offsetting these Drivers, the forecasted decline in growth has a very large negative impact.
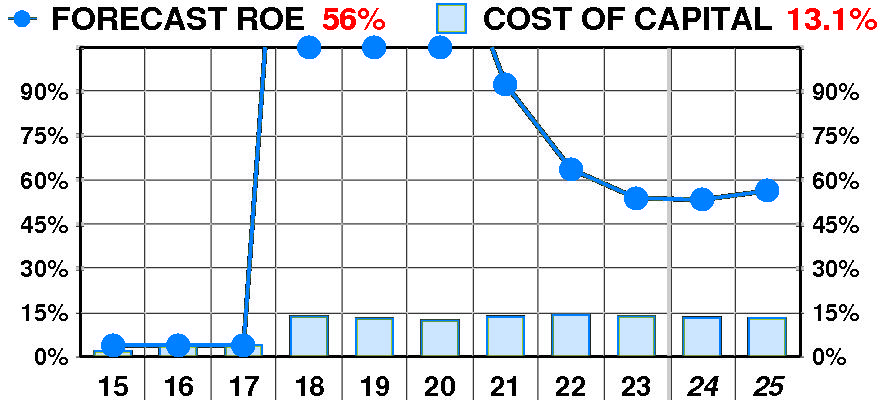
PTR’s return on equity forecast is 56.3% — slightly above our recent forecasts. Forecasted return on equity enjoyed a dramatic, erratic increase between 2015 and 2023. The current forecast is significantly below the 2018 peak of 311%.
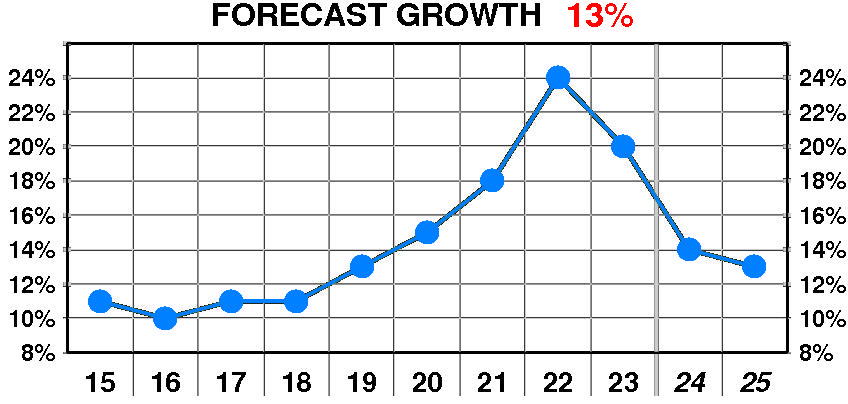
PTR’s growth forecast is 13.0% — significantly below our recent forecasts. Forecasted growth enjoyed a dramatic, steady increase between 2015 and 2023. The current forecast is above the 2016 low of 10%.
PTR’s cost of equity forecast is 13.1% — in line with recent levels. Forecasted cost of equity suffered a dramatic, variable increase between 2015 and 2023. The current forecast is significantly above the 2015 low of 1.9%.
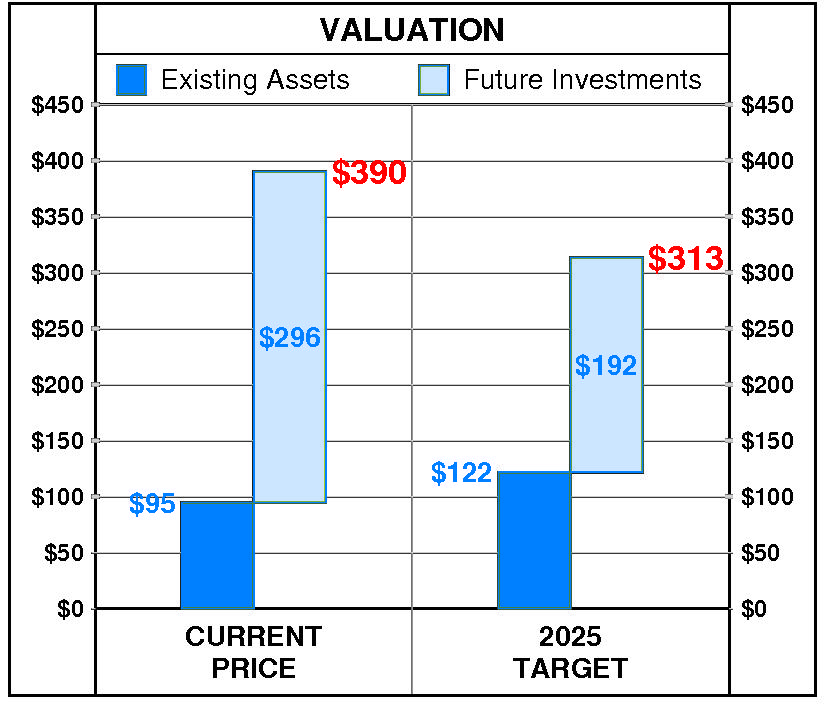
At Moody’s current price of $390.24, investors are placing a positive value of $296 on its future investments. This view is consistent with the company’s most recent performance that reflected a growth rate of 20.0% per year, and a return on equity of 53.8% versus a cost of equity of 13.7%.
PTR’s 2025 Price Target of $313 is based on these forecasts and reflects an estimated value of existing assets of $122 and a value of future investments of $192.
Be the first to comment