![]()
BUSINESS
United Microelectronics Corporation operates as a semiconductor wafer foundry in Taiwan, Singapore, China, Hong Kong, Japan, the United States, Europe, and internationally. The company provides circuit design, mask tooling, wafer fabrication, and assembly and testing services. It serves fabless design companies and integrated device manufacturers. United Microelectronics Corporation was incorporated in 1980 and is headquartered in Hsinchu City, Taiwan.
INVESTMENT RATING
With future capital returns forecasted to exceed the cost of capital, UMC is expected to continue to be a modest Value Builder.
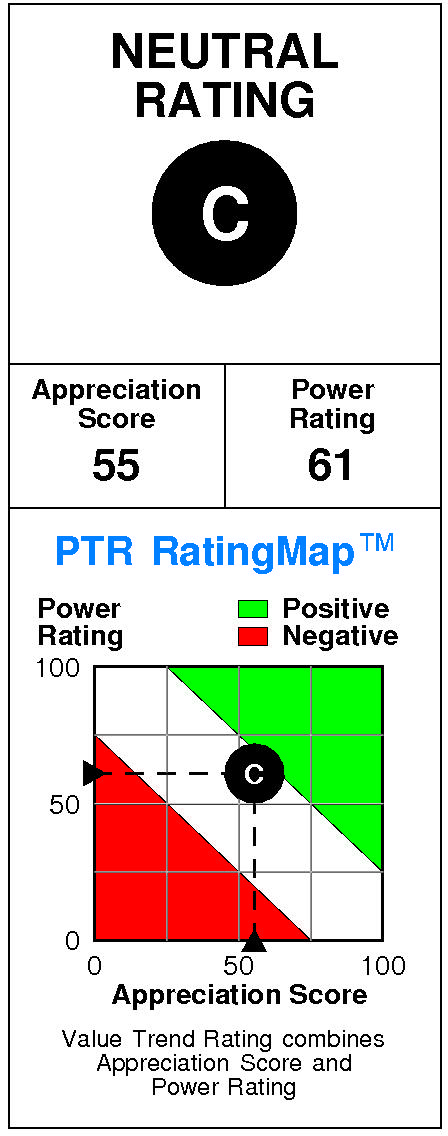
United Microelectronics has a current Value Trend Rating of C (High Neutral).
The Value Trend Rating reflects consistent signals from PTR’s two proprietary measures of a stock’s attractiveness. United Microelectronics has a neutral Appreciation Score of 55 and a slightly positive Power Rating of 61, and the High Neutral Value Trend Rating results.
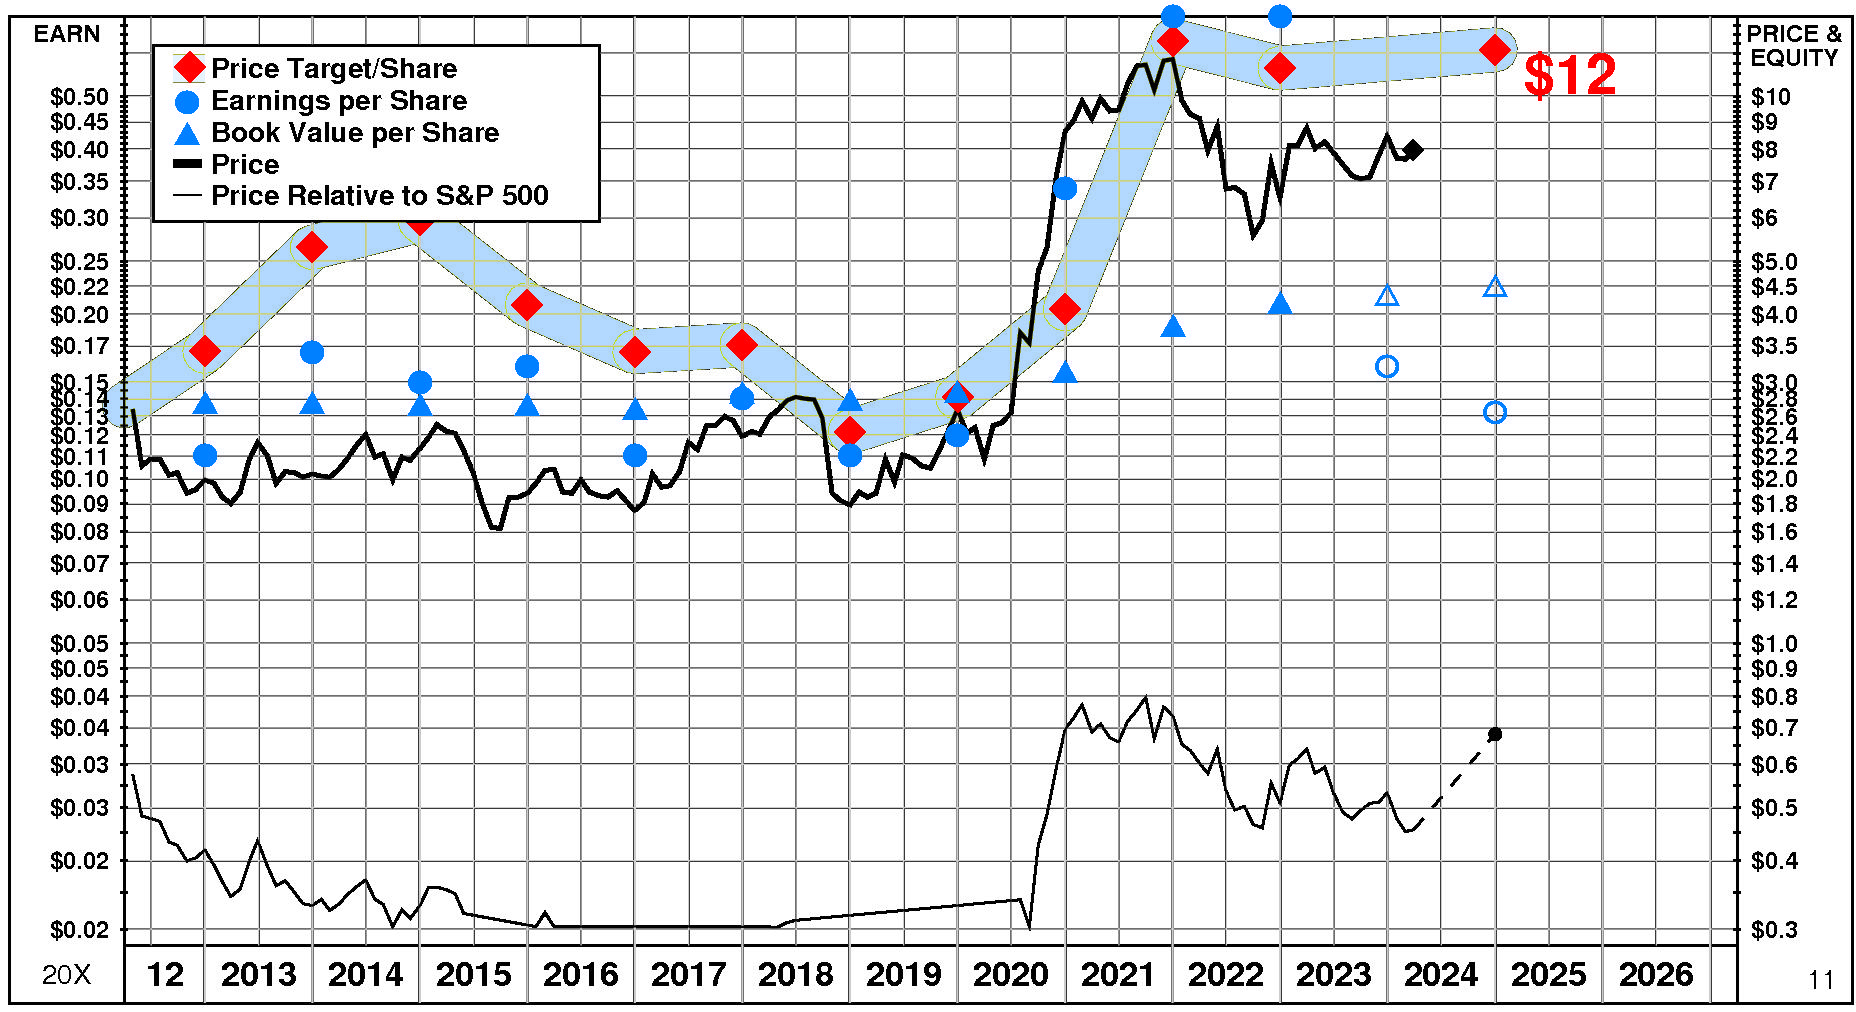
United Microelectronics’ stock is selling well below targeted value. The current stock price of $7.98 compares to targeted value 12 months forward of $12.
This neutral appreciation potential results in an appreciation score of 55 (45% of the universe has greater appreciation potential.)

United Microelectronics has a Power Rating of 61. (This slightly positive Power Rating indicates that UMC’s chances of achieving attractive investment performance over the near to intermediate term are only average.)
Contributing to this slightly positive Power Rating: recent price action has been slightly favorable. Offsetting factors are earnings estimate behavior for UMC has been slightly negative recently; and the Semiconductor, Related Devices comparison group is currently in an unfavorable position.
INVESTMENT PROFILE
UMC’s financial strength is high. Financial strength rating is 77.
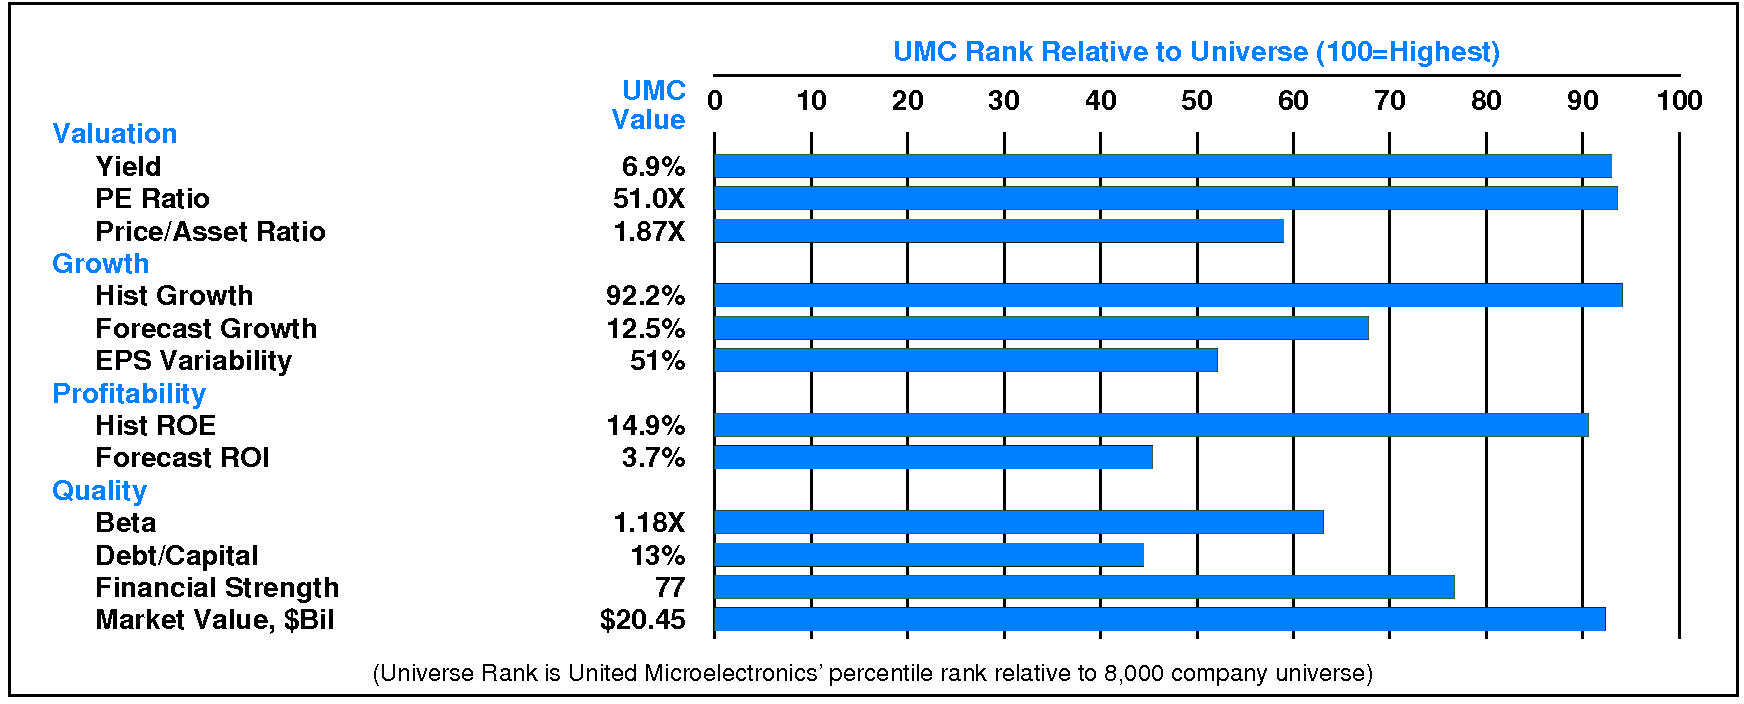
Relative to the S&P 500 Composite, United Microelectronics Corp has both Growth and Value characteristics; its appeal is likely to be to investors heavily oriented toward Income; the perception is that UMC is normal risk. Low forecasted profitability is a relative weakness for UMC. UMC’s valuation is low: high dividend yield, high P/E ratio, and low price/book ratio. UMC has low market capitalization.
CURRENT SIGNALS
United Microelectronics’ current operations are strong. Return on equity is rising, reflecting: widening pretax margins; and rising leverage.
United Microelectronics’ current technical position is mixed. The stock price is in a 4.4 month up move. The stock has appreciated 25.0% from its prior low. The 200 day moving average is in a downtrend. The stock price is above its 200 day moving average.
ALERTS
United Microelectronics Corp (NYSE: UMC) has recently experienced significant negative changes in fundamentals: significant quarterly sales deceleration occurred, and significant quarterly earnings deceleration occurred.
The stock is currently rated C.
United Microelectronics Corp (NYSE: UMC) stock rose modestly by 0.4% on 3/27/24. The stock closed at $7.98. Trading volume in this advance was normal. The stock has been strong relative to the market over the last nine months but has declined -3.4% during the last week.
CASH FLOW
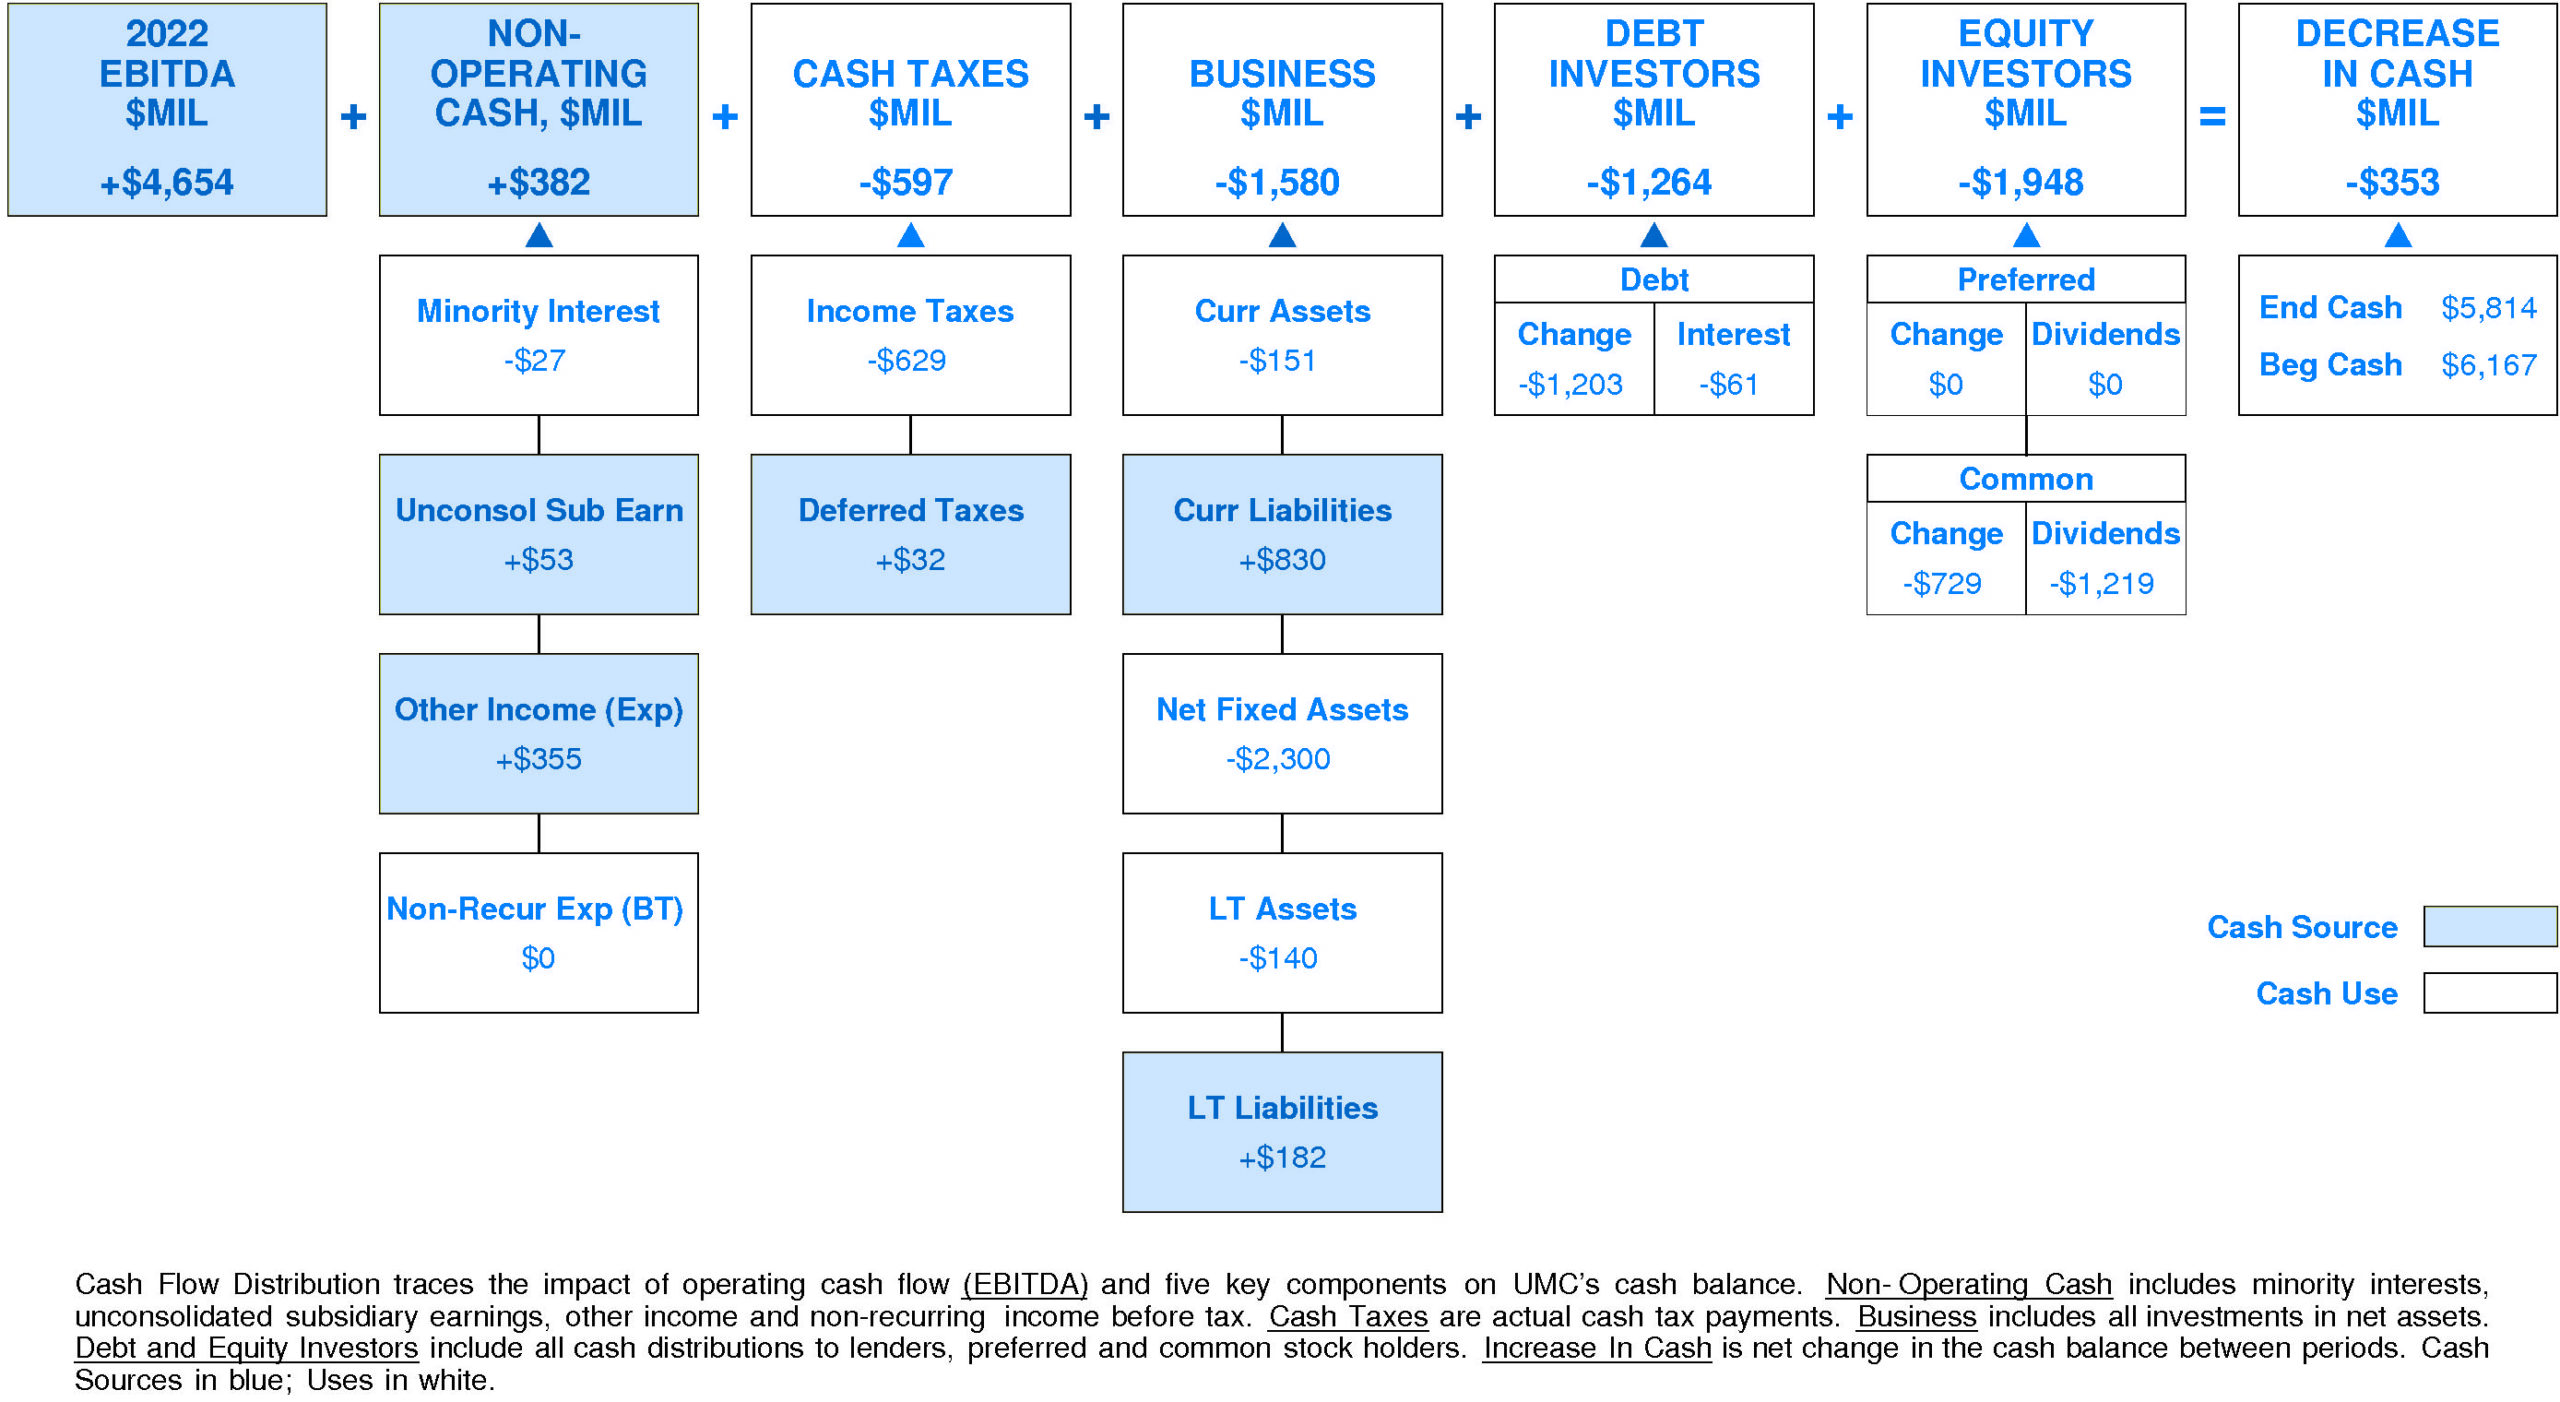
In 2022, United Microelectronics experienced a slight decrease in cash of -$353 million (-6%). Sources of cash were slightly lower than uses. Cash generated from 2022 EBITDA totaled +$4,654 million. Non-operating sources contributed +$382 million (+8% of EBITDA). Cash taxes consumed -$597 million (-13% of EBITDA). Re-investment in the business amounted to -$1,580 million (-34% of EBITDA). On a net basis, debt investors withdrew -$1,264 million (-27% of EBITDA) while equity investors received -$1,948 million (-42% of EBITDA).
UMC’s Non-operating Income, %EBITDA has exhibited little to no overall change over the period. This stability was accompanied by stability for the United Microelectronics Peer Group as well. (Since 2019 Non-operating Income, %EBITDA has experienced a very sharp decline.) In most years, United Microelectronics was in the top quartile. Currently, United Microelectronics is upper quartile at +8% of EBITDA (+$382 million).
UMC’s Cash Taxes, %EBITDA has experienced a small downtrend over the period. This downtrend was accompanied by stability for the United Microelectronics Peer Group. In most years, United Microelectronics was in the second quartile and top quartile. Currently, United Microelectronics is lower quartile at -13% of EBITDA (-$597 million).
UMC’s Business Re-investment, %EBITDA has enjoyed a very strong overall uptrend over the period. This improvement was accompanied by an opposite trend for the United Microelectronics Peer Group. (Since 2019 Business Re-investment, %EBITDA has accelerated very sharply.) In most years, United Microelectronics was in the second quartile and lower quartile. Currently, United Microelectronics is above median at -34% of EBITDA (-$1,580 million).
UMC’s Debt Investors, %EBITDA has experienced a volatile overall downtrend over the period. This downtrend was accompanied by an opposite trend for the United Microelectronics Peer Group. In most years, United Microelectronics was in the top quartile and lower quartile. Currently, United Microelectronics is substantially below median at -27% of EBITDA (-$1,264 million).
UMC’s Equity Investors, %EBITDA has exhibited a volatile overall uptrend over the period. This improvement was accompanied by a similar trend for the United Microelectronics Peer Group. (Since 2020 Equity Investors, %EBITDA has experienced a very sharp decline.) In most years, United Microelectronics was in the third quartile and second quartile. Currently, United Microelectronics is substantially below median at -42% of EBITDA (-$1,948 million).
UMC’s Change in Cash, %EBITDA has experienced a volatile overall uptrend over the period. This improvement was accompanied by a similar trend for the United Microelectronics Peer Group. In most years, United Microelectronics was in the top quartile. Currently, United Microelectronics is below median at -8% of EBITDA (-$353 million).
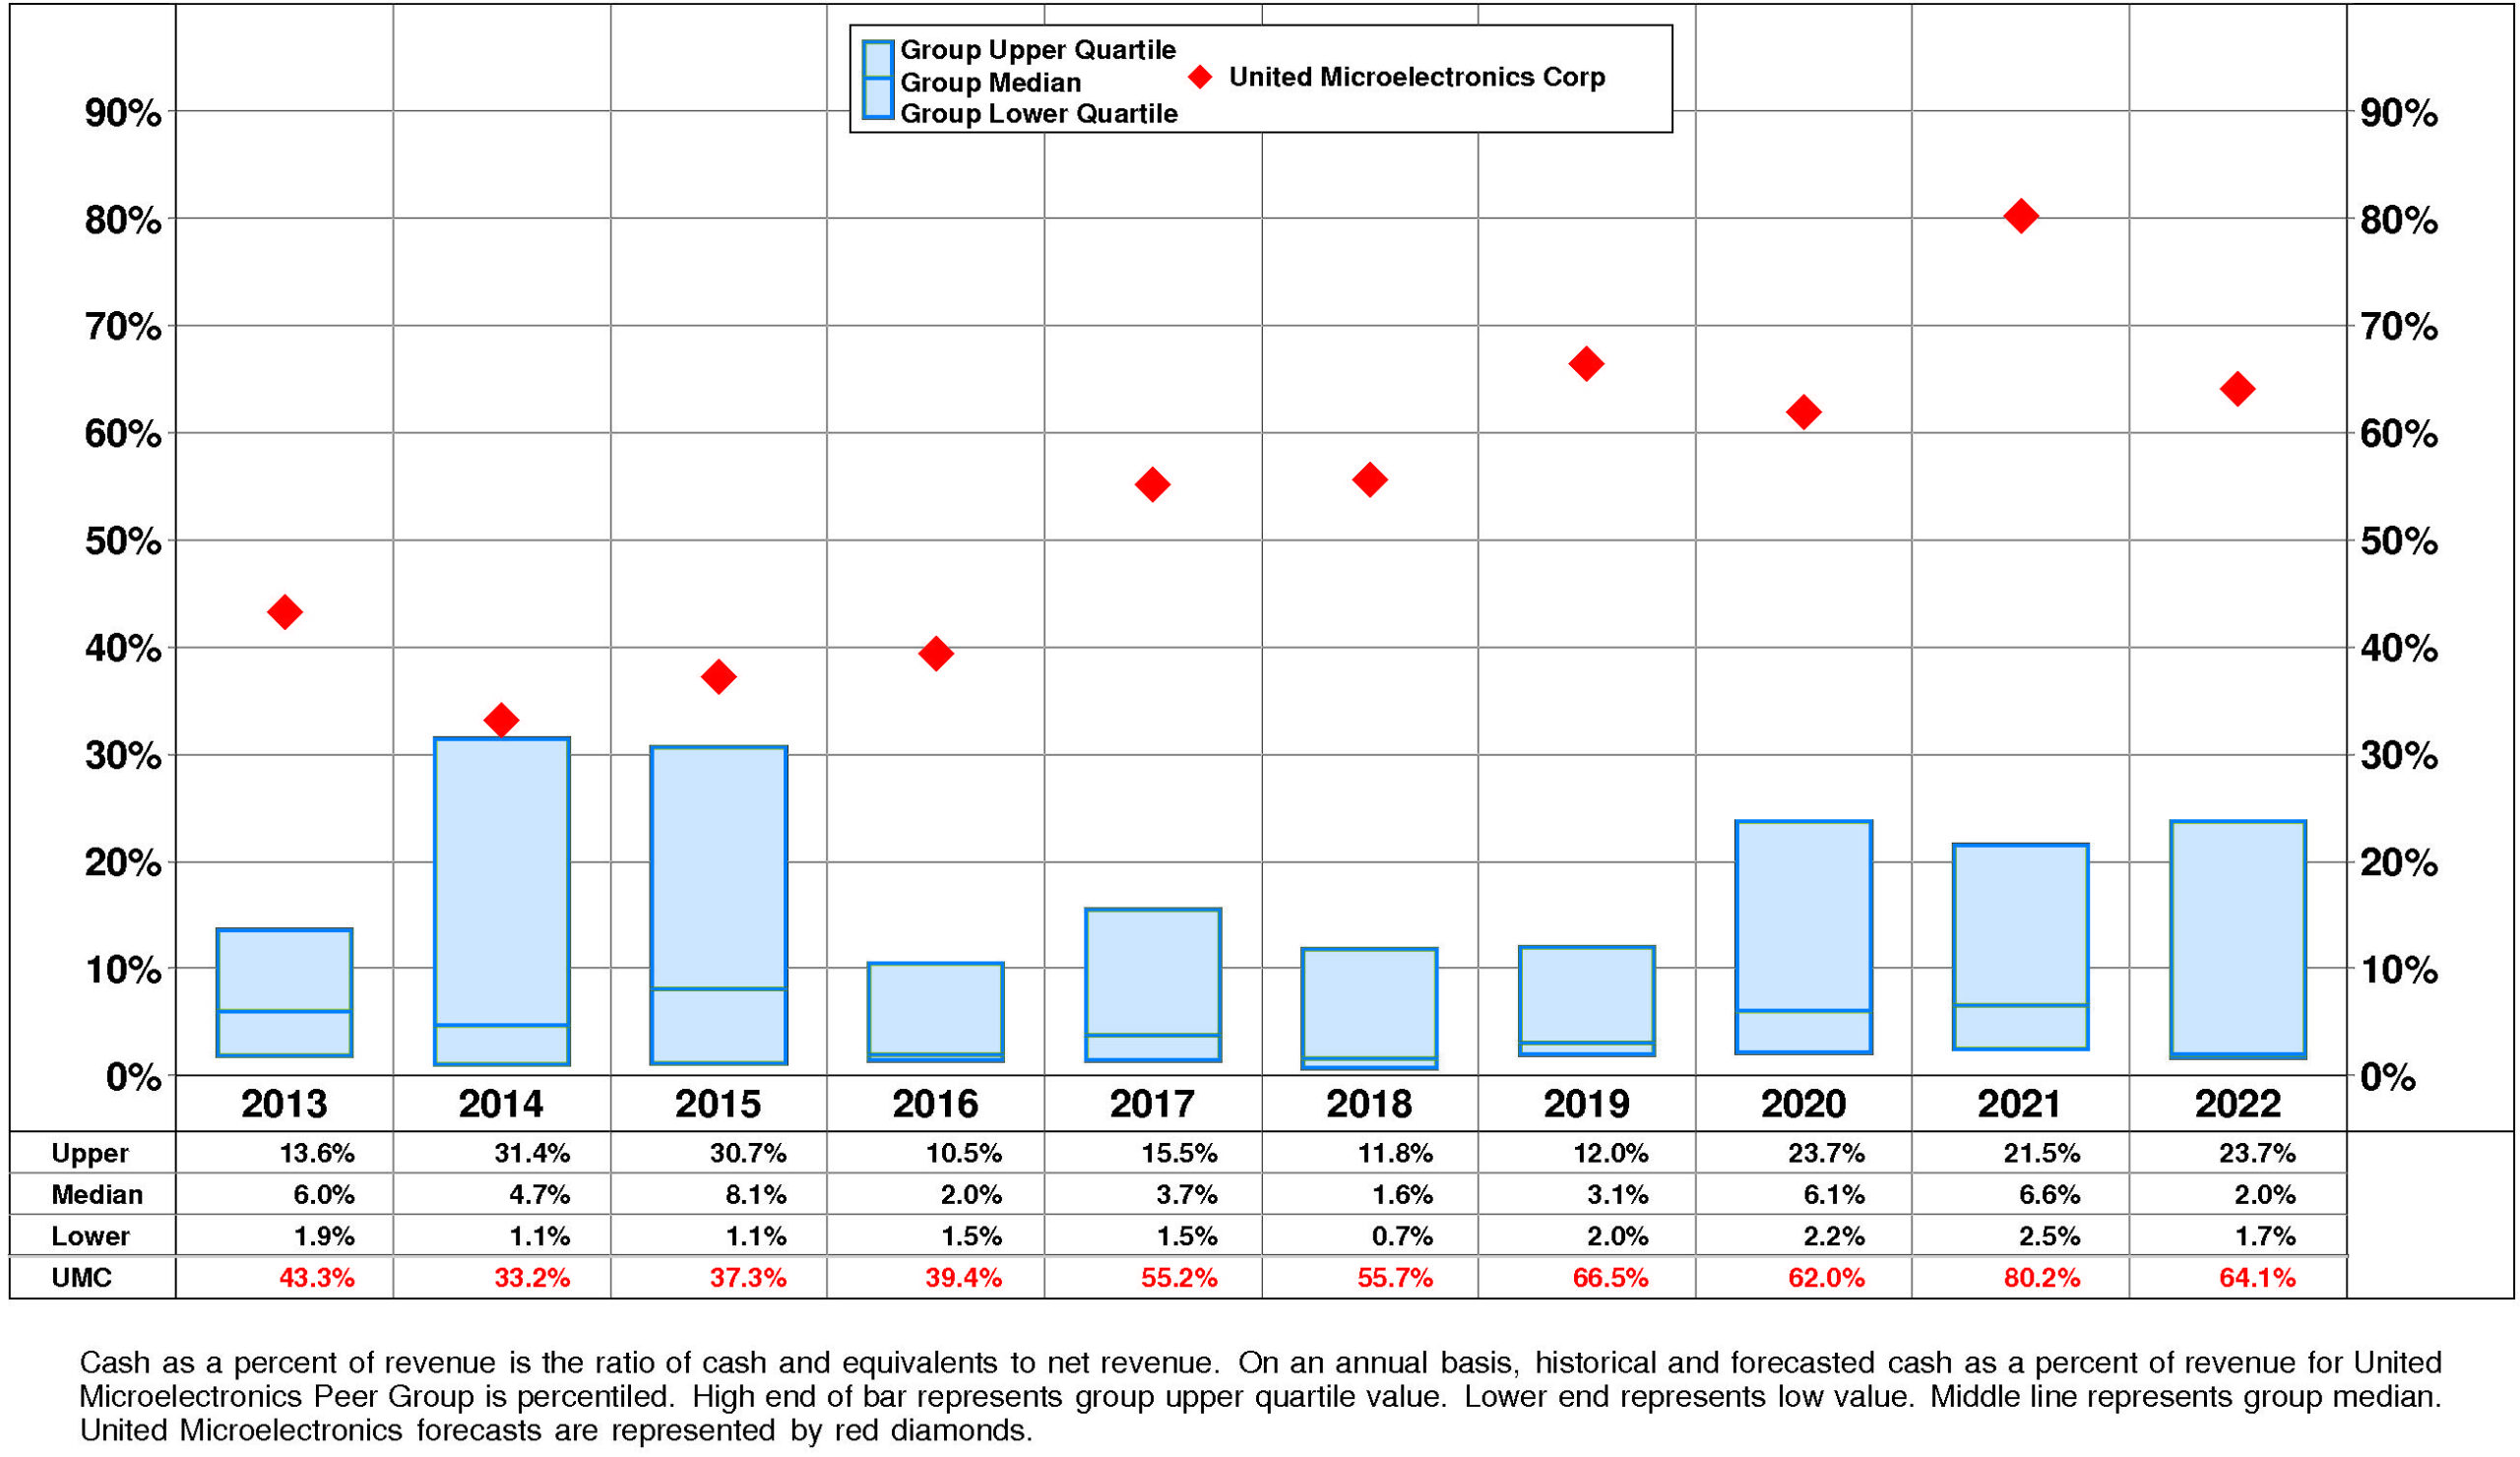
UMC’s Cash, %Revenue has enjoyed a very strong overall uptrend over the period. This improvement was accompanied by stability for the United Microelectronics Peer Group. In most years, United Microelectronics was in the top quartile. Currently, United Microelectronics is upper quartile at +64%.
PROFITABILITY
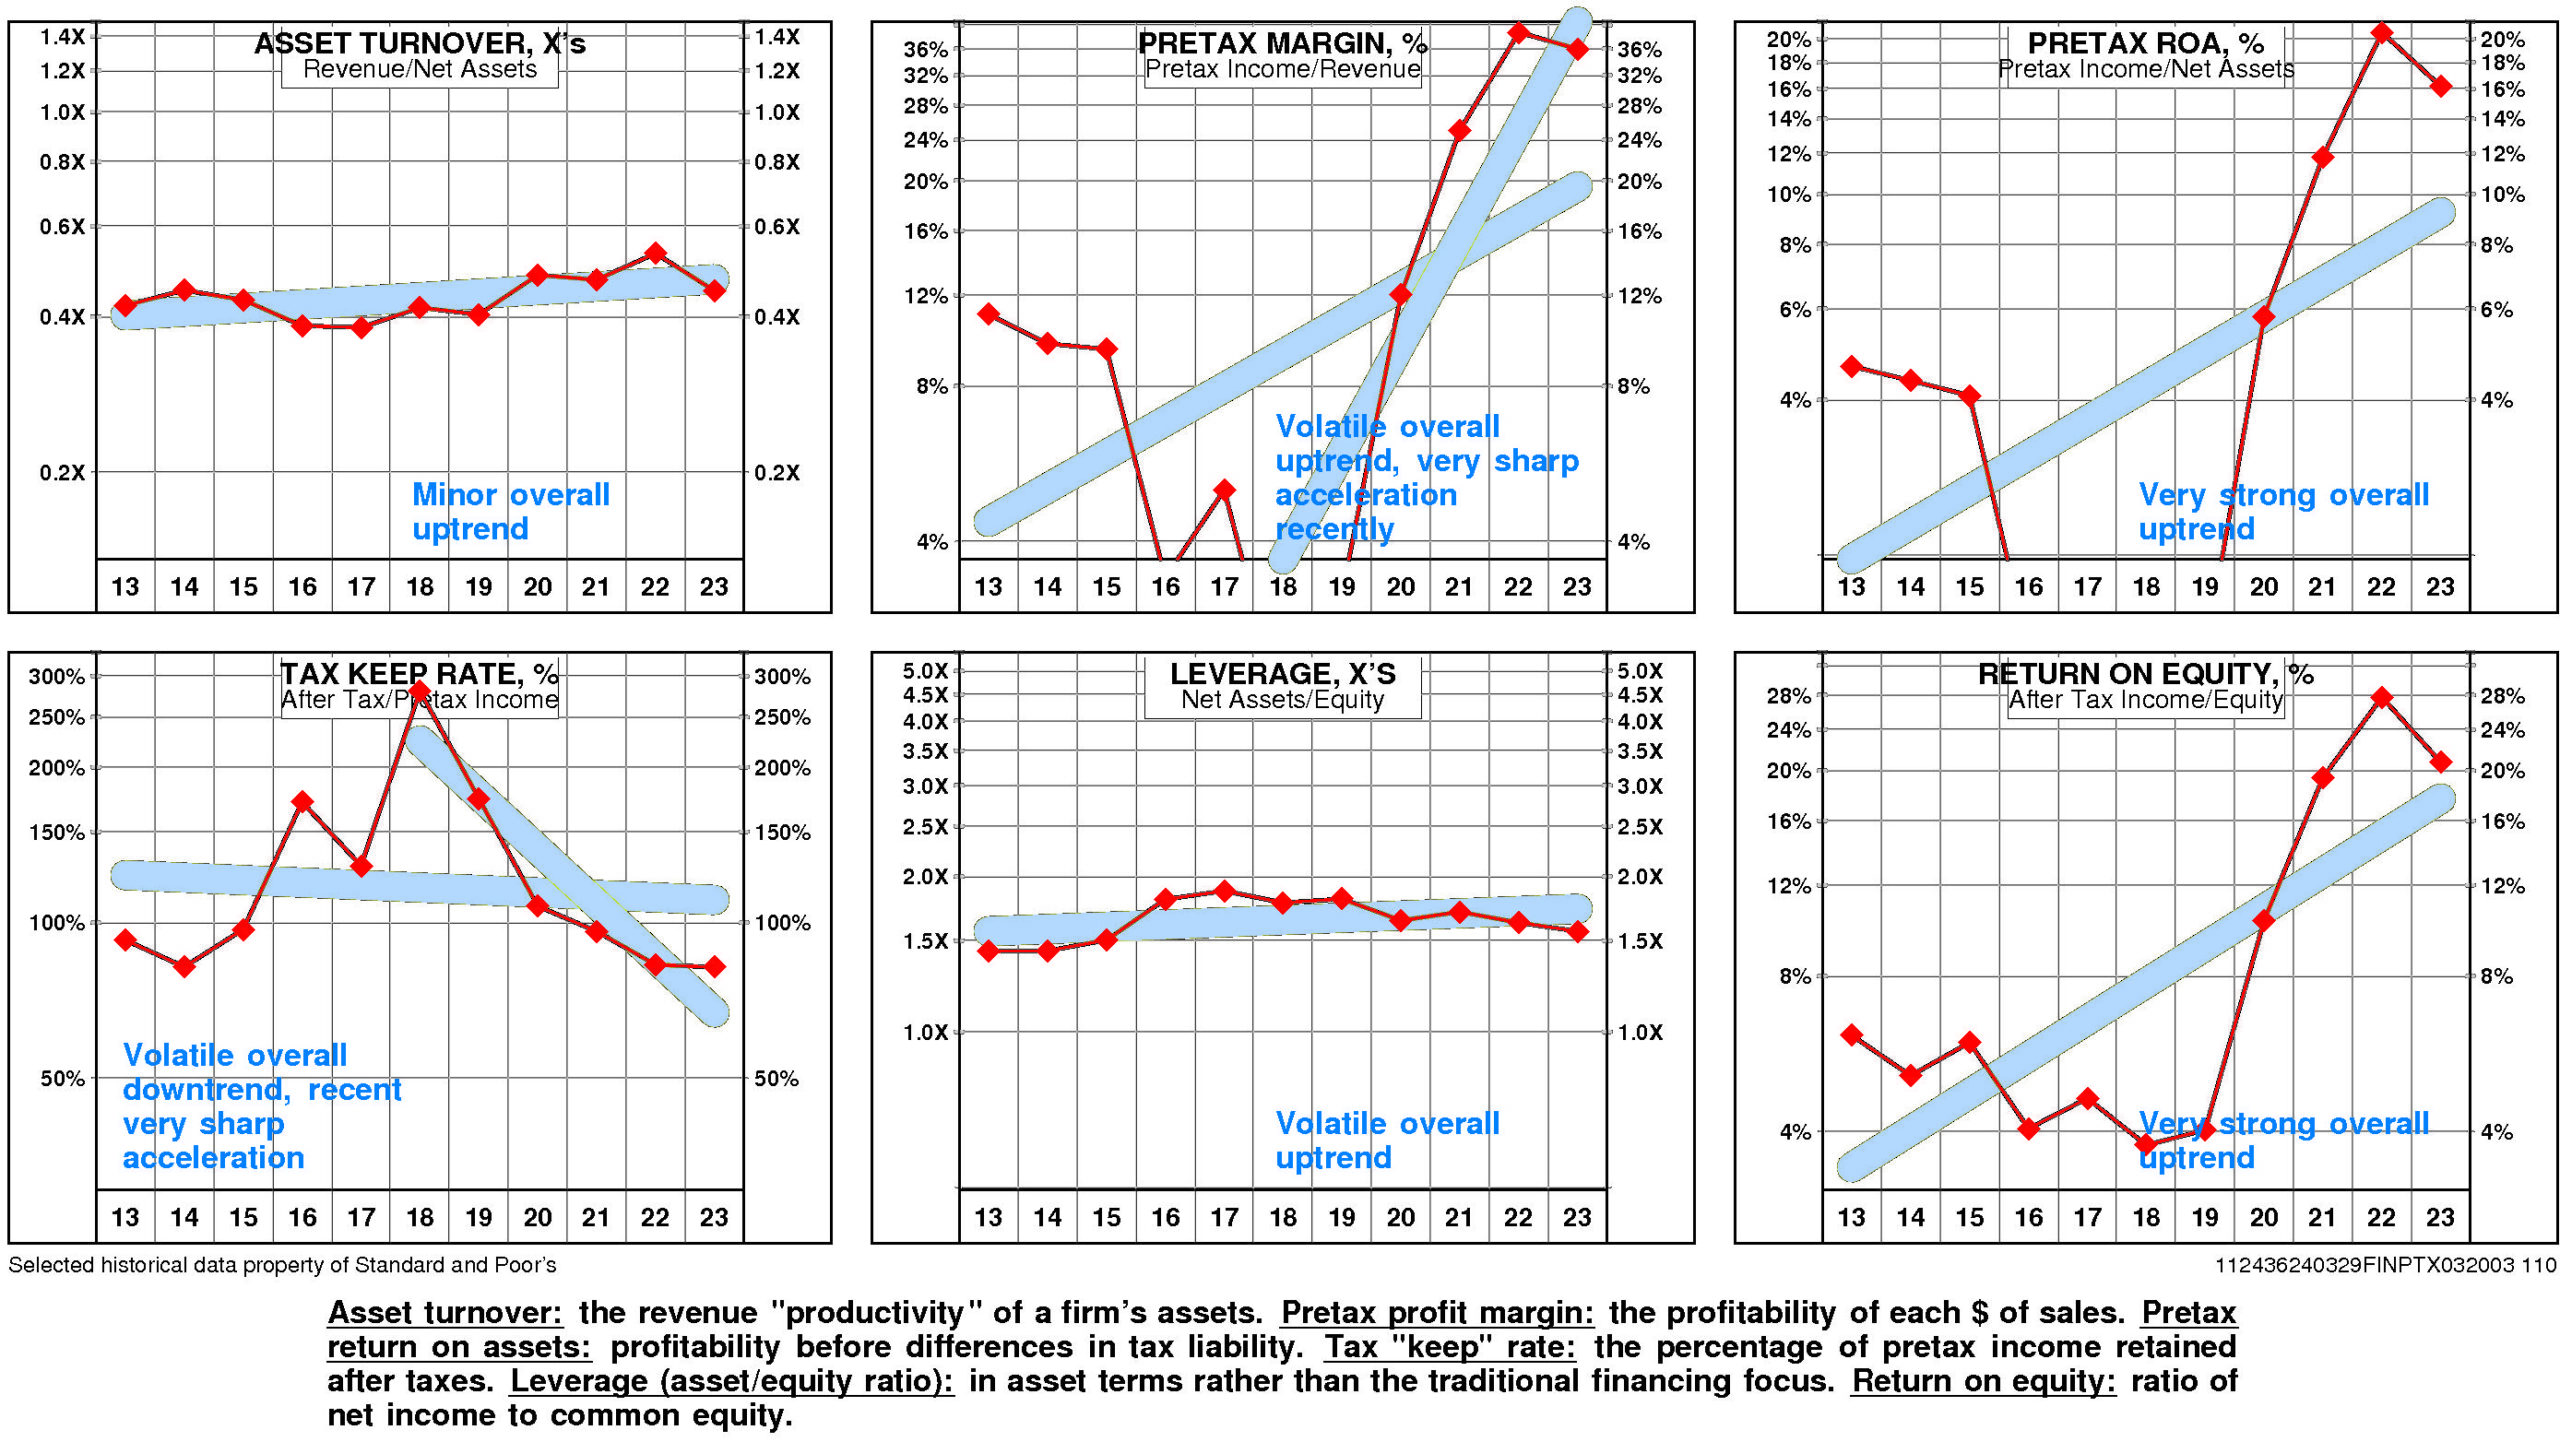
UMC’s return on equity has improved very significantly since 2013. The current level of 20.7% is 3.38X the low for the period and is -25.2% from the high.
This very significant improvement was due to very strong positive trend in pretax operating return and little change in non-operating factors.
The productivity of UMC’s assets rose over the full period 2013-2023: asset turnover has exhibited a minor overall uptrend.
Reinforcing this trend, pretax margin enjoyed a volatile overall uptrend that accelerated very sharply from the 2018 level.
Non-operating factors (income taxes and financial leverage) had little influence on return on equity.
UMC’s return on equity is upper quartile (20.7%) for the four quarters ended September, 2023.
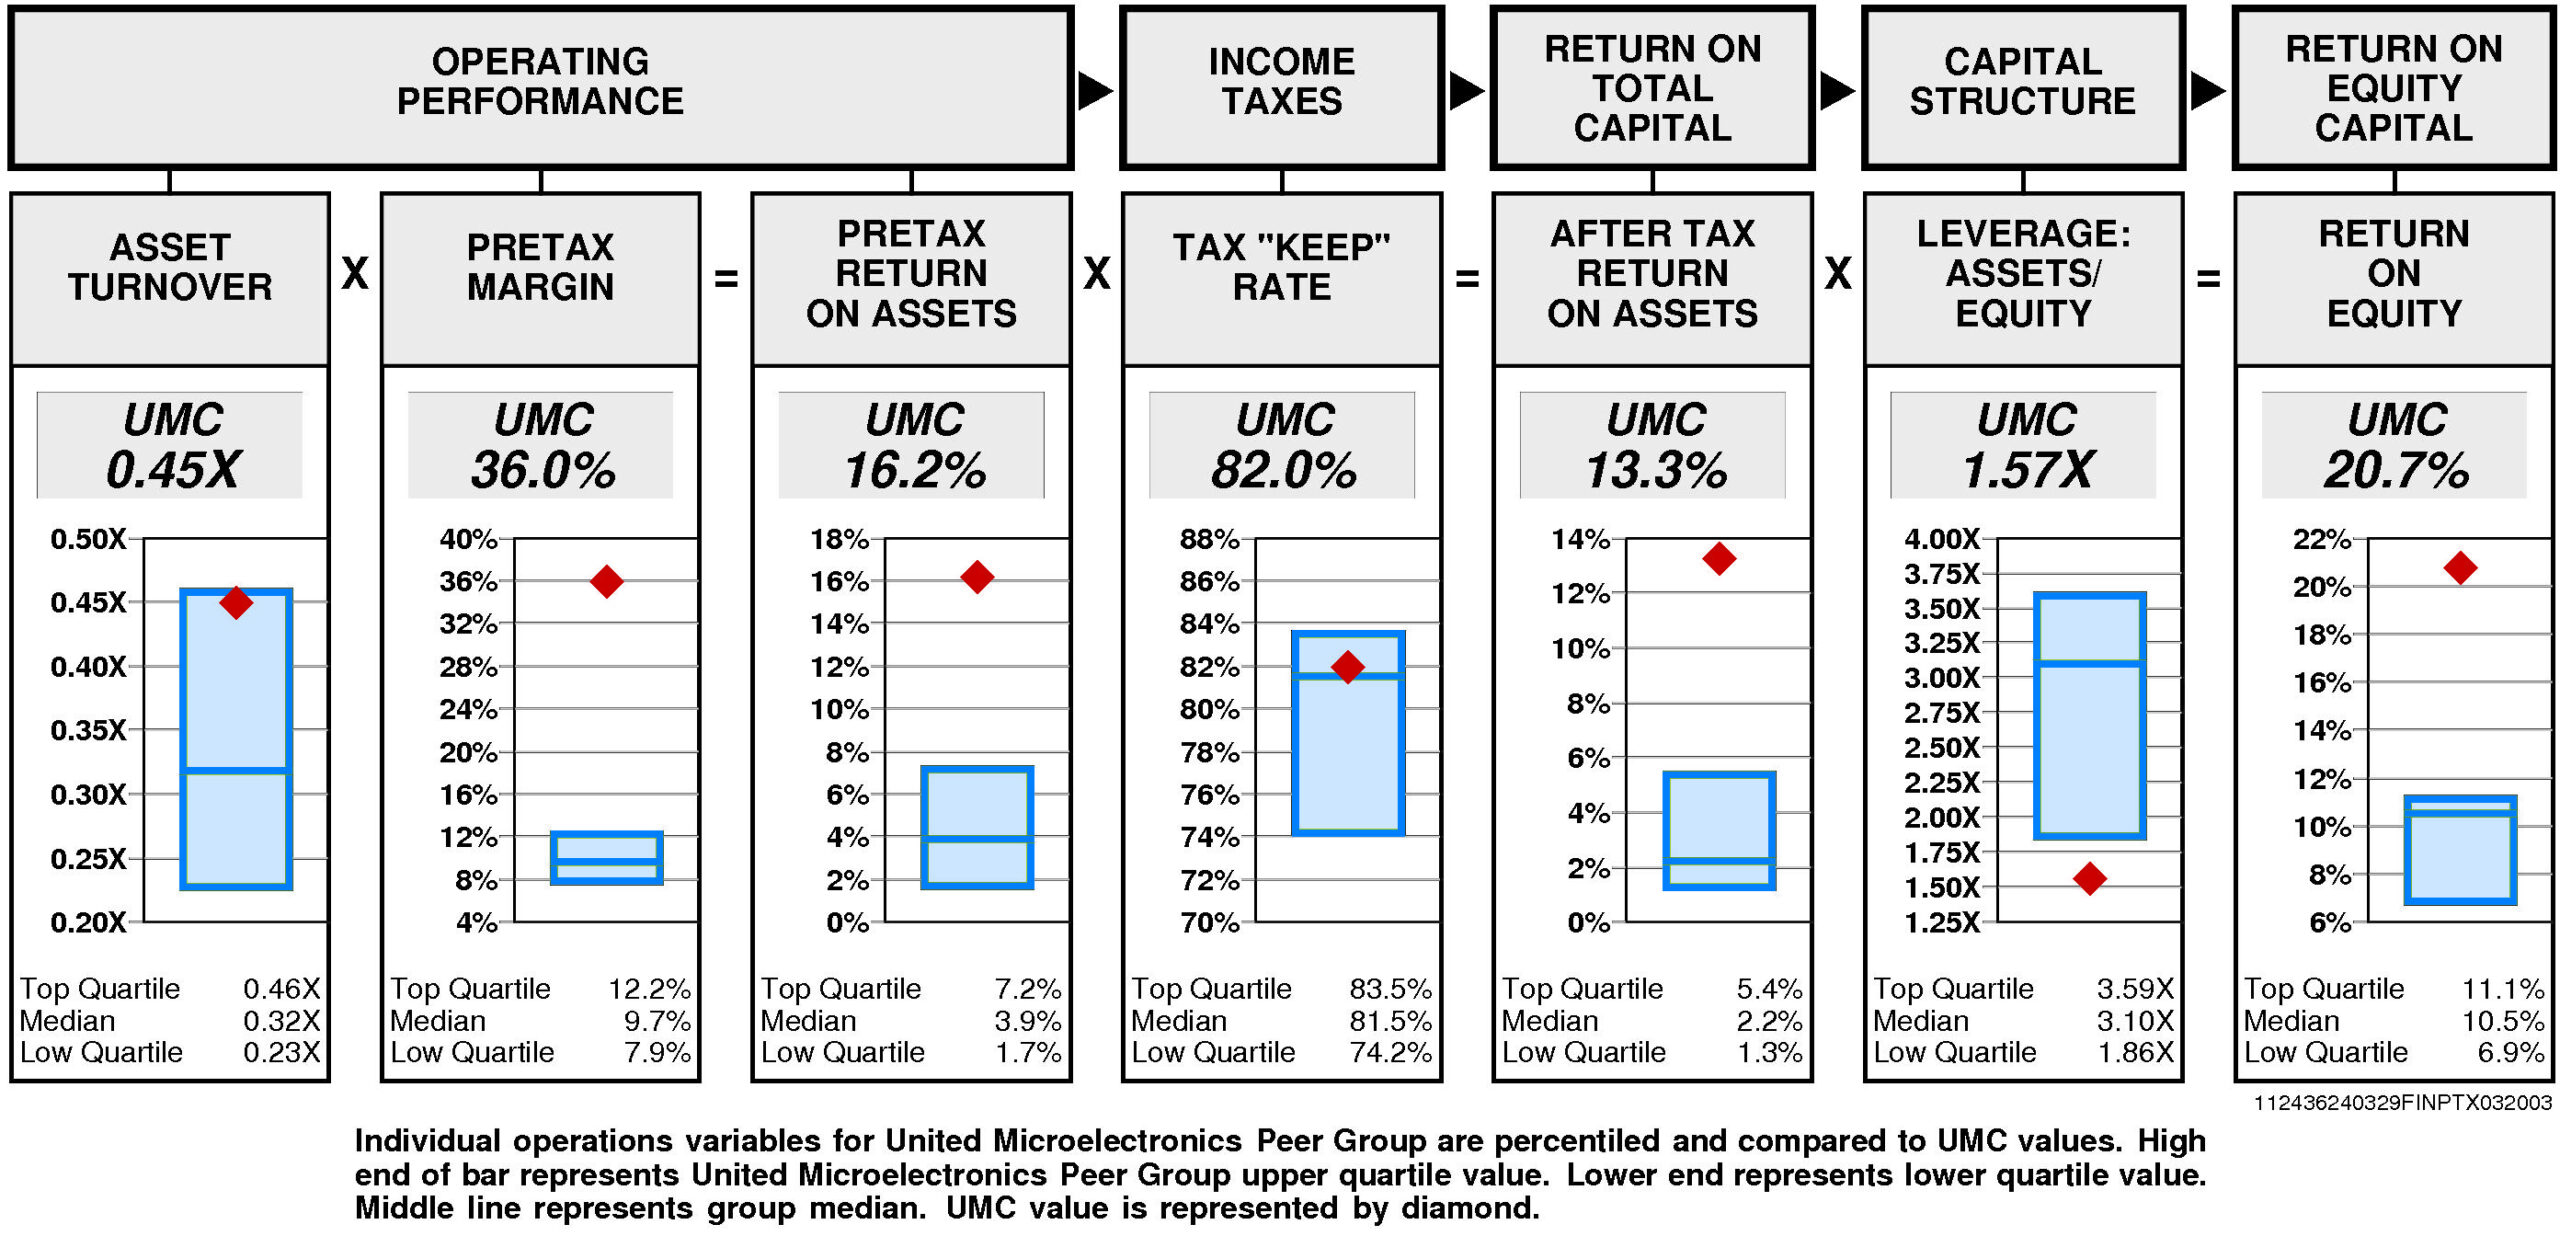
Operating performance (pretax return on assets) is upper quartile (16.2%) reflecting asset turnover that is at the upper quartile (0.45X) and upper quartile pretax margin (36.0%).
Tax “keep” rate (income tax management) is at the upper quartile (82.0%) resulting in after tax return on assets that is upper quartile.
Financial leverage (leverage) is lower quartile (1.57X).
GROWTH RATES
There are no significant differences between United Microelectronics’ longer term growth and growth in recent years.
United Microelectronics’ historical income statement growth and balance sheet growth have diverged. Revenue growth has paralleled asset growth; earnings growth has exceeded equity growth.
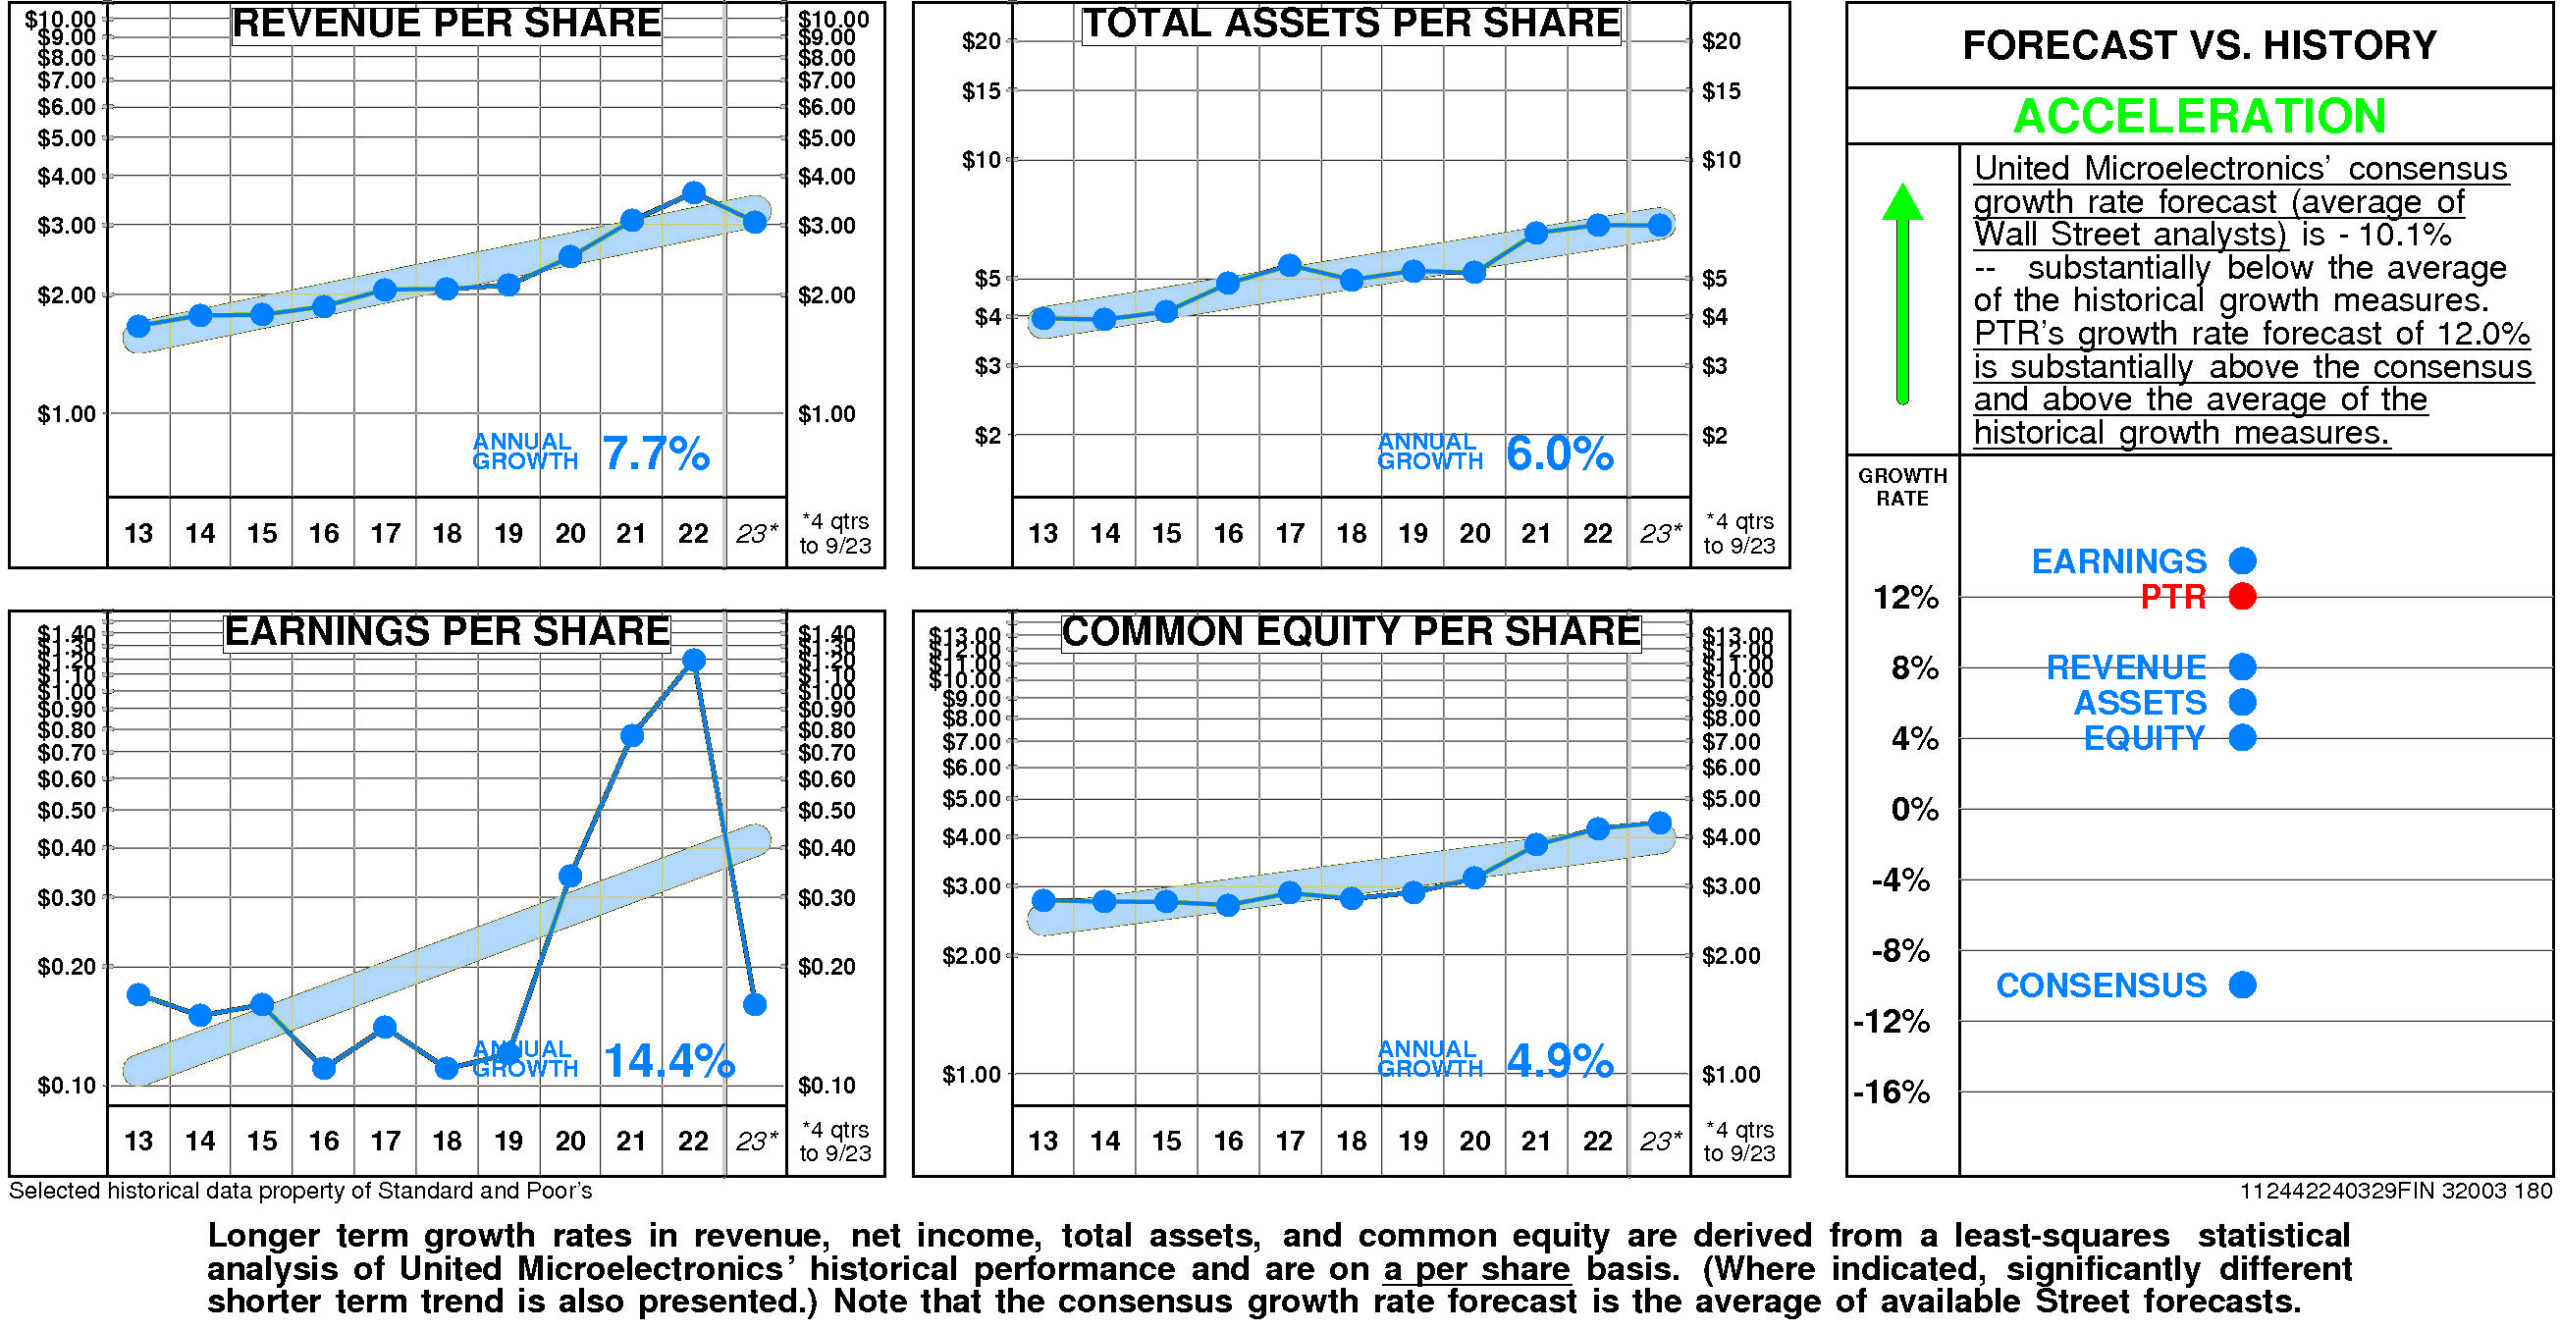
Annual revenue growth has been 7.7% per year.
Total asset growth has been 6.0% per year.
Annual E.P.S. growth has been 14.4% per year.
Equity growth has been 4.9% per year.
United Microelectronics’ consensus growth rate forecast (average of Wall Street analysts) is -10.1% — substantially below the average of the historical growth measures.
Relative to the United Microelectronics Peer Group, United Microelectronics’ historical growth measures are generally top quartile. Revenue growth (7.7%) has been upper quartile. E.P.S. growth (14.4%) has been upper quartile. Equity growth (4.9%) has been at the upper quartile. Total asset growth (6.0%) has been substantially above median.
In total contrast, consensus growth forecast (-10.1%) is lower quartile.

PRICE HISTORY
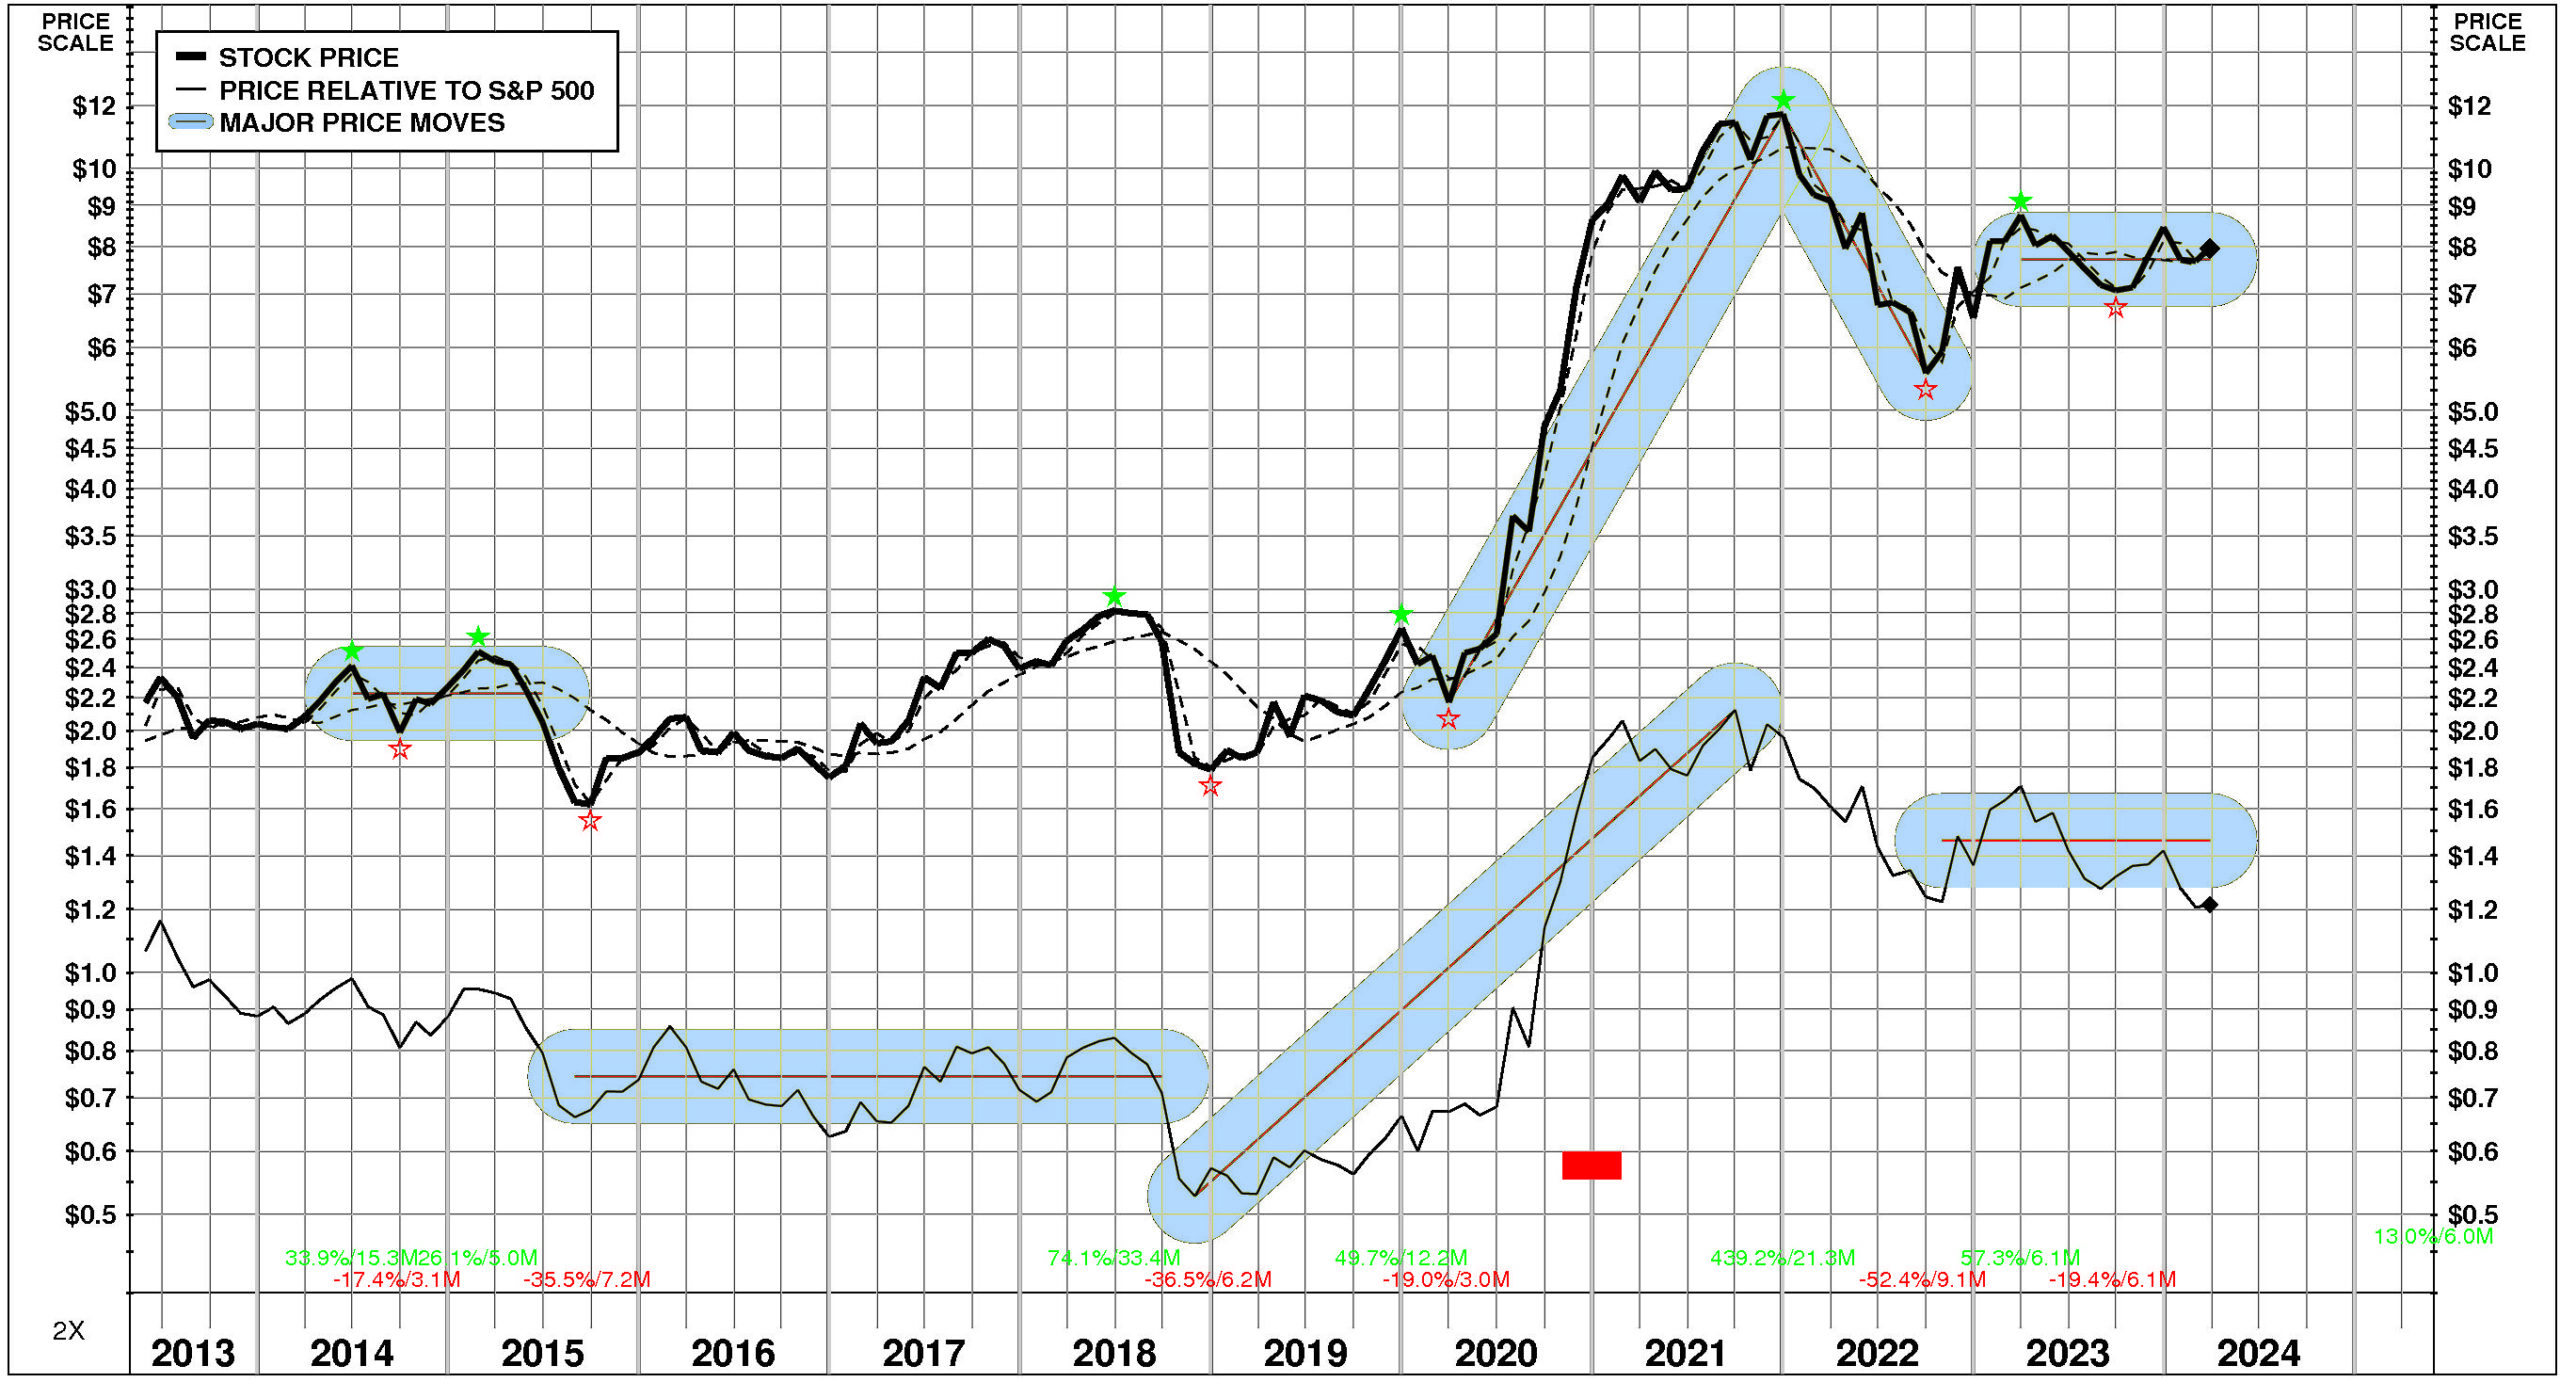
Over the full time period, United Microelectronics’ stock price performance has been variable and good. Between May, 2013 and March, 2024, United Microelectronics’ stock price rose +268%; relative to the market, this was a +14% gain. Significant price moves during the period: 1) December, 2021 – September, 2022: -52%; and 2) March, 2020 – December, 2021: +439%.
TOTAL INVESTMENT RETURNS
Current annual total return performance of 1.4% is below median relative to the S&P 500 Composite.
In addition to being below median relative to S&P 500 Composite, current annual total return performance through February, 2024 of 1.4% is at the upper quartile relative to United Microelectronics Corp Peer Group.
Current 5-year total return performance of 39.6% is upper quartile relative to the S&P 500 Composite.
Through February, 2024, with upper quartile current 5-year total return of 39.6% relative to S&P 500 Composite, United Microelectronics’ total return performance is upper quartile relative to United Microelectronics Corp Peer Group.

VALUATION BENCHMARKS
Relative to S&P 500 Composite, UMC’s overall valuation is quite low. The highest factor, the ratio of enterprise value/assets, is below median. Ratio of enterprise value/revenue is below median. Price/equity ratio is lower quartile. Ratio of enterprise value/earnings before interest and taxes is lower quartile. The lowest factor, the price/earnings ratio, is lower quartile.
Relative to United Microelectronics Peer Group, UMC’s overall valuation is normal. The highest factor, the ratio of enterprise value/assets, is upper quartile. Price/equity ratio is upper quartile. Ratio of enterprise value/revenue is above median. Ratio of enterprise value/earnings before interest and taxes is at the lower quartile. The lowest factor, the price/earnings ratio, is at the lower quartile.
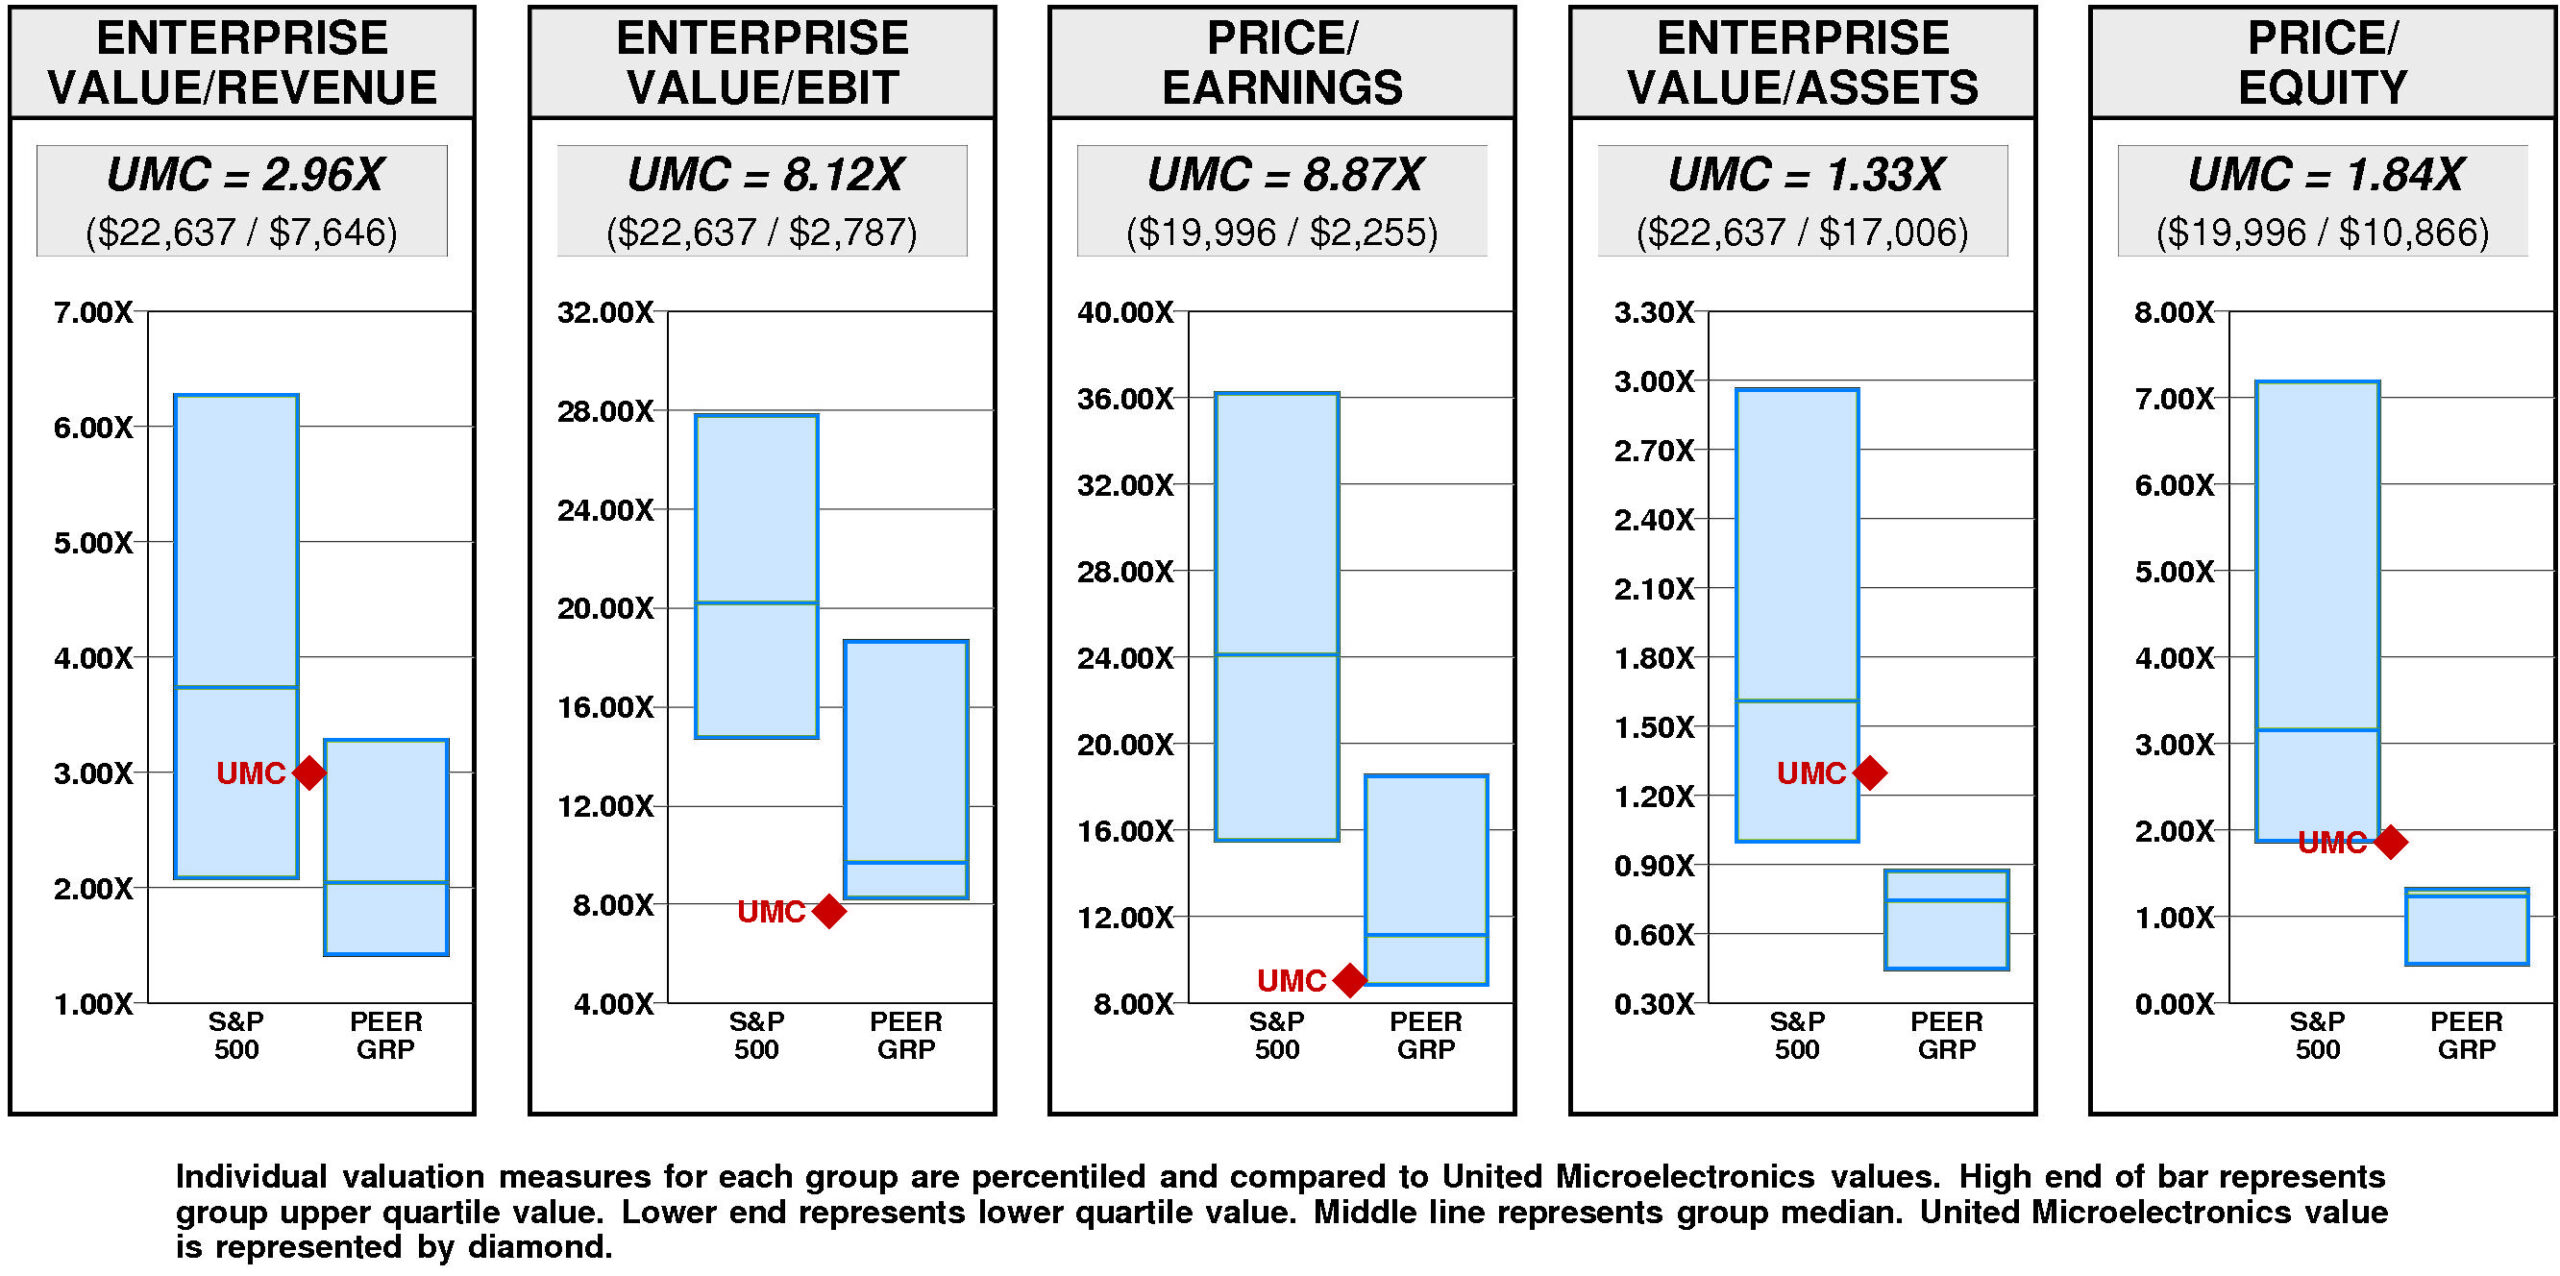
United Microelectronics has a major value gap compared to the median. For UMC to achieve median valuation, its current ratio of enterprise value/revenue would have to fall from the current level of 2.96X to 2.05X. If UMC’s ratio of enterprise value/revenue were to fall to 2.05X, its stock price would be lower by $-3 to $5.
For UMC to achieve upper quartile valuation relative to the United Microelectronics Peer Group, its current ratio of enterprise value/revenue would have to rise from the current level of 2.96X to 3.28X. If UMC’s ratio of enterprise value/revenue were to rise to 3.28X, its stock price would increase by $1 from the current level of $7.98.
VALUE TARGETS
With future capital returns forecasted to exceed the cost of capital, UMC is expected to continue to be a modest Value Builder.
United Microelectronics’ current Price Target of $12 represents a +53% change from the current price of $7.98.
This neutral appreciation potential results in an appreciation score of 55 (45% of the universe has greater appreciation potential.)
Reinforcing this neutral Appreciation Score of 55, the moderately high Power Rating of 61 contributes to an Value Trend Rating of C.
United Microelectronics’ current Price Target is $12 (+8% from the 2022 Target of $11 and +53% from the 03/27/24 price of $7.98). This slight rise in the Target is the result of a +6% increase in the equity base and a +2% increase in the price/equity multiple. The forecasted decline in return on equity has a very large negative impact on the price/equity multiple and the forecasted decline in growth has a slight negative impact as well. More than offsetting these Drivers, the forecasted decline in cost of equity has a very large positive impact.
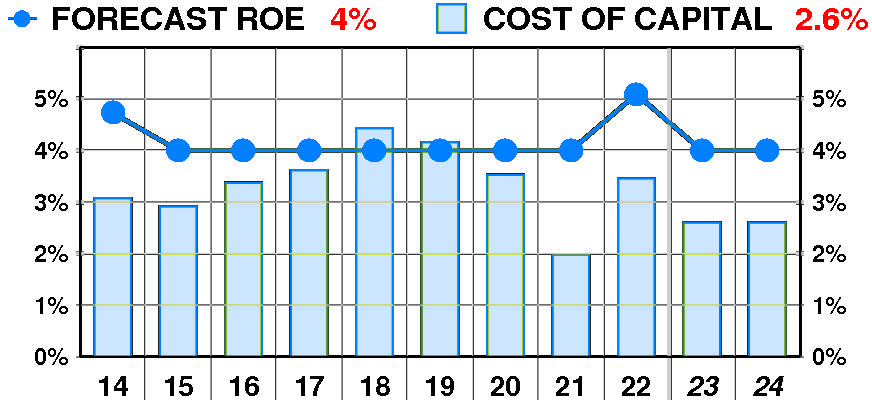
PTR’s return on equity forecast is 4.0% — in line with our recent forecasts. Forecasted return on equity erratic but little changed between 2014 and 2022. The current forecast is steady at the 2021 low of 4%.
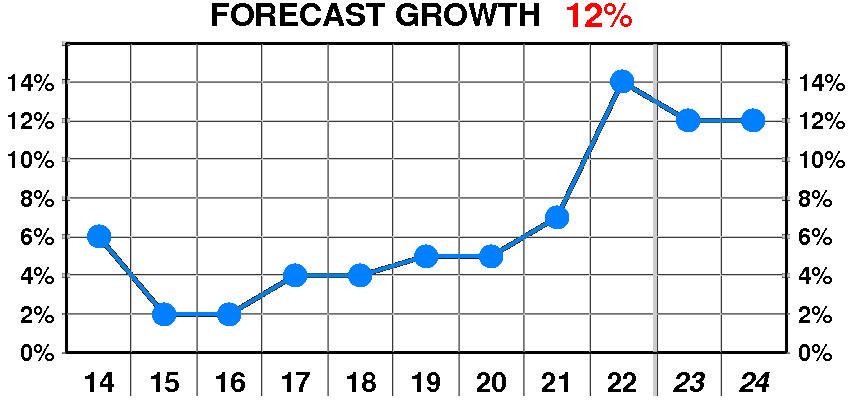
PTR’s growth forecast is 12.0% — slightly below our recent forecasts. Forecasted growth enjoyed a dramatic, erratic increase between 2014 and 2022. The current forecast is significantly above the 2016 low of 2%.
PTR’s cost of equity forecast is 2.6% — in line with recent levels. Forecasted cost of equity exhibited a slight, erratic decline between 2014 and 2022. The current forecast is steady at the 2018 peak of 4.4%.
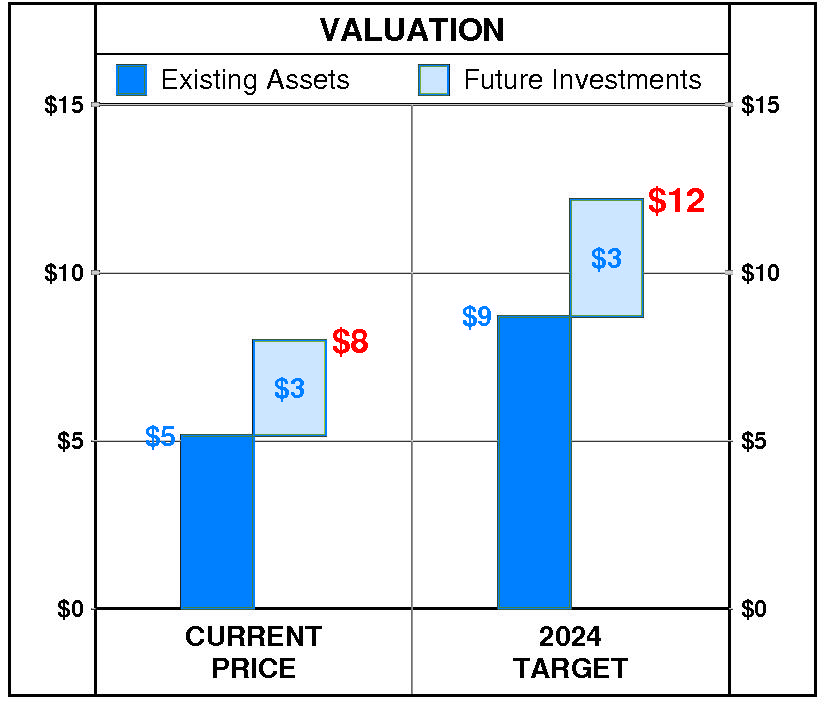
At United Microelectronics’ current price of $7.98, investors are placing a positive value of $3 on its future investments. This view is consistent with the company’s most recent performance that reflected a growth rate of 14.0% per year, and a return on equity of 5.1% versus a cost of equity of 3.5%.
PTR’s 2024 Price Target of $12 is based on these forecasts and reflects an estimated value of existing assets of $9 and a value of future investments of $3.
Be the first to comment