BUSINESS
TTM Technologies, Inc., together with its subsidiaries, engages in the manufacture and sale of printed circuit boards (PCBs) worldwide. The company operates in two segments, PCB and RF&S Components. It offers PCB products, radio frequency (RF) components, conventional PCBs, RF and microwave circuits, high density interconnect PCBs, substrate-like PCBs, flexible PCBs, rigid-flex PCBs, custom assemblies and system integration products, IC substrates, passive RF components, advanced ceramic RF components, multi-chip modules, and beamforming and switching networks. The company also produces printed circuits with heavy copper cores, as well as embedded and press-fit coins; PCBs with electrically passive heat sinks; and PCBs with electrically active thermal cores.
INVESTMENT RATING
With future capital returns forecasted to be above the cost of capital, TTMI is expected to continue to be an important Value Builder.
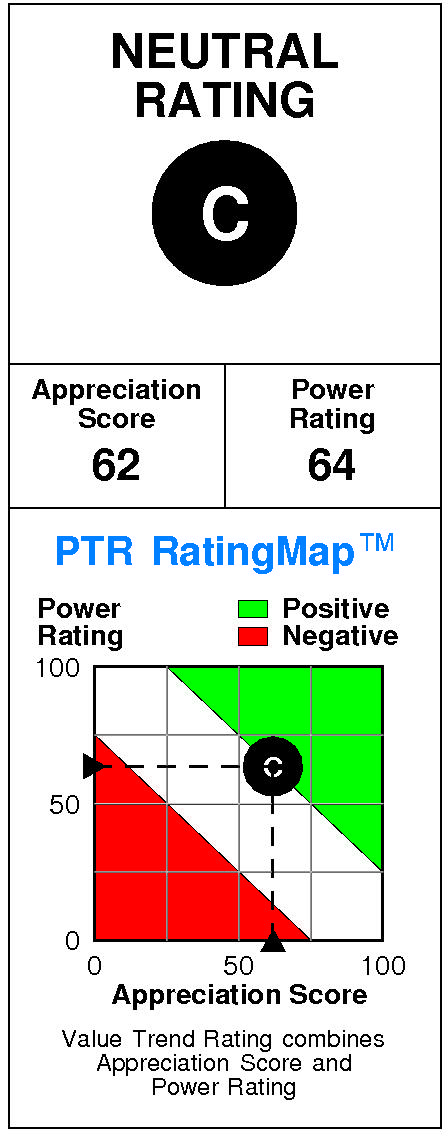
TTM Technologies has a current Value Trend Rating of C (High Neutral).
This rating combines highly consistent signals from two proprietary PTR measures of a stock's attractiveness. TTM Technologies has a slightly positive Appreciation Score of 62 and a slightly positive Power Rating of 64, producing the High Neutral Value Trend Rating.
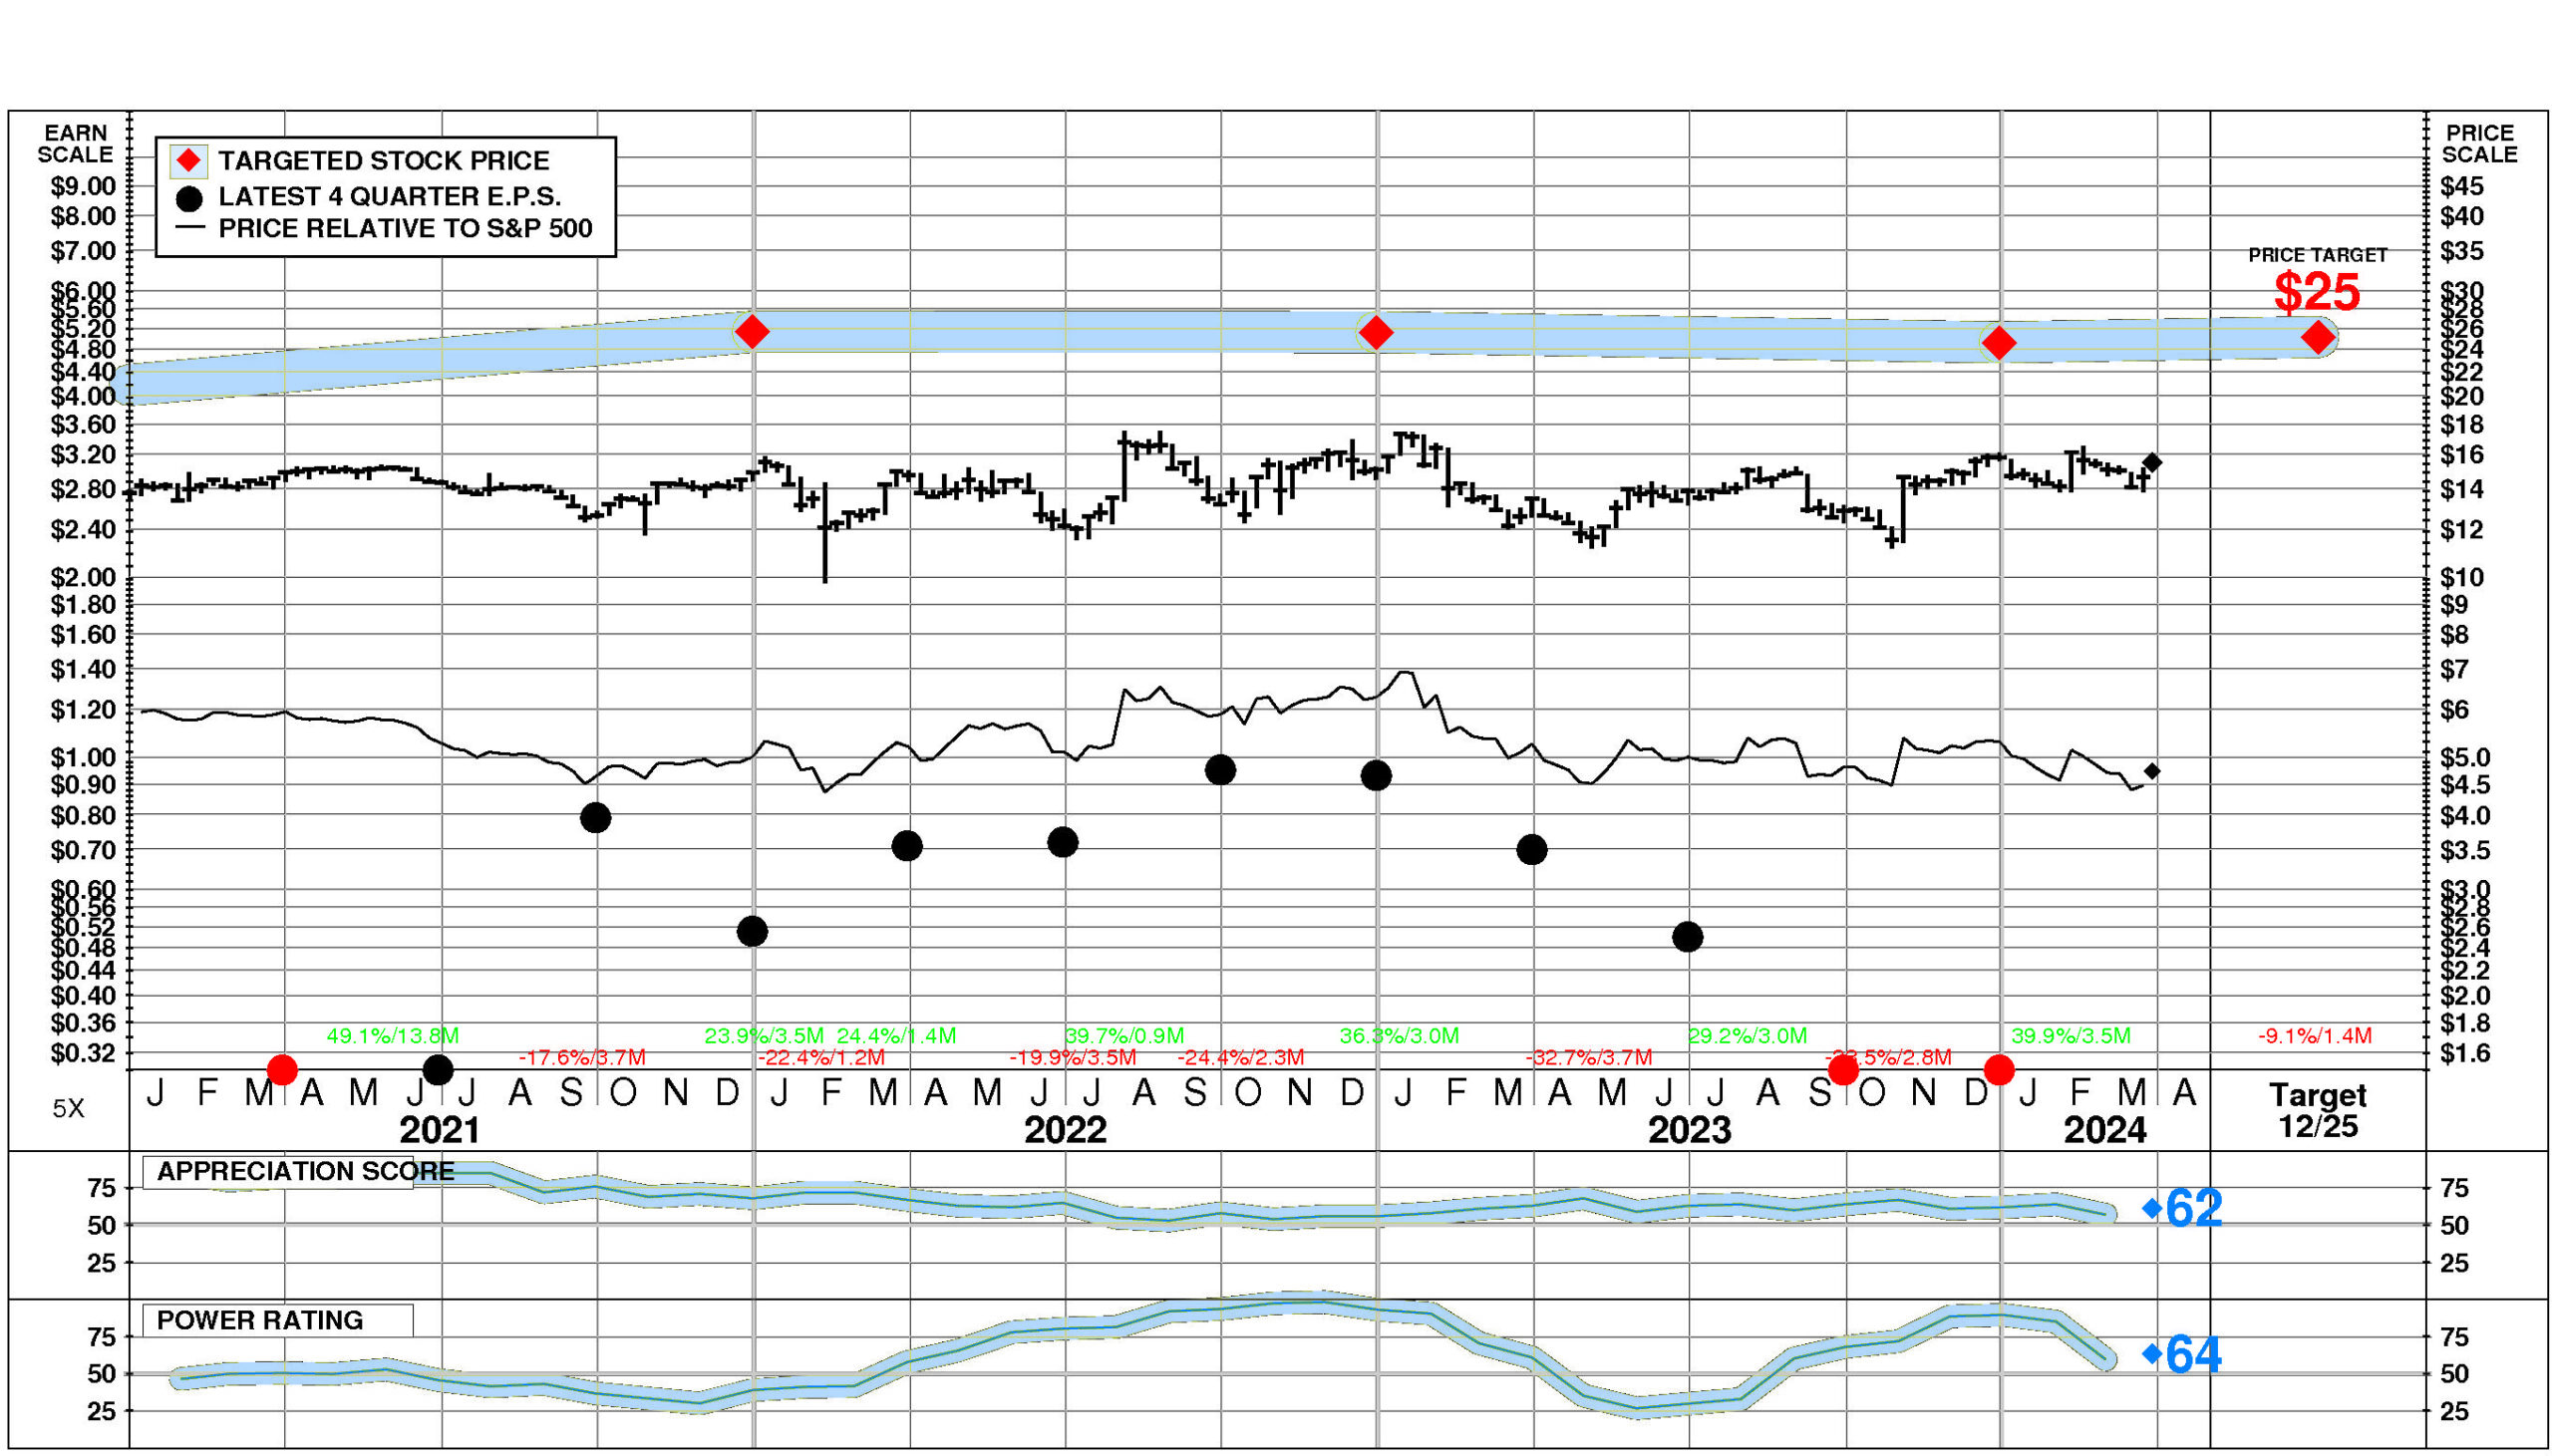
TTM Technologies' stock is selling well below targeted value.
The current stock price of $15.53 compares to targeted value 12 months forward of $25.
This moderately high appreciation potential results in an appreciation score of 62 (only 38% of the universe has greater appreciation potential.)
TTM Technologies has a Power Rating of 64.
(This slightly positive Power Rating indicates that TTMI's chances of achieving favorable investment performance over the near to intermediate term are only average.)
Factors contributing to this slightly positive Power Rating include: recent price action has been slightly favorable; and the Printed Circuit Boards comparison group is currently in a modestly favorable position. An offsetting factor is the trend in TTMI's earnings estimates has been unfavorable in recent months.
INVESTMENT PROFILE
TTMI's financial strength is low. Financial strength rating is 19.
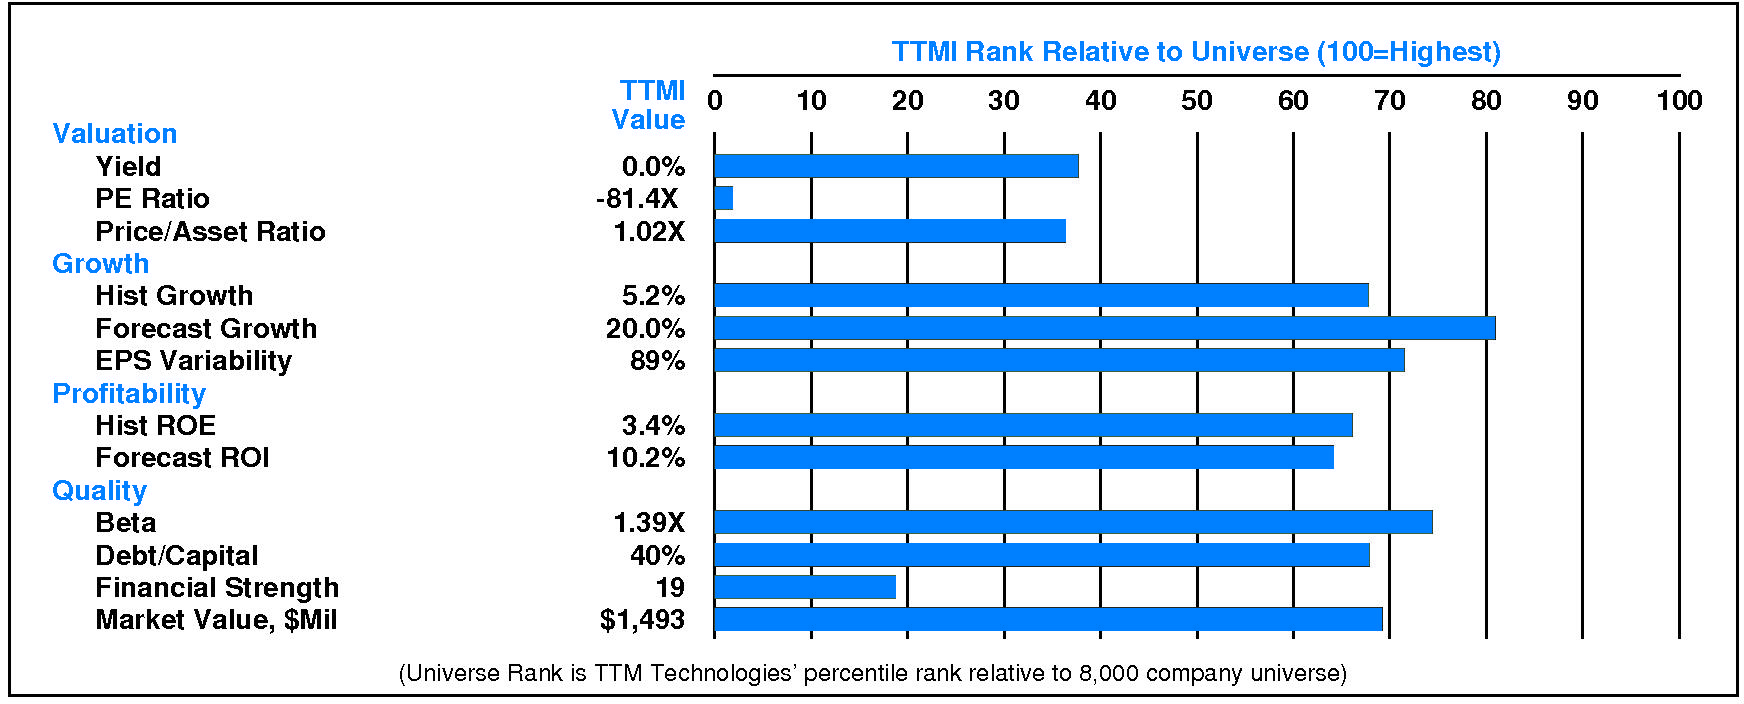
Relative to the S&P 500 Composite, TTM Technologies Inc has moderate Value characteristics; its appeal is likely to be to Capital Gain-oriented investors; the perception is that TTMI is higher risk.
High expected growth is a positive for TTMI. Relative weaknesses include: low forecasted profitability, low historical profitability, low financial strength, high stock price volatility, and high earnings variability. TTMI's valuation is low: low dividend yield, low P/E ratio, and low price/book ratio. TTMI has unusually low market capitalization.
CURRENT SIGNALS
TTM Technologies' current operations are strong.
Return on equity is rising, reflecting: widening pretax margins; and rising leverage.
TTM Technologies' current technical position is very strong.
The stock price is in a 3.5 month up move. The stock has appreciated 39.9% from its prior low. The stock price is above its 200 day moving average which is in an uptrend. The stock has just risen above its 200 day moving average.
ALERTS
Extremely important positive changes in investment behavior have recently occurred for TTM Technologies Inc (NASDAQ: TTMI): its shorter term price trend turned up, and the stock's recent price rise disrupted its longer term downtrend.
TTM Technologies Inc (NASDAQ: TTMI). Slight negative changes in fundamentals have recently occurred: significant quarterly sales deceleration occurred.
The stock is currently rated C.
TTM Technologies Inc (NASDAQ: TTMI) stock enjoyed a large increase of 3.7% on 3/27/24. The stock closed at $15.53. However, trading volume in this advance was below average at 68% of normal. The stock has been strong relative to the market over the last nine months and has risen 11.1% during the last week.
CASH FLOW
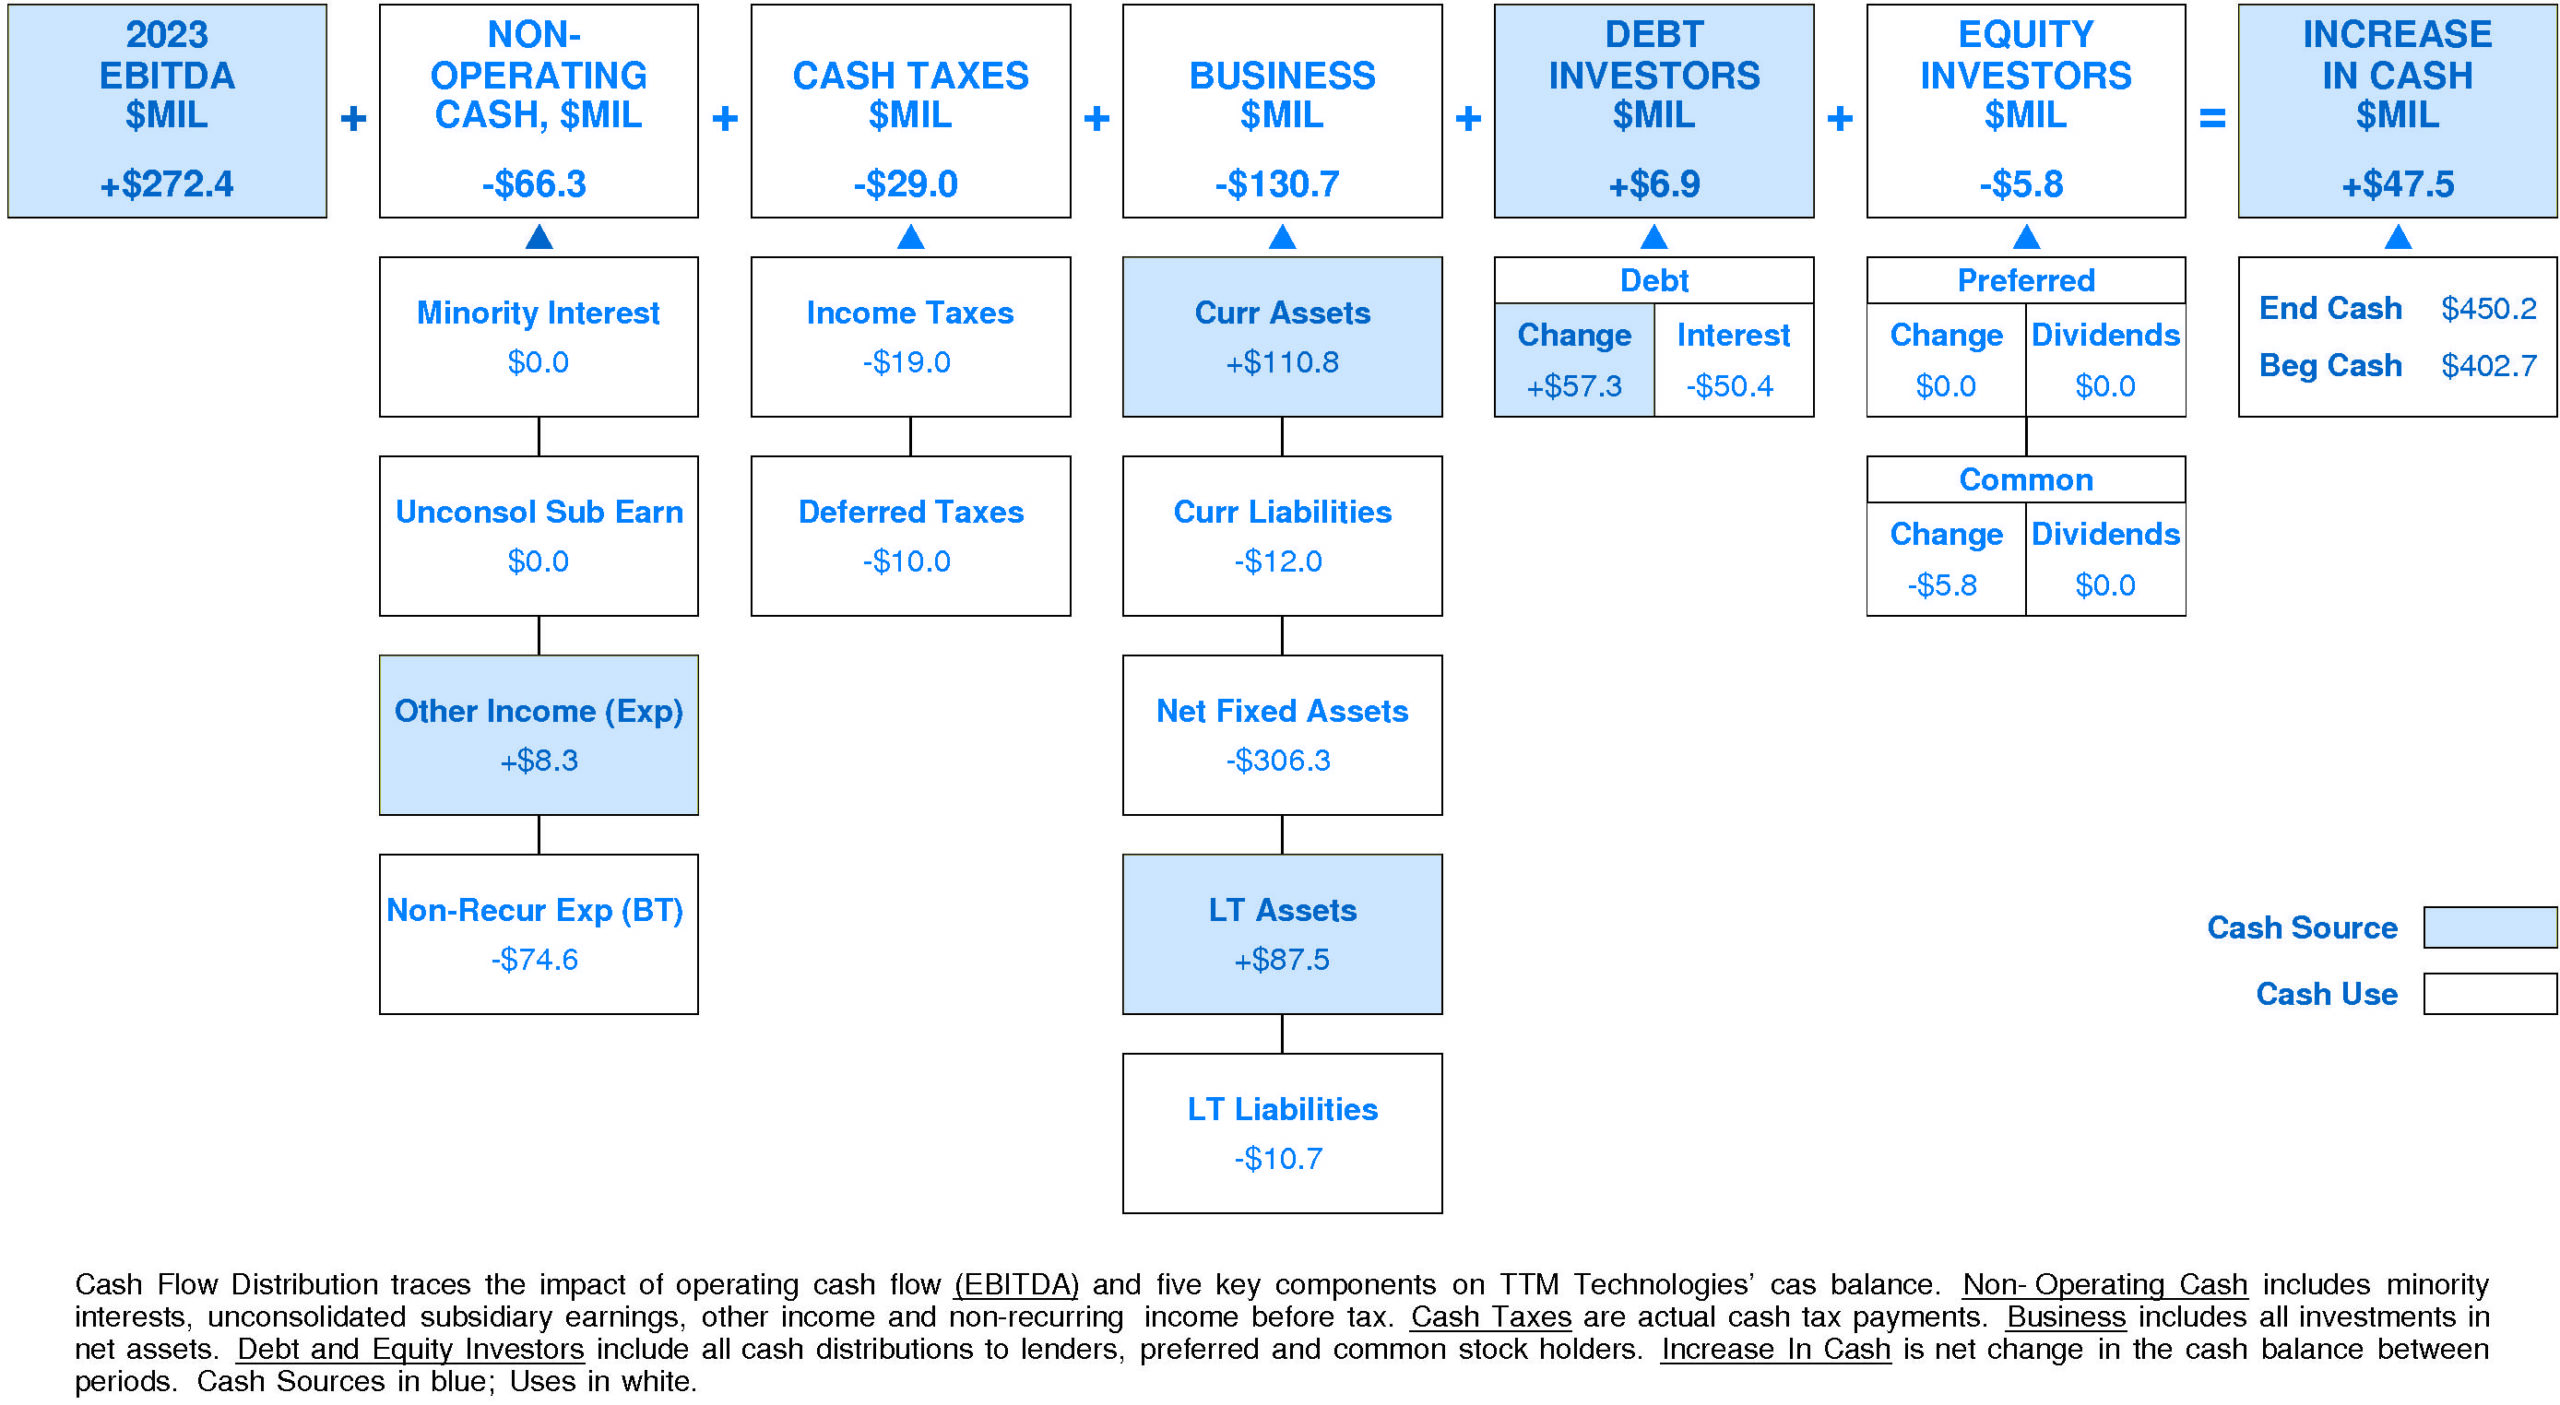
In 2023, TTM Technologies generated a significant increase in cash of +$47.5 million (+12%). Sources of cash were larger than uses.
Cash generated from 2023 EBITDA totaled +$272.4 million. Non-operating uses consumed -$66.3 million (-24% of EBITDA). Cash taxes consumed -$29.0 million (-11% of EBITDA). Re-investment in the business amounted to -$130.7 million (-48% of EBITDA). On a net basis, debt investors contributed +$6.9 million (+3% of EBITDA) while equity investors removed -$5.8 million (-2% of EBITDA).
TTM Technologies' Non-operating Income, %EBITDA has exhibited little to no overall change over the period.
This stability was accompanied by stability for the Ttm Technologies Peer Group as well. In most years, TTM Technologies was in the second quartile and lower quartile. Currently, TTM Technologies is lower quartile at -24% of EBITDA (-$66.3 million).
TTM Technologies' Cash Taxes, %EBITDA has exhibited little to no overall change over the period.
This stability was accompanied by stability for the Ttm Technologies Peer Group as well. In most years, TTM Technologies was in the second quartile and top quartile. Currently, TTM Technologies is above median at -11% of EBITDA (-$29.0 million).
TTM Technologies' Business Re-investment, %EBITDA has enjoyed a volatile overall uptrend over the period.
This improvement was accompanied by an opposite trend for the Ttm Technologies Peer Group. In most years, TTM Technologies was in the second quartile and top quartile. Currently, TTM Technologies is slightly above median at -48% of EBITDA (-$130.7 million).
TTM Technologies' Debt Investors, %EBITDA has experienced a volatile overall downtrend over the period.
This downtrend was accompanied by an opposite trend for the Ttm Technologies Peer Group. In most years, TTM Technologies was in the top quartile and lower quartile. Currently, TTM Technologies is substantially above median at +3% of EBITDA (+$6.9 million).
TTM Technologies' Equity Investors, %EBITDA has experienced a downtrend over the period.
This downtrend was accompanied by a similar trend for the Ttm Technologies Peer Group. (Since 2021 Equity Investors, %EBITDA has experienced a very sharp recovery.) In most years, TTM Technologies was in the top quartile and second quartile. Currently, TTM Technologies is below median at -2% of EBITDA (-$5.8 million).
TTM Technologies' Change in Cash, %EBITDA has experienced a volatile overall uptrend over the period.
This improvement was accompanied by a similar trend for the Ttm Technologies Peer Group. In most years, TTM Technologies was in the top quartile and lower quartile. Currently, TTM Technologies is at the upper quartile at +17% of EBITDA (+$47.5 million).
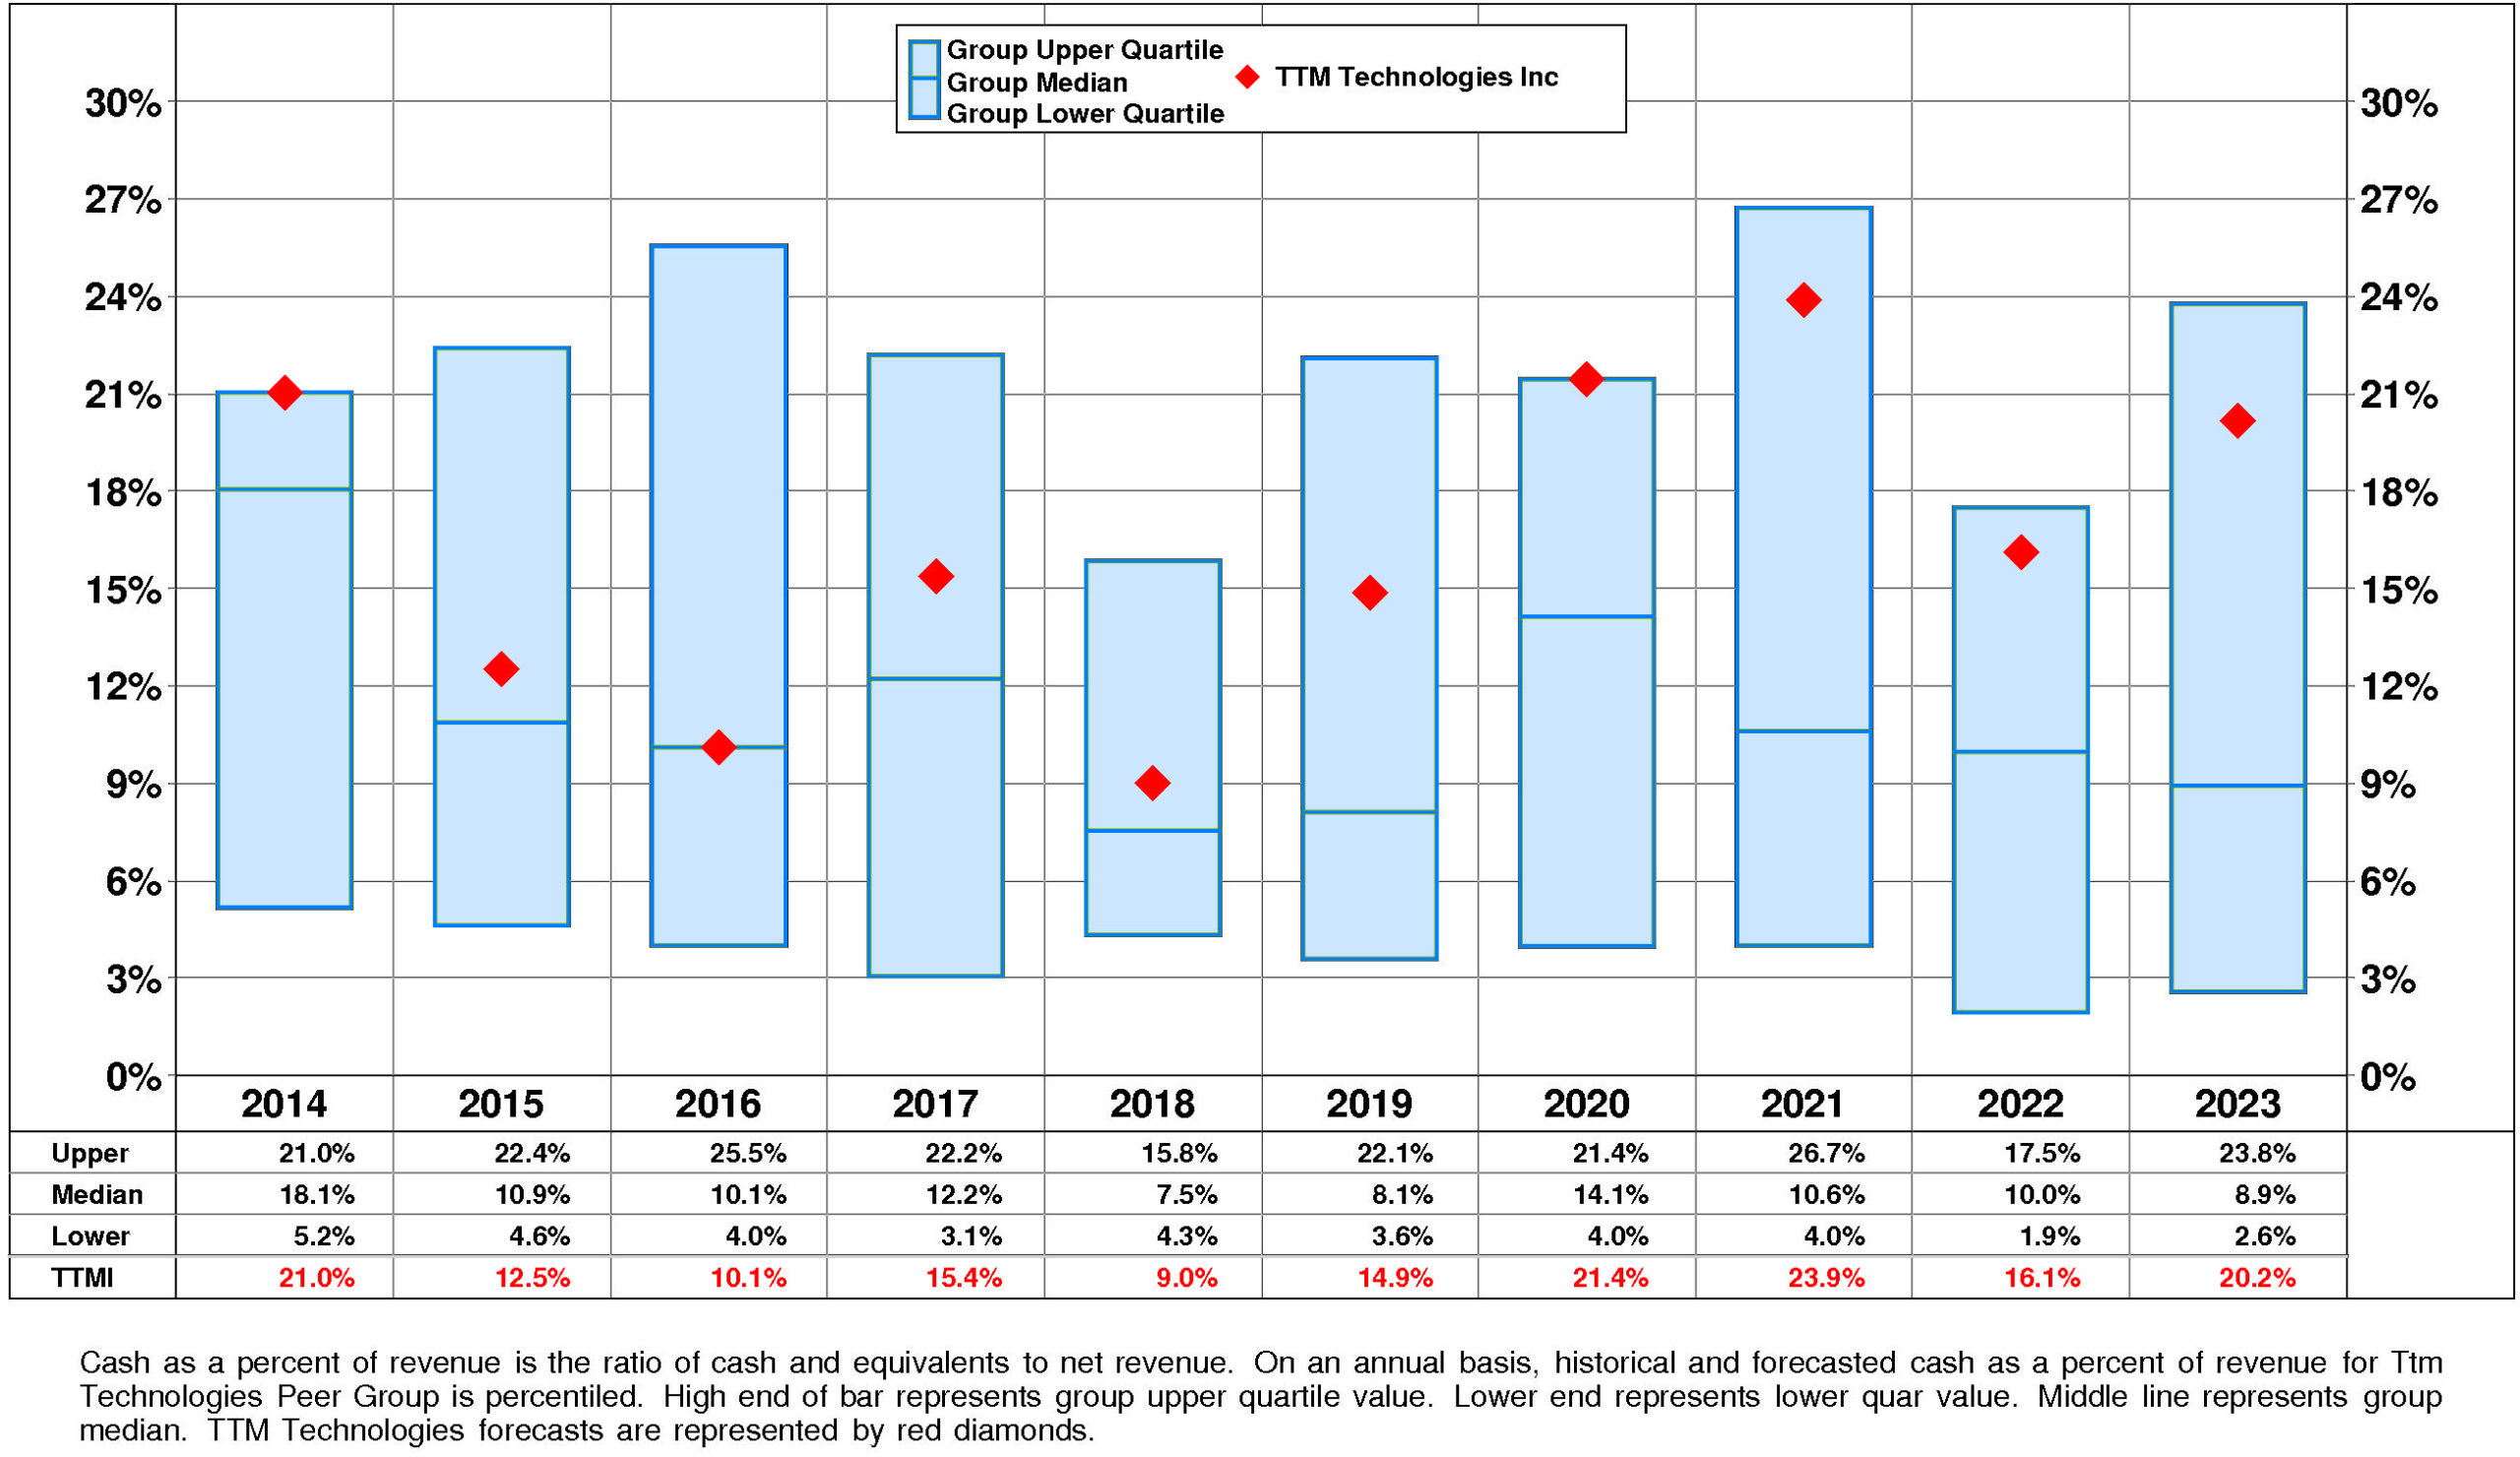
TTM Technologies' Cash, %Revenue has exhibited a volatile overall uptrend over the period.
This improvement was accompanied by stability for the Ttm Technologies Peer Group. In most years, TTM Technologies was in the second quartile. Currently, TTM Technologies is substantially above median at +20%.
PROFITABILITY
TTM Technologies' return on equity has eroded very significantly since 2014. The current level is -1.2% versus the high of 2.1% and the low of -3.2%.
The key to the story for TTMI is a very strong negative trend in pretax operating return significantly augmented by a very strong negative trend in non-operating factors.
The productivity of TTM Technologies' assets declined over the full period 2014-2023: asset turnover has suffered a strong overall downtrend.
Reinforcing this trend, pretax margin experienced a strong overall downtrend even as it experienced a very sharp recovery after the 2020 low.
Non-operating factors (income taxes and financial leverage) had a significant negative influence on return on equity.
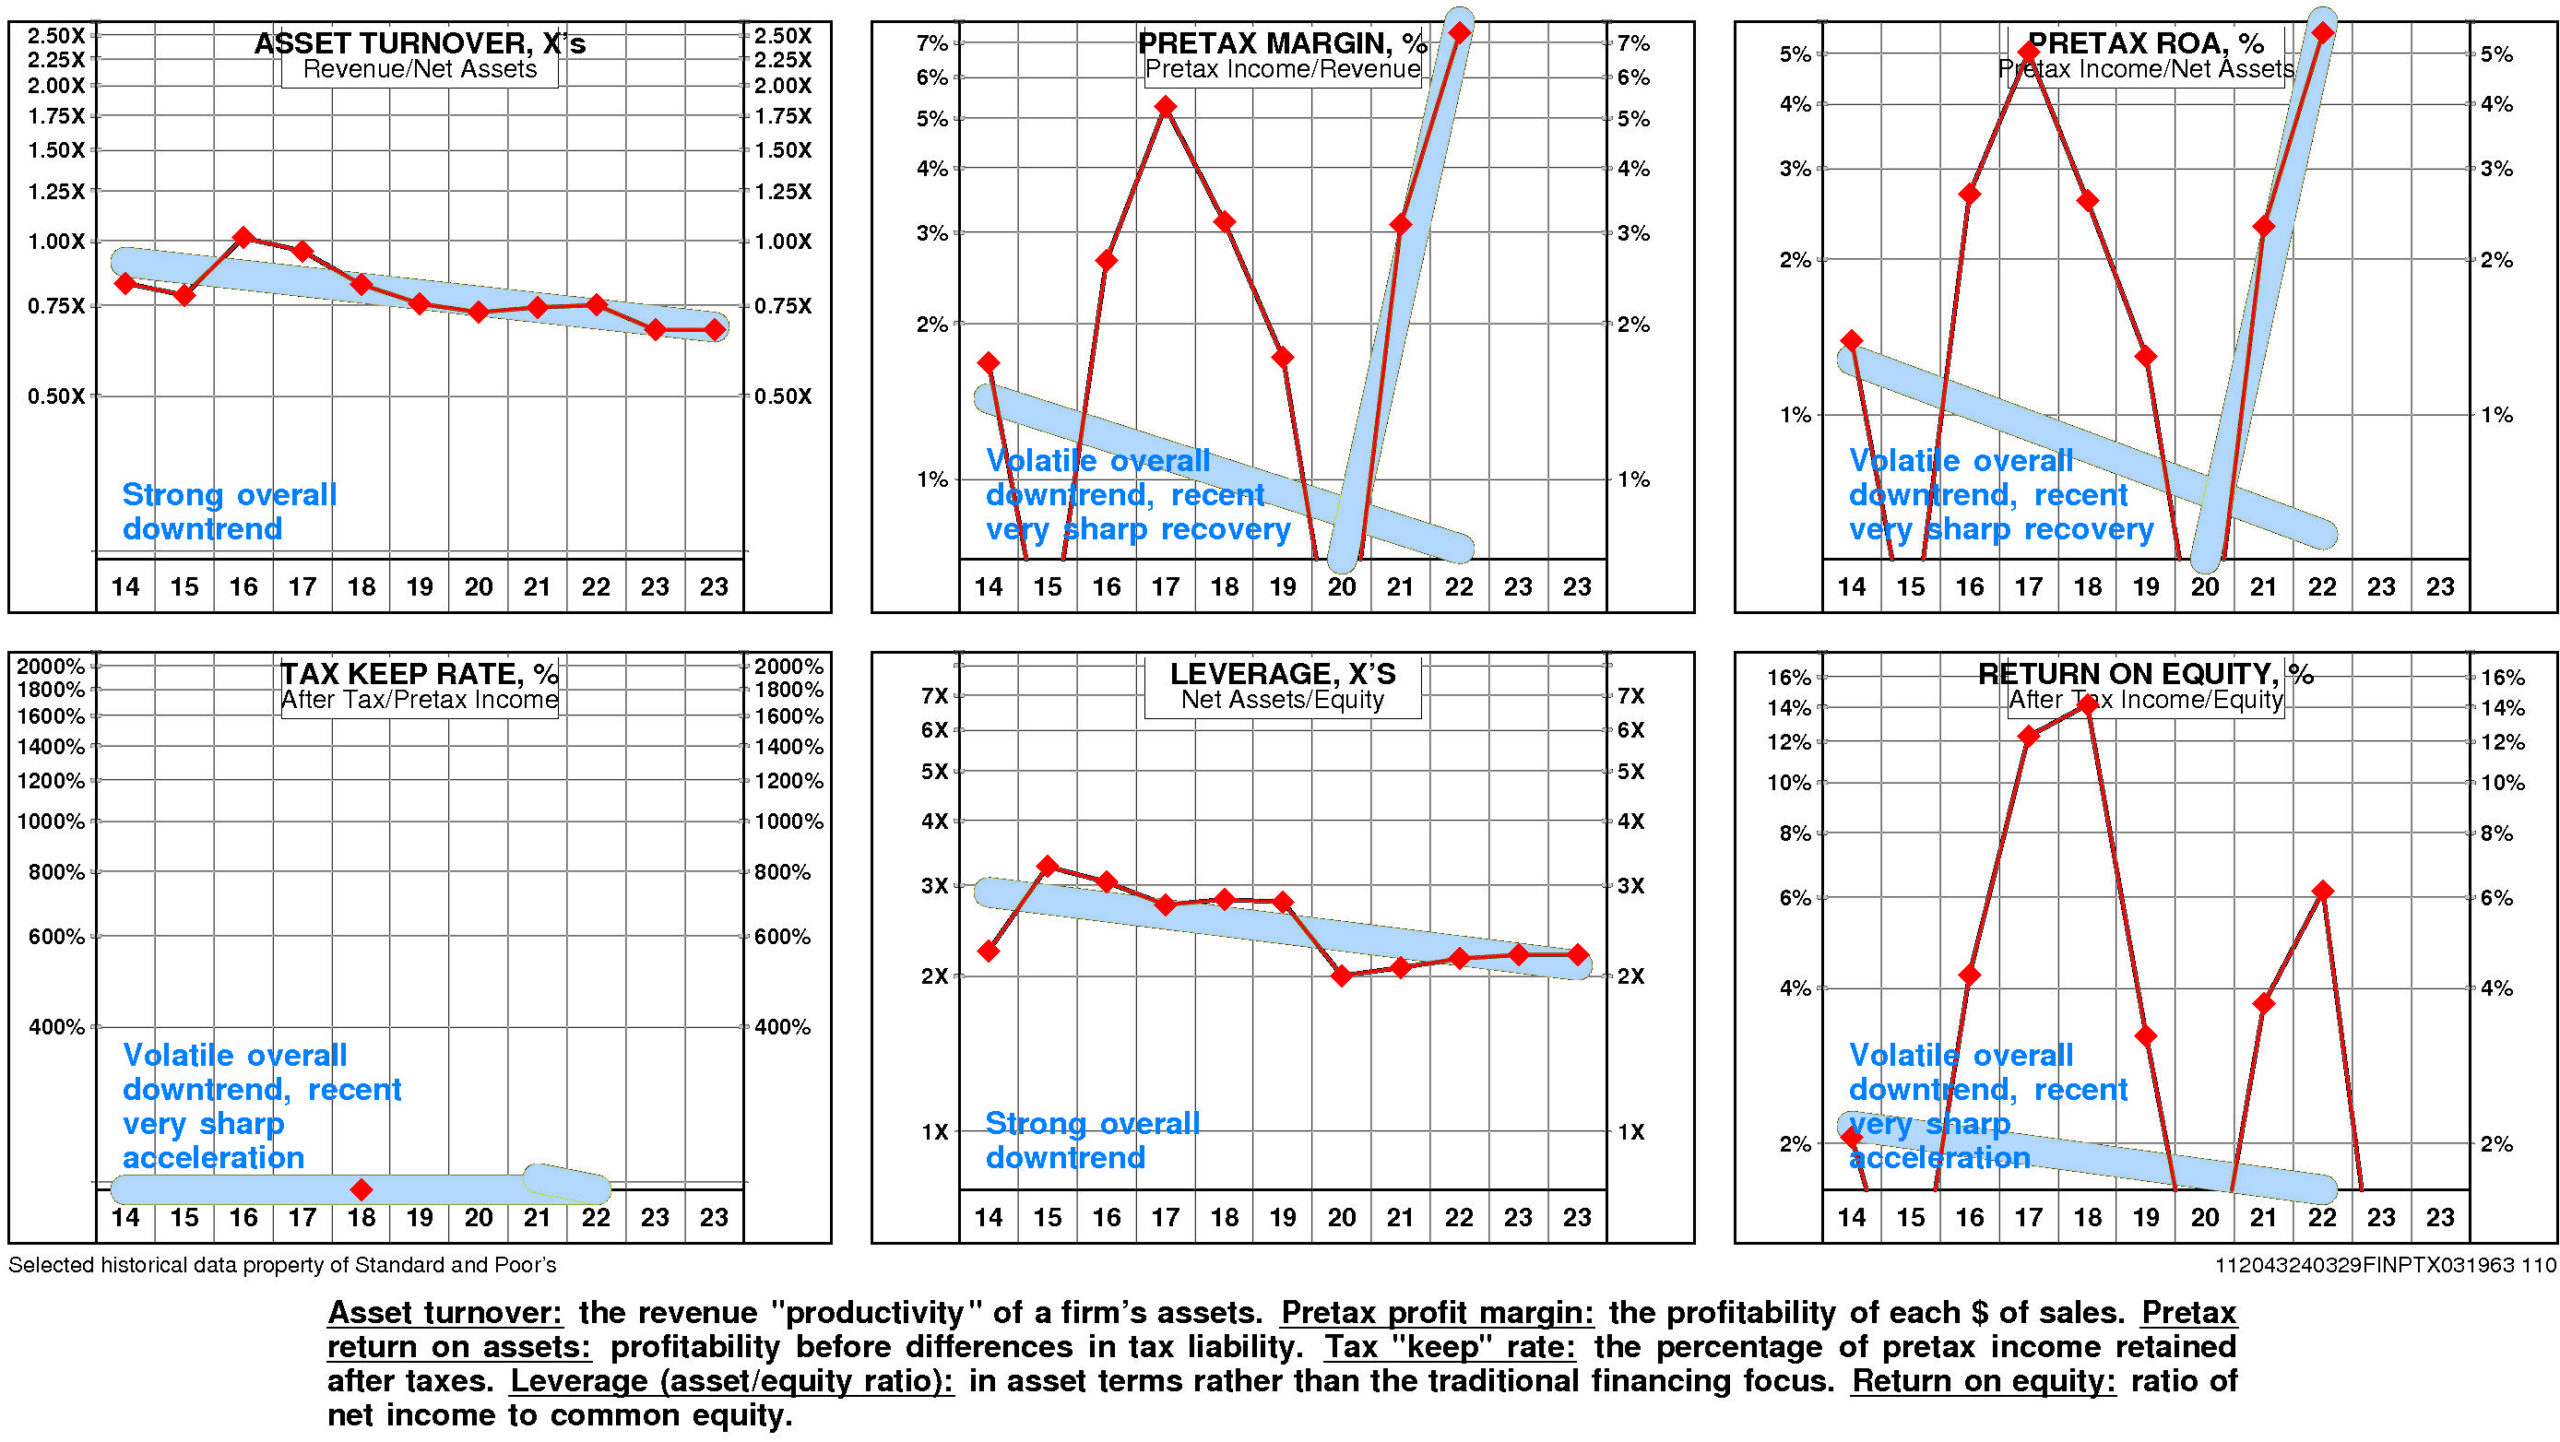
TTM Technologies' return on equity is lower quartile (-1.2%) for the four quarters ended December, 2023.
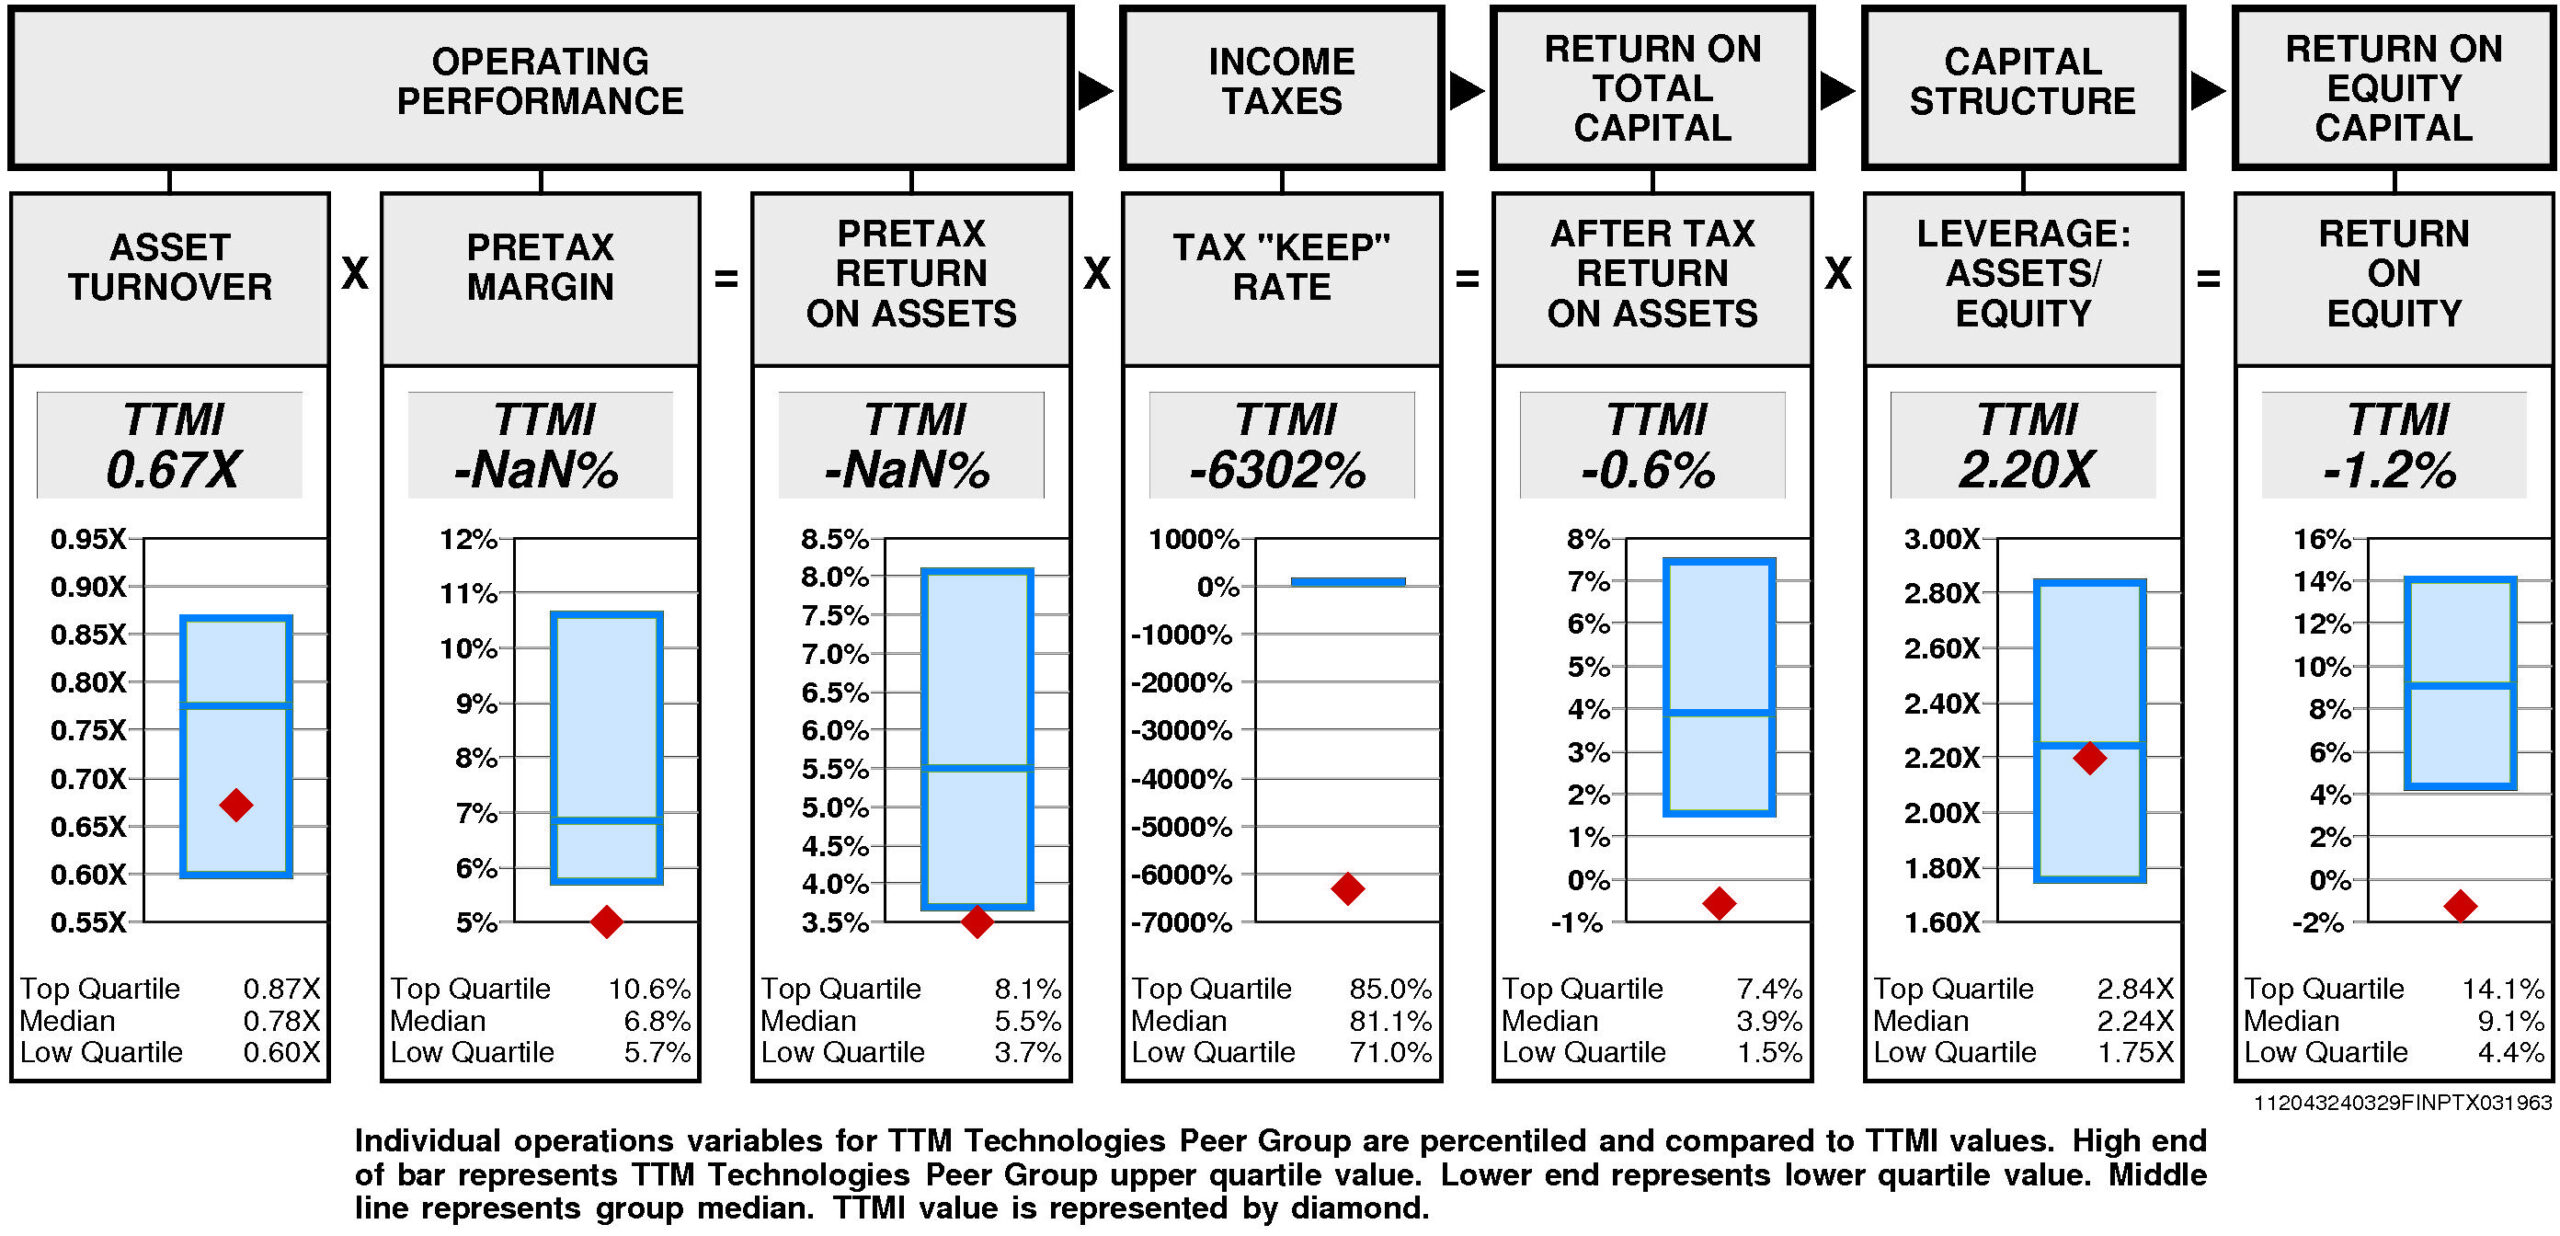
Operating performance (pretax return on assets) is unavailable reflecting asset turnover that is below median (0.67X) and unavailable pretax margin .
Tax “keep” rate (income tax management) is lower quartile (-6302%) resulting in after tax return on assets that is lower quartile.
Financial leverage (leverage) is at median (2.20X).
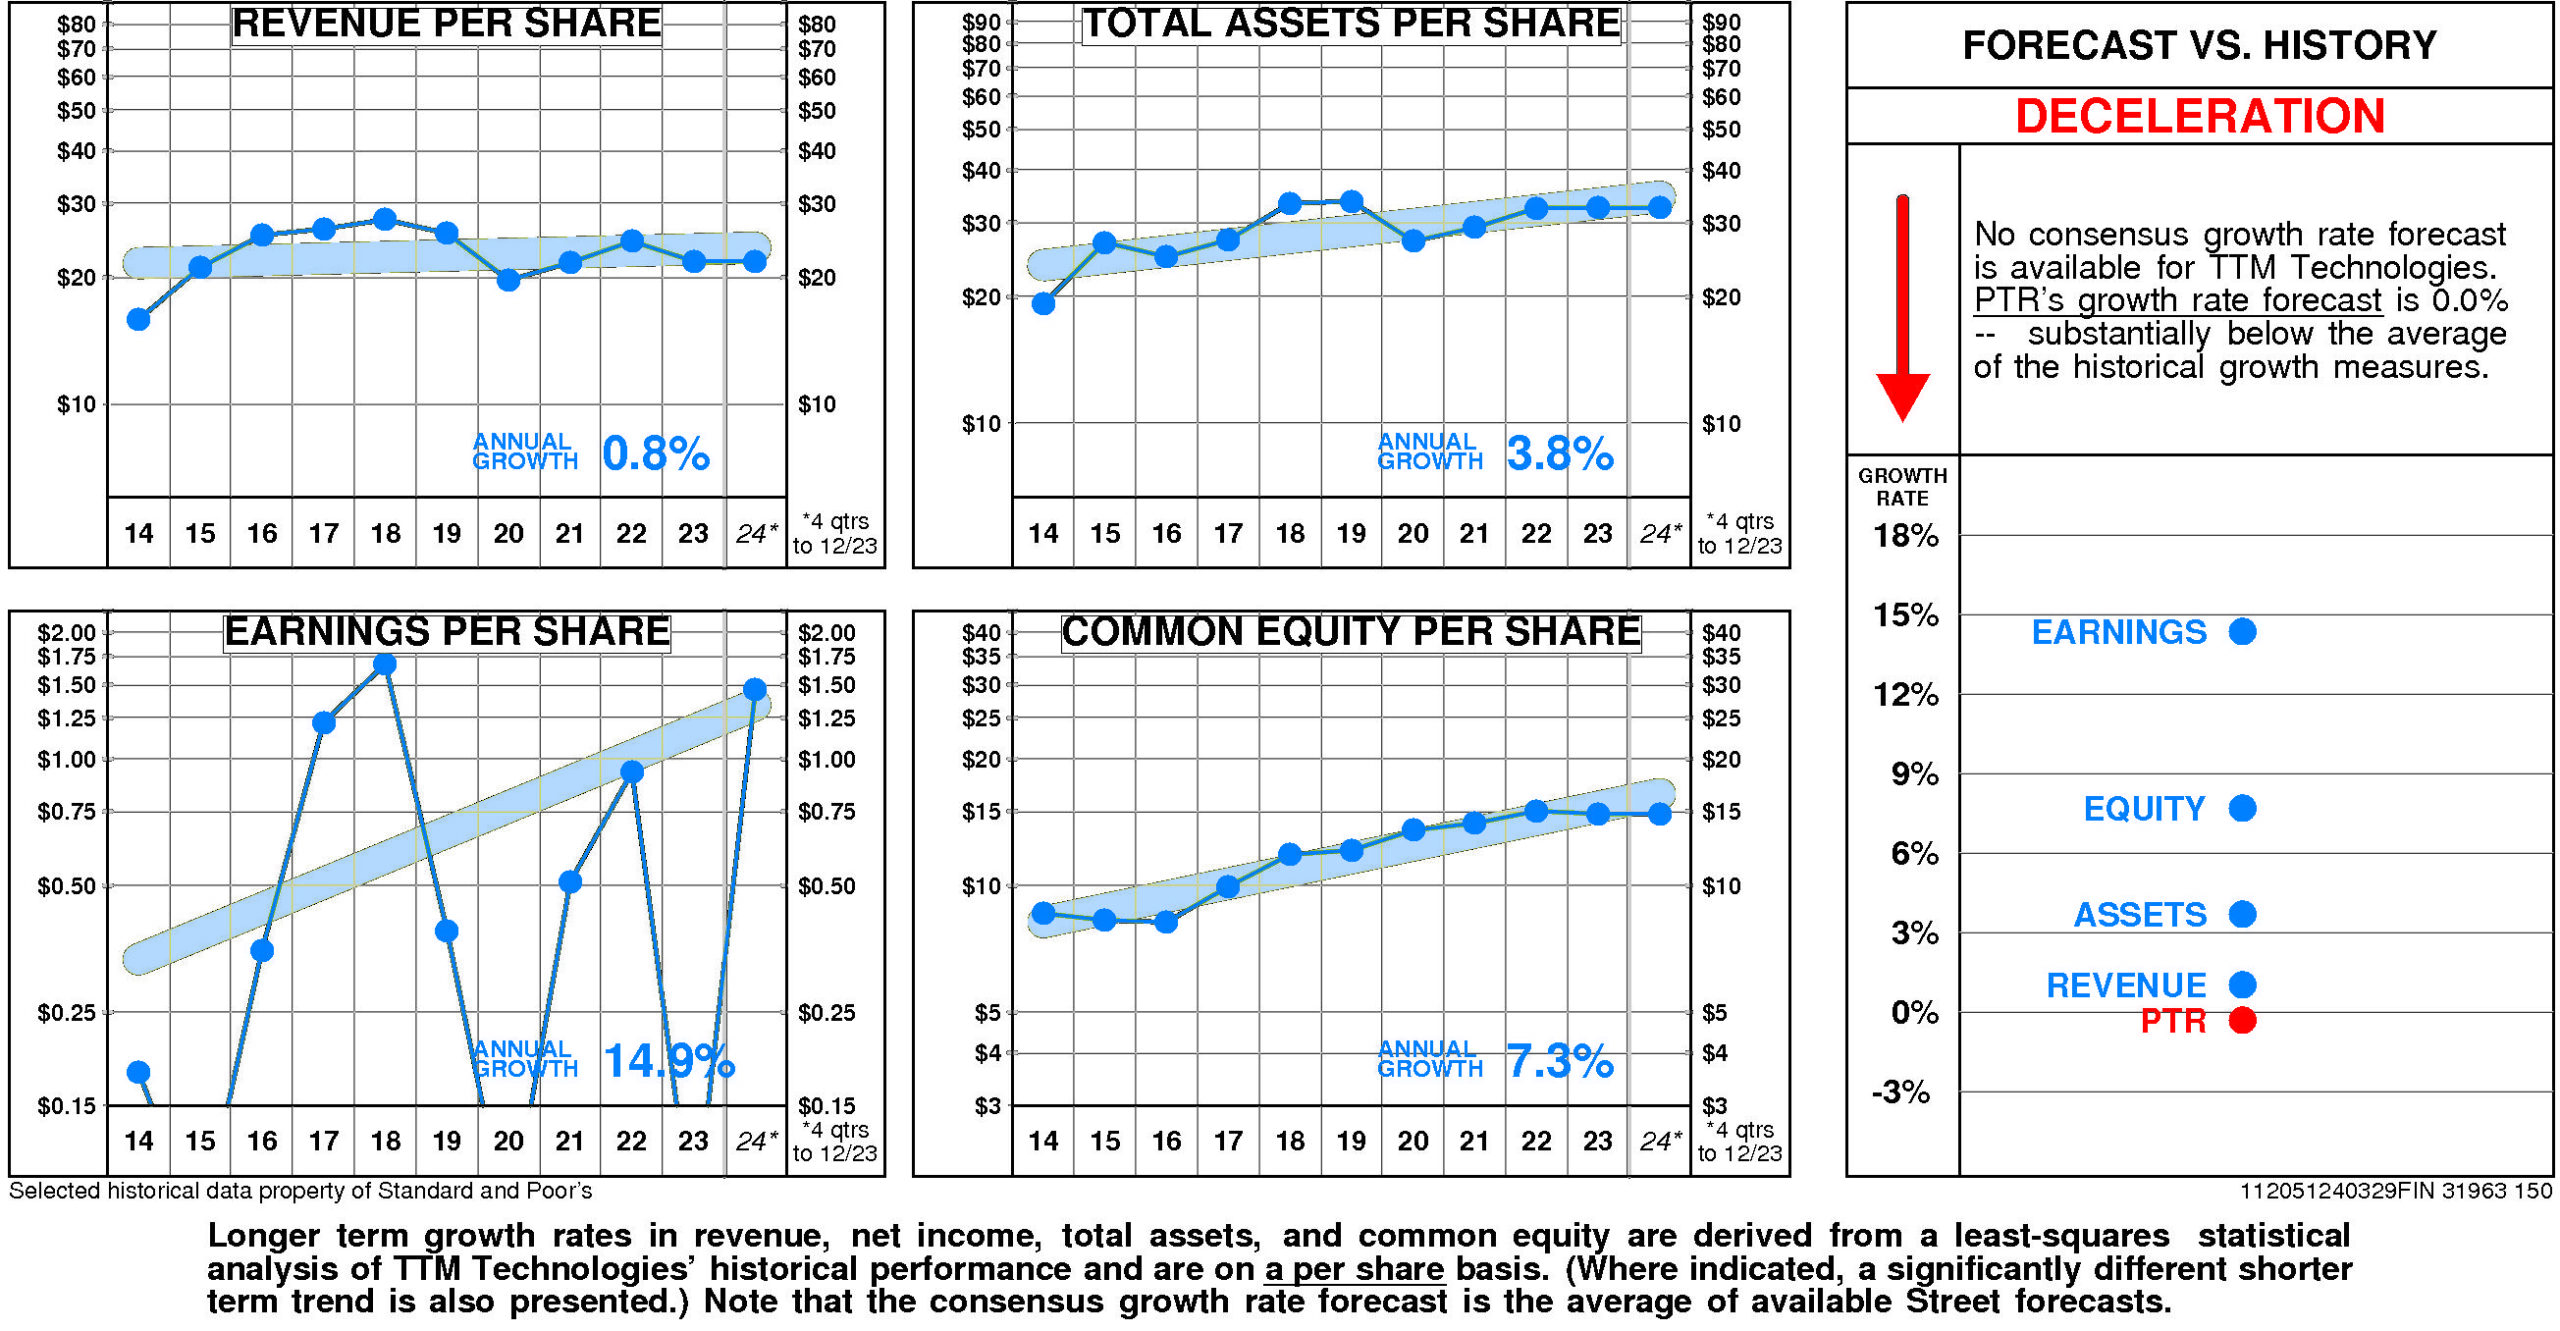
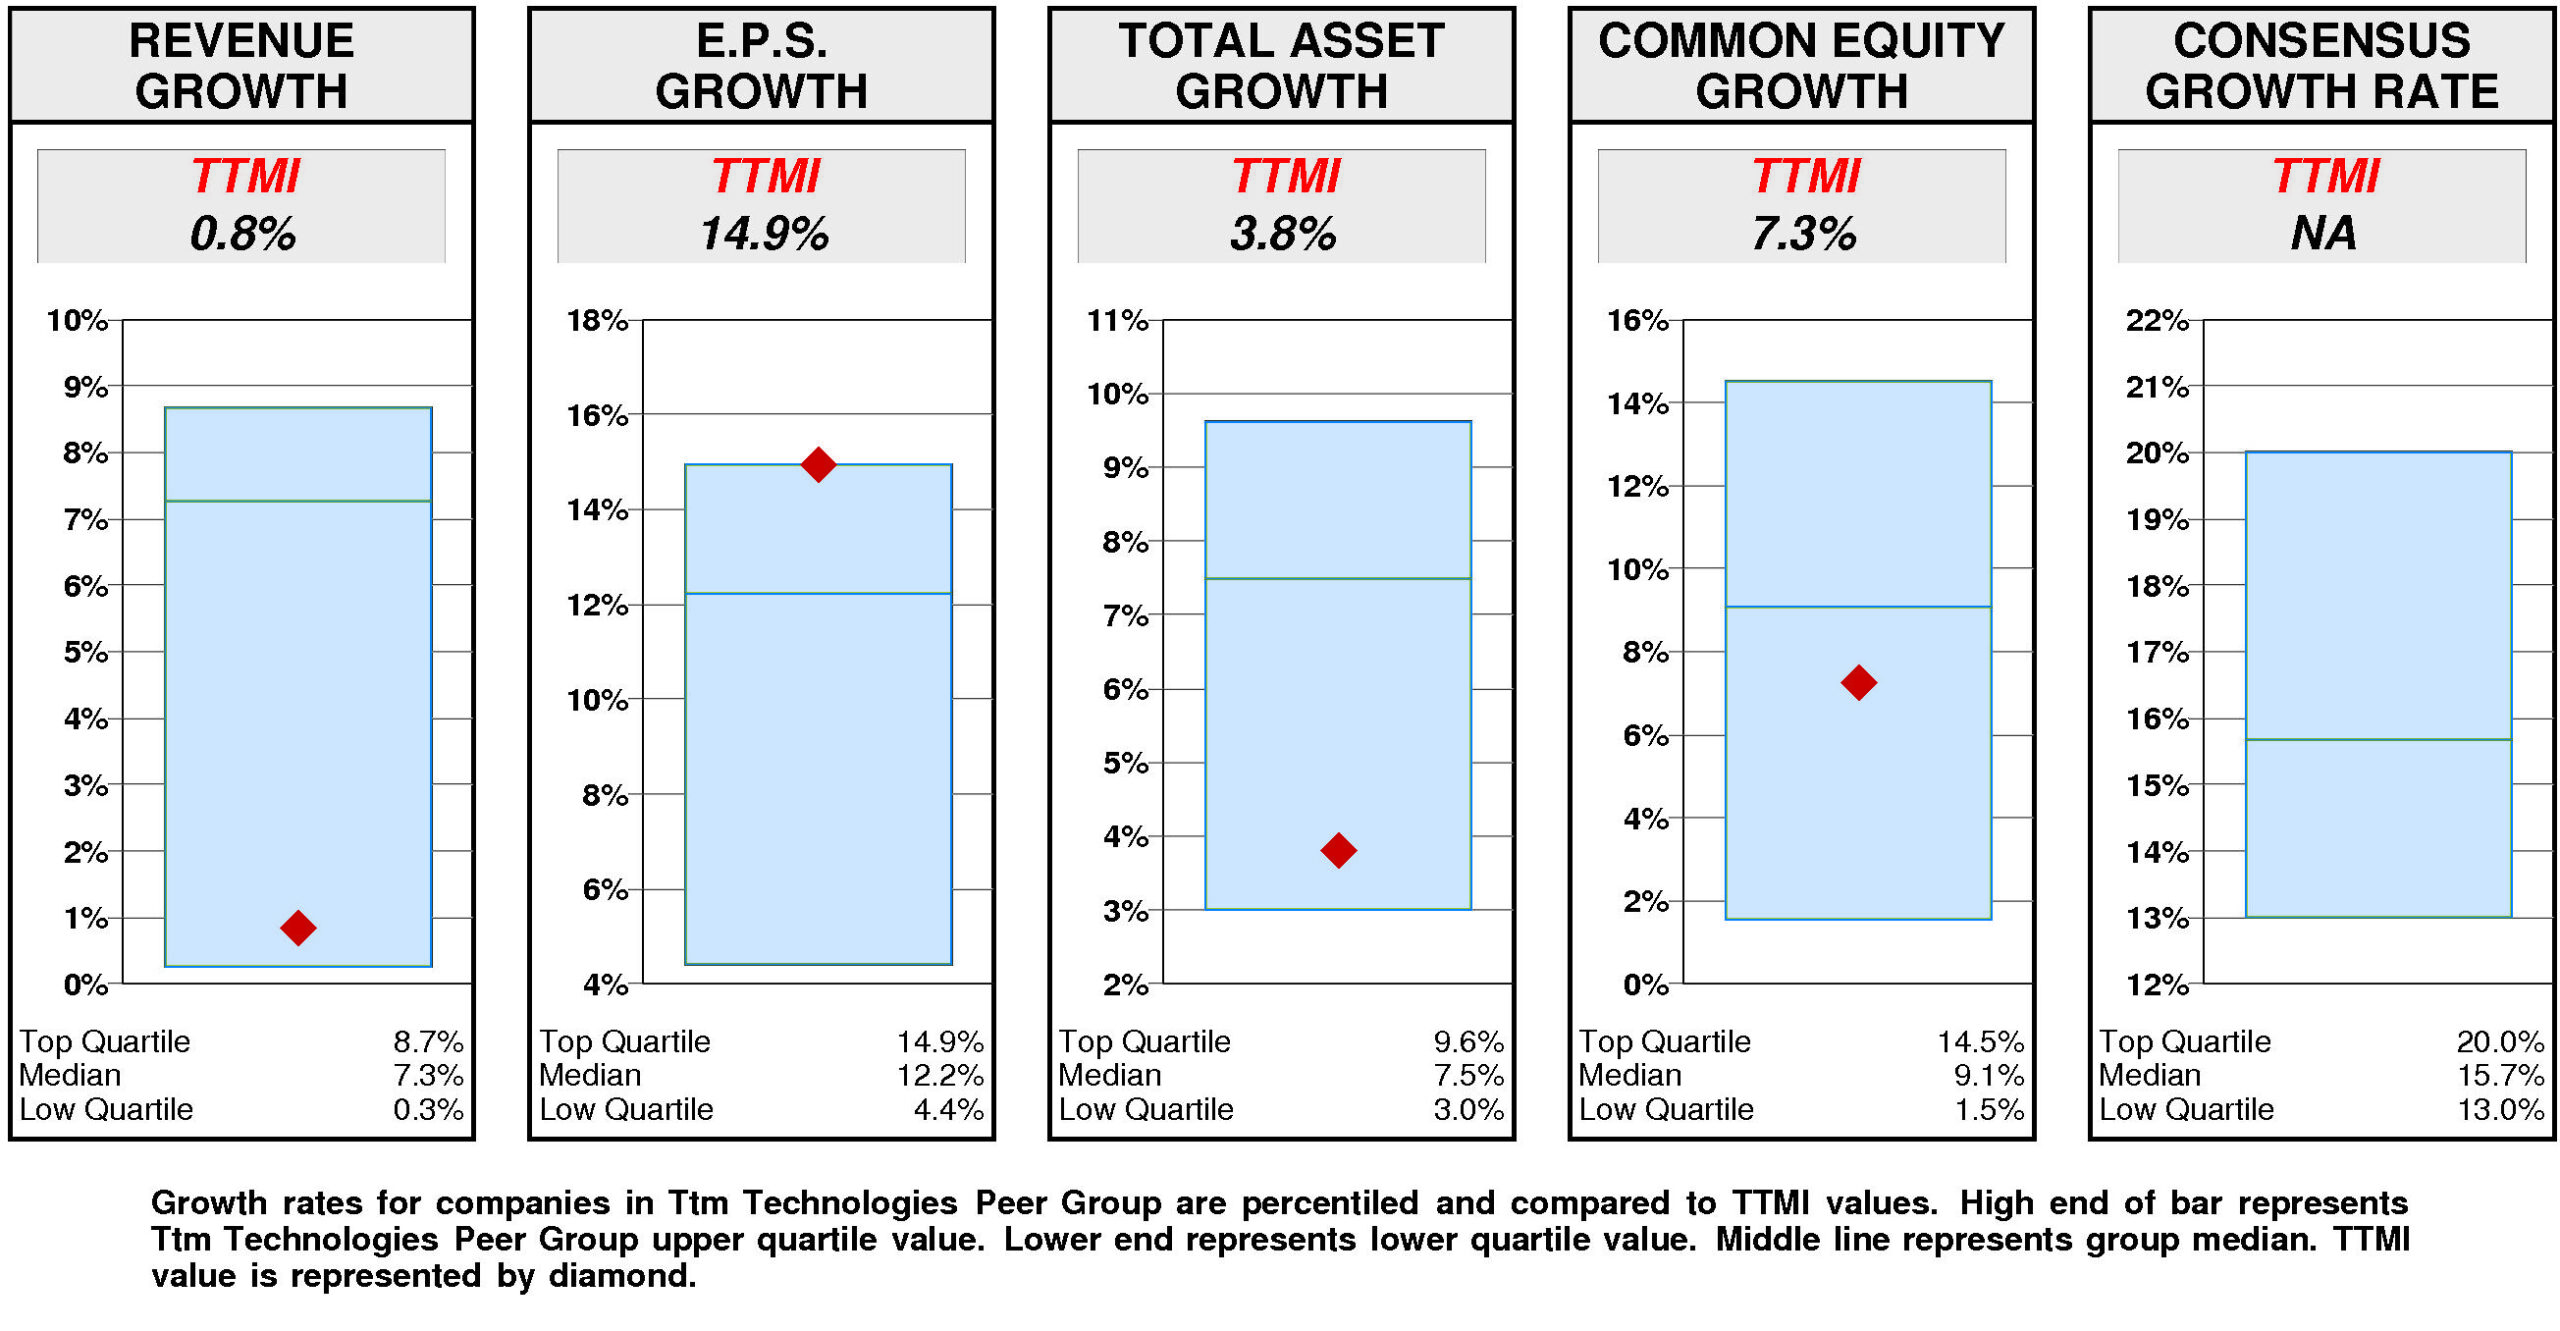
GROWTH RATES
There are no significant differences between TTM Technologies' longer term growth and growth in recent years.
TTM Technologies' historical income statement growth and balance sheet growth have diverged. Revenue growth has paralleled asset growth; earnings growth has exceeded equity growth.
Annual revenue growth
has been 0.8% per year.
Total asset growth
has been 3.8% per year.
Annual E.P.S. growth
has been 14.9% per year.
Equity growth
has been 7.3% per year.
No consensus growth rate forecast is available for TTM Technologies.
Relative to the Ttm Technologies Peer Group, TTM Technologies' historical growth measures are generally third quartile.
E.P.S. growth (14.9%) has been at the upper quartile. Total asset growth (3.8%) has been substantially below median. Revenue growth (0.8%) has been substantially below median. Equity growth (7.3%) has been slightly below median.
Consensus growth forecast is unavailable.
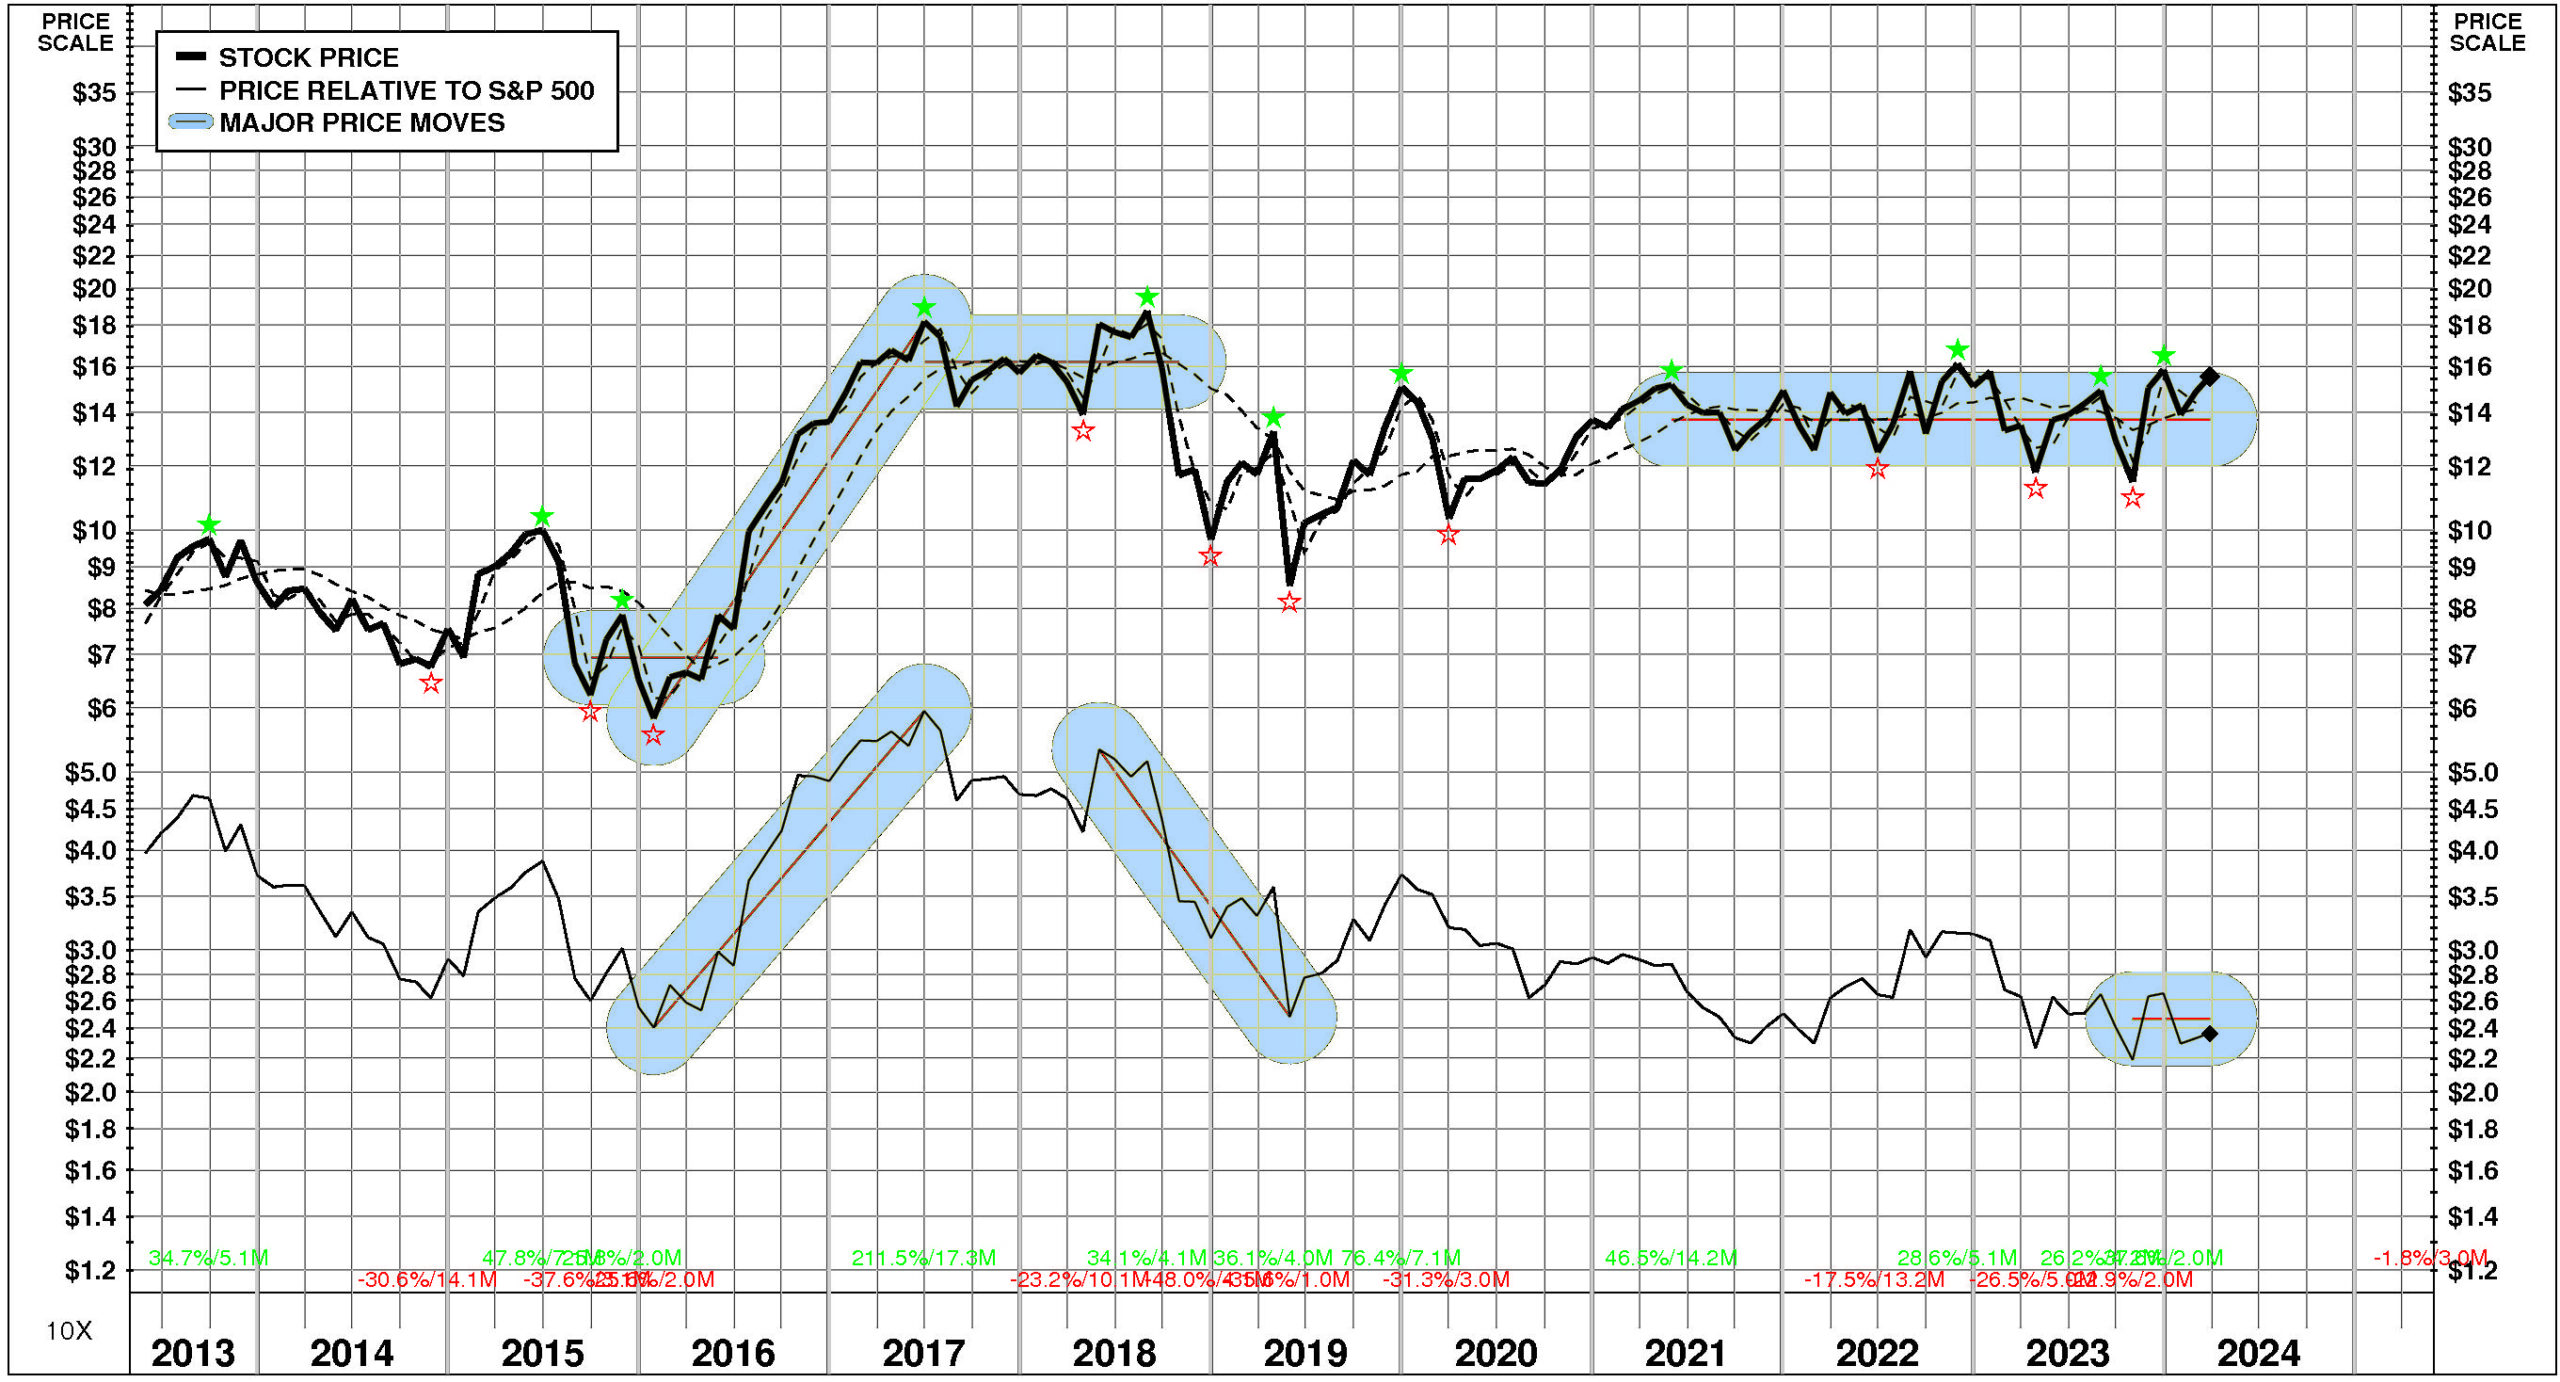
PRICE HISTORY
Over the full time period, TTM Technologies' stock price performance has been volatile and below market.
Between May, 2013 and March, 2024, TTM Technologies' stock price rose +92%; relative to the market, this was a -40% loss. Significant price move during the period: 1) January, 2016 – June, 2017: +211%.
TOTAL INVESTMENT RETURNS
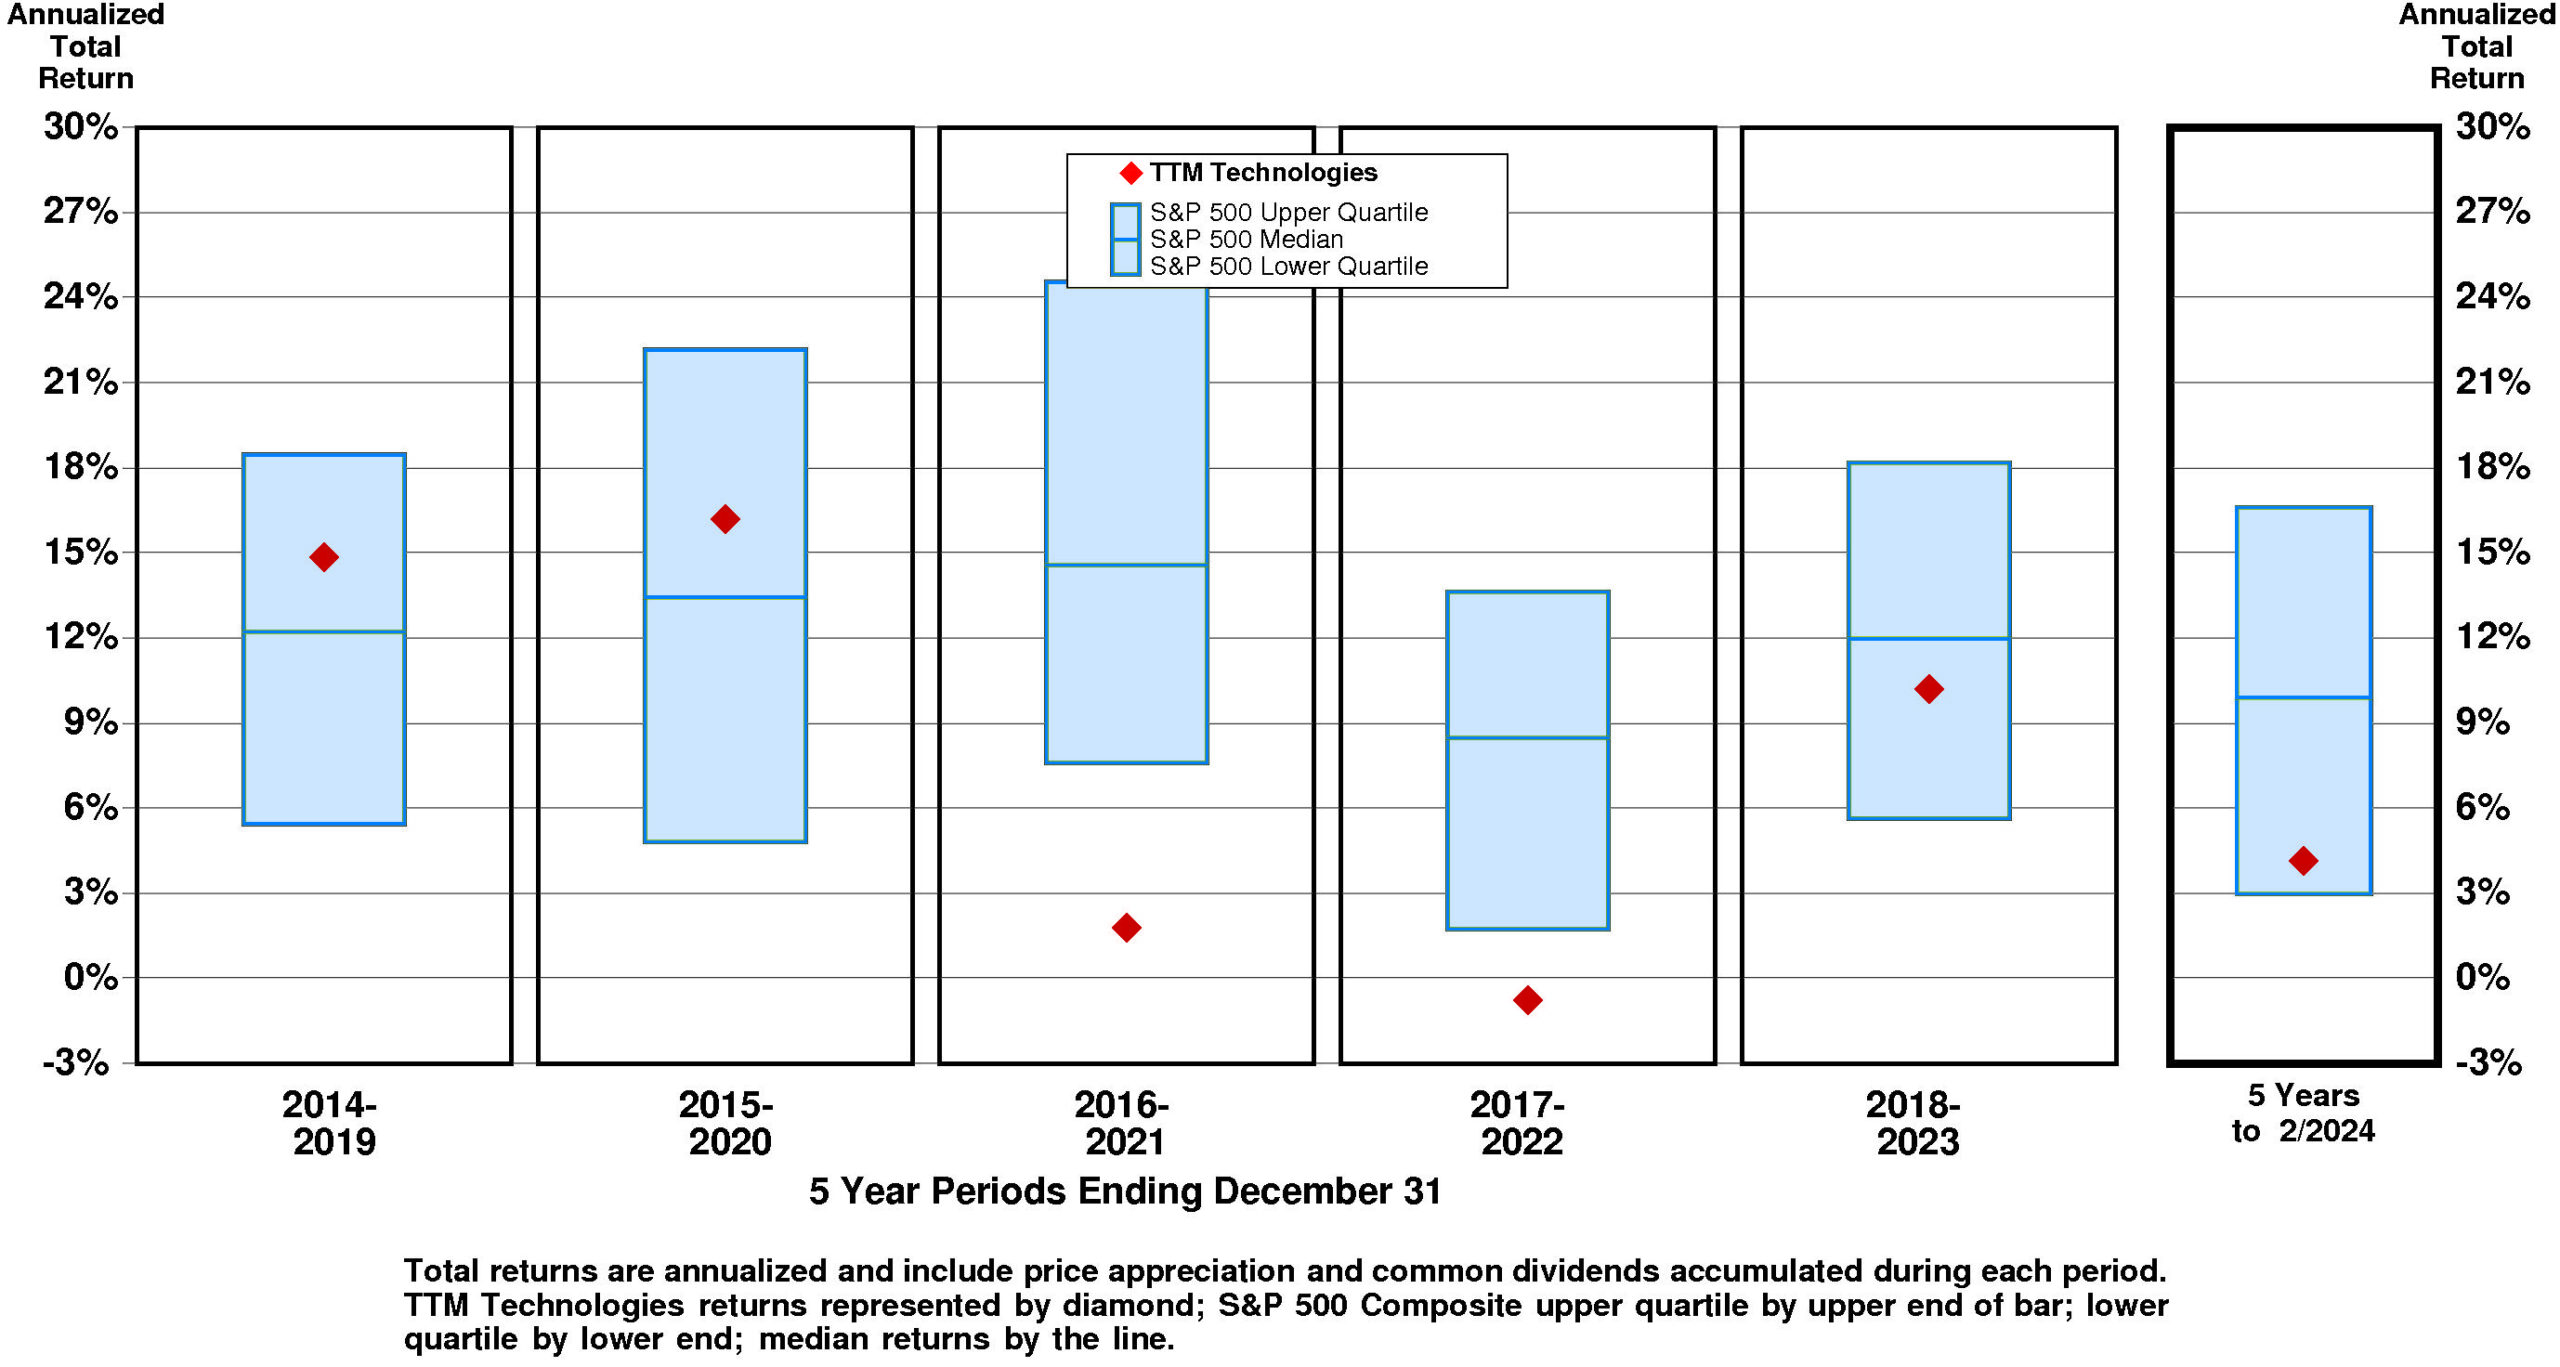
Current annual total return performance of 11.7% is slightly above median relative to the S&P 500 Composite.
In addition to being slightly above median relative to S&P 500 Composite, current annual total return performance through February, 2024 of 11.7% is slightly below median relative to TTM Technologies Inc Peer Group.
Current 5-year total return performance of 4.1% is substantially below median relative to the S&P 500 Composite.
Through February, 2024, with substantially below median current 5-year total return of 4.1% relative to S&P 500 Composite, TTM Technologies' total return performance is below median relative to TTM Technologies Inc Peer Group.
VALUATION BENCHMARKS
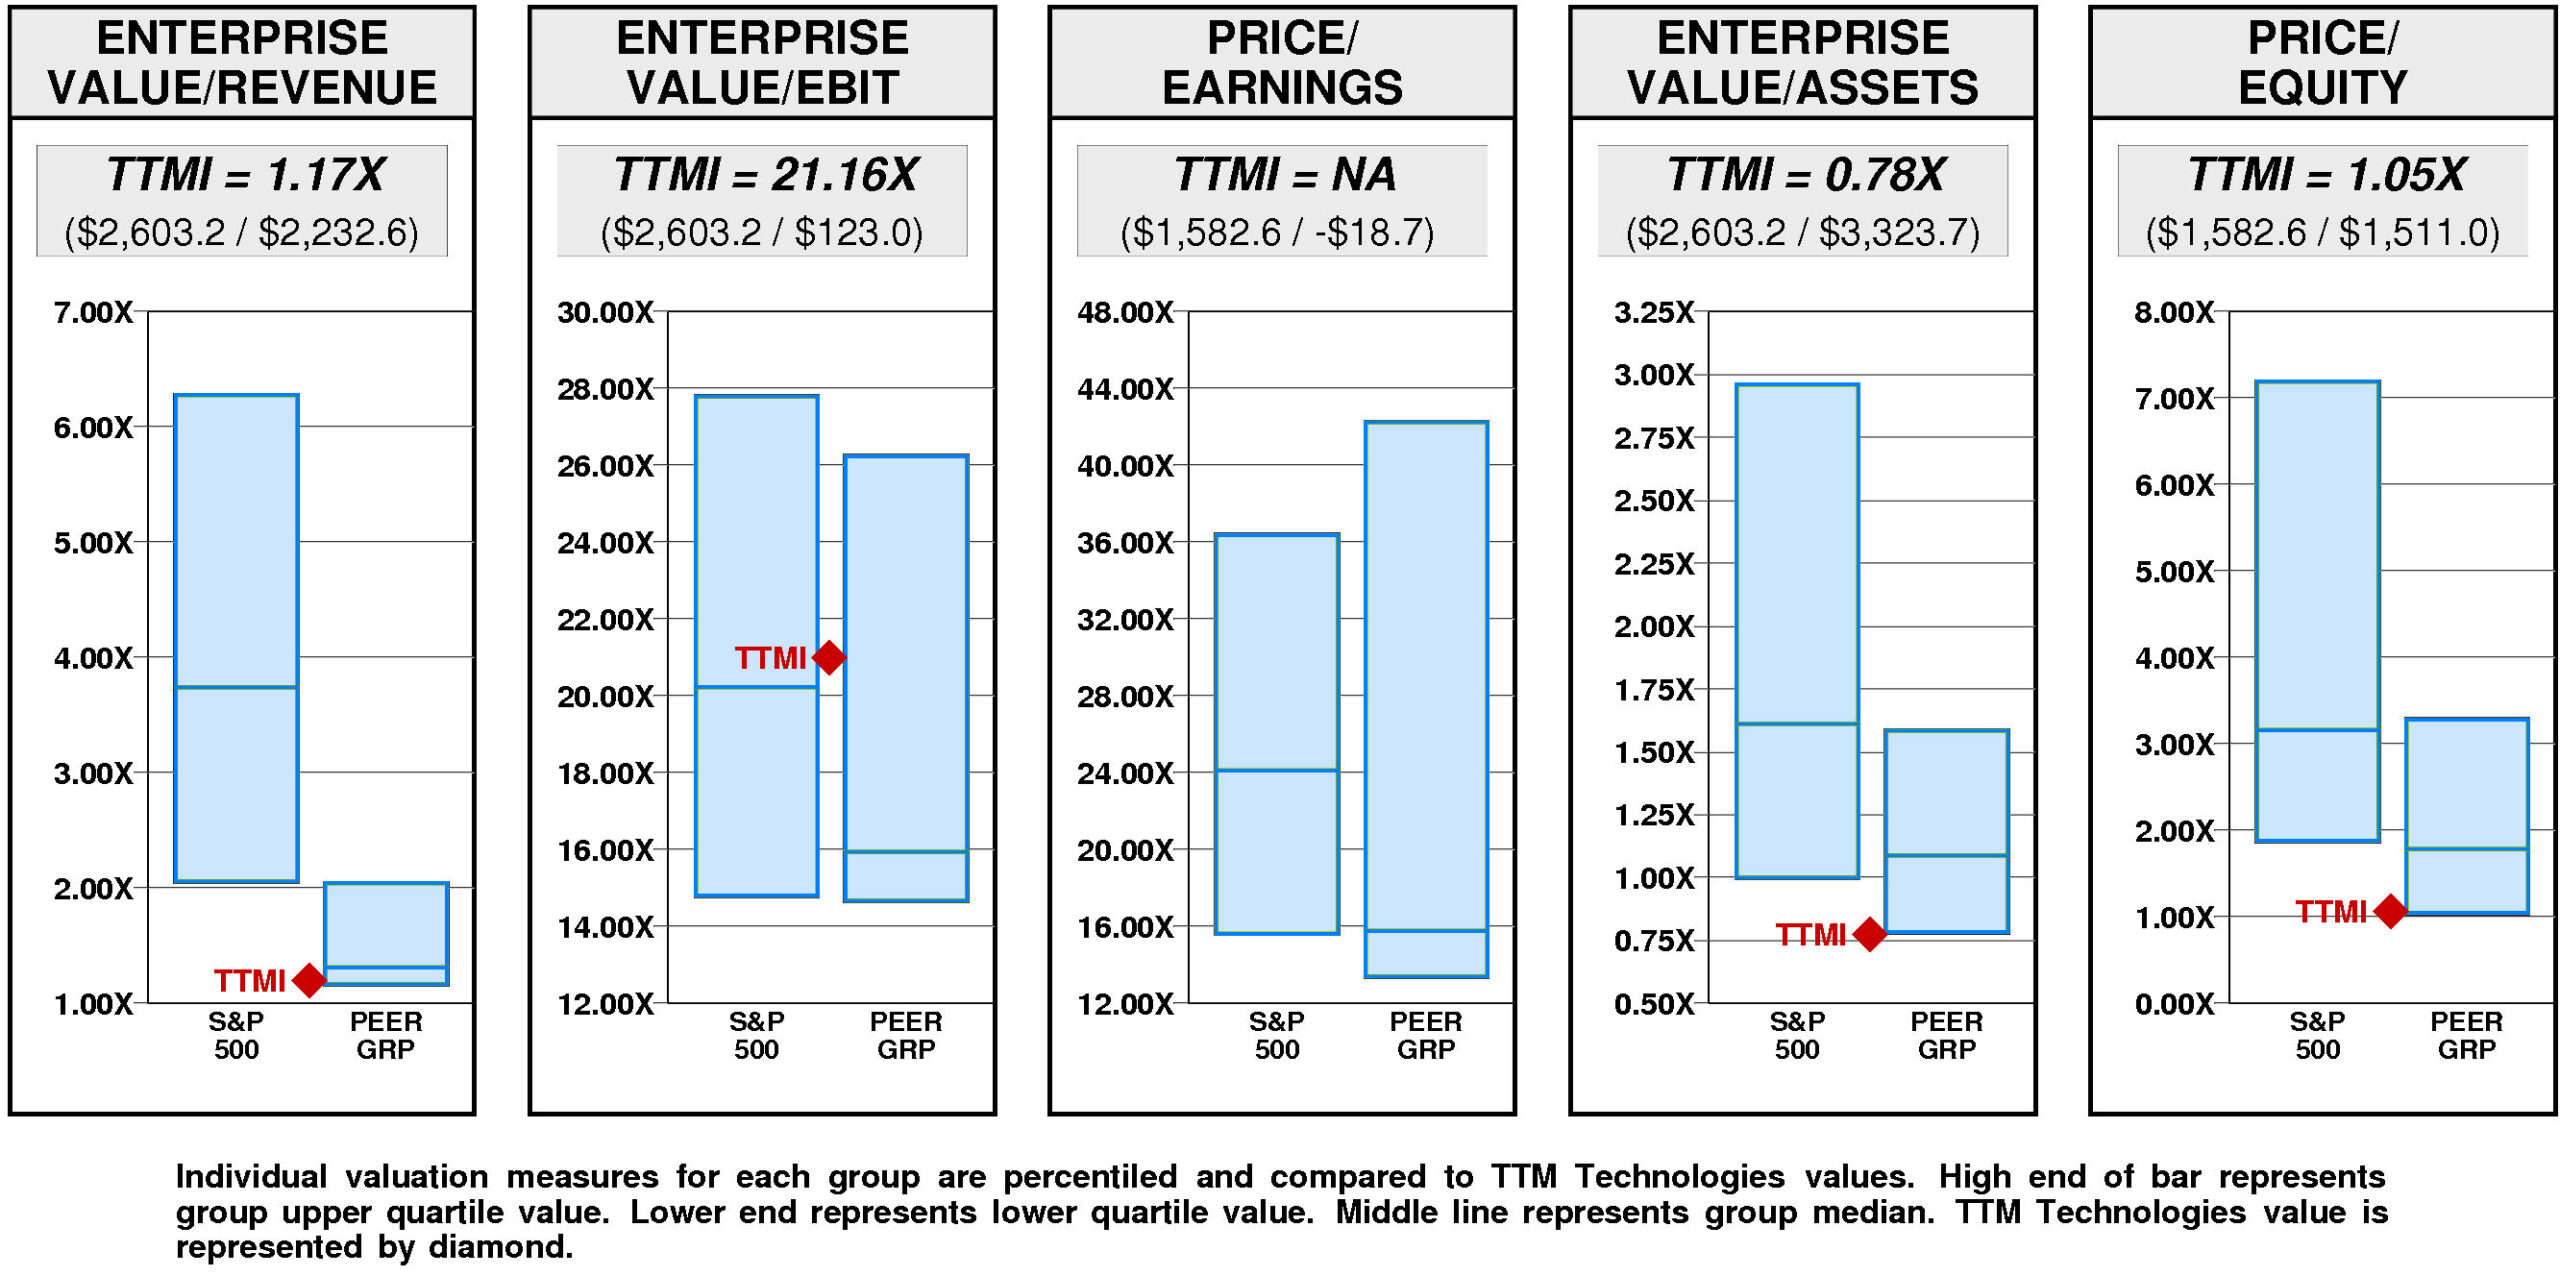
Relative to S&P 500 Composite, TTMI's overall valuation is quite low.
Ratio of enterprise value/earnings before interest and taxes is slightly above median. Ratio of enterprise value/assets is lower quartile. Price/equity ratio is lower quartile. Ratio of enterprise value/revenue is lower quartile. Price/earnings ratio is unavailable.
Relative to TTM Technologies Peer Group, TTMI's overall valuation is low.
Ratio of enterprise value/earnings before interest and taxes is above median. Ratio of enterprise value/revenue is at the lower quartile. Ratio of enterprise value/assets is at the lower quartile. Price/equity ratio is at the lower quartile. Price/earnings ratio is unavailable.
TTM Technologies has a very large value gap compared to the median.
For TTMI to hit median valuation, its current ratio of enterprise value/revenue would have to rise from the current level of 1.17X to 1.31X. If TTMI's ratio of enterprise value/revenue were to rise to 1.31X, its stock price would be higher by $3 to $19.
For TTMI to achieve upper quartile valuation relative to the TTM Technologies Peer Group, its current ratio of enterprise value/revenue would have to rise from the current level of 1.17X to 2.04X. If TTMI's ratio of enterprise value/revenue were to rise to 2.04X, its stock price would increase by $19 from the current level of $16.
VALUE TARGETS
With future capital returns forecasted to be above the cost of capital, TTMI is expected to continue to be an important Value Builder.
TTM Technologies' current Price Target of $25 represents a +62% change from the current price of $15.53.
This moderately high appreciation potential results in an appreciation score of 62 (only 38% of the universe has greater appreciation potential.)
Reinforcing this moderately high Appreciation Score of 62, the moderately high Power Rating of 64 contributes to an Value Trend Rating of C.
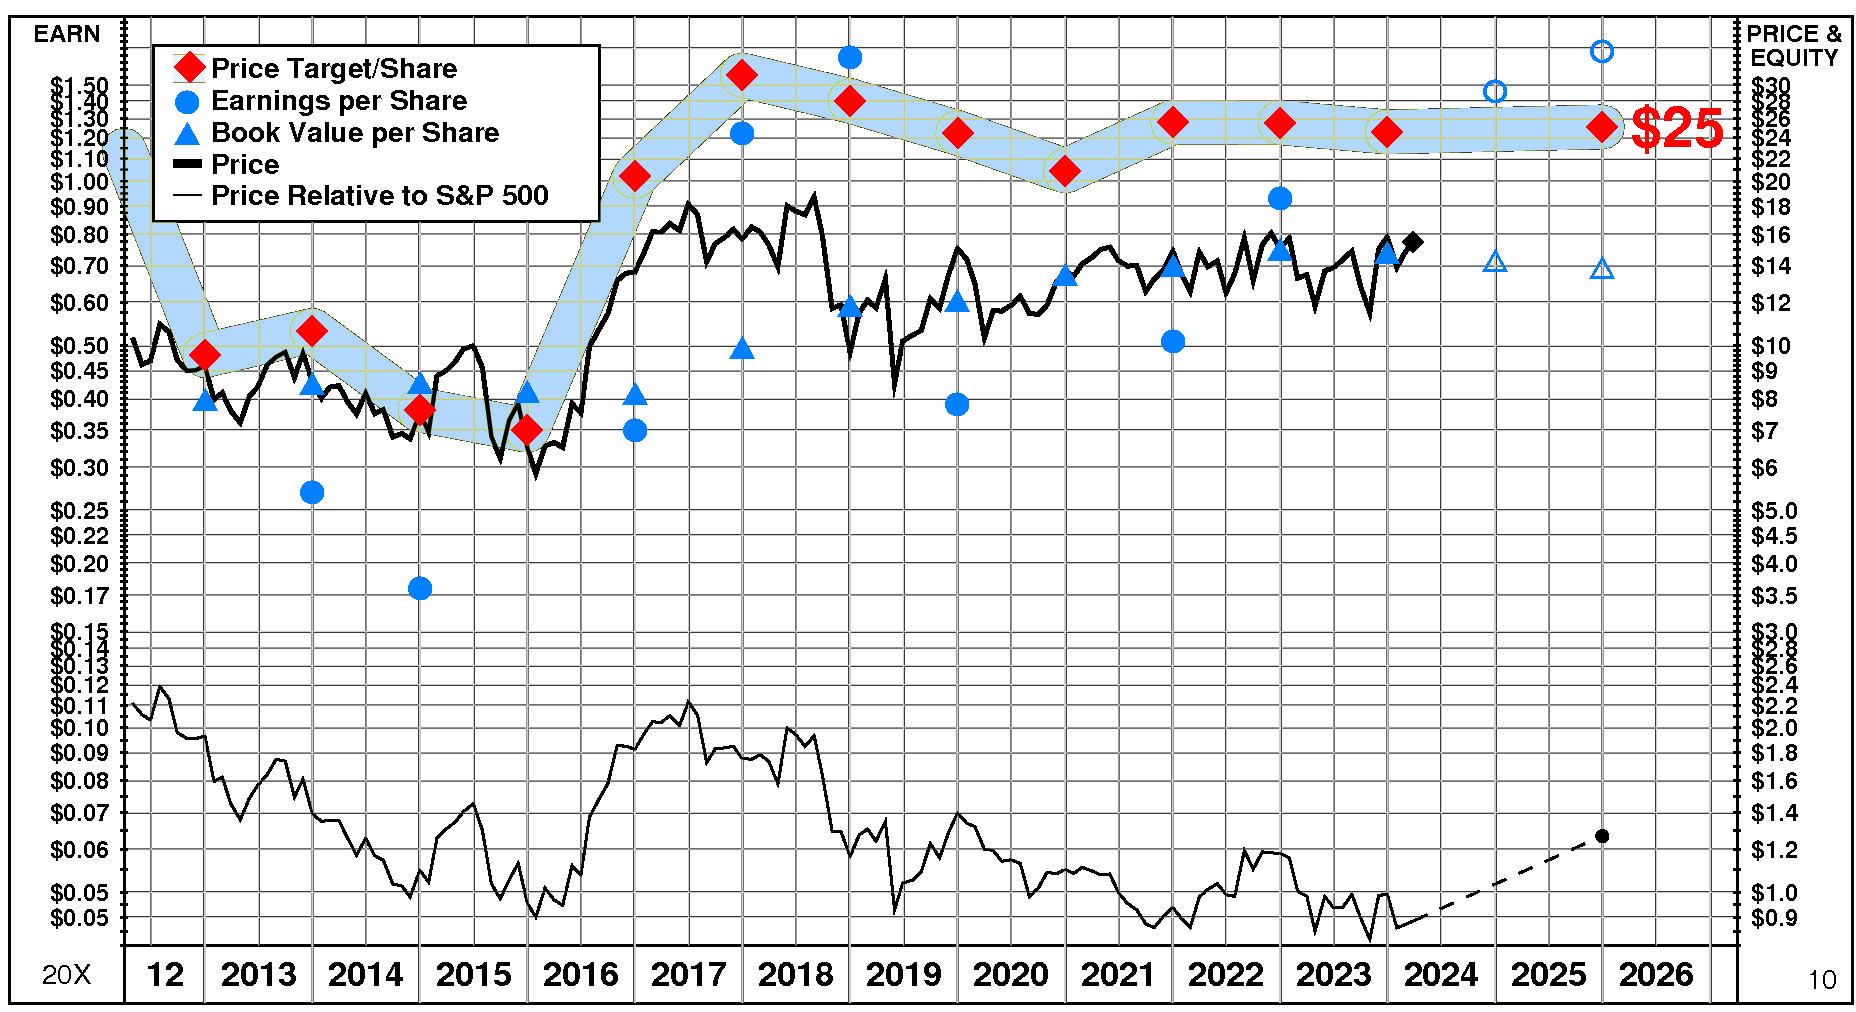
TTM Technologies' current Price Target is $25 (+2% from the 2023 Target of $25 and +62% from the 03/27/24 price of $15.53).
This plateau in the Target is the result of a -4% decrease in the equity base and a +6% increase in the price/equity multiple. One Driver has a positive impact on the price/equity multiple, one has a negative impact, and one has no effect. The forecasted increase in return on equity has a very large positive impact on the price/equity multiple. The forecasted growth has no impact. The forecasted increase in cost of equity has a very large negative impact.
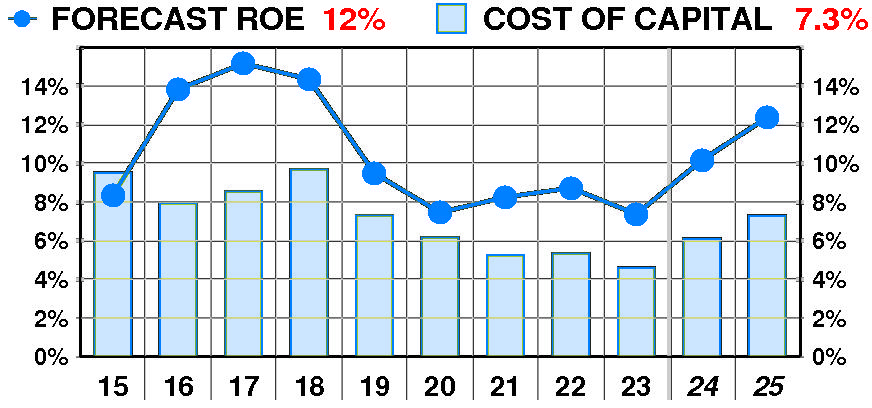
PTR's return on equity forecast is 12.4% — slightly above our recent forecasts.
Forecasted return on equity suffered a dramatic, erratic decline between 2015 and 2023. The current forecast is above the 2015 low of 8%.
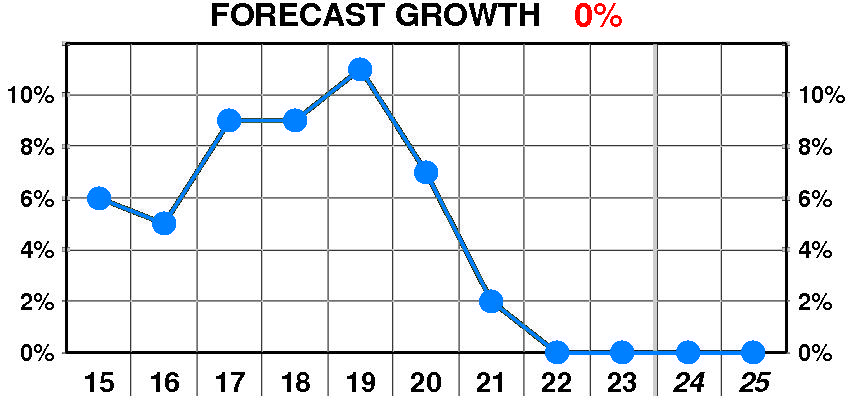
PTR's growth forecast is 0.0% — in line with our recent forecasts.
Forecasted growth suffered a dramatic, erratic decline between 2015 and 2023. The current forecast is significantly below the 2019 peak of 11%.
PTR's cost of equity forecast is 7.3% — slightly above recent levels.
Forecasted cost of equity enjoyed a dramatic, steady decline between 2015 and 2023. The current forecast is below the 2018 peak of 9.7%.
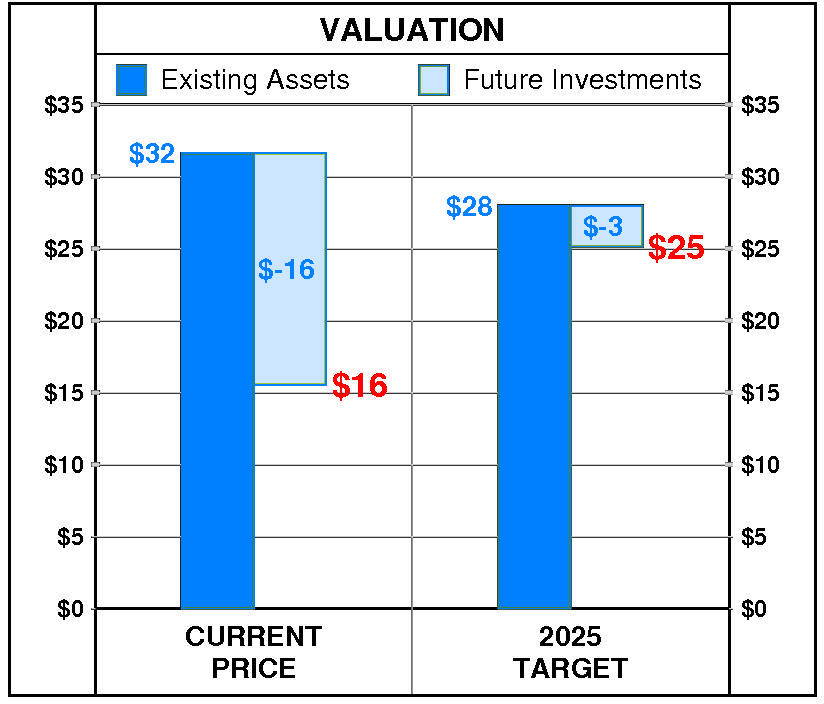
At TTM Technologies' current price of $15.53, investors are placing a negative value of $-16 on its future investments. This view is not supported by the company's most recent performance that reflected a growth rate of 0.0% per year, and a return on equity of 7.4% versus a cost of equity of 4.6%.
PTR's 2025 Price Target of $25 is based on these forecasts and reflects an estimated value of existing assets of $28 and a value of future investments of $-3.