![]()
BUSINESS
Financial Institutions, Inc. operates as a holding company for the Five Star Bank, a chartered bank that provides banking and financial services to individuals, municipalities, and businesses in New York. The company offers checking and savings account programs, including money market accounts, certificates of deposit, sweep investments, and individual retirement and other qualified plan accounts. Its loan products include term loans and lines of credit; short and medium-term commercial loans for working capital, business expansion, and purchase of equipment; commercial business loans to the agricultural industry; commercial mortgage loans; one-to-four family residential mortgage loans, home improvement loans, closed-end home equity loans, and home equity lines of credit; and consumer loans, such as automobile, secured installment, and personal loans.
INVESTMENT RATING
FISI’s future returns on capital are forecasted to exceed the cost of capital. Accordingly, the company is expected to continue to be a modest Value Builder.
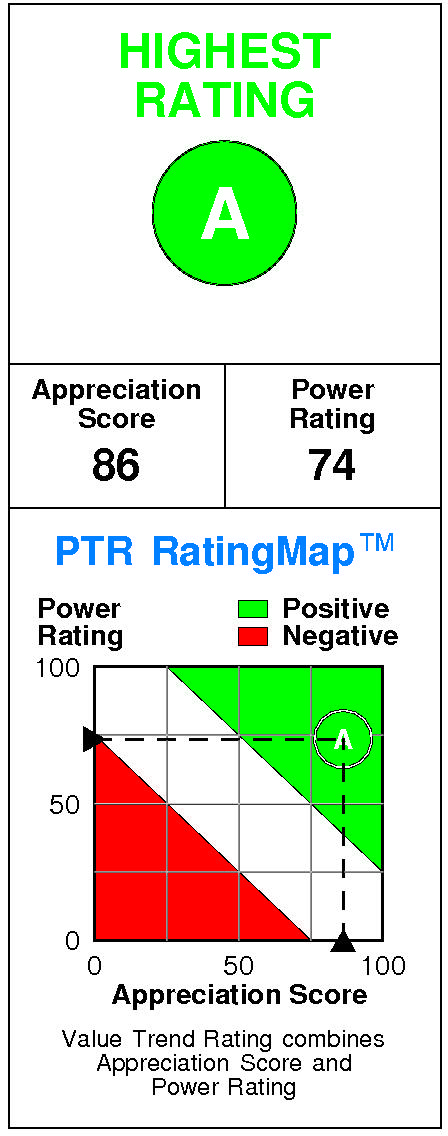
Financial Institutions has a current Value Trend Rating of A (Highest Rating).
With this rating, PTR’s two proprietary measures of a stock’s current attractiveness are providing consistent signals. Financial Institutions has a good Power Rating of 74 and a very high Appreciation Score of 86, triggering the Highest Value Trend Rating.
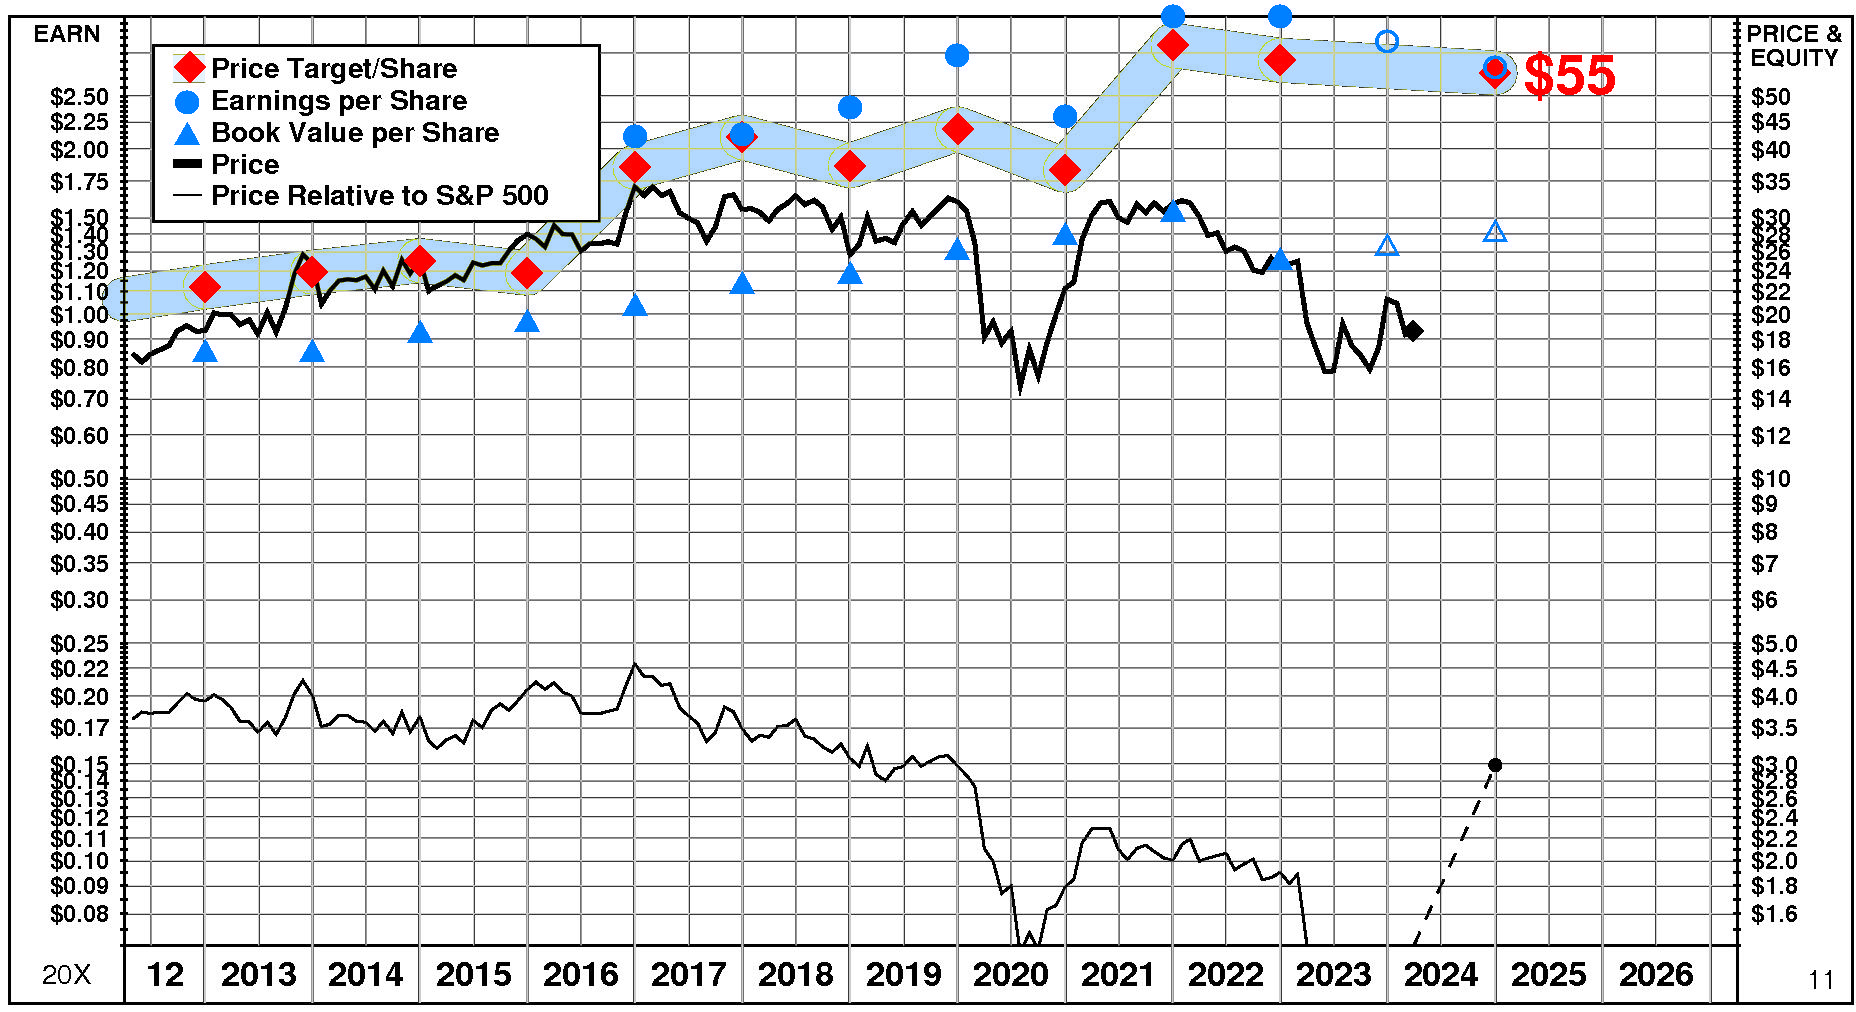
Financial Institutions’ stock is selling well below targeted value. The current stock price of $18.64 compares to targeted value 12 months forward of $55.
Financial Institutions’ very high appreciation potential results in an appreciation score of 86 (only 14% of the universe has greater appreciation potential.)
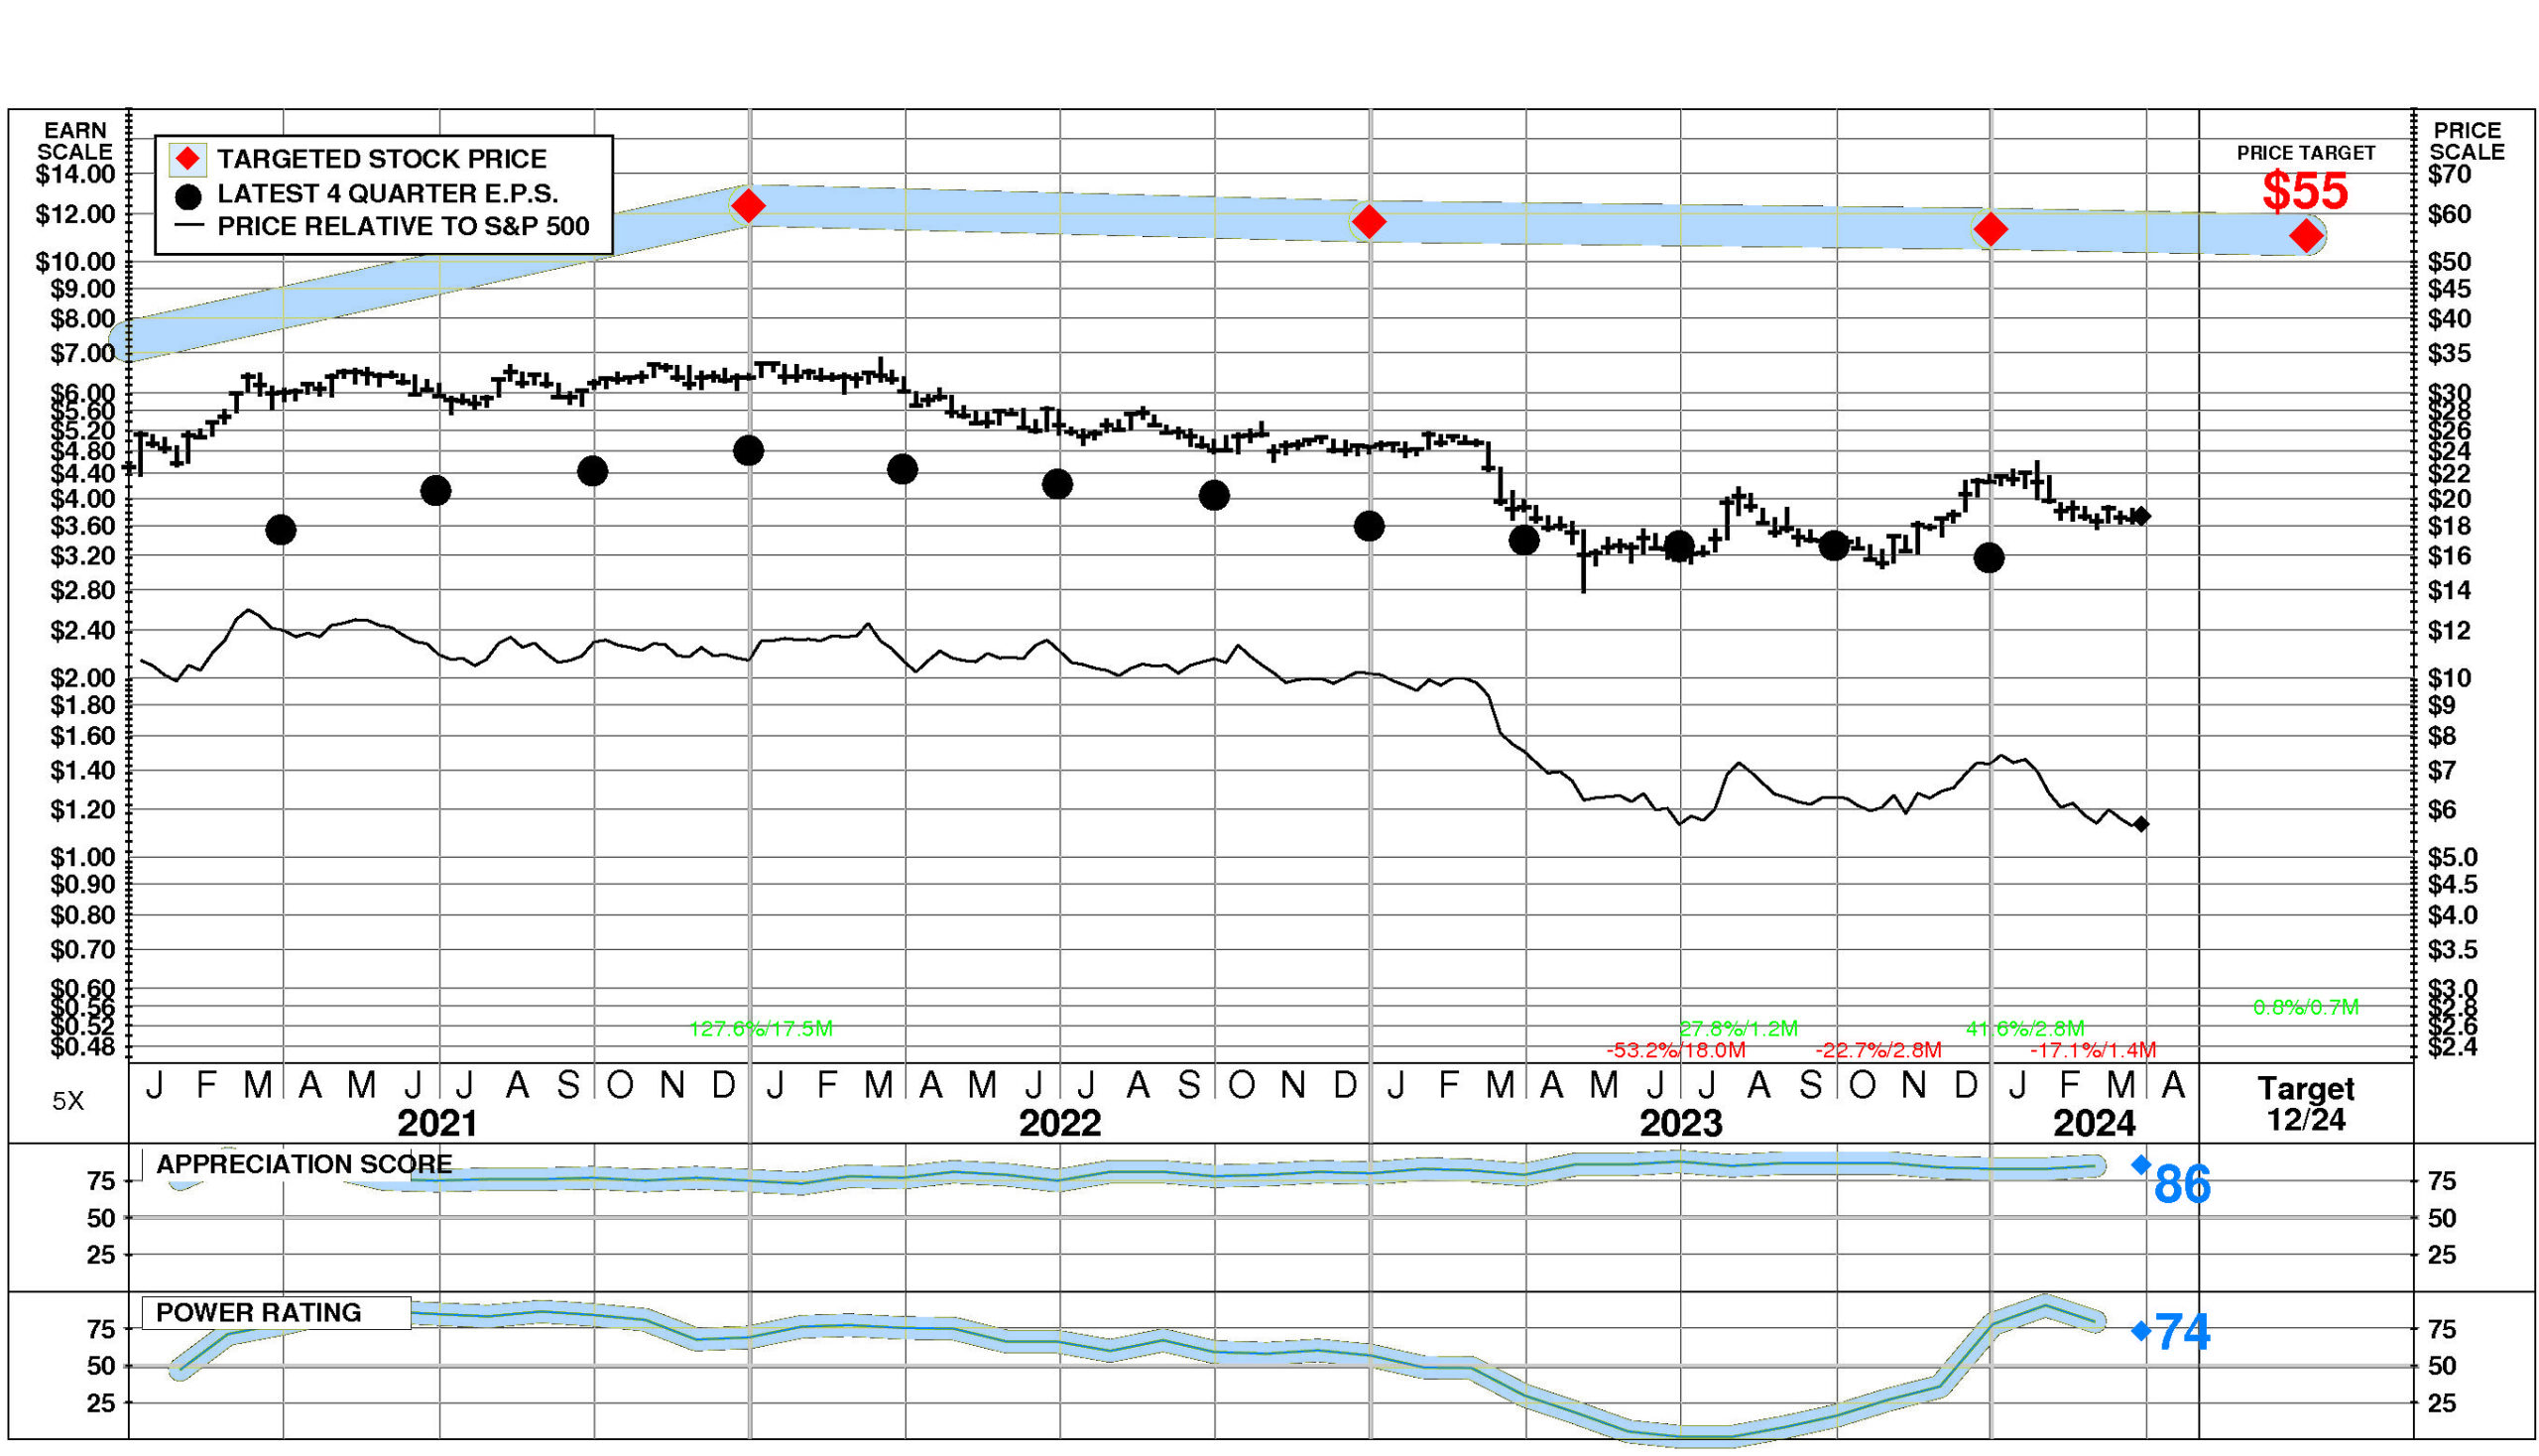
Financial Institutions has a Power Rating of 74. (This good Power Rating indicates that FISI has a better chance of achieving attractive investment performance over the near to intermediate term than all but 26% of companies in the universe.)
Factors contributing to this good Power Rating include: the Commercial Banks comparison group is in a strong phase currently; and recent price action has been favorable. An offsetting factor is the trend in FISI’s earnings estimates has been unfavorable in recent months.
INVESTMENT PROFILE
FISI’s financial strength is exceptional. Financial strength rating is 96.
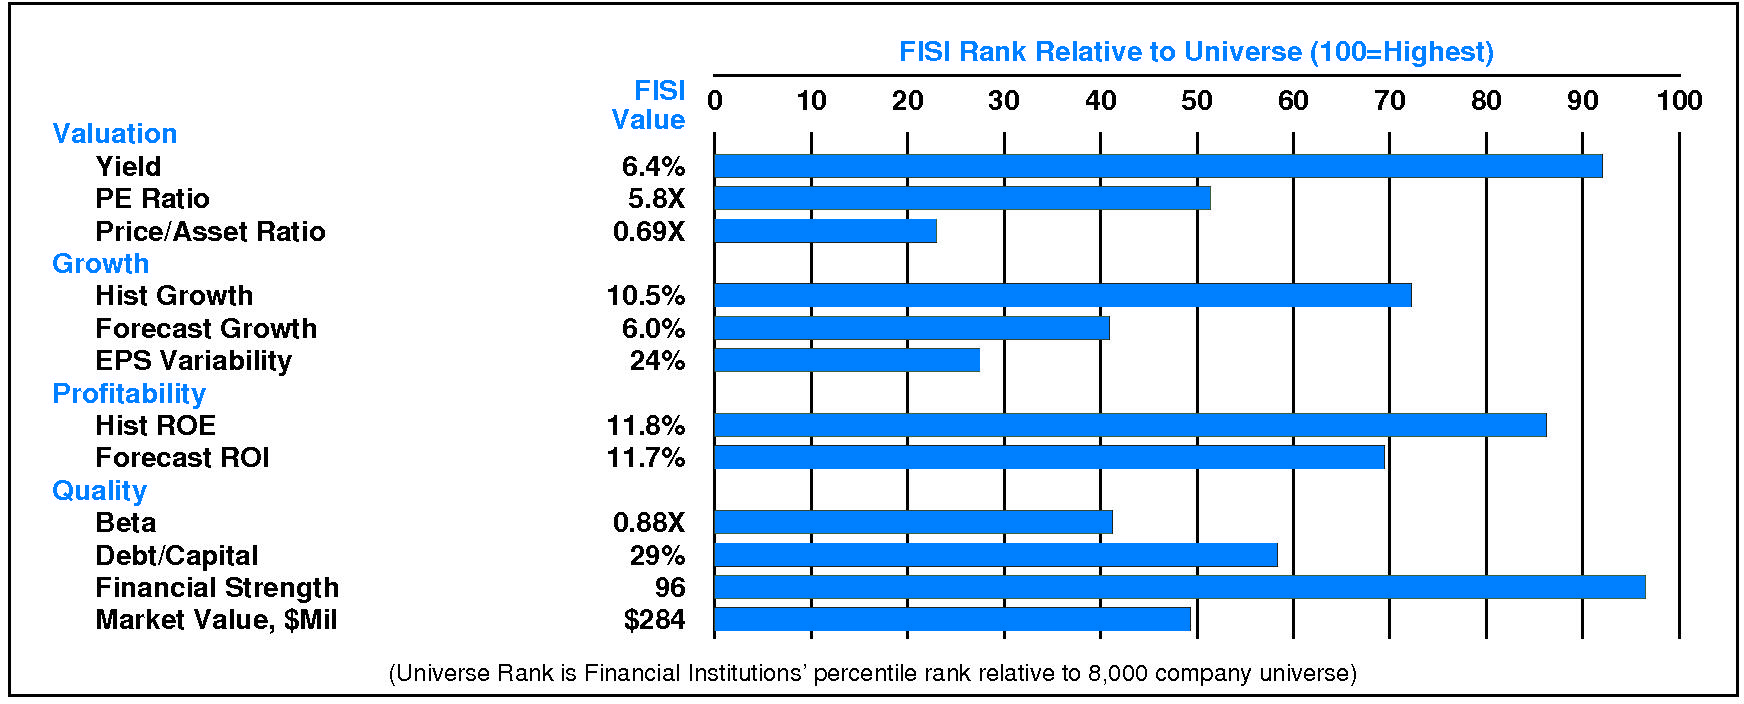
Relative to the S&P 500 Composite, Financial Institutions Inc has moderate Value characteristics; its appeal is likely to be to investors heavily oriented toward Income; the perception is that FISI is lower risk. Low financial leverage is a positive for FISI. Relative weaknesses include: low forecasted profitability, and low expected growth. FISI’s valuation is low: high dividend yield, low P/E ratio, and low price/book ratio. FISI has unusually low market capitalization.
CURRENT SIGNALS
Financial Institutions’ current operations are eroding. Return on equity is falling, reflecting: declining pretax margin; falling tax keep rate; and falling leverage.
Financial Institutions’ current technical position is mixed. The stock price is in a 1.4 month down move. The stock has declined 14.6% from its prior high. The 200 day moving average is in an uptrend. The stock price is below its 200 day moving average. The stock has just risen above its 200 day moving average.
ALERTS
. Positive development: the stock’s recent price rise disrupted its longer term downtrend. Negative development: negative upside/downside volume developed.
The stock is currently rated A.
Financial Institutions Inc (NASDAQ: FISI) stock closed at $18.64 on 3/27/24 after a large increase of 2.9%. This advance was accompanied by normal trading volume. Relative to the market the stock has been strong over the last nine months and has risen 1.9% during the last week.
CASH FLOW
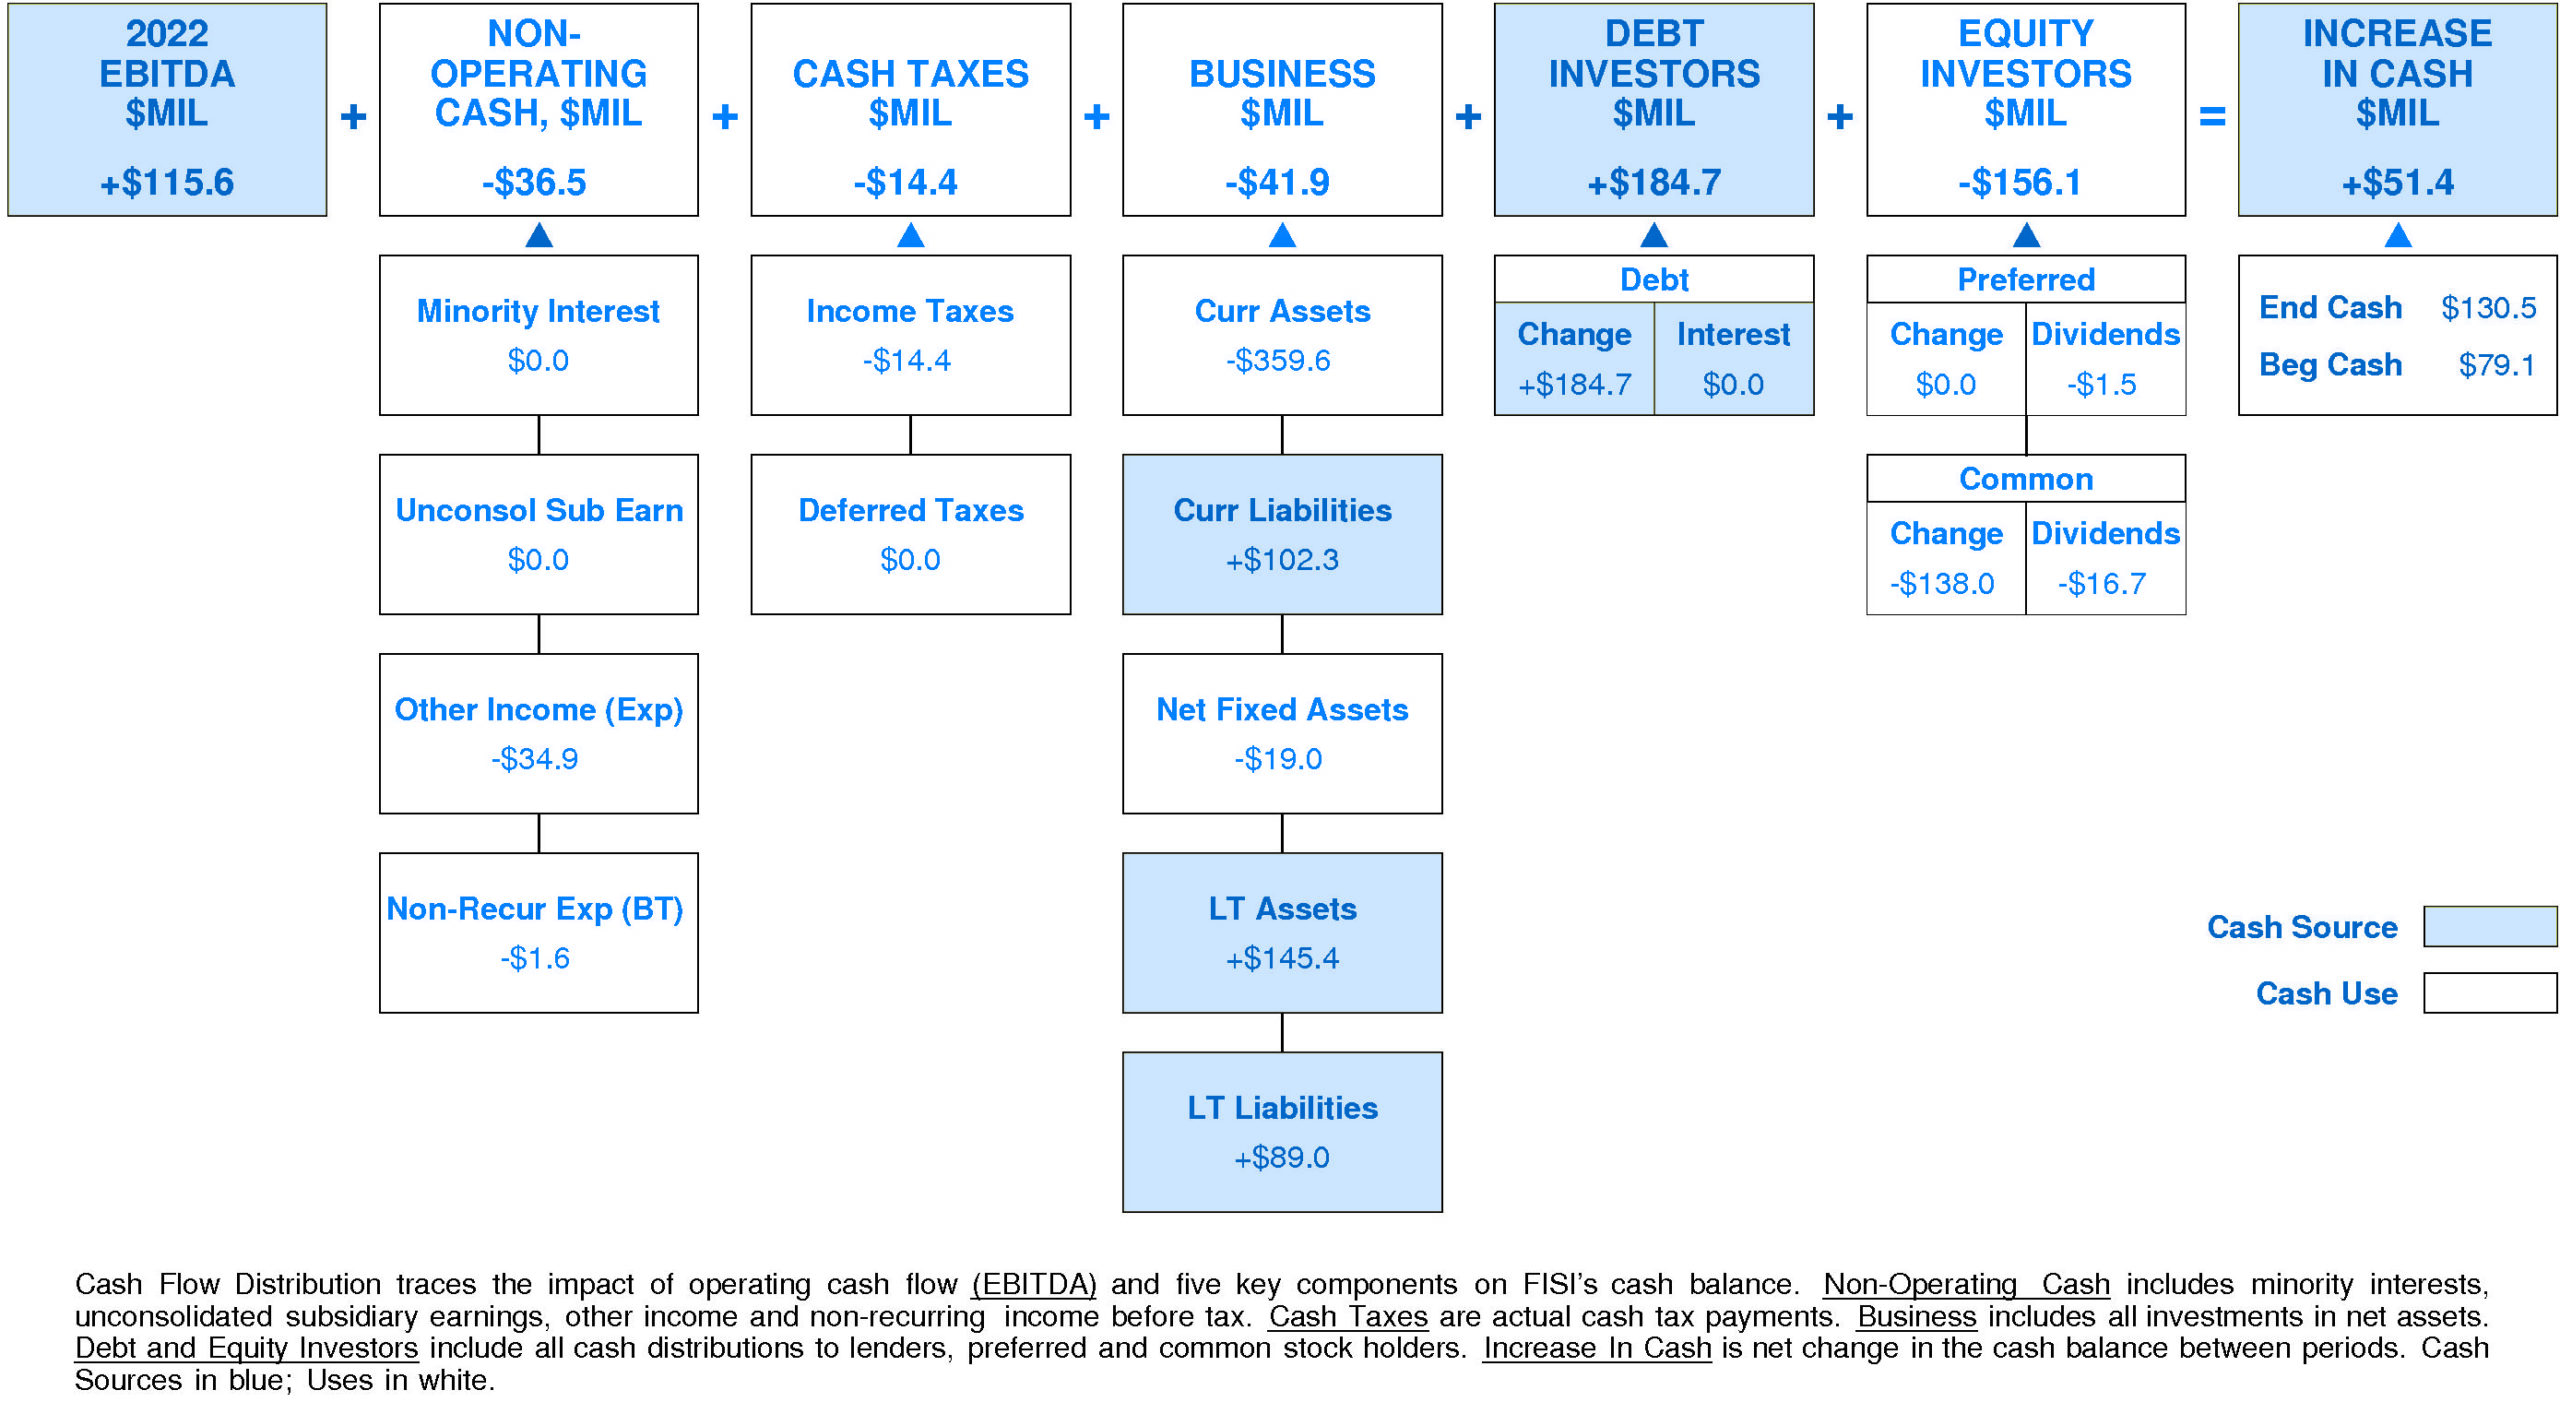
In 2022, Financial Institutions generated a very significant increase in cash of +$51.4 million (+65%). Sources of cash were much larger than uses. Cash generated from 2022 EBITDA totaled +$115.6 million. Non-operating uses consumed -$36.5 million (-32% of EBITDA). Cash taxes consumed -$14.4 million (-12% of EBITDA). Re-investment in the business amounted to -$41.9 million (-36% of EBITDA). On a net basis, debt investors furnished +$184.7 million (+160% of EBITDA) while equity investors pulled out -$156.1 million (-135% of EBITDA).
FISI’s Non-operating Income, %EBITDA has exhibited little to no overall change over the period. This stability was accompanied by stability for the Financial Institutions Peer Group as well. In most years, Financial Institutions was in the second quartile and top quartile. Currently, Financial Institutions is at median at -32% of EBITDA (-$36.5 million).
FISI’s Cash Taxes, %EBITDA has exhibited a very small overall uptrend over the period. This improvement was accompanied by a similar trend for the Financial Institutions Peer Group. In most years, Financial Institutions was in the second quartile and top quartile. Currently, Financial Institutions is above median at -12% of EBITDA (-$14.4 million).
FISI’s Business Re-investment, %EBITDA has enjoyed a very strong overall uptrend over the period. This improvement was accompanied by an opposite trend for the Financial Institutions Peer Group. In most years, Financial Institutions was in the third quartile and top quartile. Currently, Financial Institutions is slightly above median at -36% of EBITDA (-$41.9 million).
FISI’s Debt Investors, %EBITDA has experienced a volatile overall downtrend over the period. This downtrend was accompanied by a similar trend for the Financial Institutions Peer Group. (Since 2020 Debt Investors, %EBITDA has experienced a very sharp recovery.) In most years, Financial Institutions was in the top quartile and third quartile. Currently, Financial Institutions is upper quartile at +160% of EBITDA (+$184.7 million).
FISI’s Equity Investors, %EBITDA has suffered a volatile overall downtrend over the period. This downtrend was accompanied by a similar trend for the Financial Institutions Peer Group. (Since 2019 Equity Investors, %EBITDA has accelerated very sharply.) In most years, Financial Institutions was in the top quartile and lower quartile. Currently, Financial Institutions is lower quartile at -135% of EBITDA (-$156.1 million).
FISI’s Change in Cash, %EBITDA has exhibited a volatile overall uptrend over the period. This improvement was accompanied by a similar trend for the Financial Institutions Peer Group. (Since 2020 Change in Cash, %EBITDA has accelerated very sharply.) In most years, Financial Institutions was in the top quartile and second quartile. Currently, Financial Institutions is above median at +44% of EBITDA (+$51.4 million).
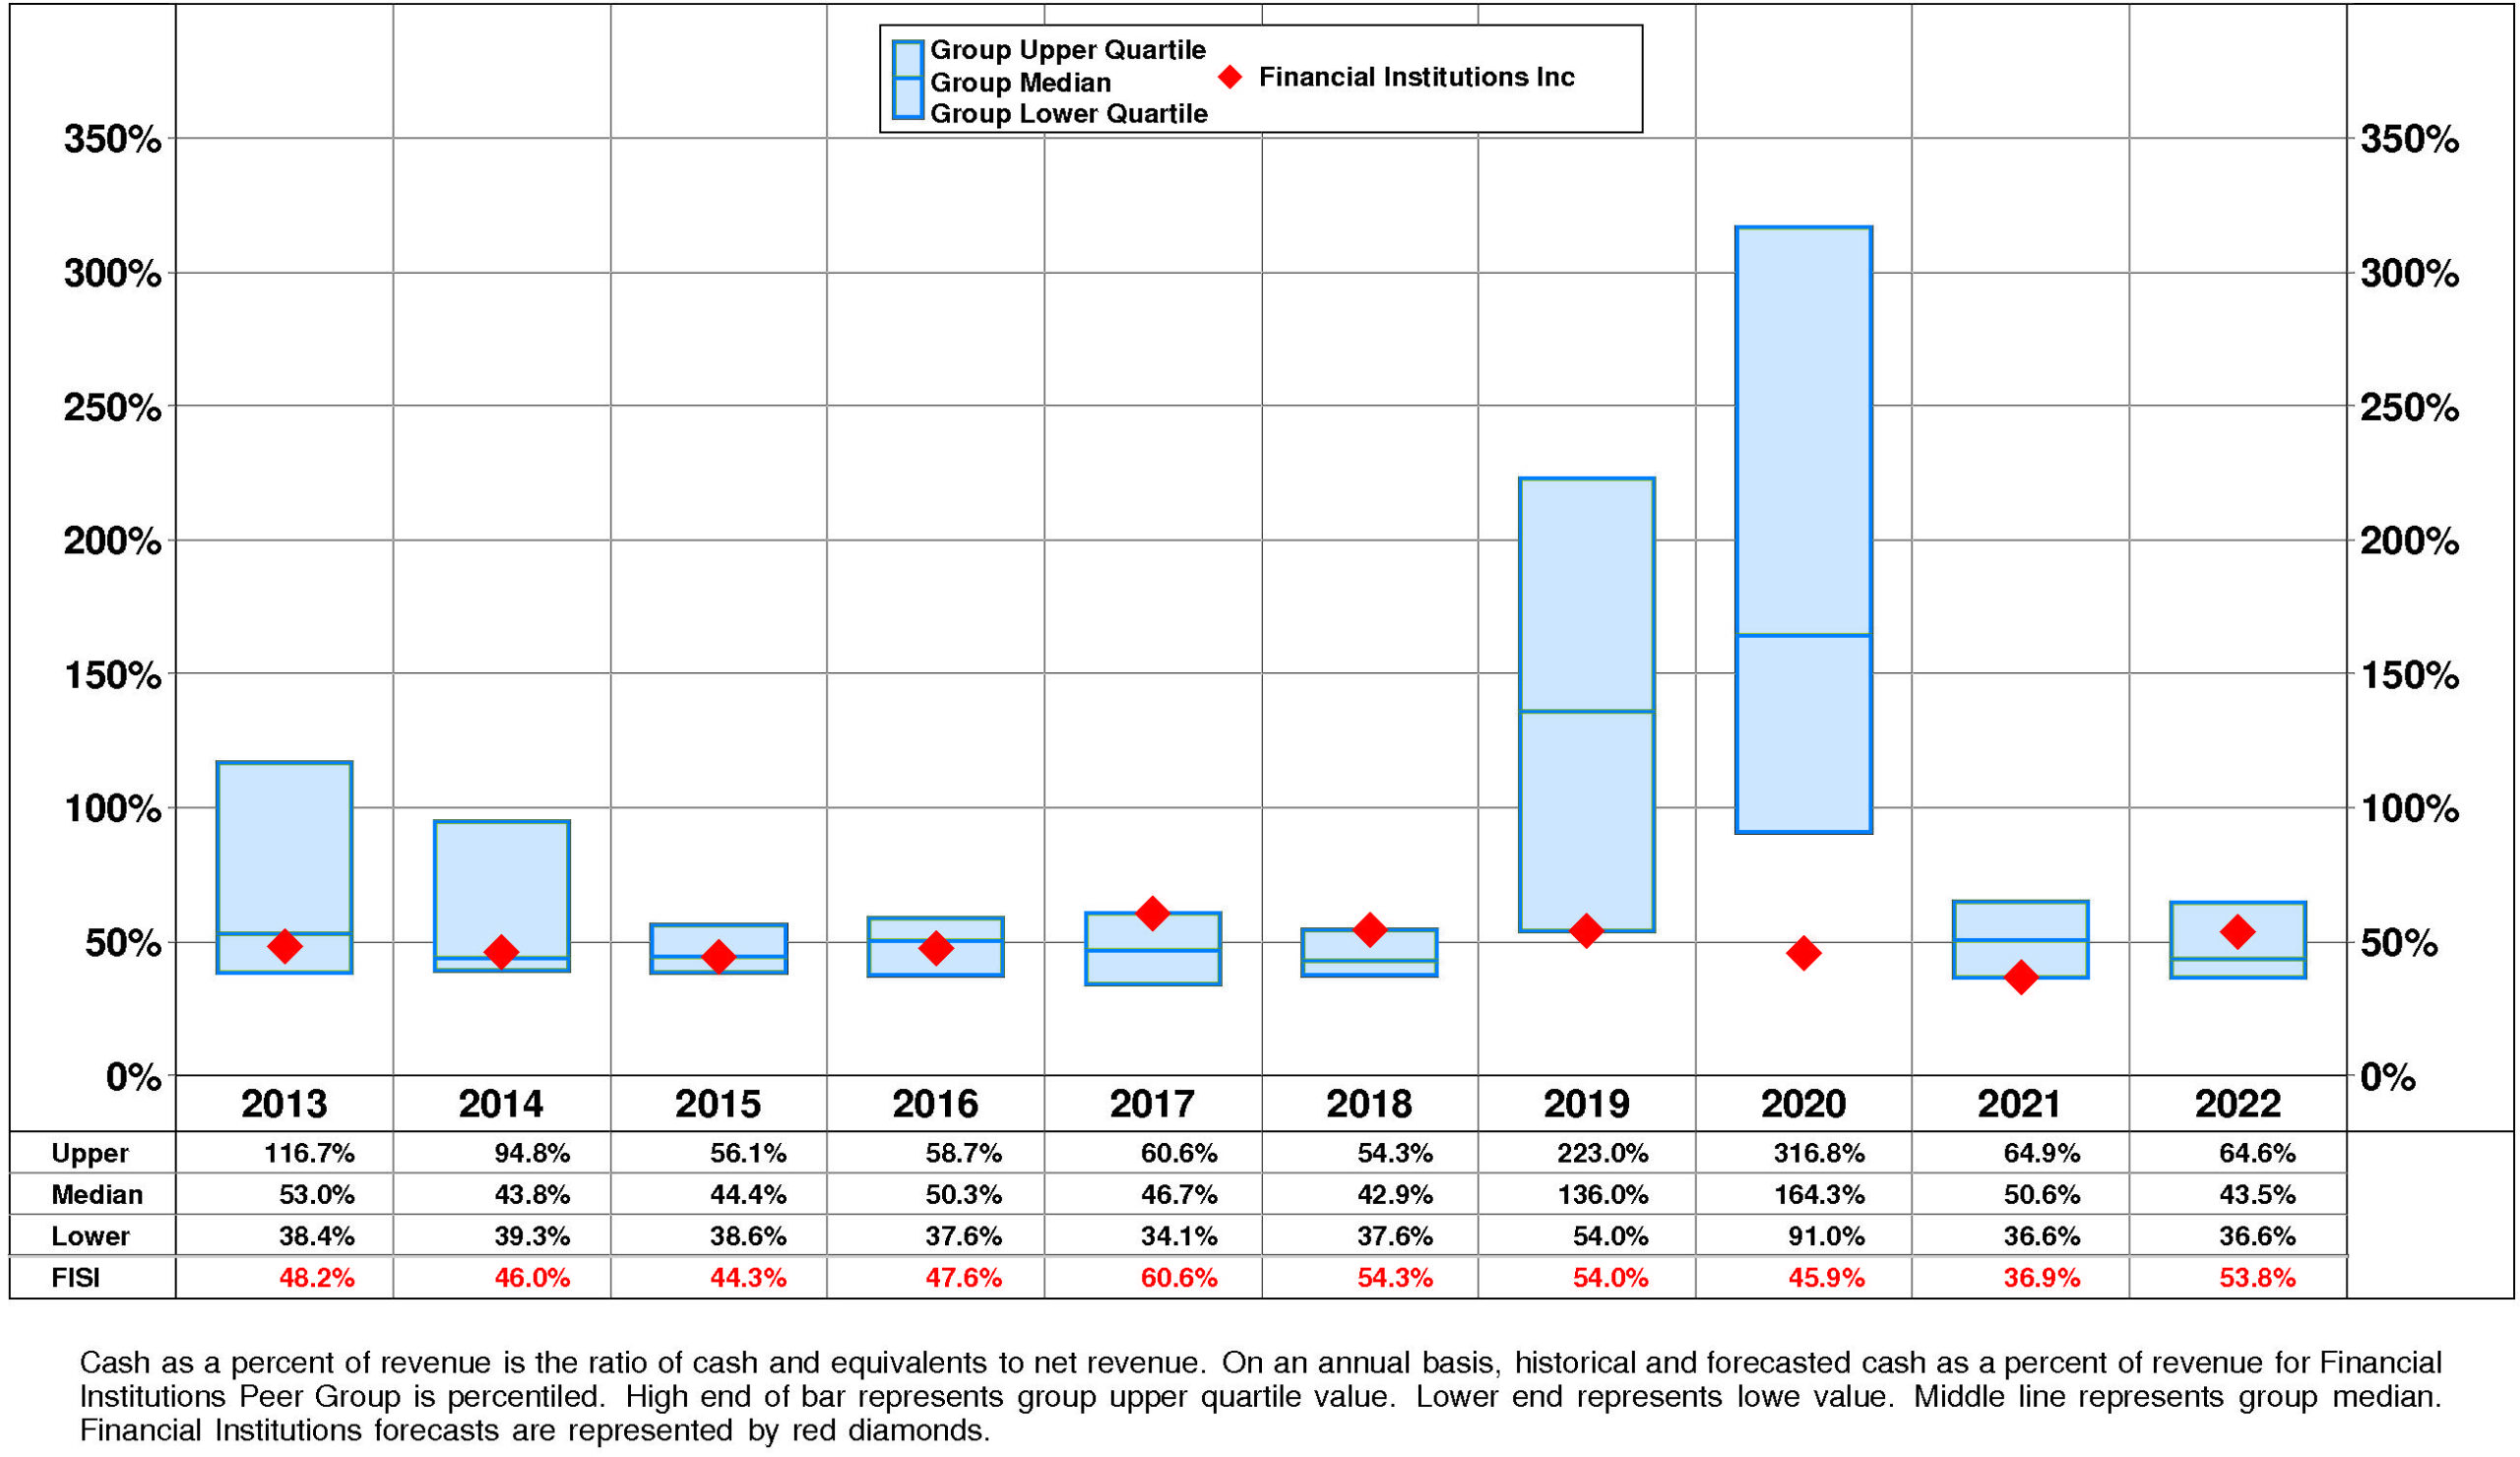
FISI’s Cash, %Revenue has exhibited little to no overall change over the period. This stability was accompanied by an uptrend for the Financial Institutions Peer Group. In most years, Financial Institutions was in the third quartile and top quartile. Currently, Financial Institutions is above median at +54%.
PROFITABILITY
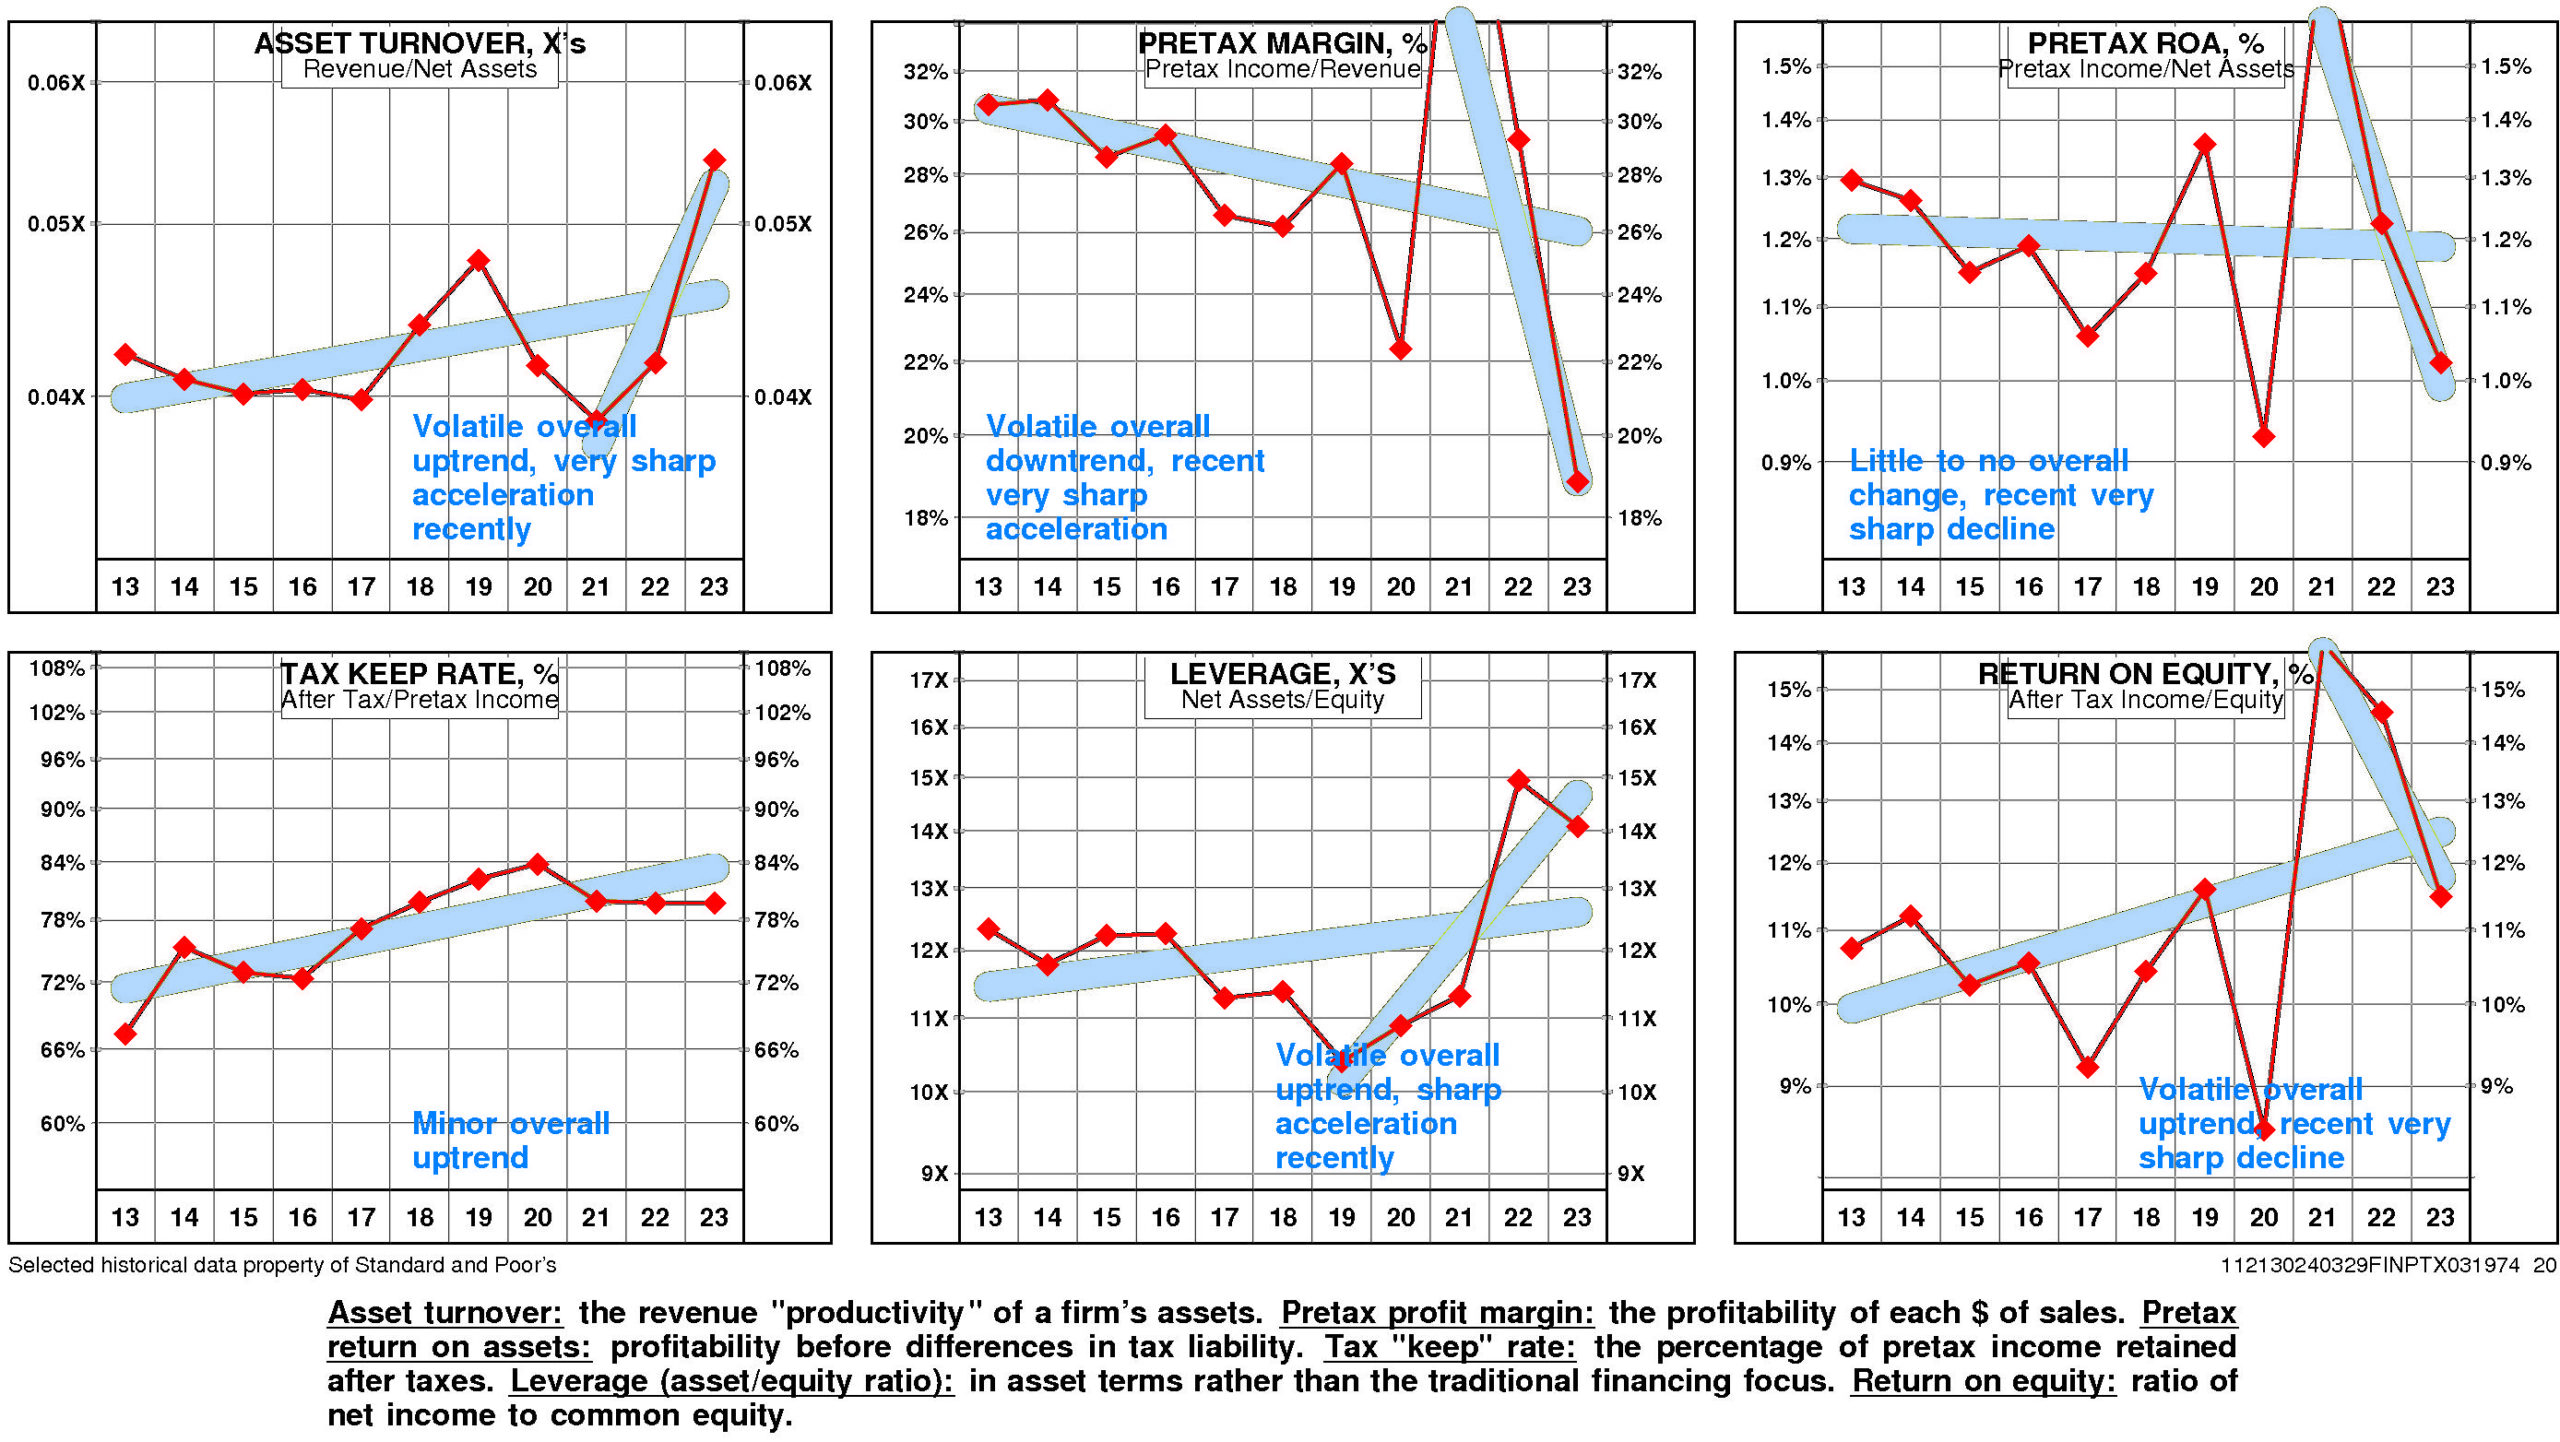
FISI’s return on equity has improved significantly since 2013. The current level of 11.5% is 1.07X the low for the period and is at the high.
This significant improvement was due to little change in pretax operating return and strong positive trend in non-operating factors.
The productivity of FISI’s assets rose over the full period 2013-2023: asset turnover has exhibited a volatile overall uptrend that accelerated very sharply after the 2021 level.
More than offsetting this trend, however, pretax margin has experienced a downtrend that accelerated very sharply from the 2021 level.
Non-operating factors (income taxes and financial leverage) had a significant positive influence on return on equity.
FISI’s return on equity is at the upper quartile (11.5%) for the four quarters ended December, 2023.
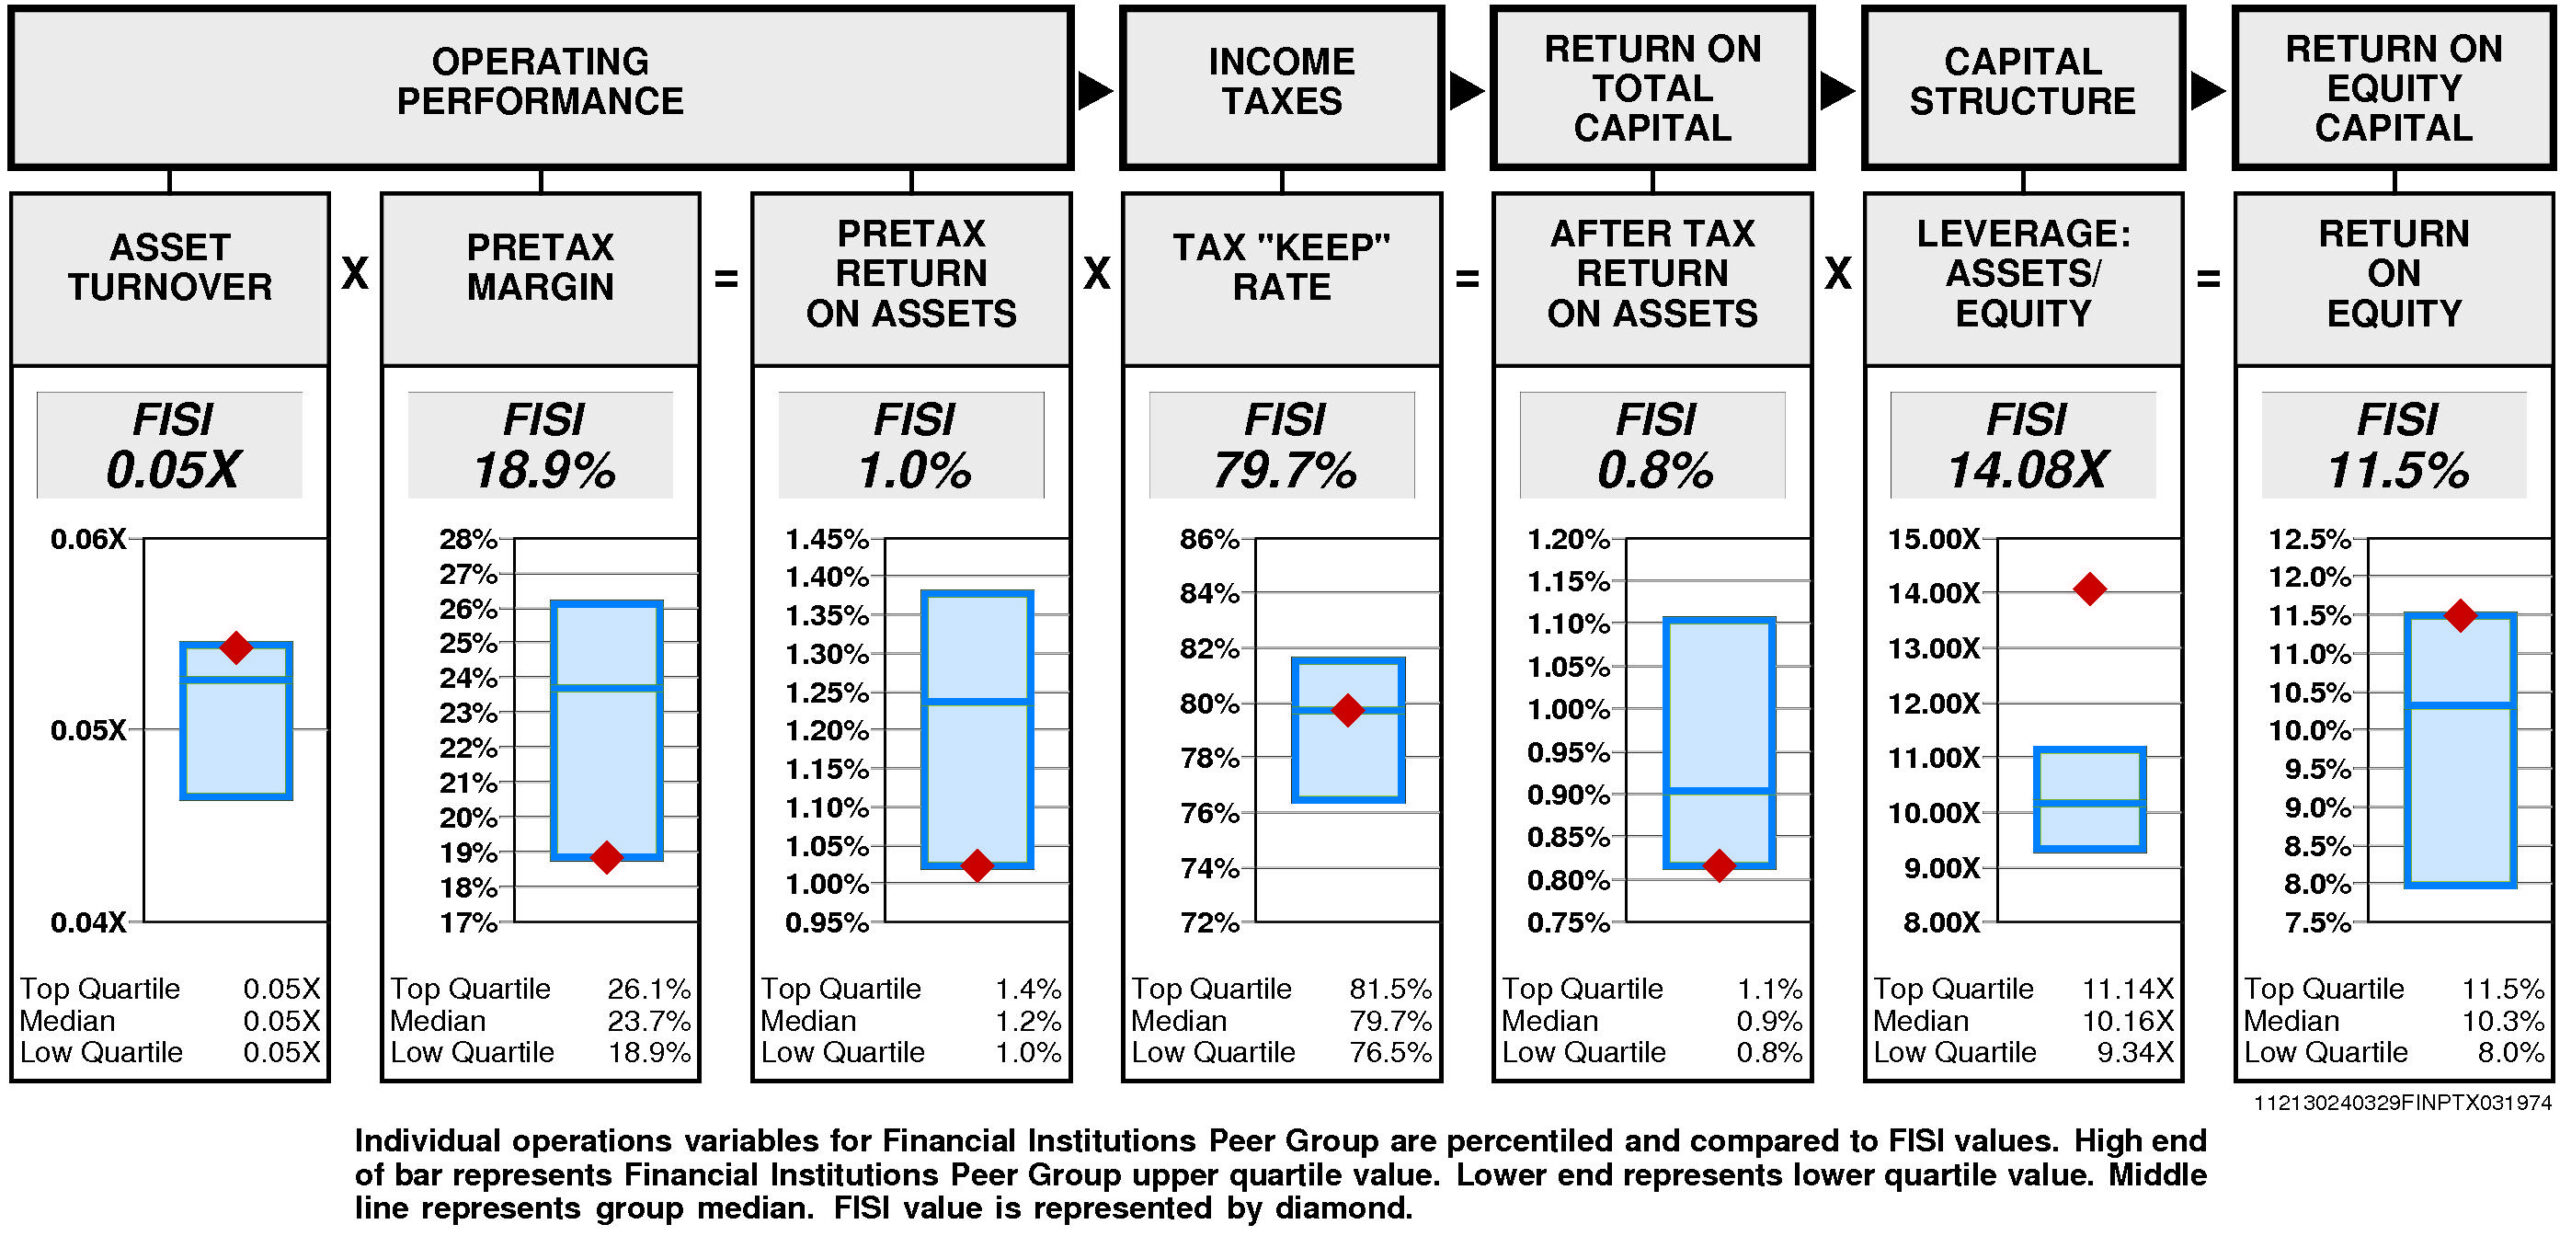
Operating performance (pretax return on assets) is at the lower quartile (1.0%) reflecting asset turnover that is at the upper quartile (0.05X) and pretax margin at the lower quartile (18.9%).
Tax “keep” rate (income tax management) is at median (79.7%) resulting in after tax return on assets that is at the lower quartile.
Financial leverage (leverage) is upper quartile (14.08X).
GROWTH RATES
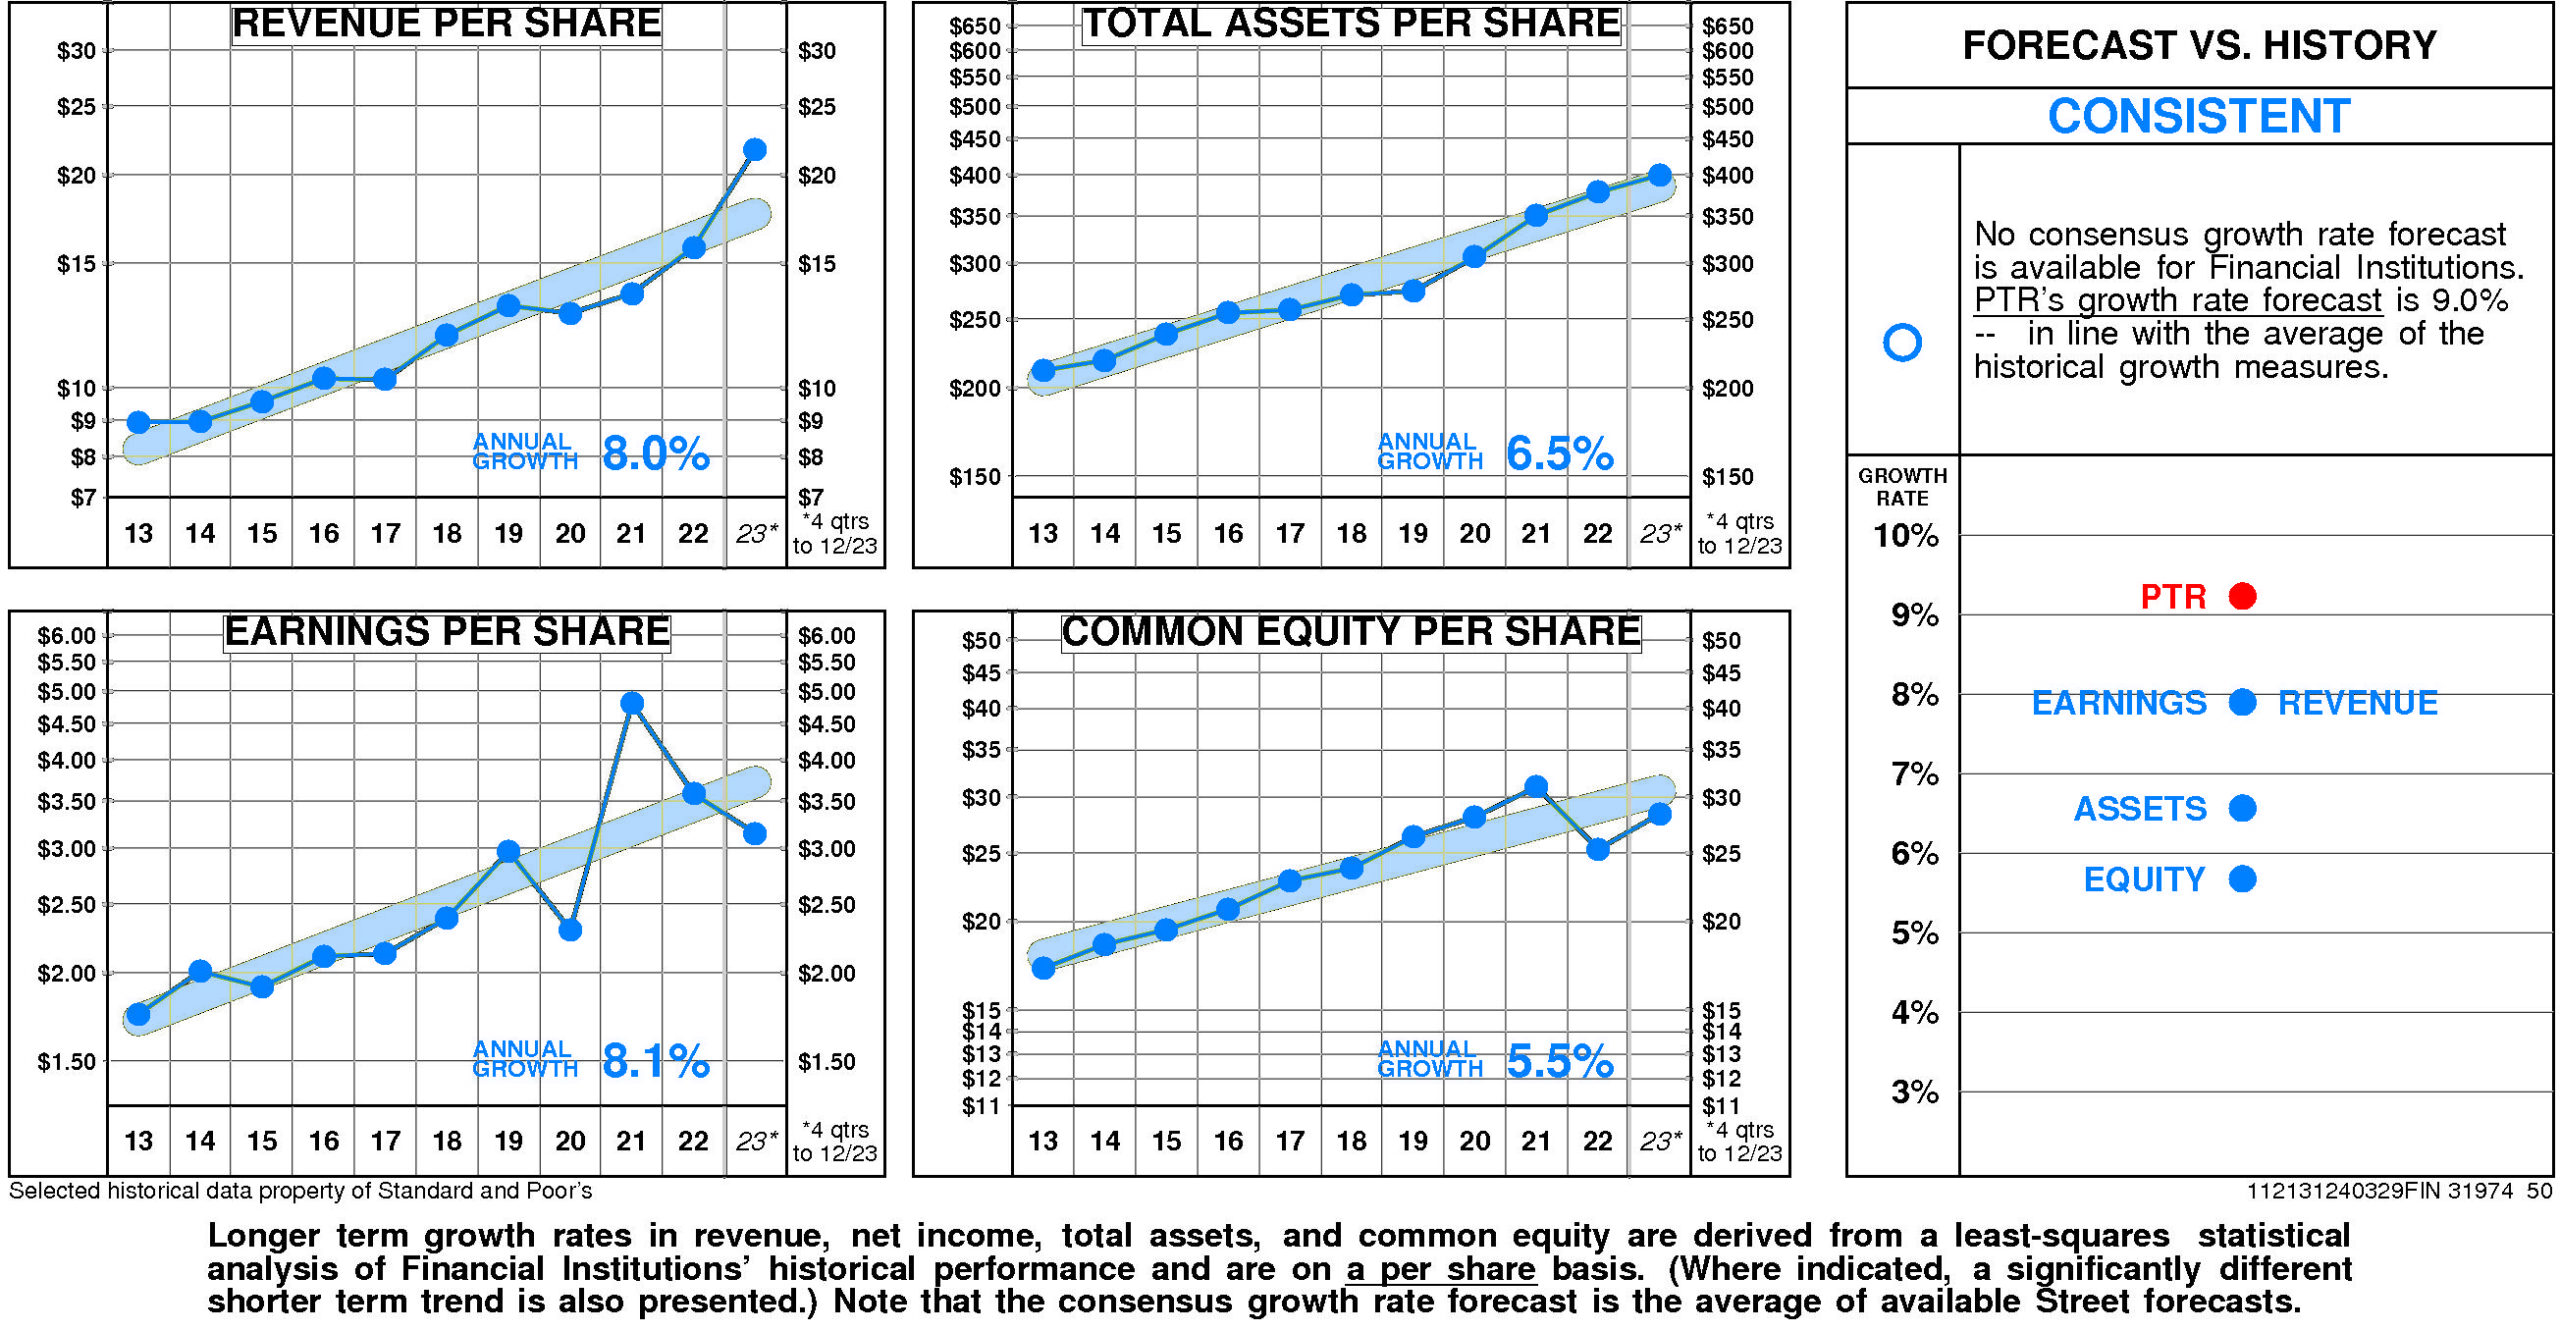
There are no significant differences between Financial Institutions’ longer term growth and growth in recent years.
Financial Institutions’ historical income statement growth has been in line with balance sheet growth. Revenue growth has paralleled asset growth; earnings growth has paralleled equity growth.
Annual revenue growth has been 8.0% per year.
Total asset growth has been 6.5% per year.
Annual E.P.S. growth has been 8.1% per year.
Equity growth has been 5.5% per year.
No consensus growth rate forecast is available for Financial Institutions.
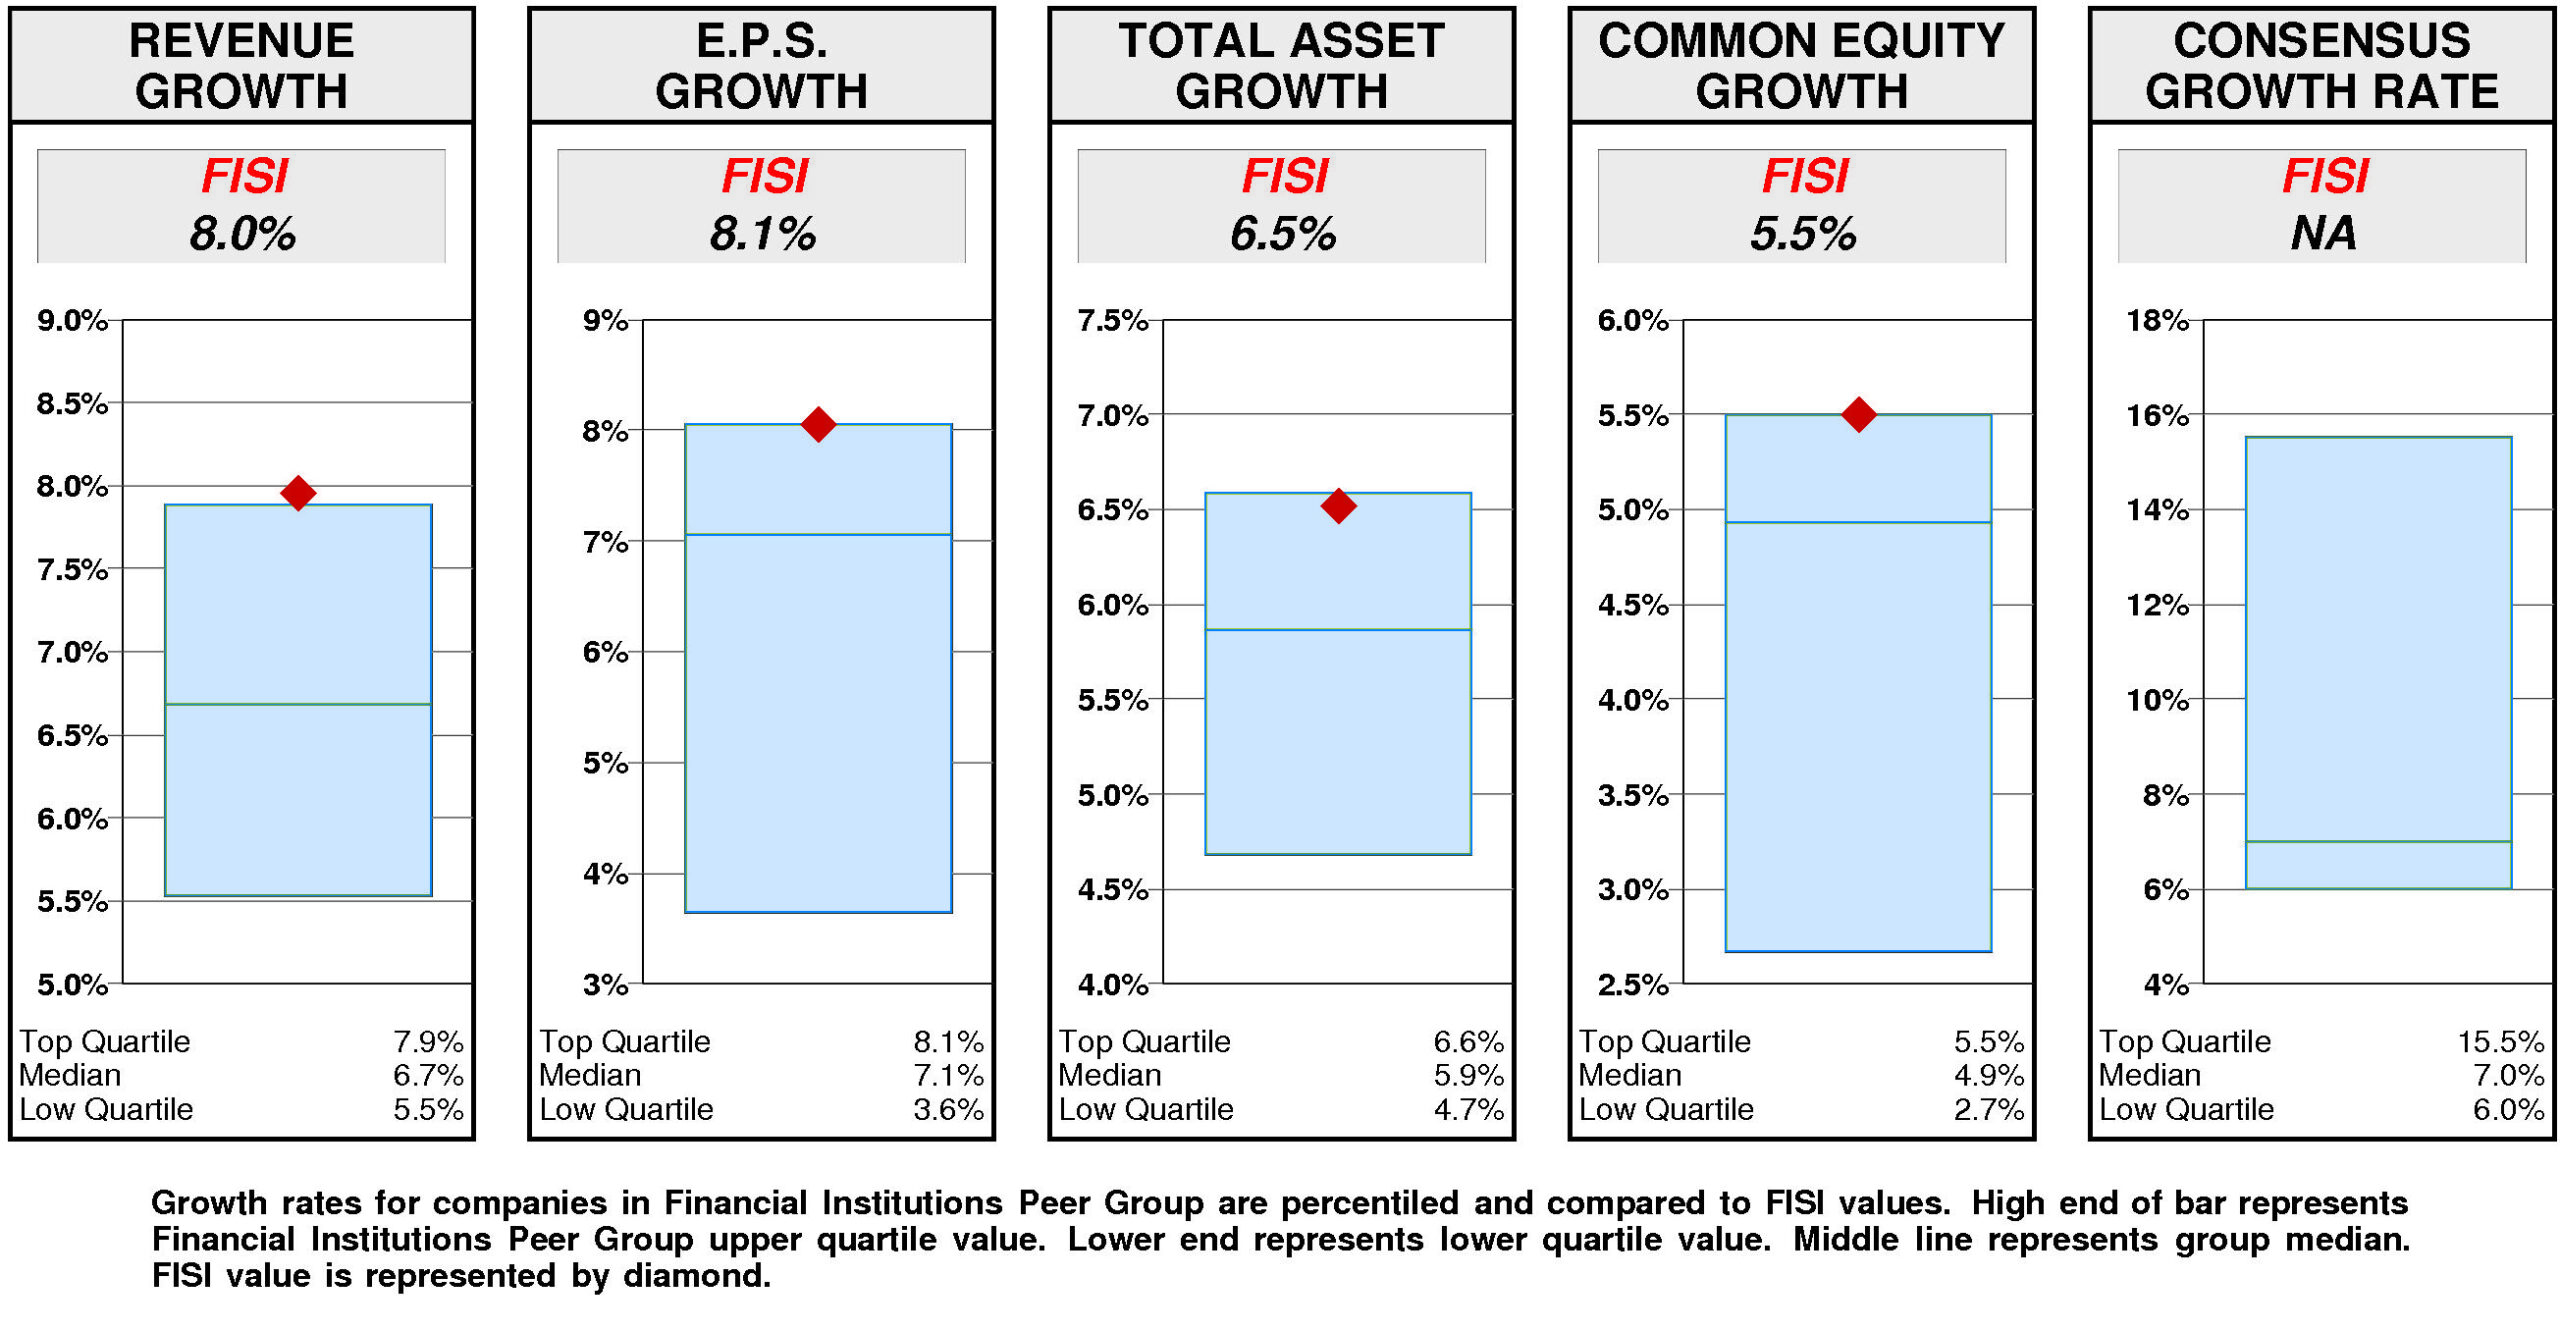
Relative to the Financial Institutions Peer Group, Financial Institutions’ historical growth measures are generally top quartile. Revenue growth (8.0%) has been at the upper quartile. Total asset growth (6.5%) has been at the upper quartile. E.P.S. growth (8.1%) has been at the upper quartile. Equity growth (5.5%) has been at the upper quartile.
Consensus growth forecast is unavailable.
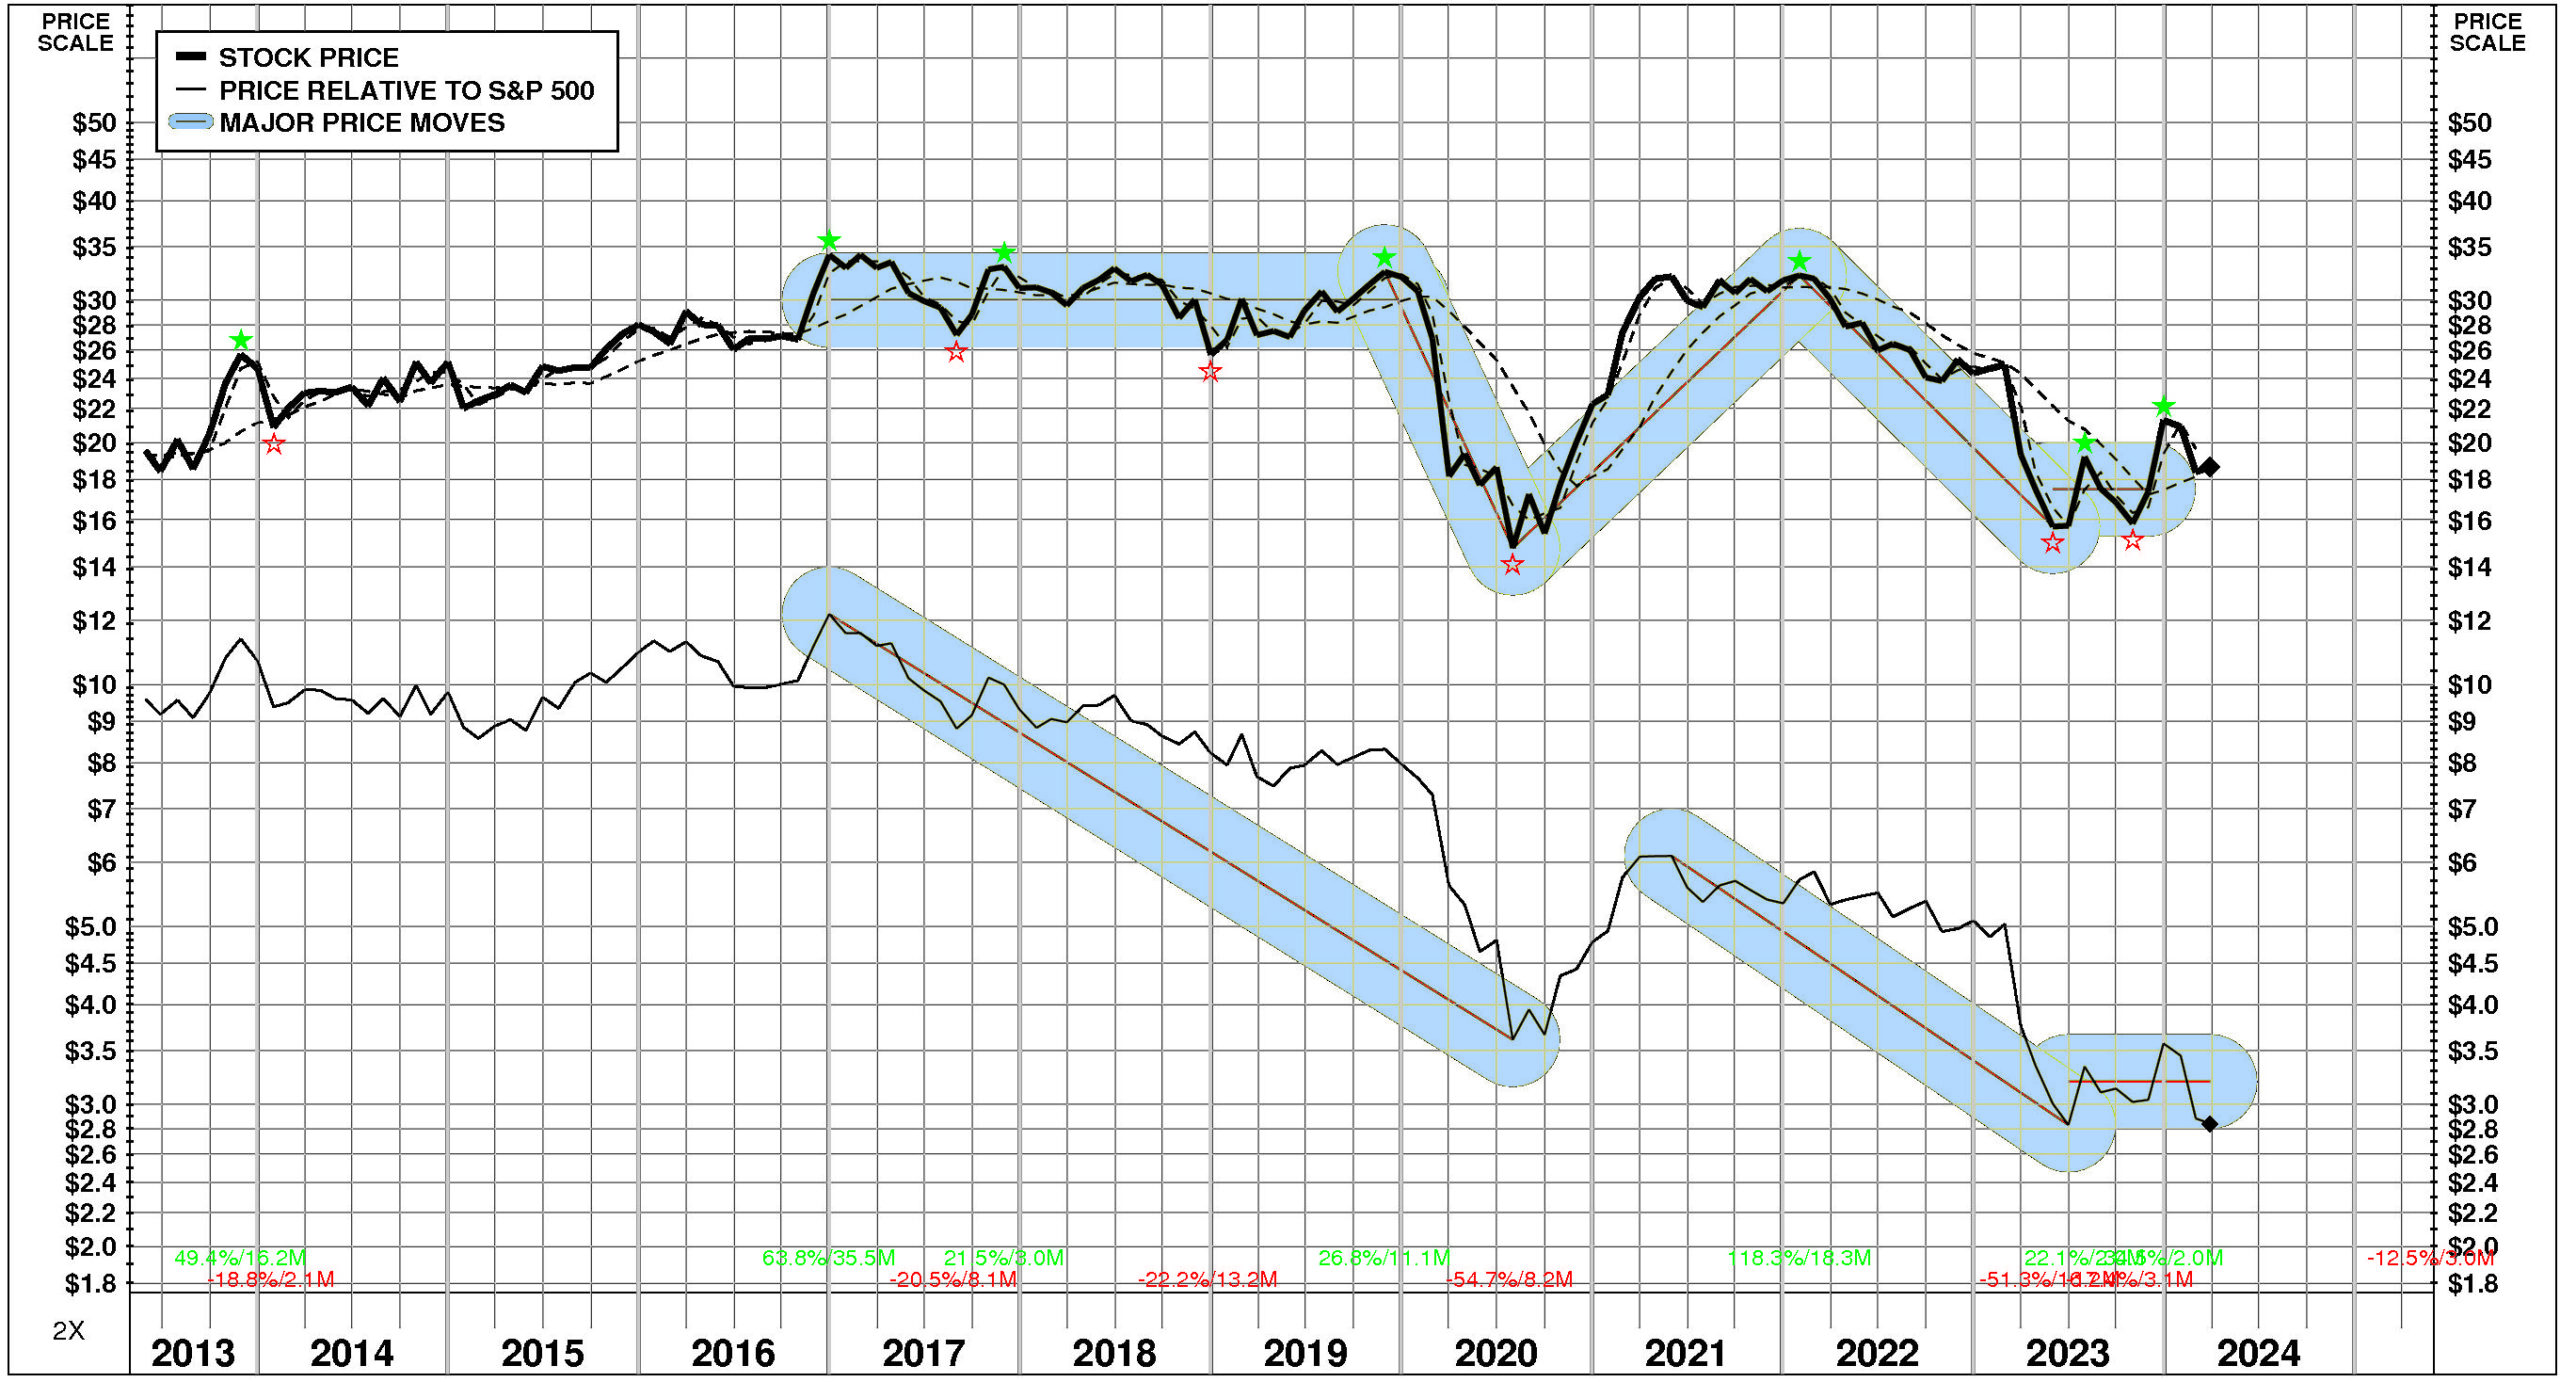
PRICE HISTORY
Over the full time period, Financial Institutions’ stock price performance has been variable and significantly below market. Between May, 2013 and March, 2024, Financial Institutions’ stock price fell -4%; relative to the market, this was a -70% loss. Significant price moves during the period: 1) January, 2022 – May, 2023: -51%; 2) July, 2020 – January, 2022: +118%; and 3) November, 2019 – July, 2020: -55%.
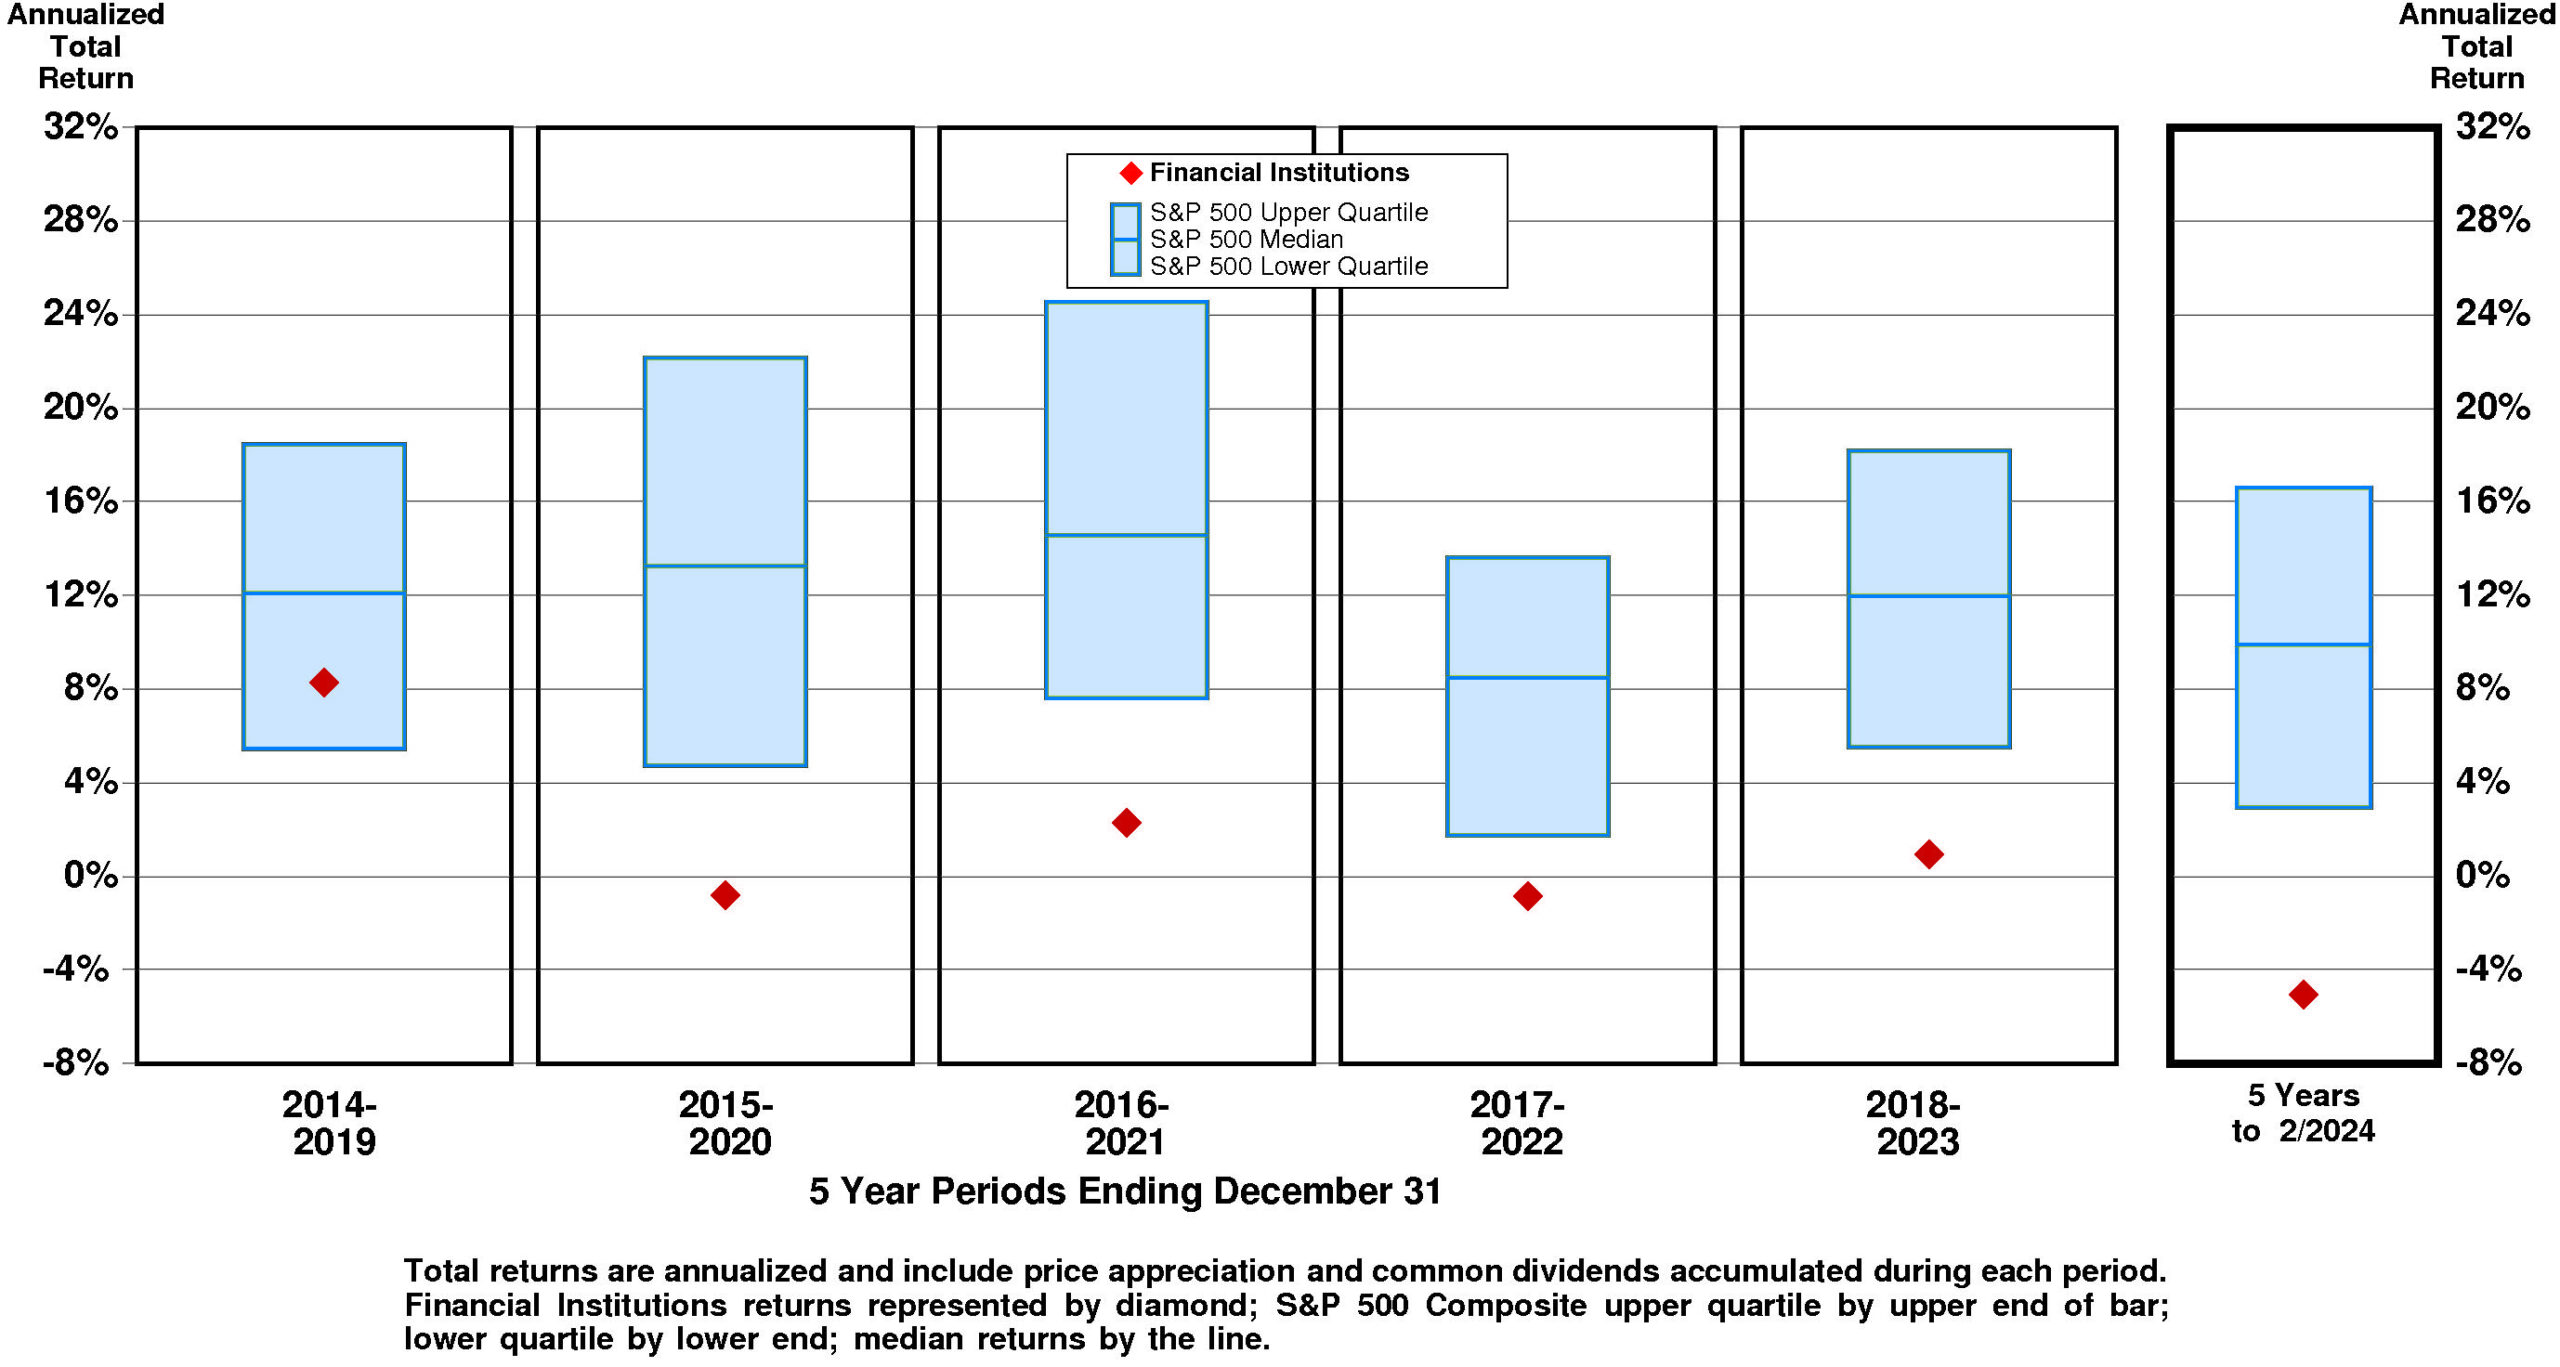
TOTAL INVESTMENT RETURNS
Current annual total return performance of -21.4% is lower quartile relative to the S&P 500 Composite.
In addition to being lower quartile relative to S&P 500 Composite, current annual total return performance through February, 2024 of -21.4% is substantially below median relative to Financial Institutions Inc Peer Group.
Current 5-year total return performance of -5.1% is lower quartile relative to the S&P 500 Composite.
Through February, 2024, with lower quartile current 5-year total return of -5.1% relative to S&P 500 Composite, Financial Institutions’ total return performance is lower quartile relative to Financial Institutions Inc Peer Group.
VALUATION BENCHMARKS
Relative to S&P 500 Composite, FISI’s overall valuation is exceptionally low. All five factors are lower quartile. The highest factor is the ratio of enterprise value/revenue, followed by the ratio of enterprise value/earnings before interest and taxes, then by the price/earnings ratio, then by the price/equity ratio. The lowest factor is the ratio of enterprise value/assets.
Relative to Financial Institutions Peer Group, FISI’s overall valuation is exceptionally low. All five factors are lower quartile. The highest factor is the price/equity ratio, followed by the ratio of enterprise value/earnings before interest and taxes, then by the price/earnings ratio, then by the ratio of enterprise value/assets. The lowest factor is the ratio of enterprise value/revenue.
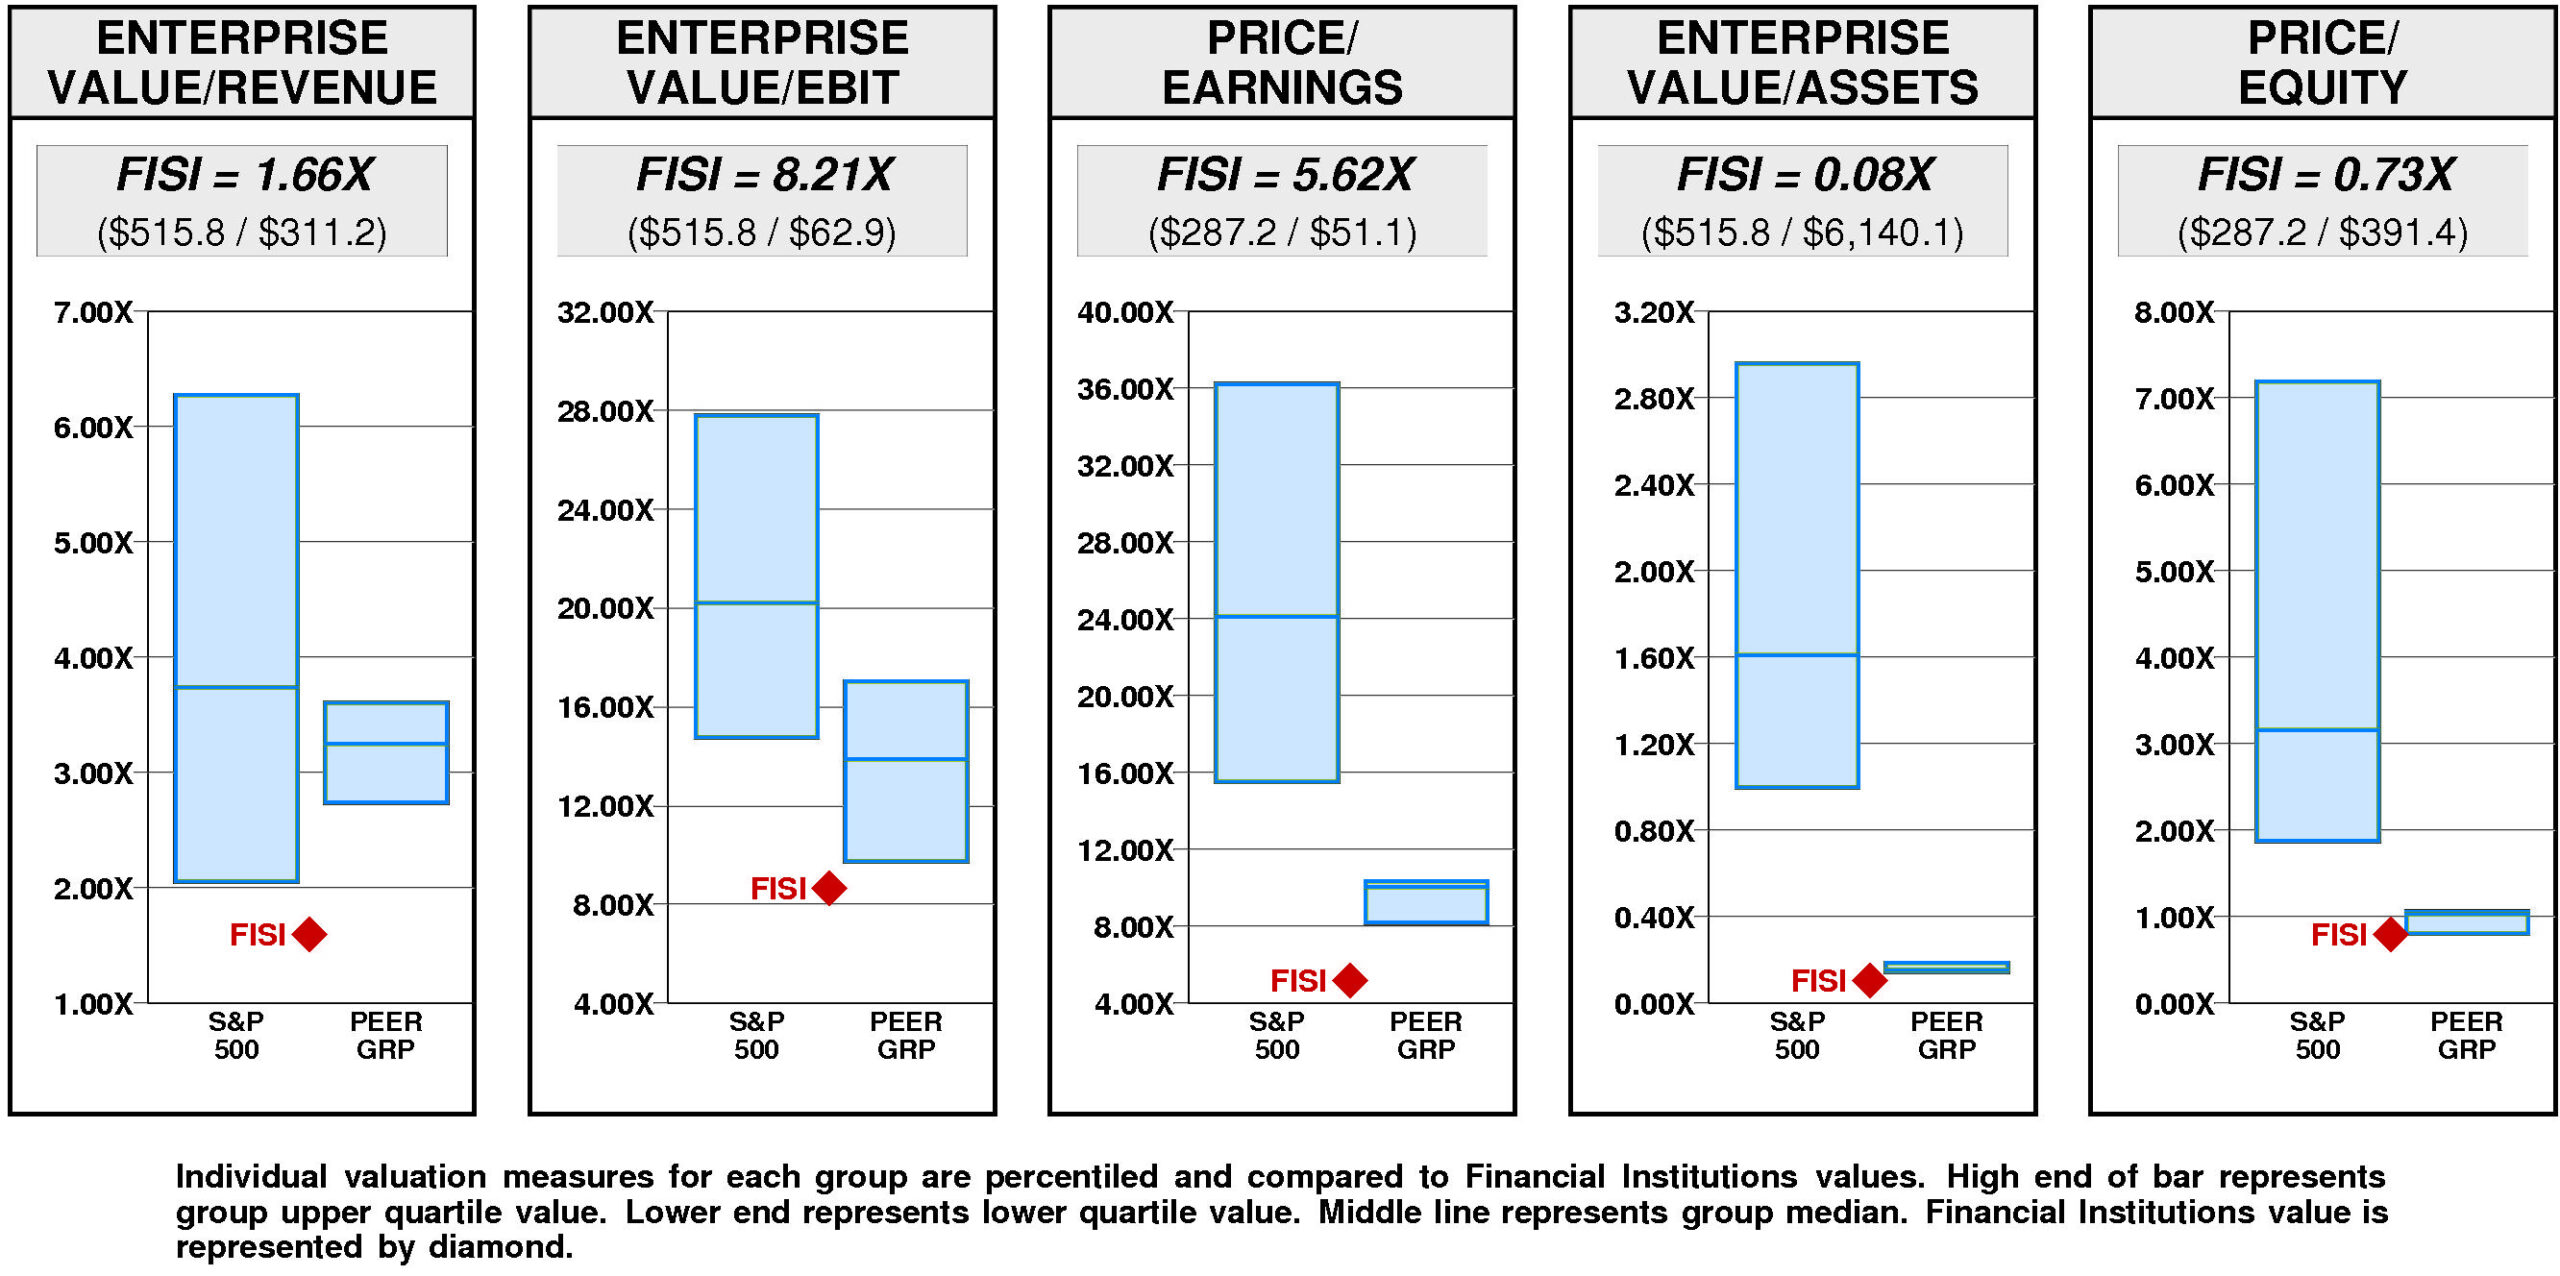
Financial Institutions has a major value gap compared to the median. For FISI to hit median valuation, its current ratio of enterprise value/revenue would have to rise from the current level of 1.66X to 3.25X. If FISI’s ratio of enterprise value/revenue were to rise to 3.25X, its stock price would be higher by $32 to $51.
For FISI to achieve upper quartile valuation relative to the Financial Institutions Peer Group, its current ratio of enterprise value/revenue would have to rise from the current level of 1.66X to 3.61X. If FISI’s ratio of enterprise value/revenue were to rise to 3.61X, its stock price would increase by $39 from the current level of $19.
VALUE TARGETS
FISI’s future returns on capital are forecasted to exceed the cost of capital. Accordingly, the company is expected to continue to be a modest Value Builder.
Financial Institutions’ current Price Target of $55 represents a +196% change from the current price of $18.64.
This very high appreciation potential results in an appreciation score of 86 (only 14% of the universe has greater appreciation potential.)
Reinforcing this high Appreciation Score of 86, the high Power Rating of 74 contributes to an Value Trend Rating of A.
Financial Institutions’ current Price Target is $55 (-5% from the 2022 Target of $58 but +196% from the 03/27/24 price of $18.64). This plateau in the Target is the result of a +10% increase in the equity base and a -14% decrease in the price/equity multiple. The forecasted decline in return on equity has a very large negative impact on the price/equity multiple and the forecasted decline in growth has a slight negative impact as well. Partially offsetting these Drivers, the forecasted decline in cost of equity has a very large positive impact.
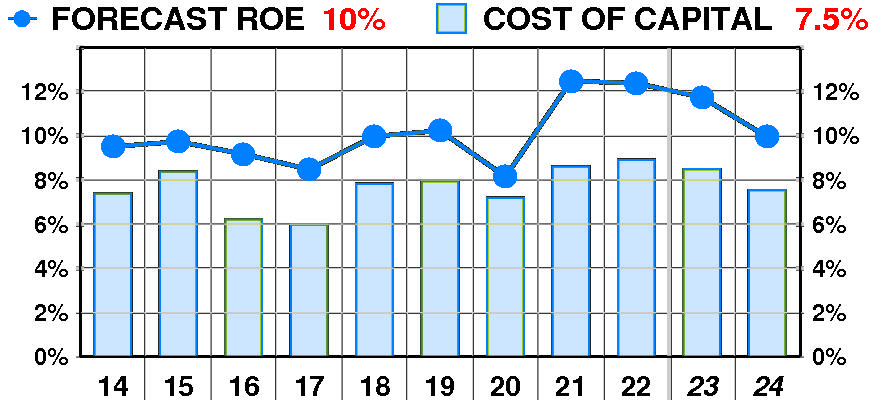
PTR’s return on equity forecast is 9.9% — slightly below our recent forecasts. Forecasted return on equity enjoyed a dramatic, erratic increase between 2014 and 2022. The current forecast is steady at the 2020 low of 8%.
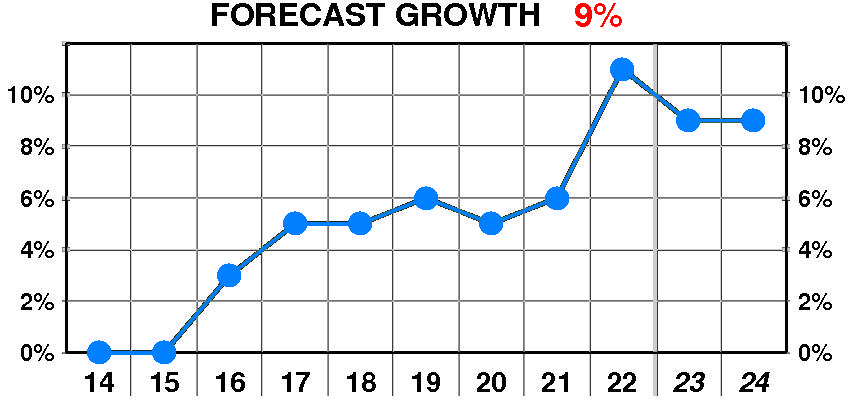
PTR’s growth forecast is 9.0% — slightly below our recent forecasts. Forecasted growth enjoyed a dramatic, variable increase between 2016 and 2022. The current forecast is well above the 2016 low of 3%.
PTR’s cost of equity forecast is 7.5% — in line with recent levels. Forecasted cost of equity suffered a dramatic, erratic increase between 2014 and 2022. The current forecast is steady at the 2017 low of 6.0%.
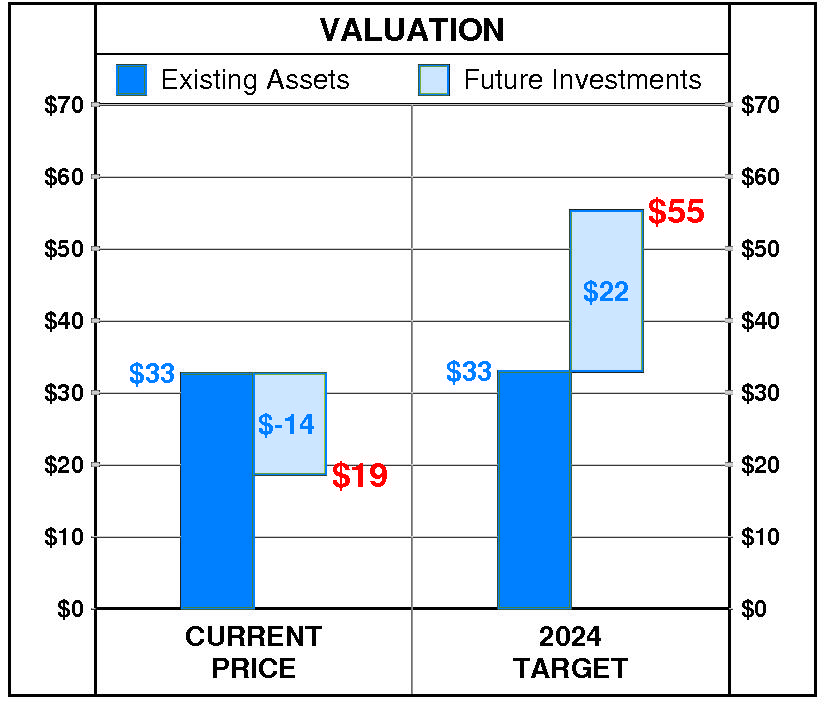
At Financial Institutions’ current price of $18.64, investors are placing a negative value of $-14 on its future investments. This view is not supported by the company’s most recent performance that reflected a growth rate of 11.0% per year, and a return on equity of 12.4% versus a cost of equity of 8.9%.
PTR’s 2024 Price Target of $55 is based on these forecasts and reflects an estimated value of existing assets of $33 and a value of future investments of $22.
Be the first to comment