BUSINESS
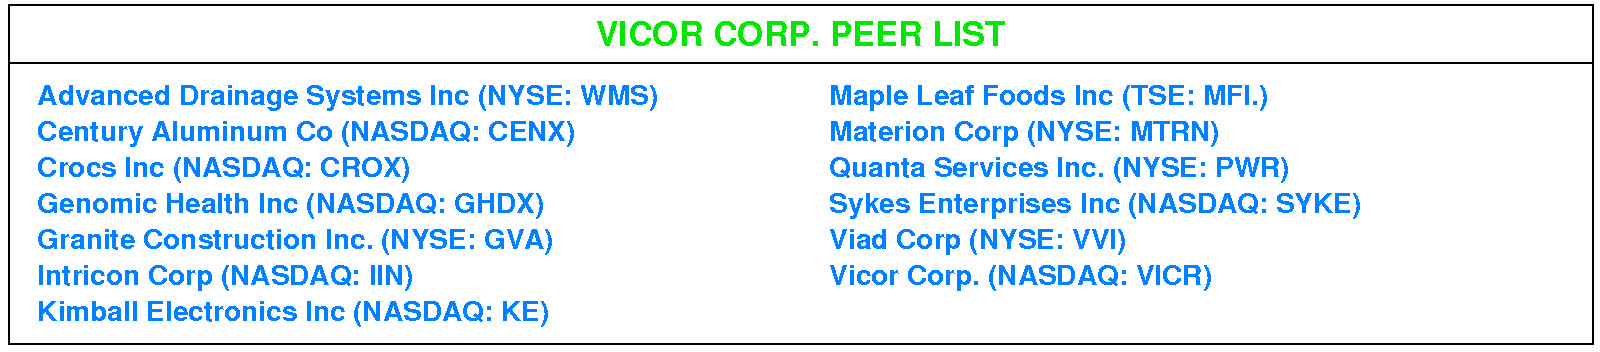
Vicor Corporation, together with its subsidiaries, designs, develops, manufactures, and markets modular power components and power systems for converting electrical power in the United States, Europe, the Asia Pacific, and internationally. The company offers a range of brick-format DC-DC converters; complementary components; and input and output voltage, and output power products, as well as electrical and mechanical accessories. It also provides custom power systems solutions. The company serves independent manufacturers of electronic devices, original equipment manufacturers, and their contract manufacturers in the aerospace and aviation, defense electronics, industrial automation and equipment, instrumentation, test equipment, solid state lighting, telecommunications and networking infrastructure, and vehicles and transportation markets.
INVESTMENT RATING
Reflecting future returns on capital that are forecasted to be above the cost of capital, VICR is expected to continue to be a modest Value Builder.
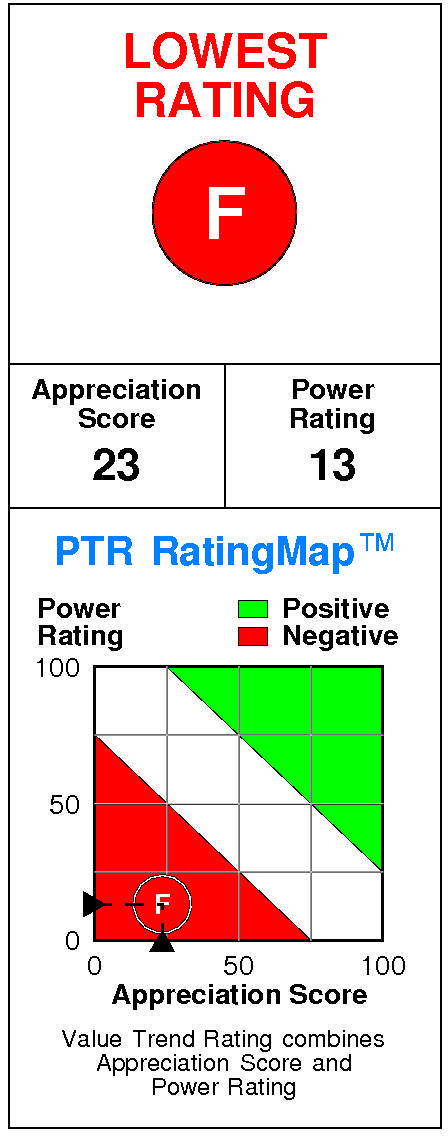
Vicor has a current Value Trend Rating of F (Lowest Rating).
With this rating, PTR's two proprietary measures of a stock's current attractiveness are providing consistent signals. Vicor has a poor Appreciation Score of 23 and a very low Power Rating of 13, triggering the Lowest Value Trend Rating.
Vicor's stock is selling significantly above targeted value.
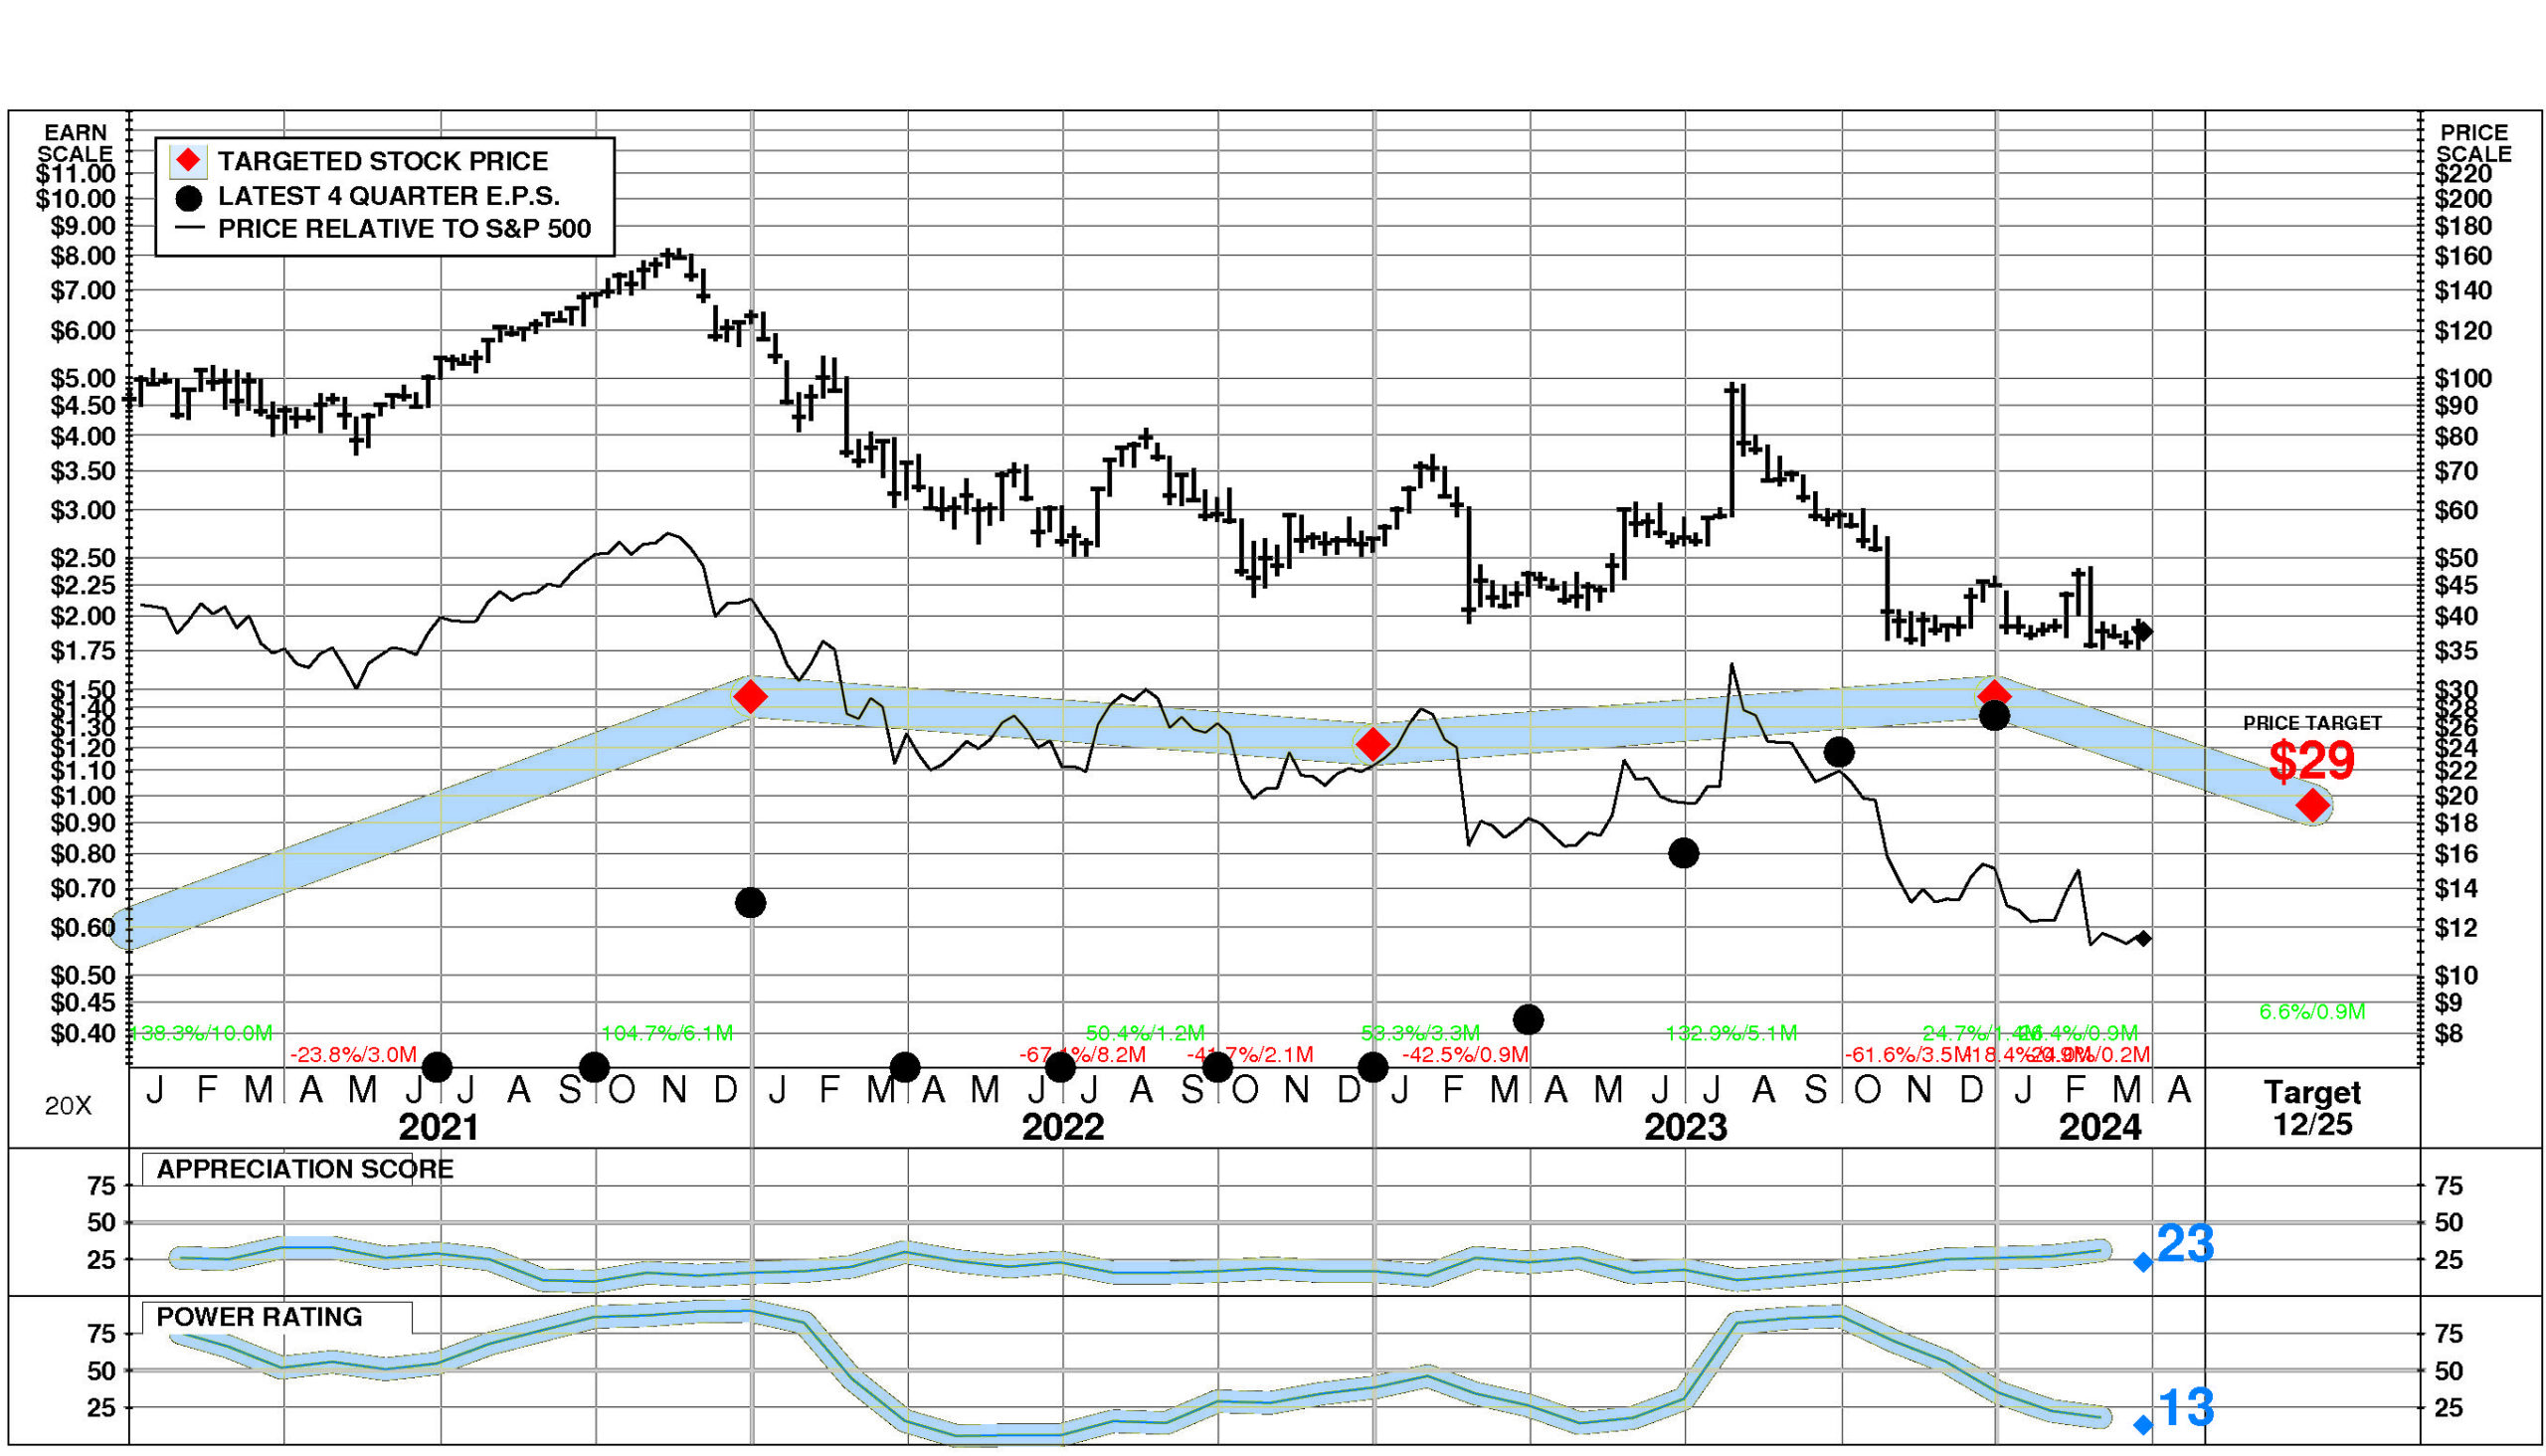
The current stock price of $37.60 compares to targeted value 12 months forward of $19.
Vicor's low appreciation potential results in an appreciation score of 23 (77% of the universe has greater appreciation potential.)
Vicor has a Power Rating of 13.
(Vicor's very low Power Rating indicates that it only has a higher likelihood of achieving favorable investment performance over the near to intermediate term than 13% of companies in the universe.)
Factors contributing to this very low Power Rating include: recent price action has been extremely unfavorable; the Electronic Components, NEC comparison group is in a slightly weakened position currently; and earnings estimate behavior for Vicor has been slightly negative recently.
INVESTMENT PROFILE
Vicor's financial strength is high. Financial strength rating is 72.
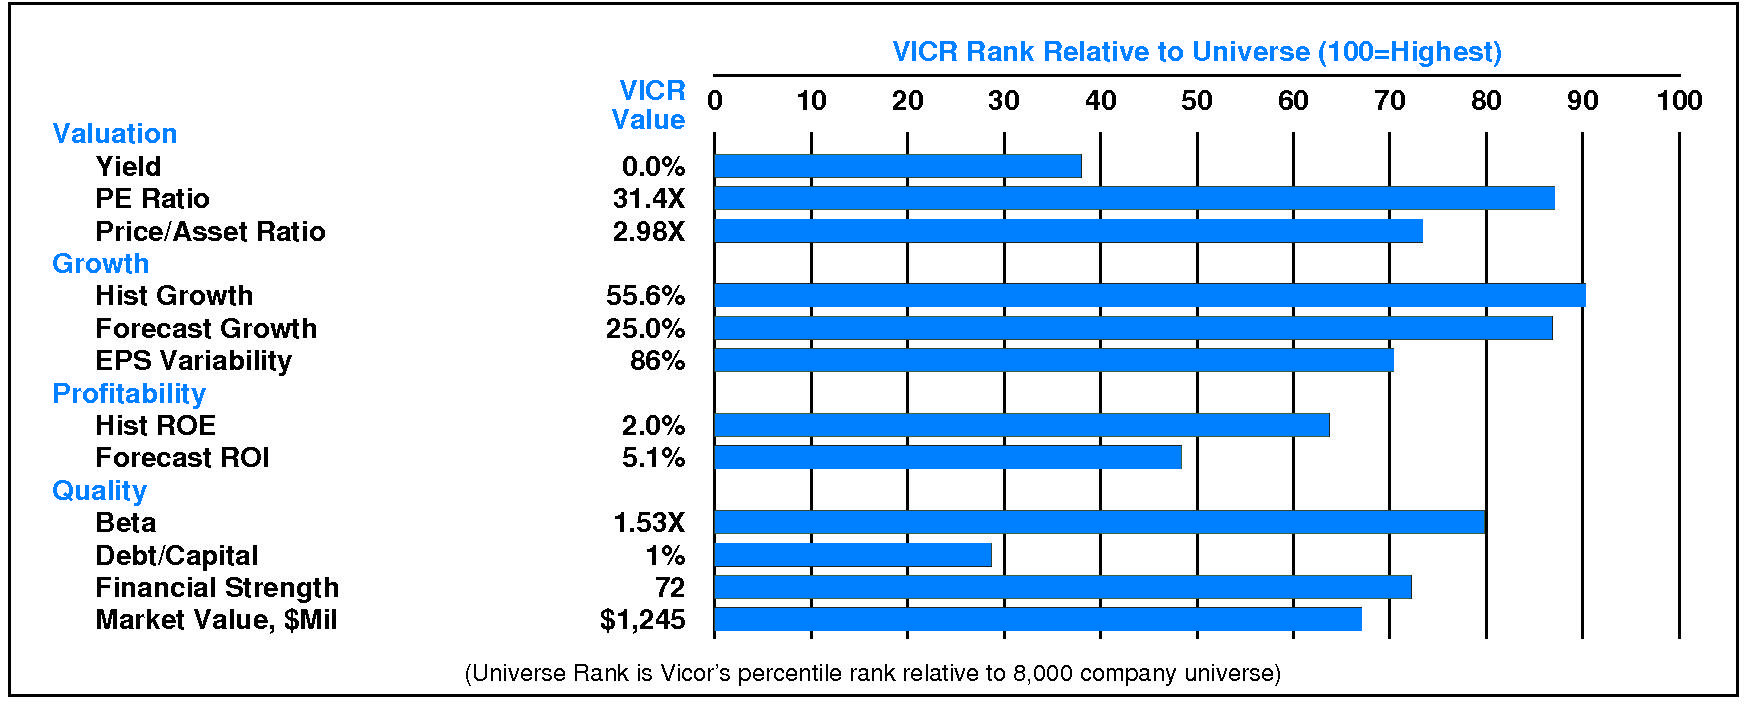
Relative to the S&P 500 Composite, Vicor Corp. has both Growth and Value characteristics; its appeal is likely to be to Capital Gain-oriented investors; the perception is that VICR is normal risk.
Relative weaknesses include: low forecasted profitability, low historical profitability, high stock price volatility, and high earnings variability. Vicor's valuation is high: low dividend yield, high P/E ratio, and moderate price/book ratio. VICR has unusually low market capitalization.
CURRENT SIGNALS
Vicor's current operations are eroding.
Return on equity is falling, reflecting: falling asset utilization; declining pretax margin; falling tax keep rate; and falling leverage.
Vicor's current technical position is very weak.
The stock price is in a 0.2 month down move. The stock has declined 19.4% from its prior high. The stock price is below its 200 day moving average which is in a downtrend.
ALERTS
Vicor Corp. (NASDAQ: VICR) has recently experienced moderate negative changes in fundamentals. Negative developments: the consensus estimate for December, 2024 decreased significantly, and the consensus estimate for December, 2025 decreased significantly. Positive development: significant quarterly earnings acceleration occurred.
The stock is currently rated F.
On 3/25/24, Vicor Corp. (NASDAQ: VICR) stock declined modestly by -1.2%, closing at $37.60. However, trading volume in this decline was unusually low at 63% of normal. Relative to the market the stock has been extremely weak over the last nine months but has risen 4.2% during the last week.
CASH FLOW
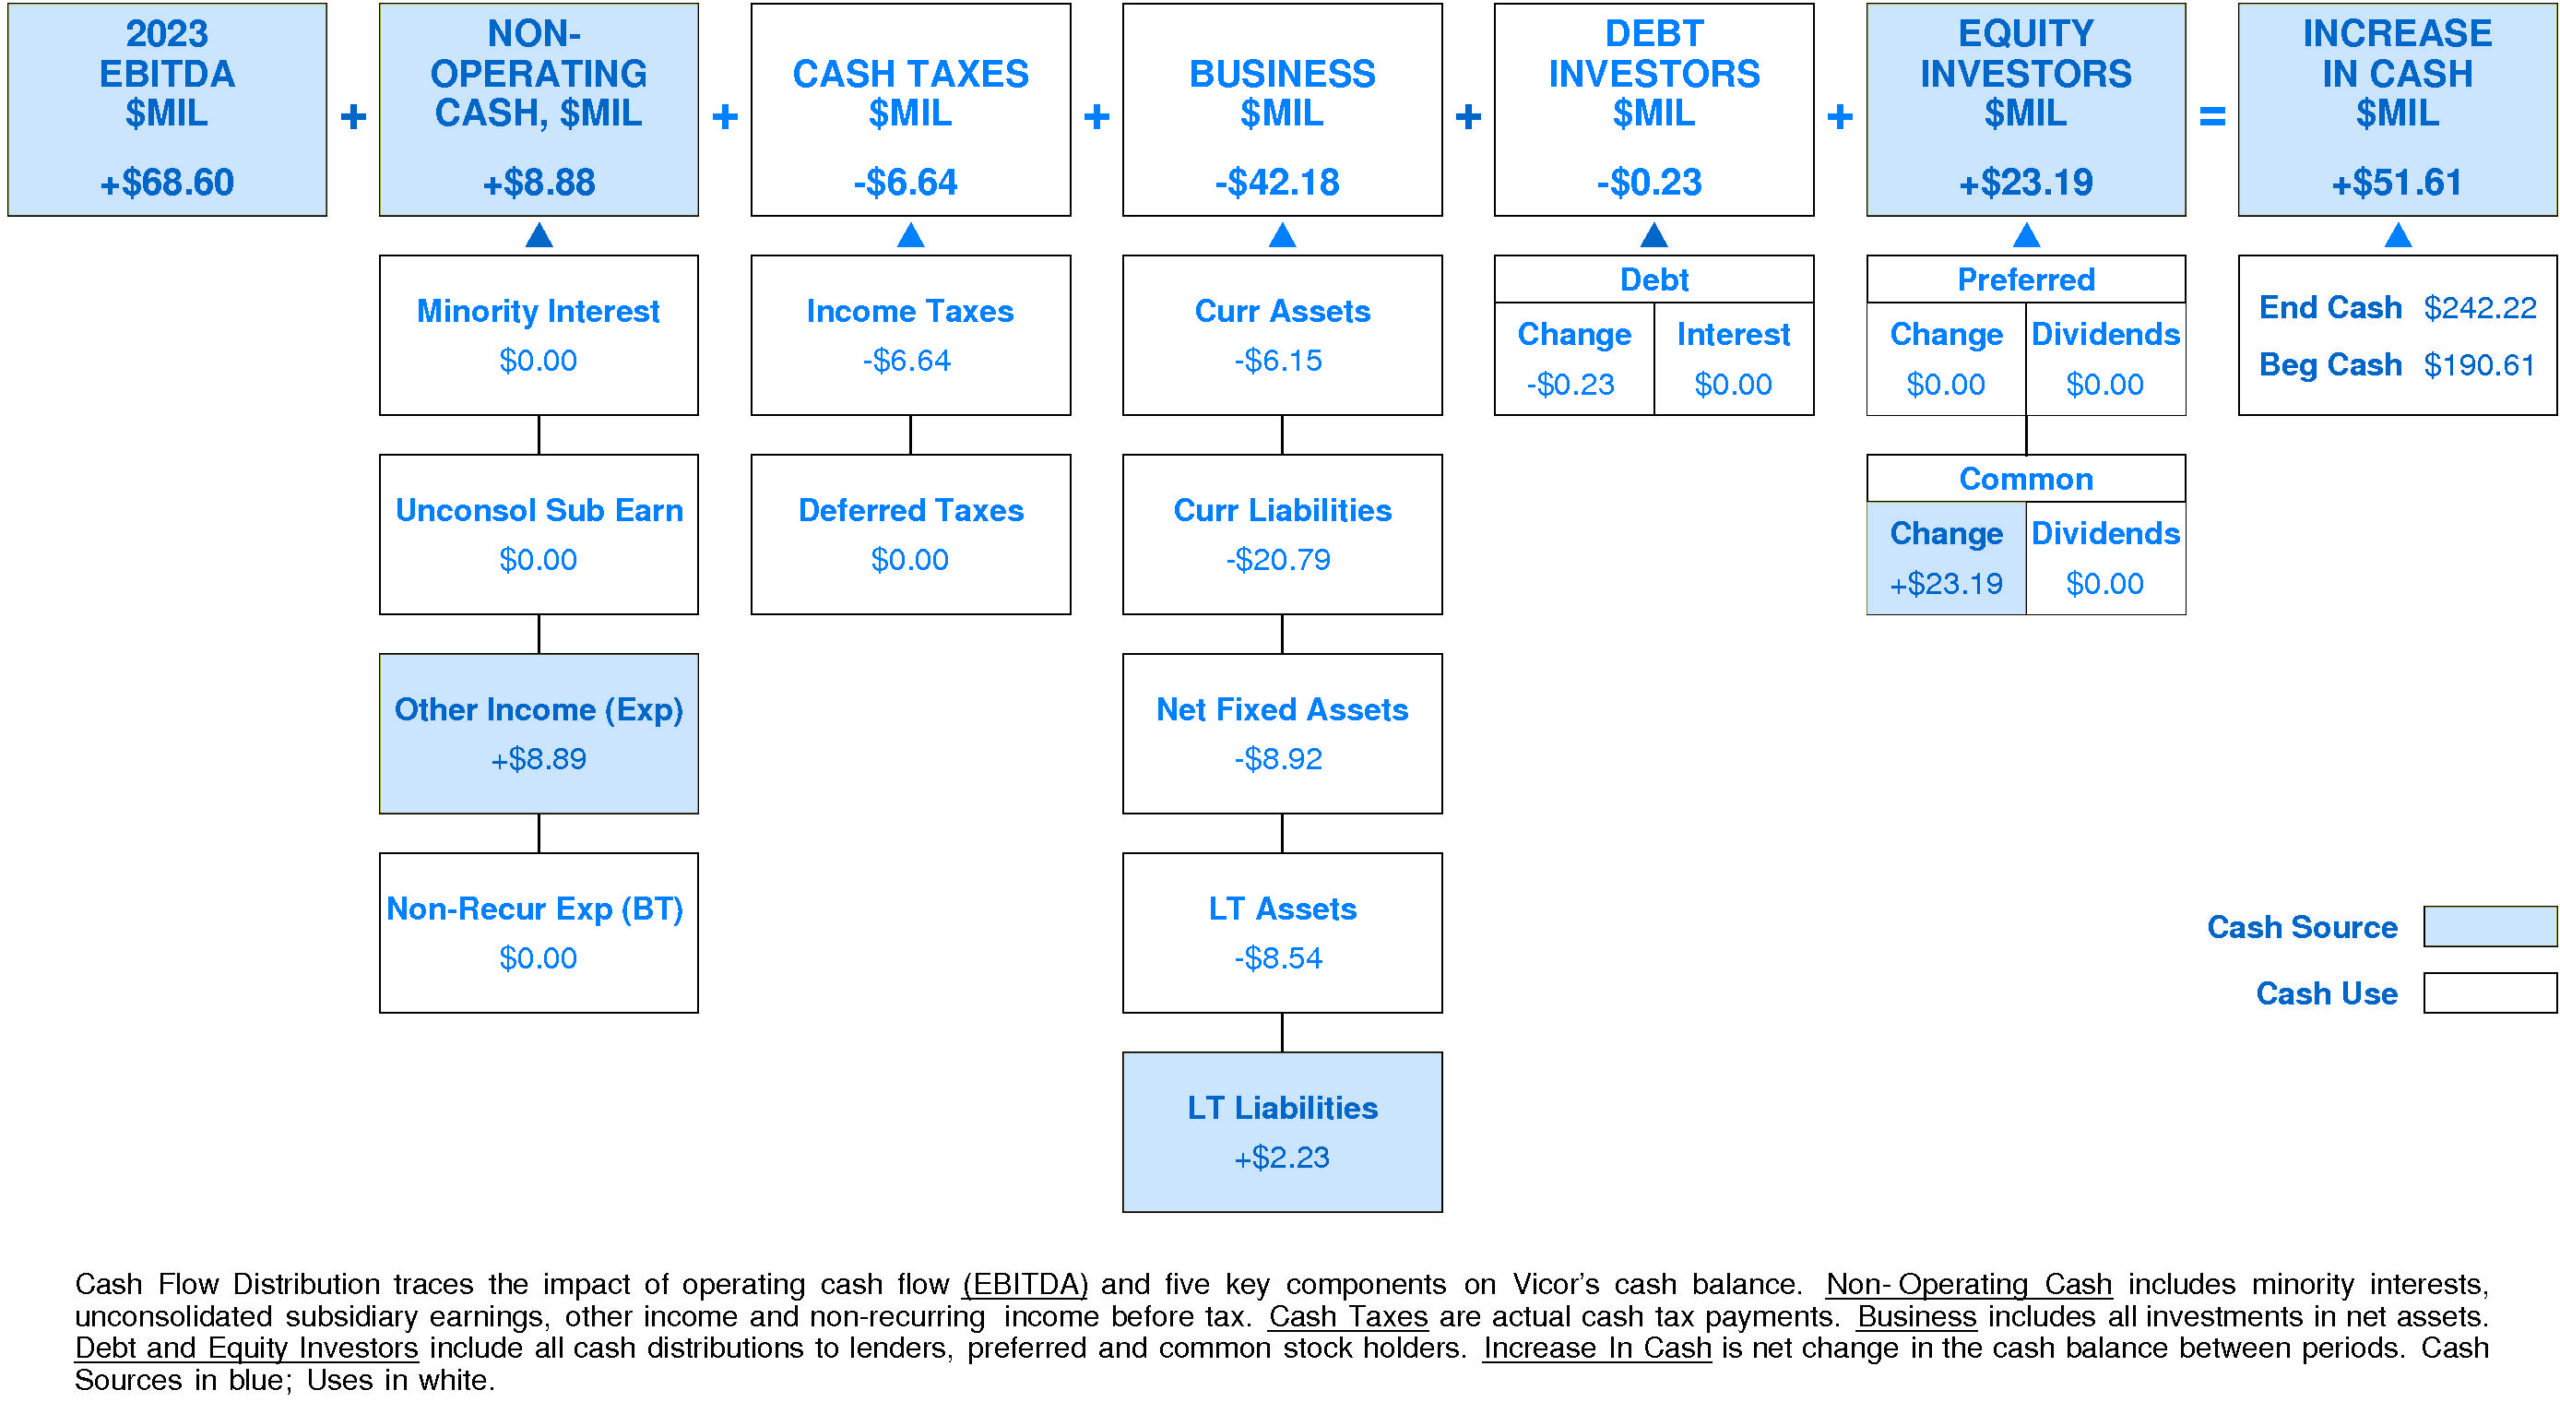
In 2023, Vicor generated a very significant increase in cash of +$51.61 million (+27%). Sources of cash were much larger than uses.
Cash generated from 2023 EBITDA totaled +$68.60 million. Non-operating sources contributed +$8.88 million (+13% of EBITDA). Cash taxes consumed -$6.64 million (-10% of EBITDA). Re-investment in the business amounted to -$42.18 million (-61% of EBITDA). On a net basis, debt investors removed -$0.23 million (-0% of EBITDA) while equity investors supplied +$23.19 million (+34% of EBITDA).
Vicor's Non-operating Income, %EBITDA has suffered a very strong overall downtrend over the period.
This downtrend was accompanied by stability for the Vicor Peer Group. In most years, Vicor was in the top quartile. Currently, Vicor is upper quartile at +13% of EBITDA (+$8.88 million).
Vicor's Cash Taxes, %EBITDA has exhibited little to no overall change over the period.
This stability was accompanied by an uptrend for the Vicor Peer Group. (Since 2021 Cash Taxes, %EBITDA has experienced a very sharp decline.) In most years, Vicor was in the second quartile and top quartile. Currently, Vicor is at the upper quartile at -10% of EBITDA (-$6.64 million).
Vicor's Business Re-investment, %EBITDA has enjoyed a volatile overall uptrend over the period.
This improvement was accompanied by an opposite trend for the Vicor Peer Group. In most years, Vicor was in the third quartile and second quartile. Currently, Vicor is slightly above median at -61% of EBITDA (-$42.18 million).
Vicor's Debt Investors, %EBITDA has exhibited little to no overall change over the period.
This stability was accompanied by an uptrend for the Vicor Peer Group. In most years, Vicor was in the second quartile and third quartile. Currently, Vicor is below median at -0% of EBITDA (-$0.23 million).
Vicor's Equity Investors, %EBITDA has enjoyed a volatile overall uptrend over the period.
This improvement was accompanied by stability for the Vicor Peer Group. (Since 2020 Equity Investors, %EBITDA has experienced a very sharp decline.) In most years, Vicor was in the top quartile. Currently, Vicor is upper quartile at +34% of EBITDA (+$23.19 million).
Vicor's Change in Cash, %EBITDA has experienced a volatile overall uptrend over the period.
This improvement was accompanied by stability for the Vicor Peer Group. In most years, Vicor was in the top quartile. Currently, Vicor is upper quartile at +75% of EBITDA (+$51.61 million).
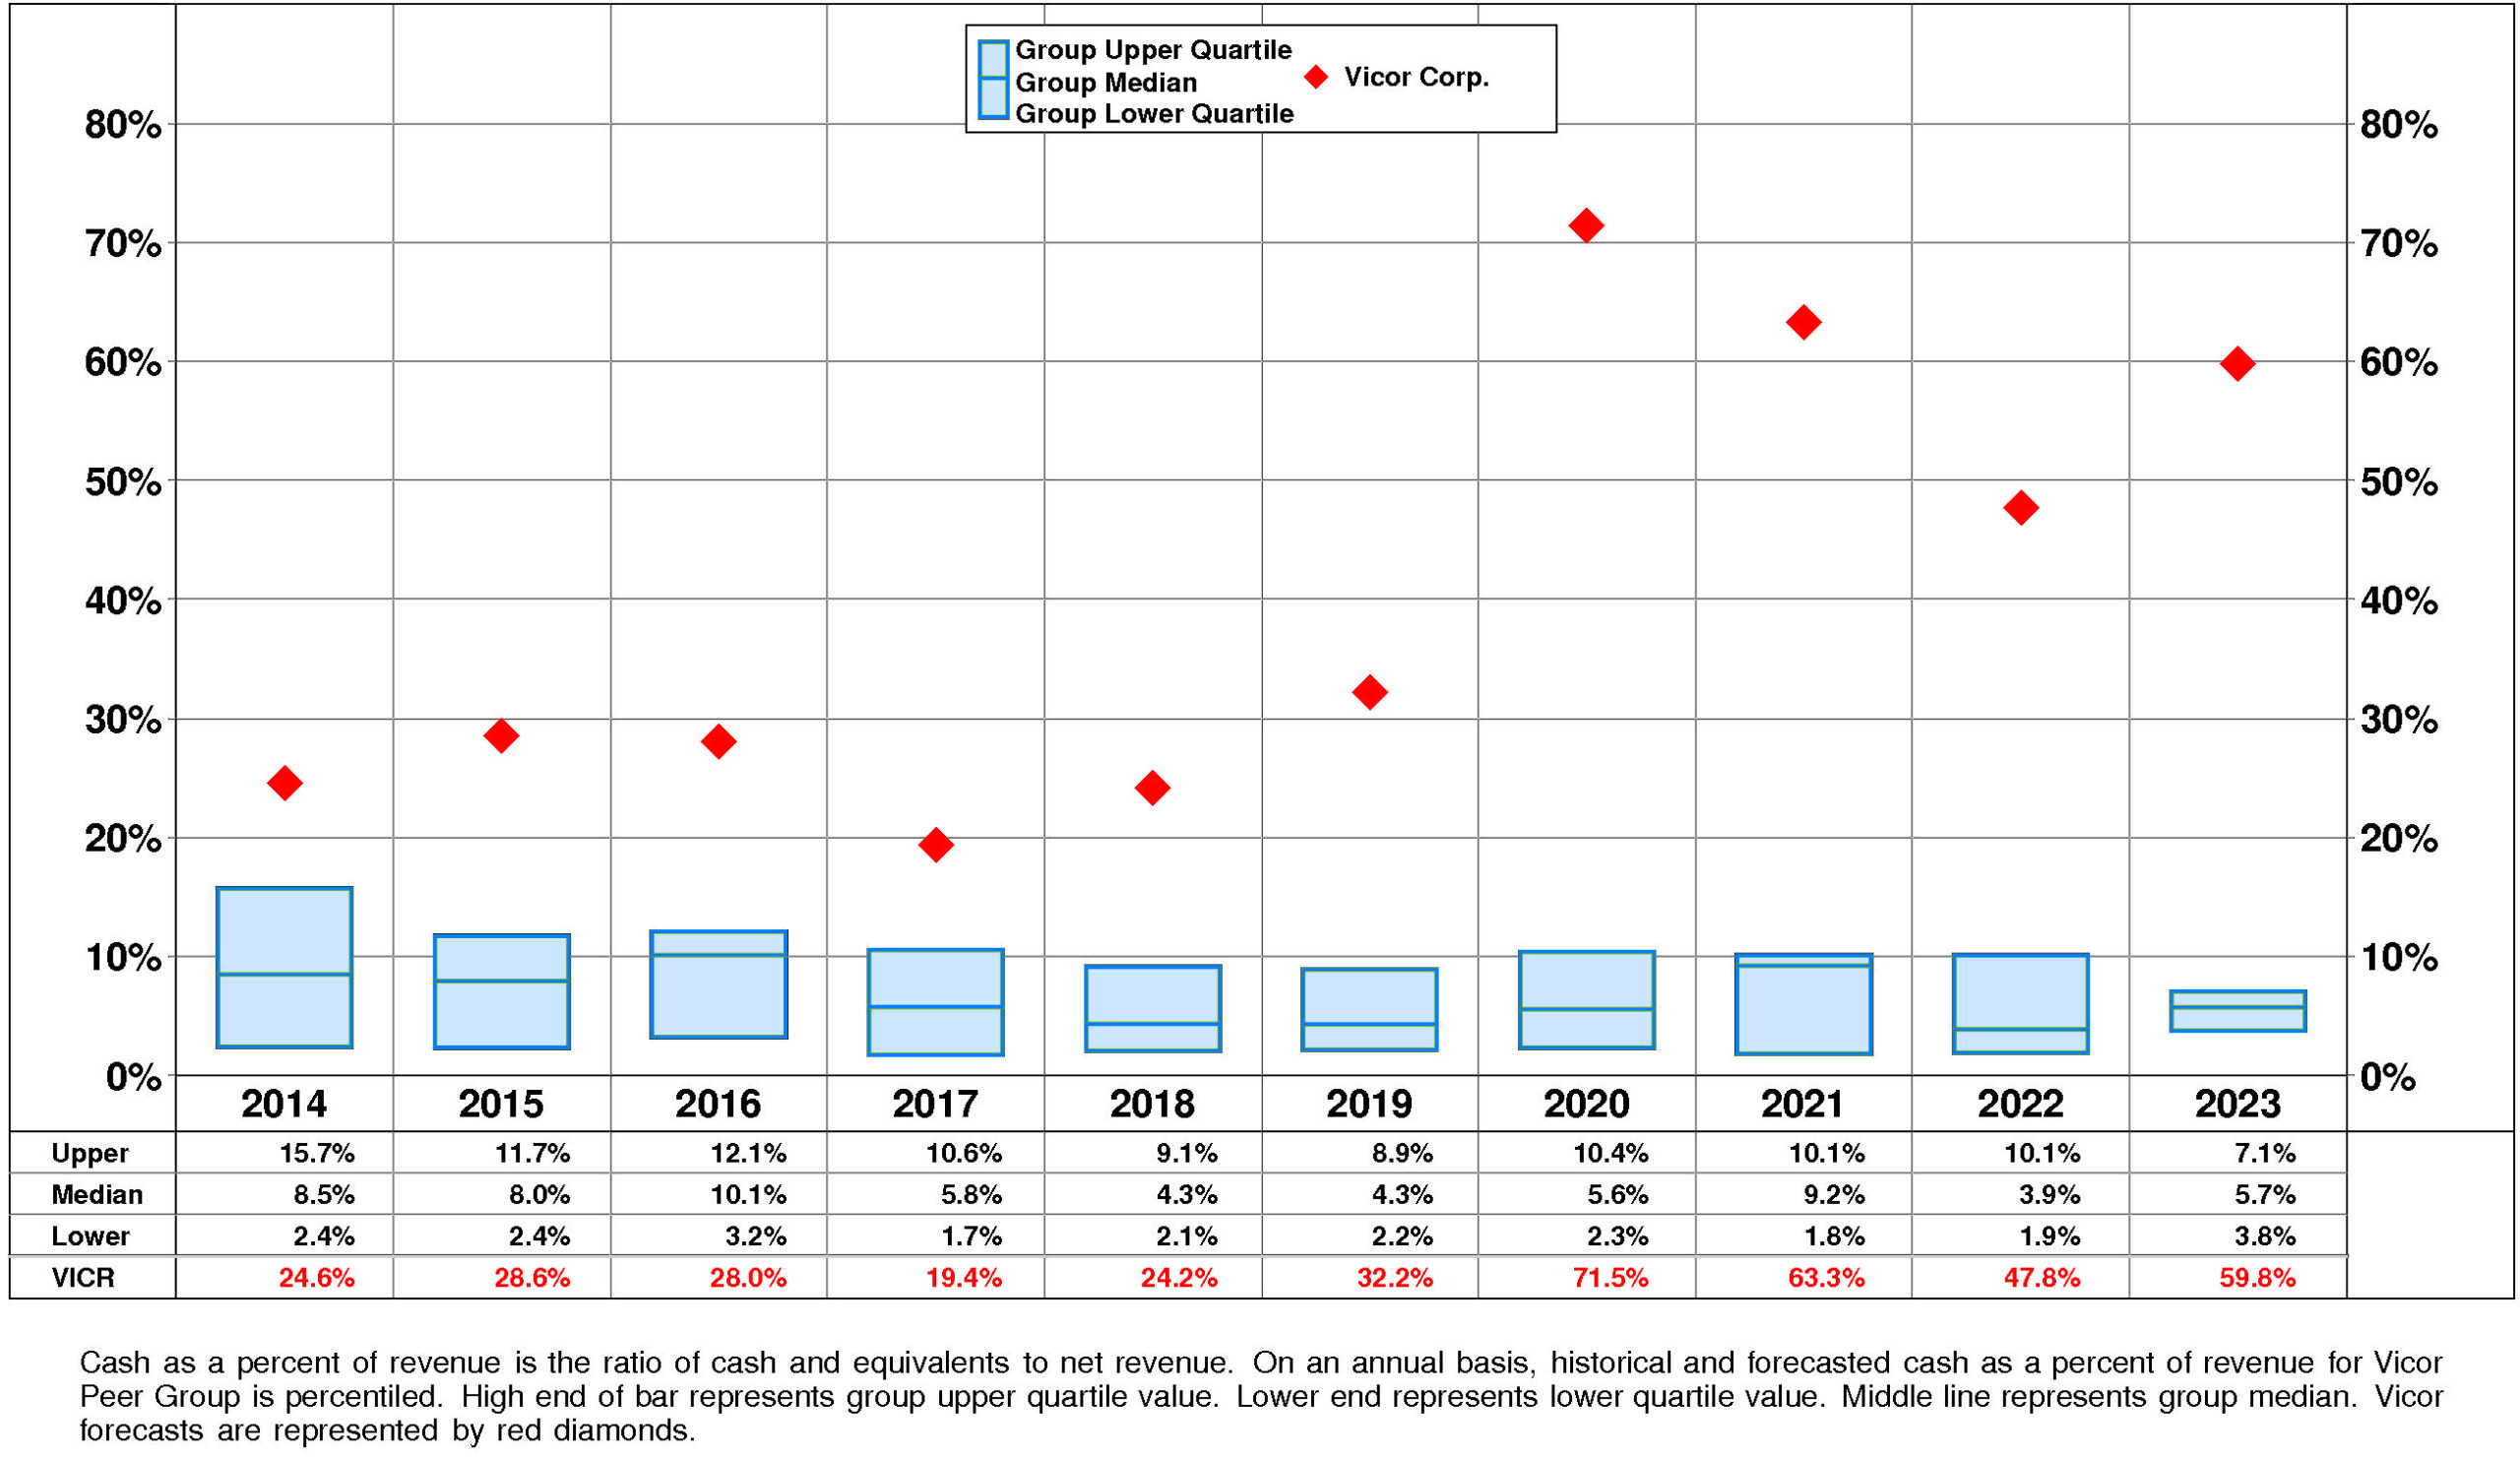
Vicor's Cash, %Revenue has enjoyed a very strong overall uptrend over the period.
This improvement was accompanied by stability for the Vicor Peer Group. (Since 2020 Cash, %Revenue has experienced a very sharp decline.) In most years, Vicor was in the top quartile. Currently, Vicor is upper quartile at +60%.
PROFITABILITY
Vicor's return on equity has improved very significantly since 2015. The current level of 9.9% is 2.72X the low for the period and is -42.6% from the high.
Vicor's very strong positive trend in pretax operating return significantly augmented by a strong positive trend in non-operating factors is a major performance consideration.
The productivity of Vicor's assets declined over the full period 2014-2023: asset turnover has suffered a very strong overall downtrend.
More than offsetting this trend, however, pretax margin enjoyed a very strong overall uptrend that decelerated very sharply from the 2022 level.
Non-operating factors (income taxes and financial leverage) had a significant positive influence on return on equity.
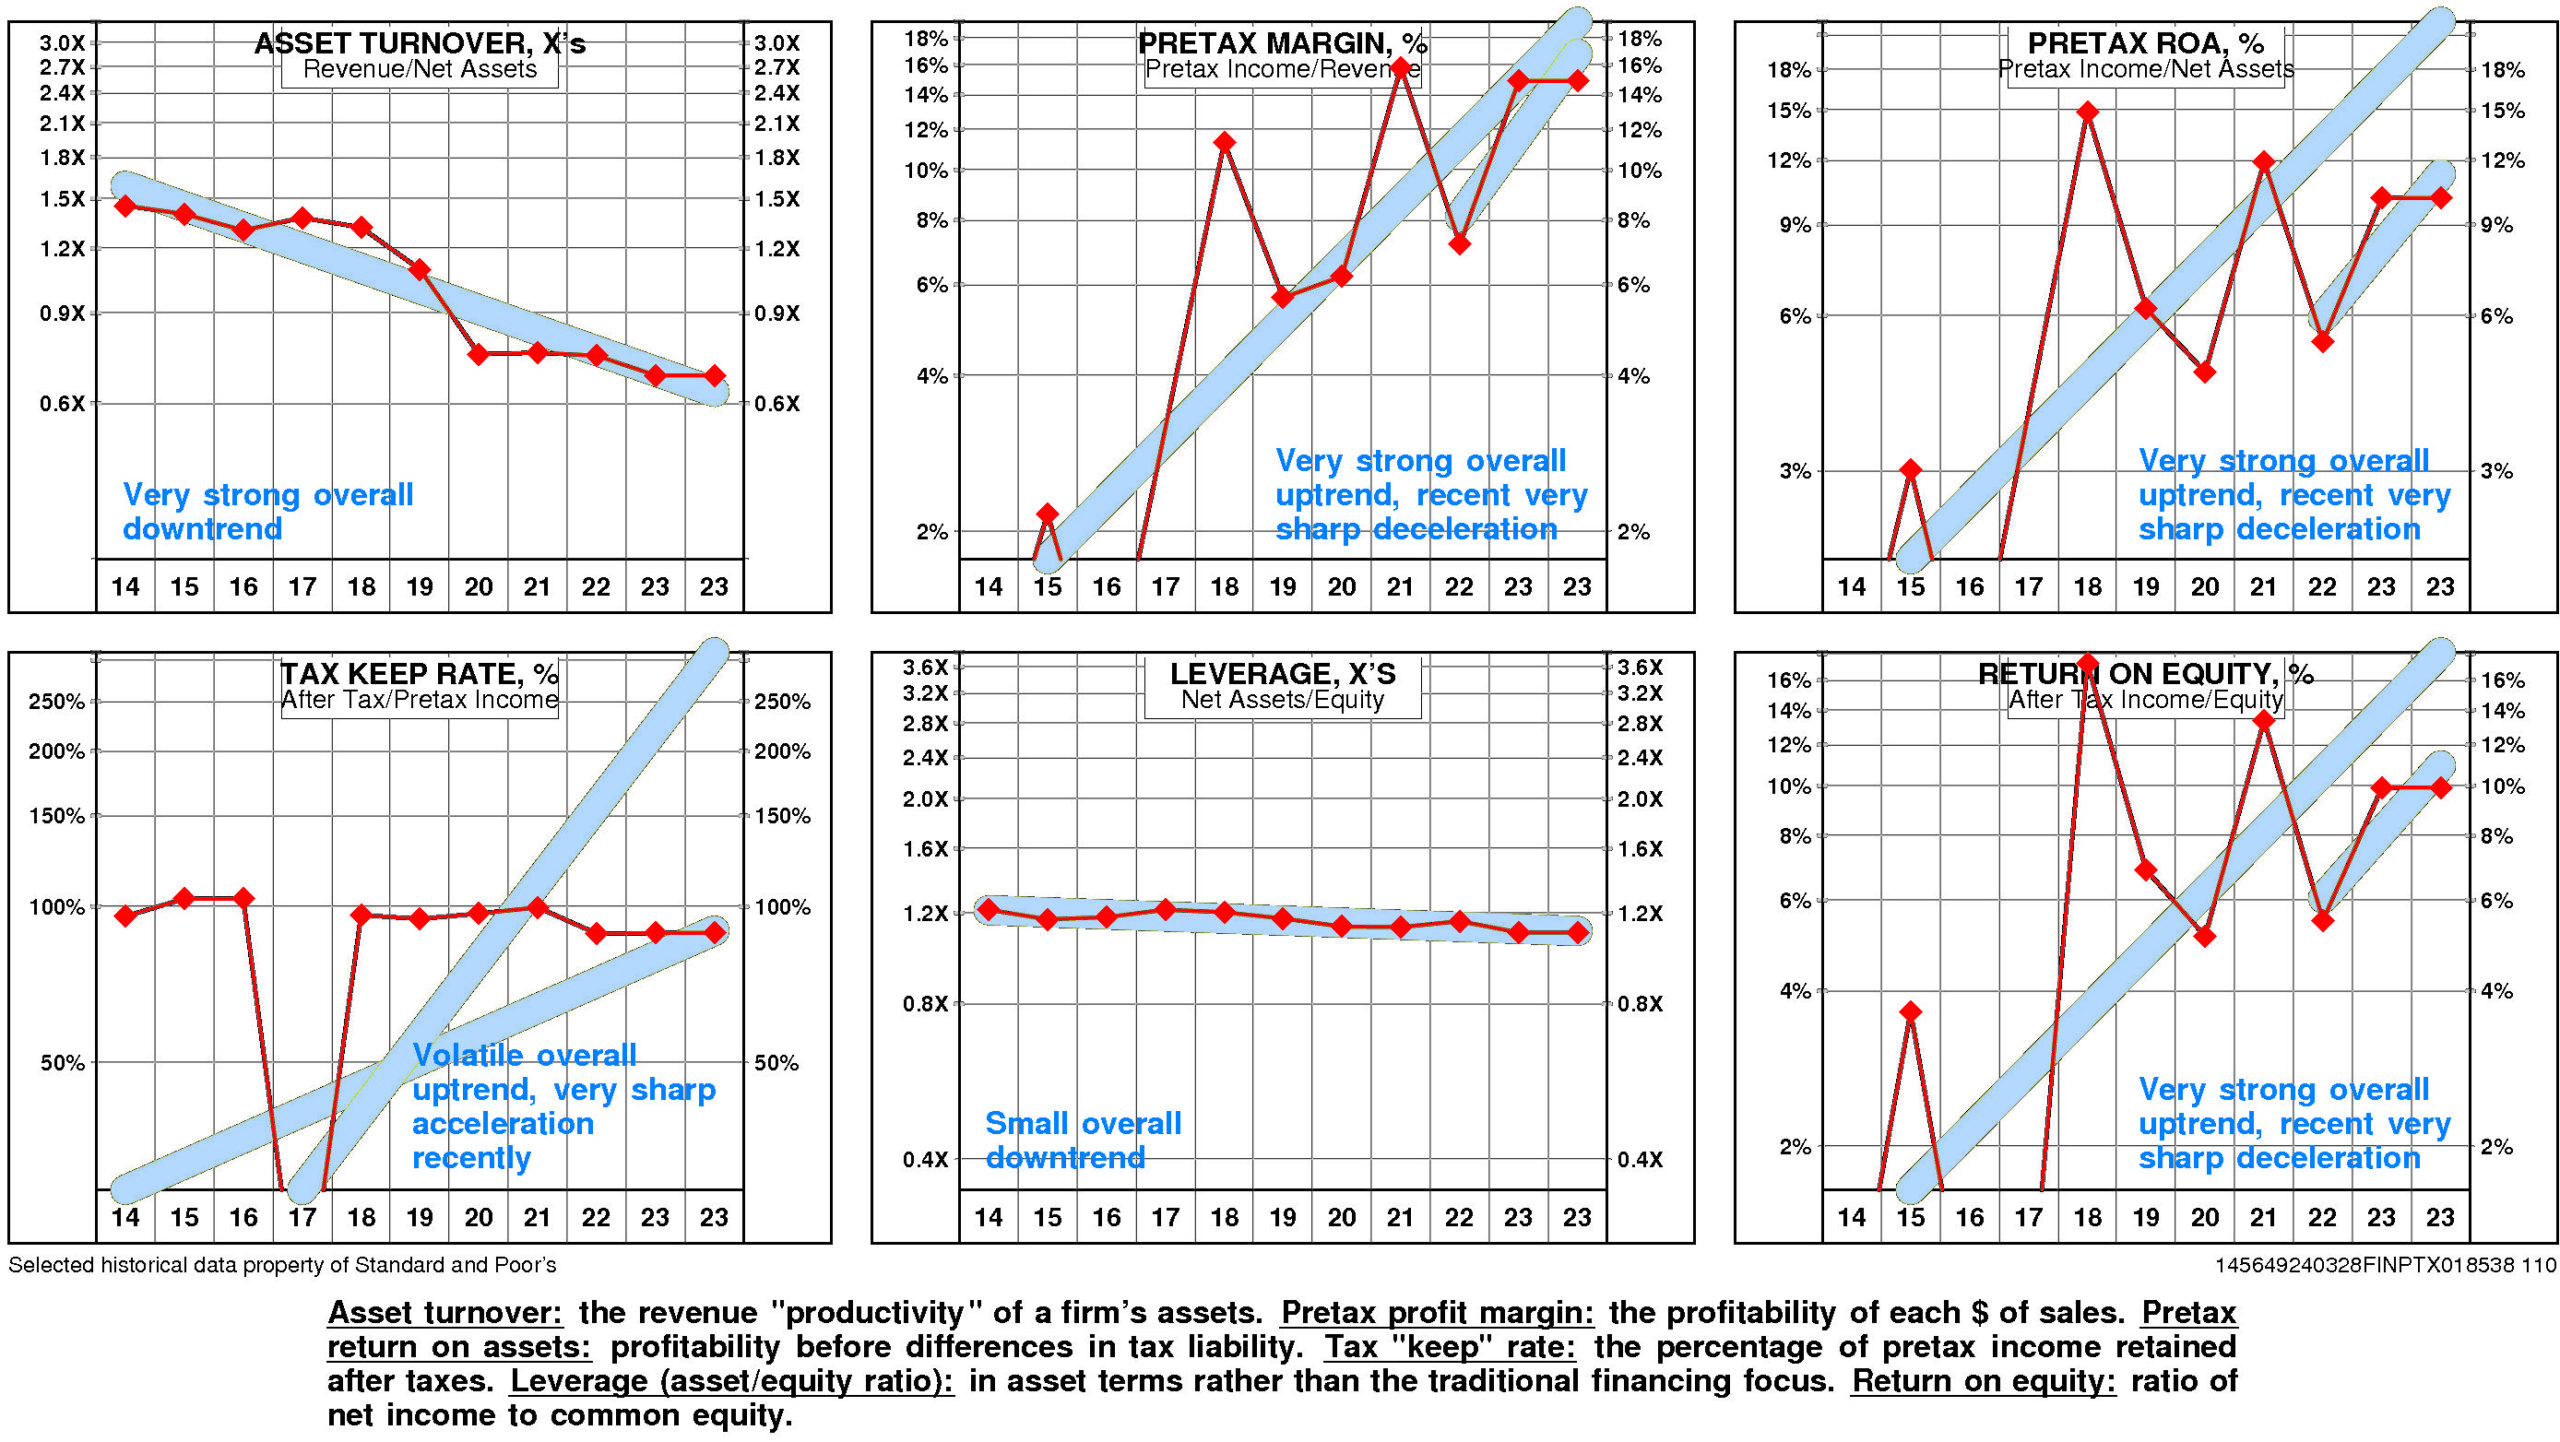
Vicor's return on equity is at median (9.9%) for the four quarters ended December, 2023.
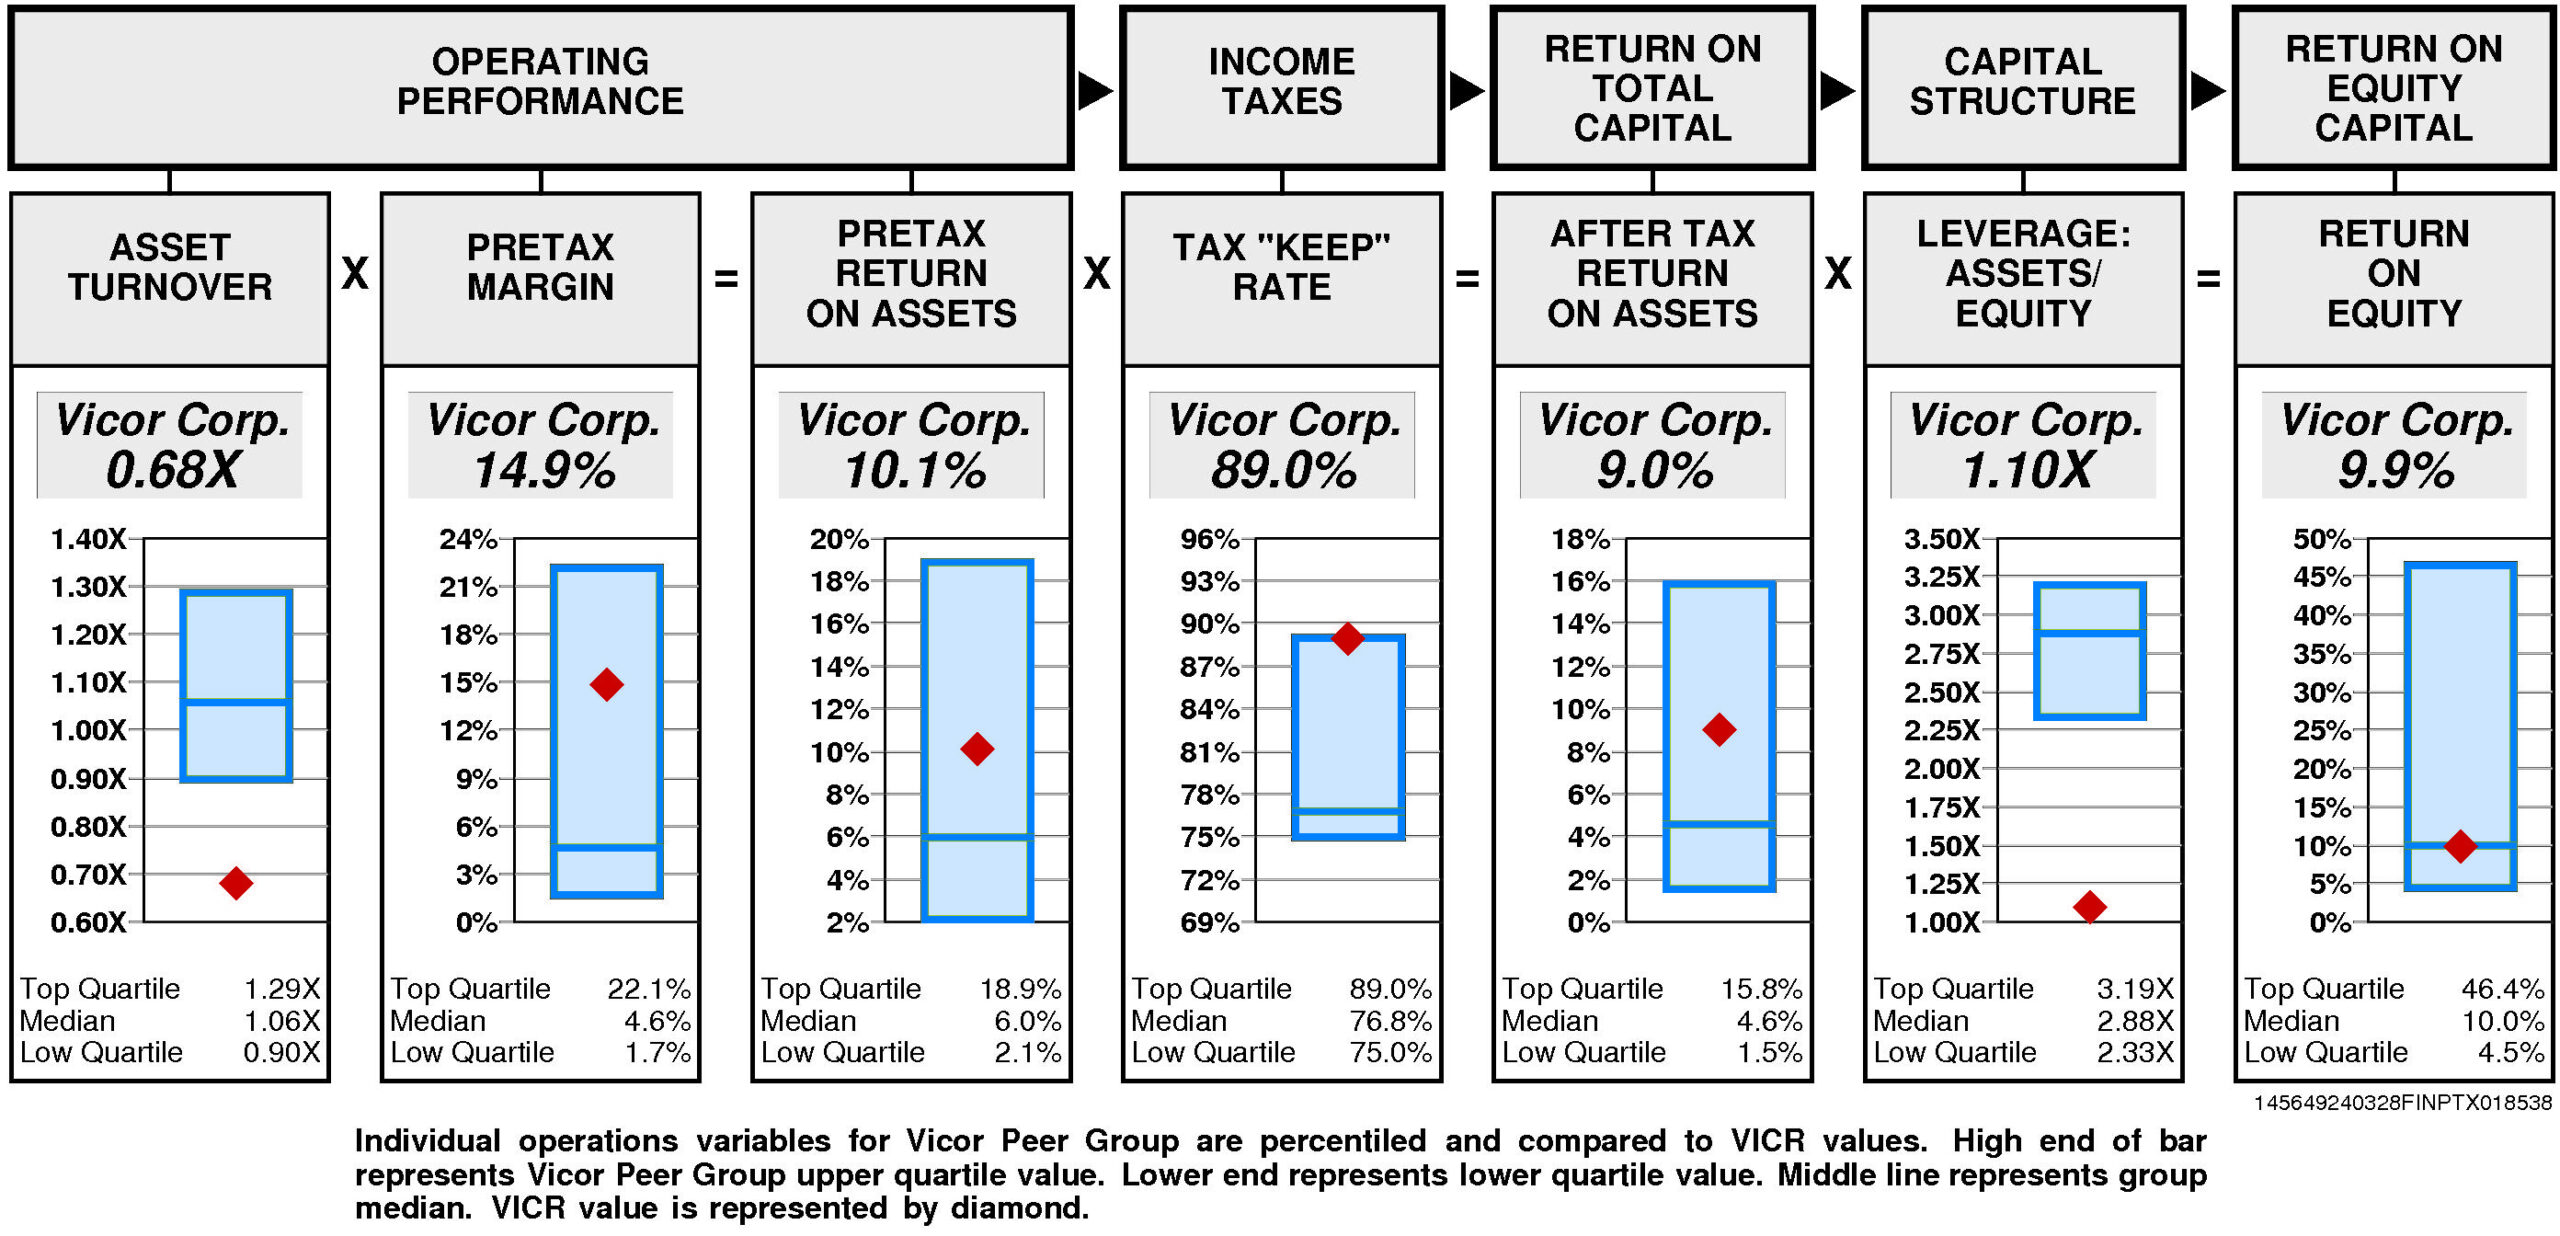
Operating performance (pretax return on assets) is above median (10.1%) reflecting asset turnover that is lower quartile (0.68X) and above median pretax margin (14.9%).
Tax “keep” rate (income tax management) is at the upper quartile (89.0%) resulting in after tax return on assets that is above median.
Financial leverage (leverage) is lower quartile (1.10X).
GROWTH RATES
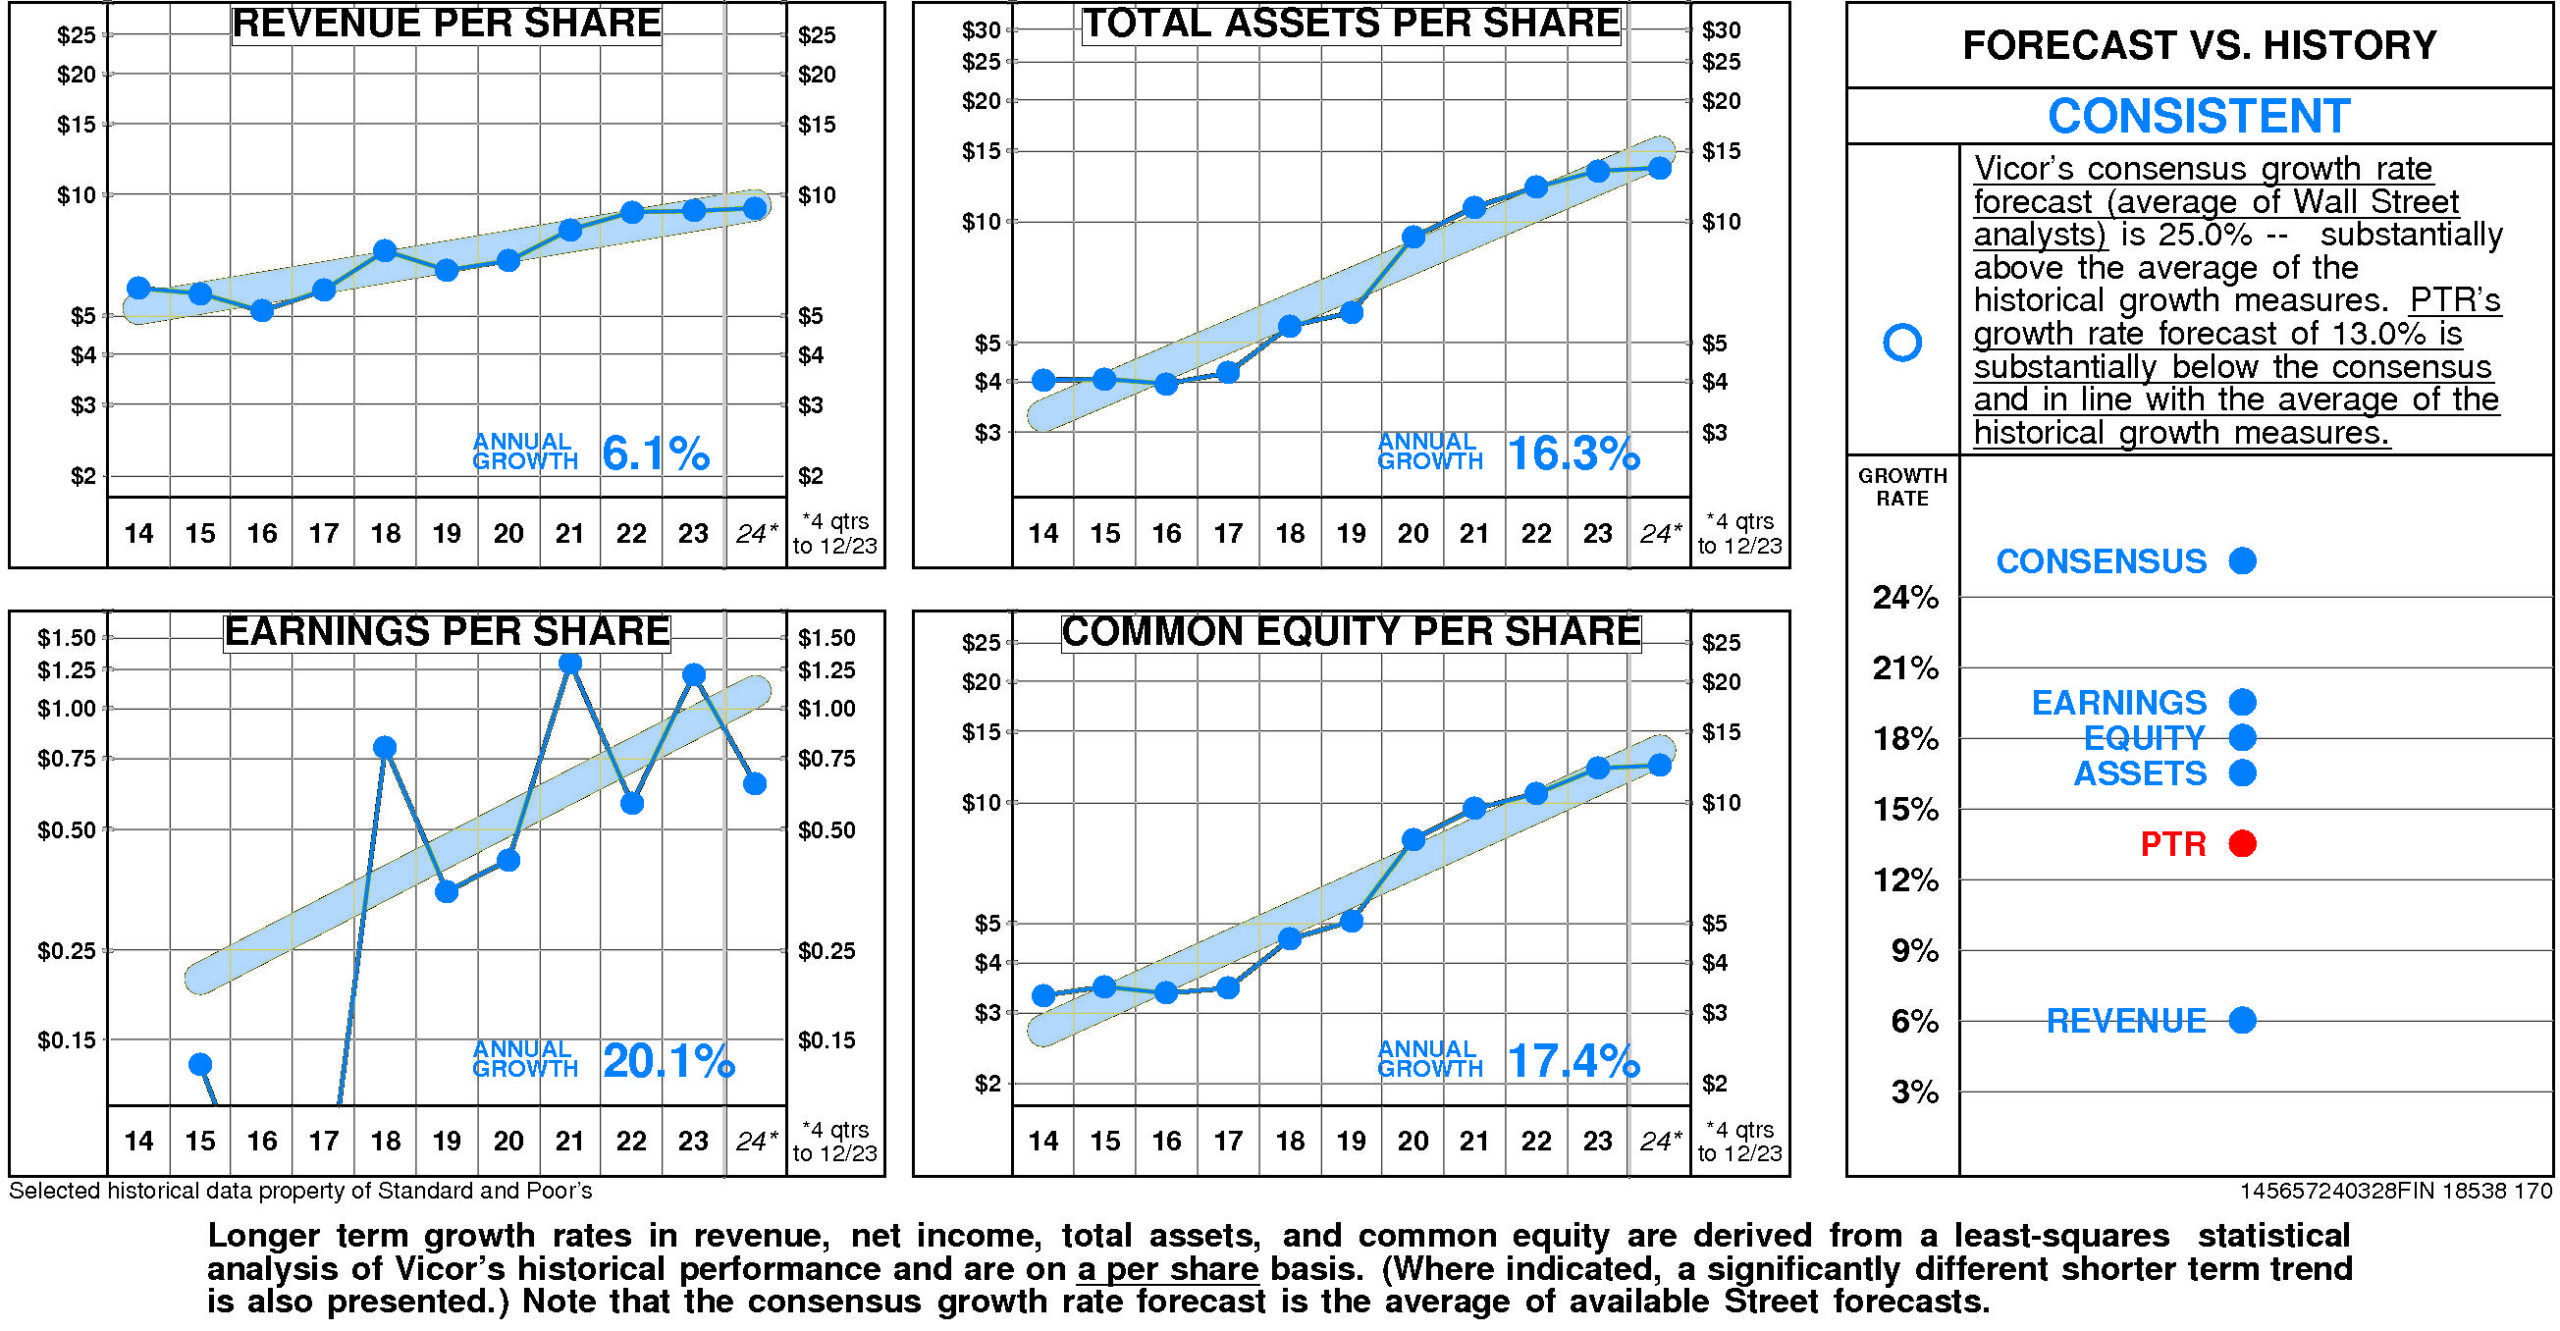
There are no significant differences between Vicor's longer term growth and growth in recent years.
Vicor's historical income statement growth and balance sheet growth have diverged. Revenue growth has fallen short of asset growth; earnings growth has paralleled equity growth.
Annual revenue growth
has been 6.1% per year.
Total asset growth
has been 16.3% per year.
Annual E.P.S. growth
has been 20.1% per year.
Equity growth
has been 17.4% per year.
Vicor's consensus growth rate forecast (average of Wall Street analysts)
is 25.0% — substantially above the average of the historical growth measures.
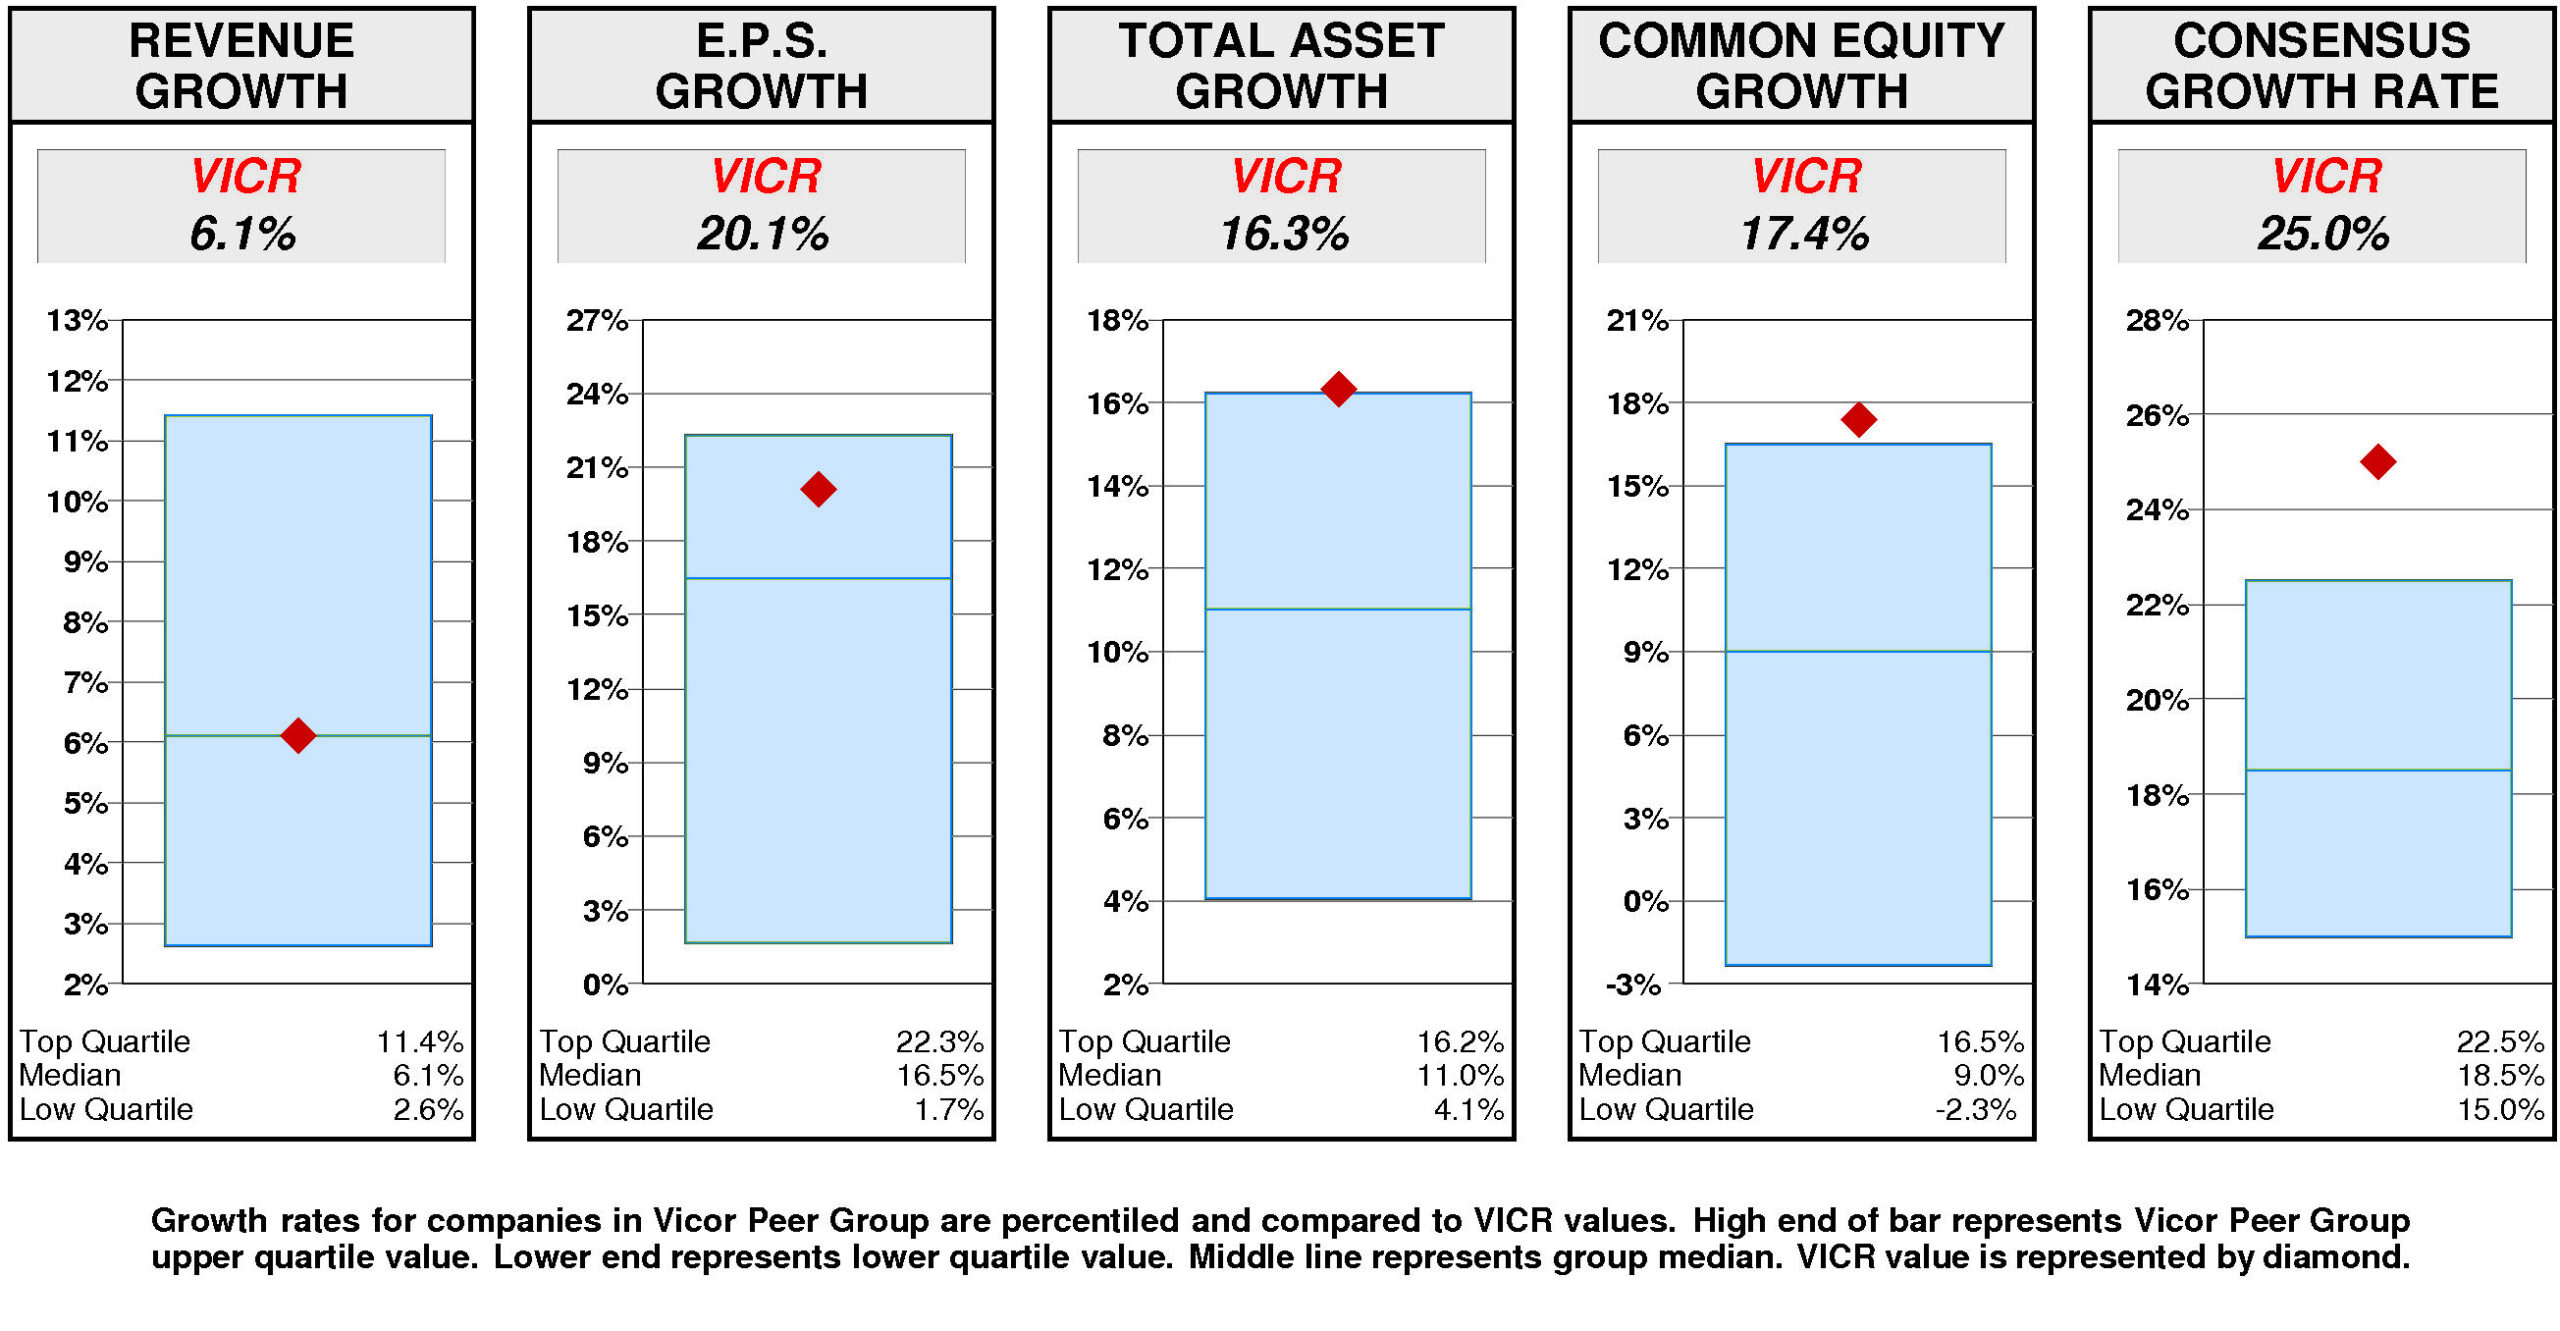
Relative to the Vicor Peer Group, Vicor's historical growth measures are erratic.
Equity growth (17.4%) has been upper quartile. Total asset growth (16.3%) has been at the upper quartile. E.P.S. growth (20.1%) has been above median. Revenue growth (6.1%) has been at median.
Consensus growth forecast (25.0%) is upper quartile.
PRICE HISTORY
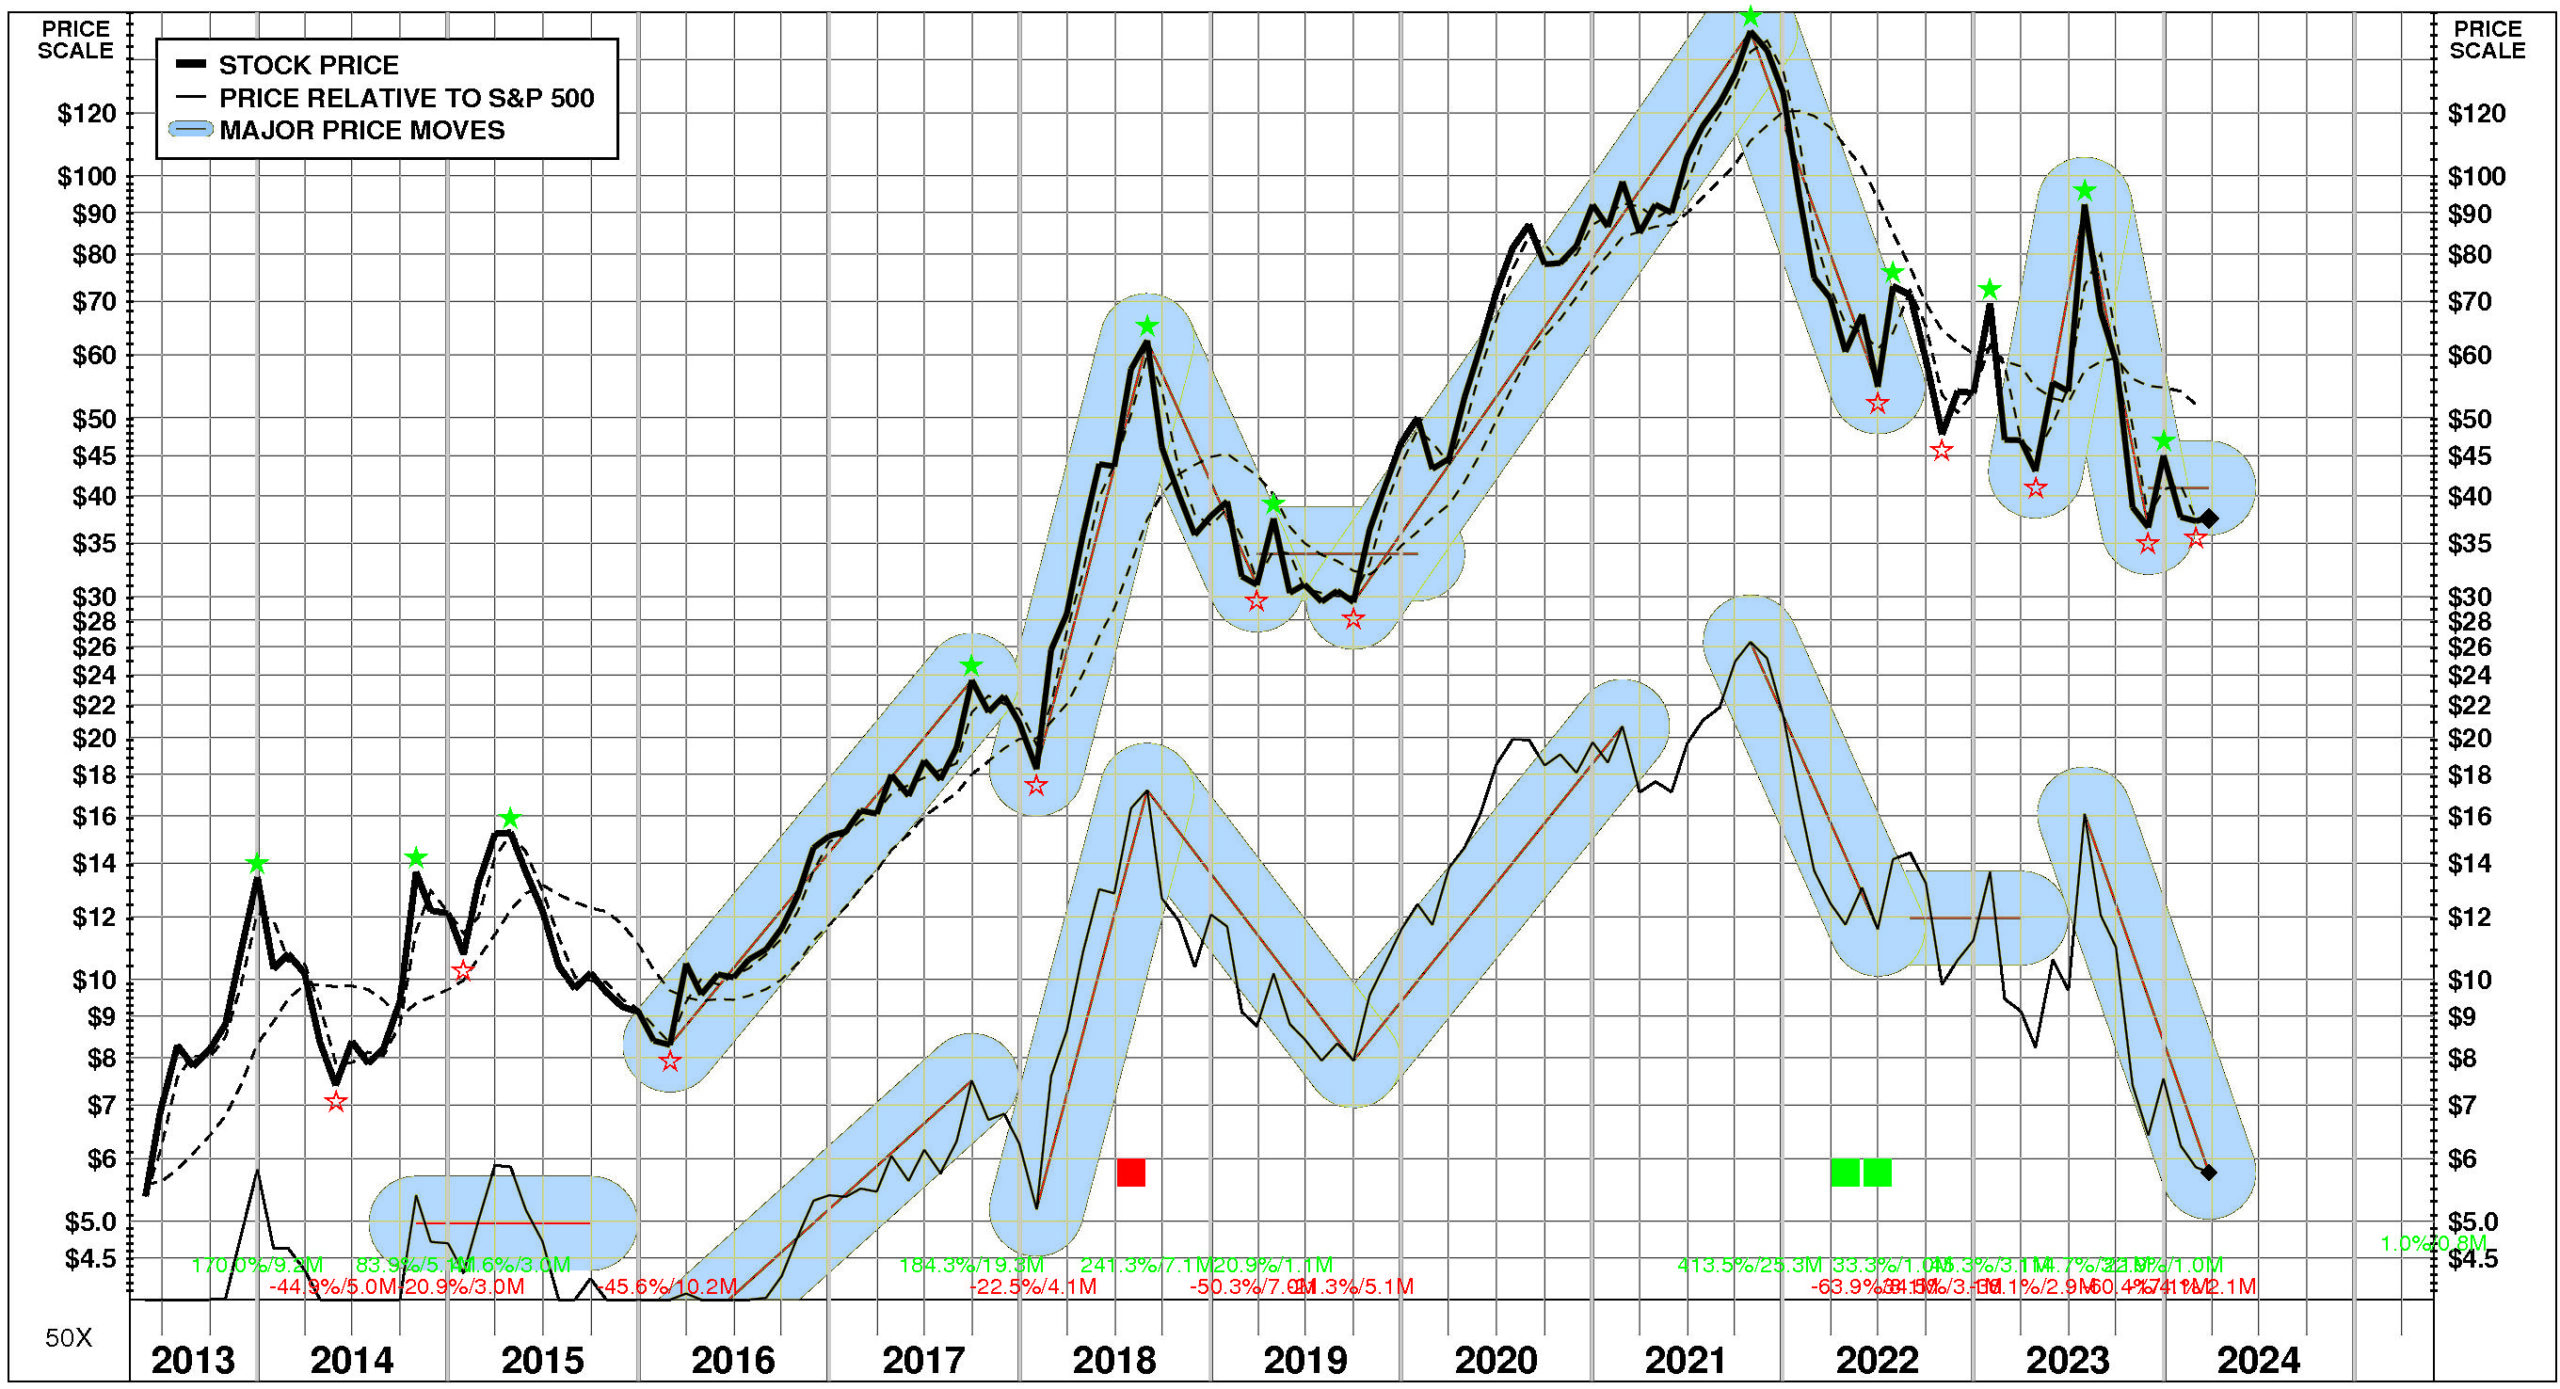
Over the full time period, Vicor's stock price performance has been volatile and exceptional.
Between May, 2013 and March, 2024, Vicor's stock price rose +598%; relative to the market, this was a +118% gain. Significant price moves during the period: 1) July, 2023 – November, 2023: -60%; 2) April, 2023 – July, 2023: +115%; 3) October, 2021 – June, 2022: -64%; 4) September, 2019 – October, 2021: +414%; 5) August, 2018 – March, 2019: -50%; and 6) January, 2018 – August, 2018: +241%.
TOTAL INVESTMENT RETURNS
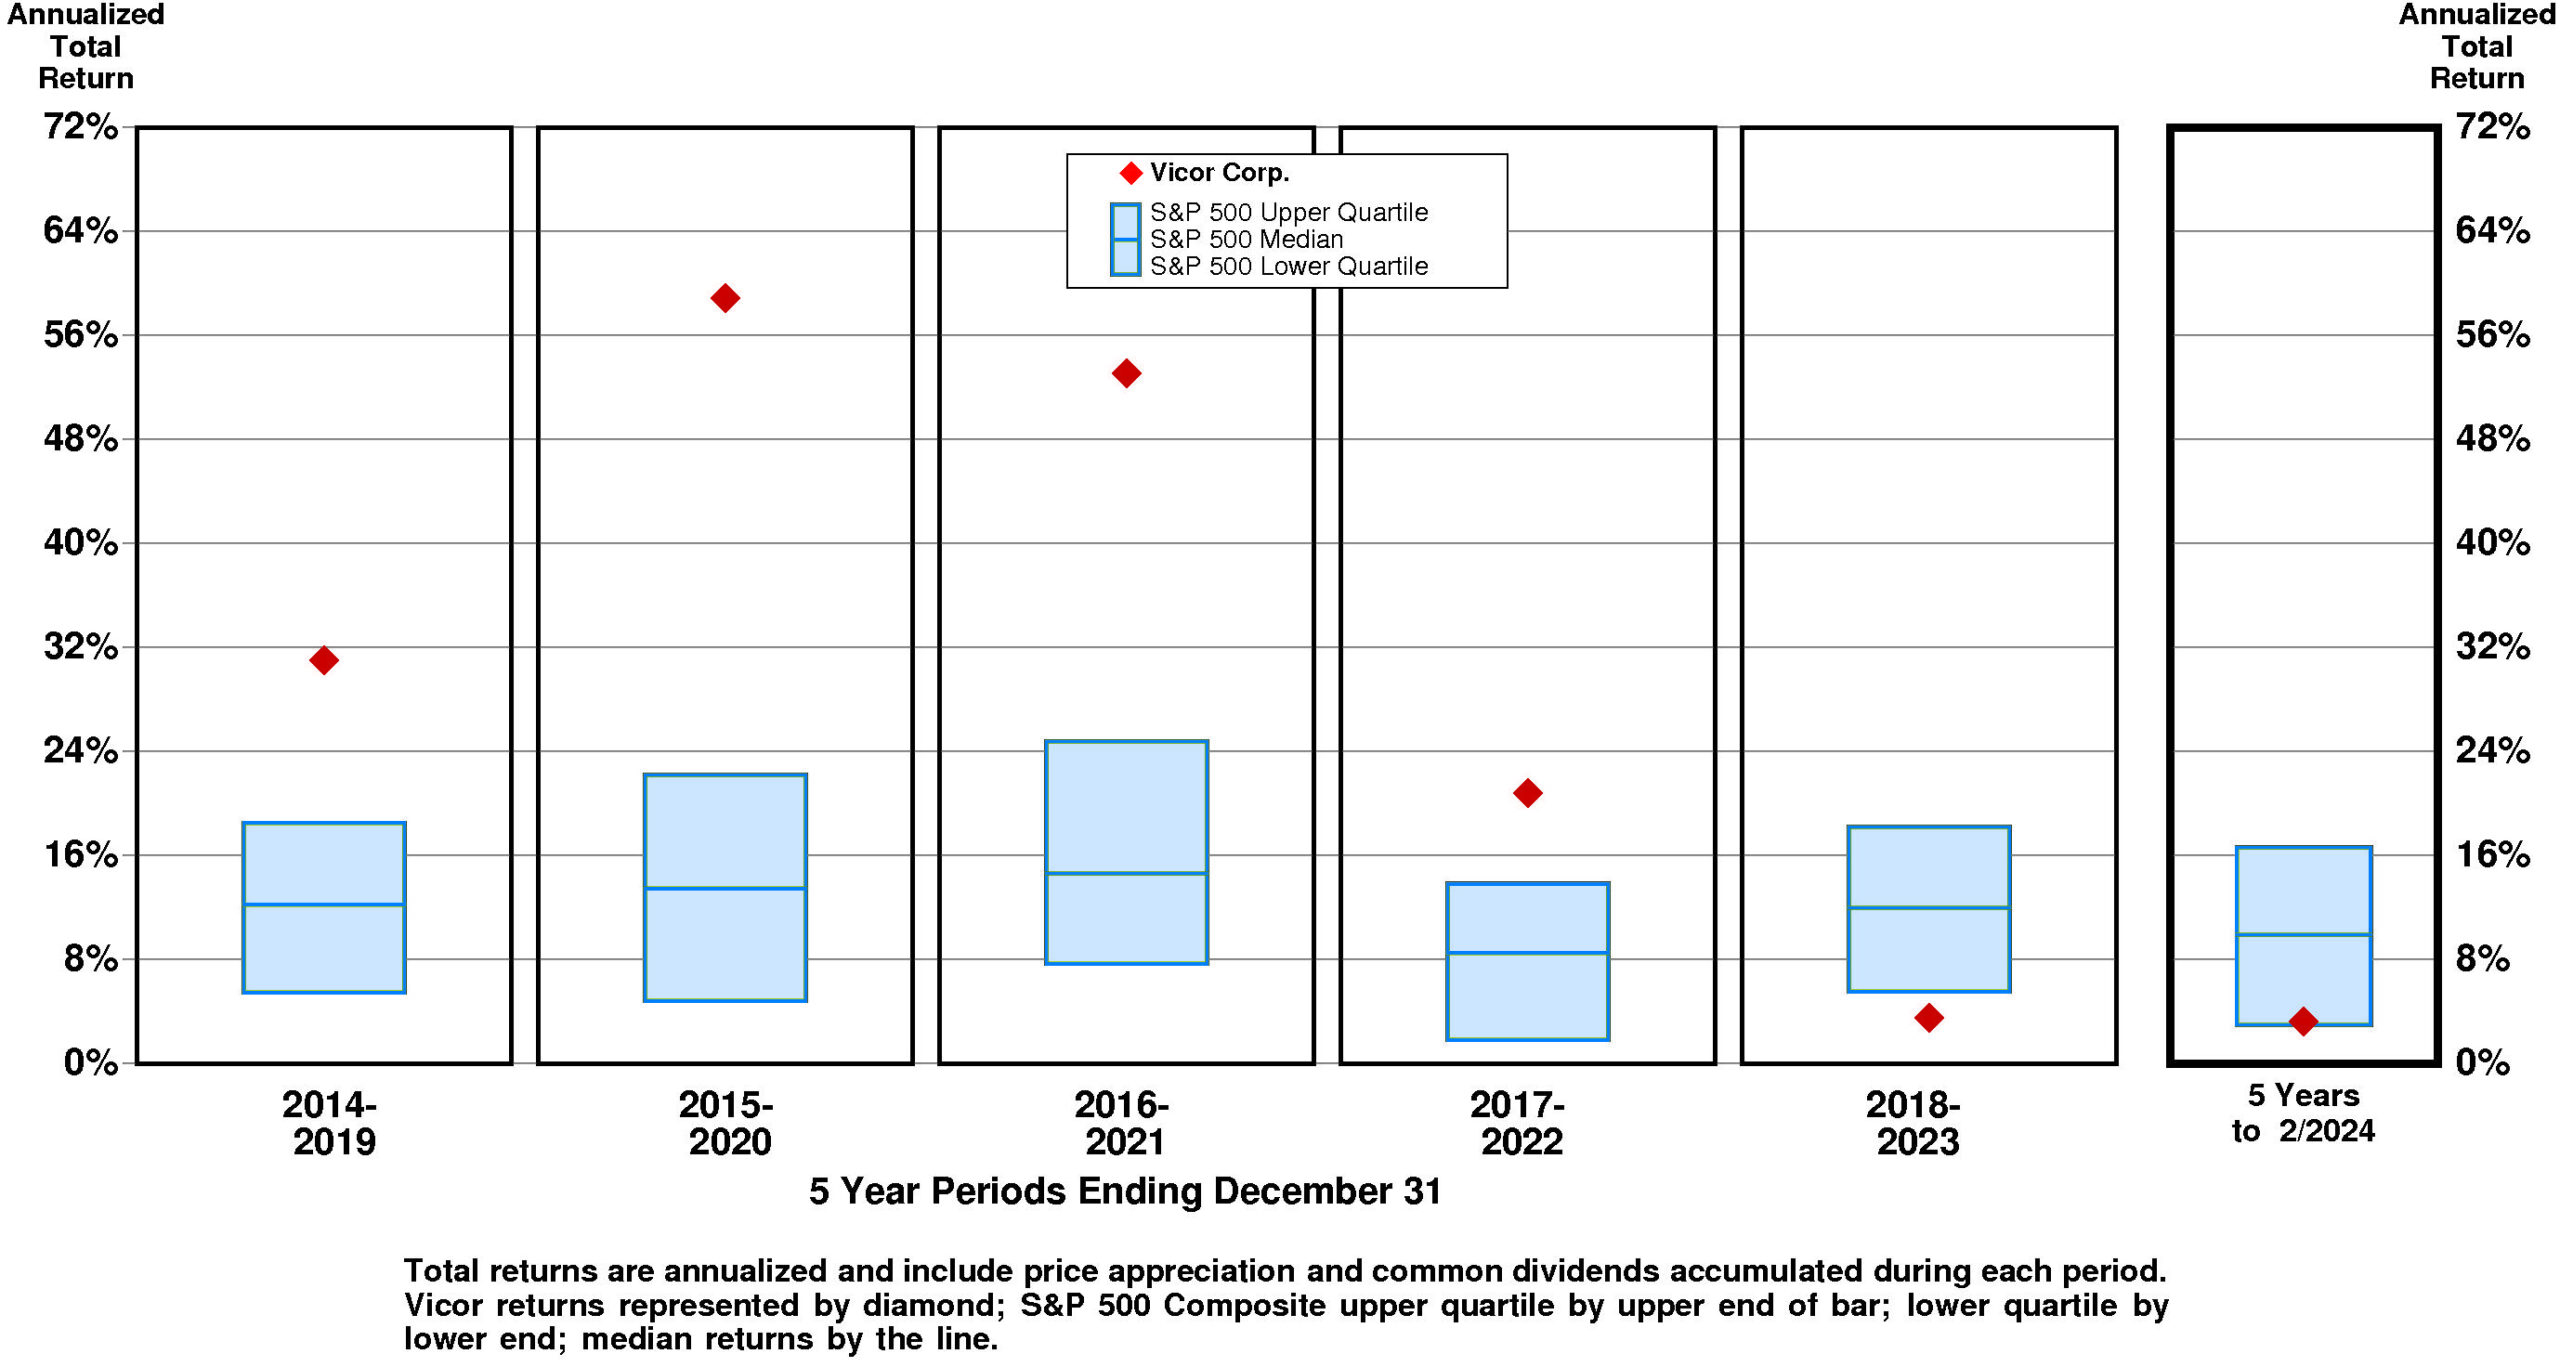
Current annual total return performance of -20.8% is lower quartile relative to the S&P 500 Composite.
In addition to being lower quartile relative to S&P 500 Composite, current annual total return performance through February, 2024 of -20.8% is lower quartile relative to Vicor Corp. Peer Group.
Current 5-year total return performance of 3.2% is substantially below median relative to the S&P 500 Composite.
Through February, 2024, with substantially below median current 5-year total return of 3.2% relative to S&P 500 Composite, Vicor's total return performance is at the lower quartile relative to Vicor Corp. Peer Group.
VALUATION BENCHMARKS
Relative to S&P 500 Composite, VICR's overall valuation is normal.
The highest factor, the ratio of enterprise value/assets, is above median. Ratio of enterprise value/earnings before interest and taxes is slightly above median. Price/earnings ratio is slightly below median. Ratio of enterprise value/revenue is below median. The lowest factor, the price/equity ratio, is below median.
Relative to Vicor Peer Group, VICR's overall valuation is normal.
The highest factor, the ratio of enterprise value/revenue, is at the upper quartile. Ratio of enterprise value/assets is above median. Ratio of enterprise value/earnings before interest and taxes is at median. Price/earnings ratio is at the lower quartile. The lowest factor, the price/equity ratio, is at the lower quartile.
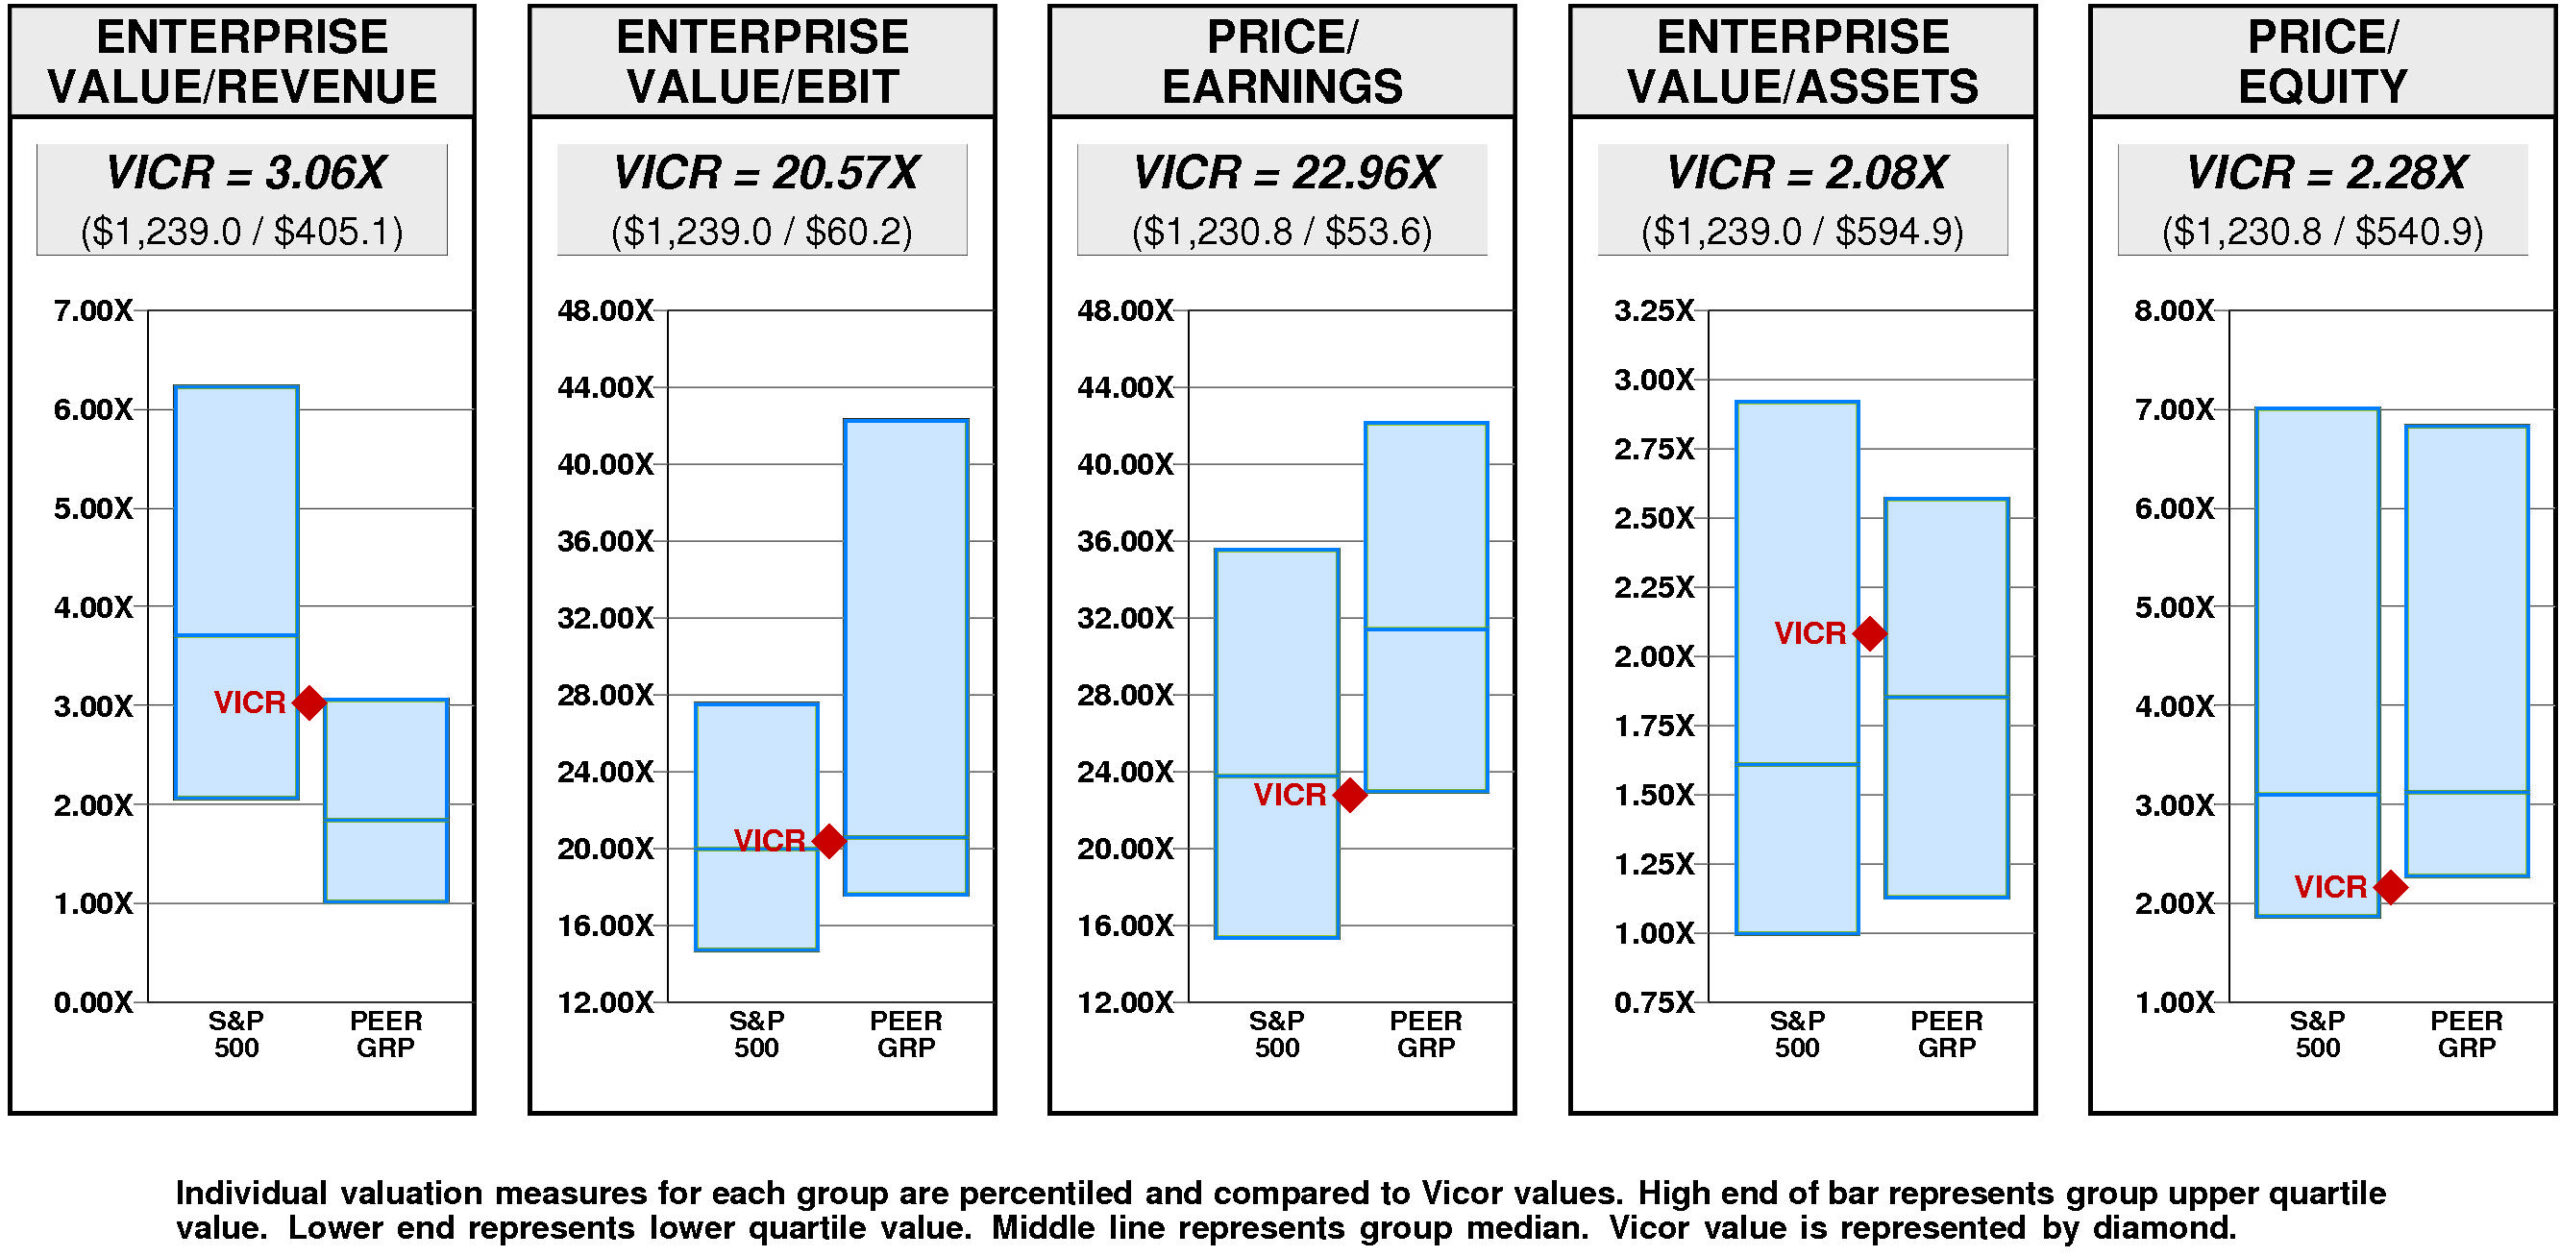
Vicor has a major value gap compared to the median valuation.
For VICR to achieve median valuation, its current ratio of enterprise value/revenue would have to fall from the current level of 3.06X to 1.84X. If VICR's ratio of enterprise value/revenue were to fall to 1.84X, its stock price would be lower by $-15 to $23.
For VICR to fall to lower quartile valuation relative to the Vicor Peer Group, its current ratio of enterprise value/revenue would have to fall from the current level of 3.06X to 1.01X. If VICR's ratio of enterprise value/revenue were to fall to 1.01X, its stock price would decline by $-25 from the current level of $38.
VALUE TARGETS
Reflecting future returns on capital that are forecasted to be above the cost of capital, VICR is expected to continue to be a modest Value Builder.
Vicor's current Price Target of $29 represents a -23% change from the current price of $37.60.
Vicor's low appreciation potential results in an appreciation score of 23 (77% of the universe has greater appreciation potential.)
Reinforcing this low Appreciation Score of 23, the low Power Rating of 13 contributes to an Value Trend Rating of F.
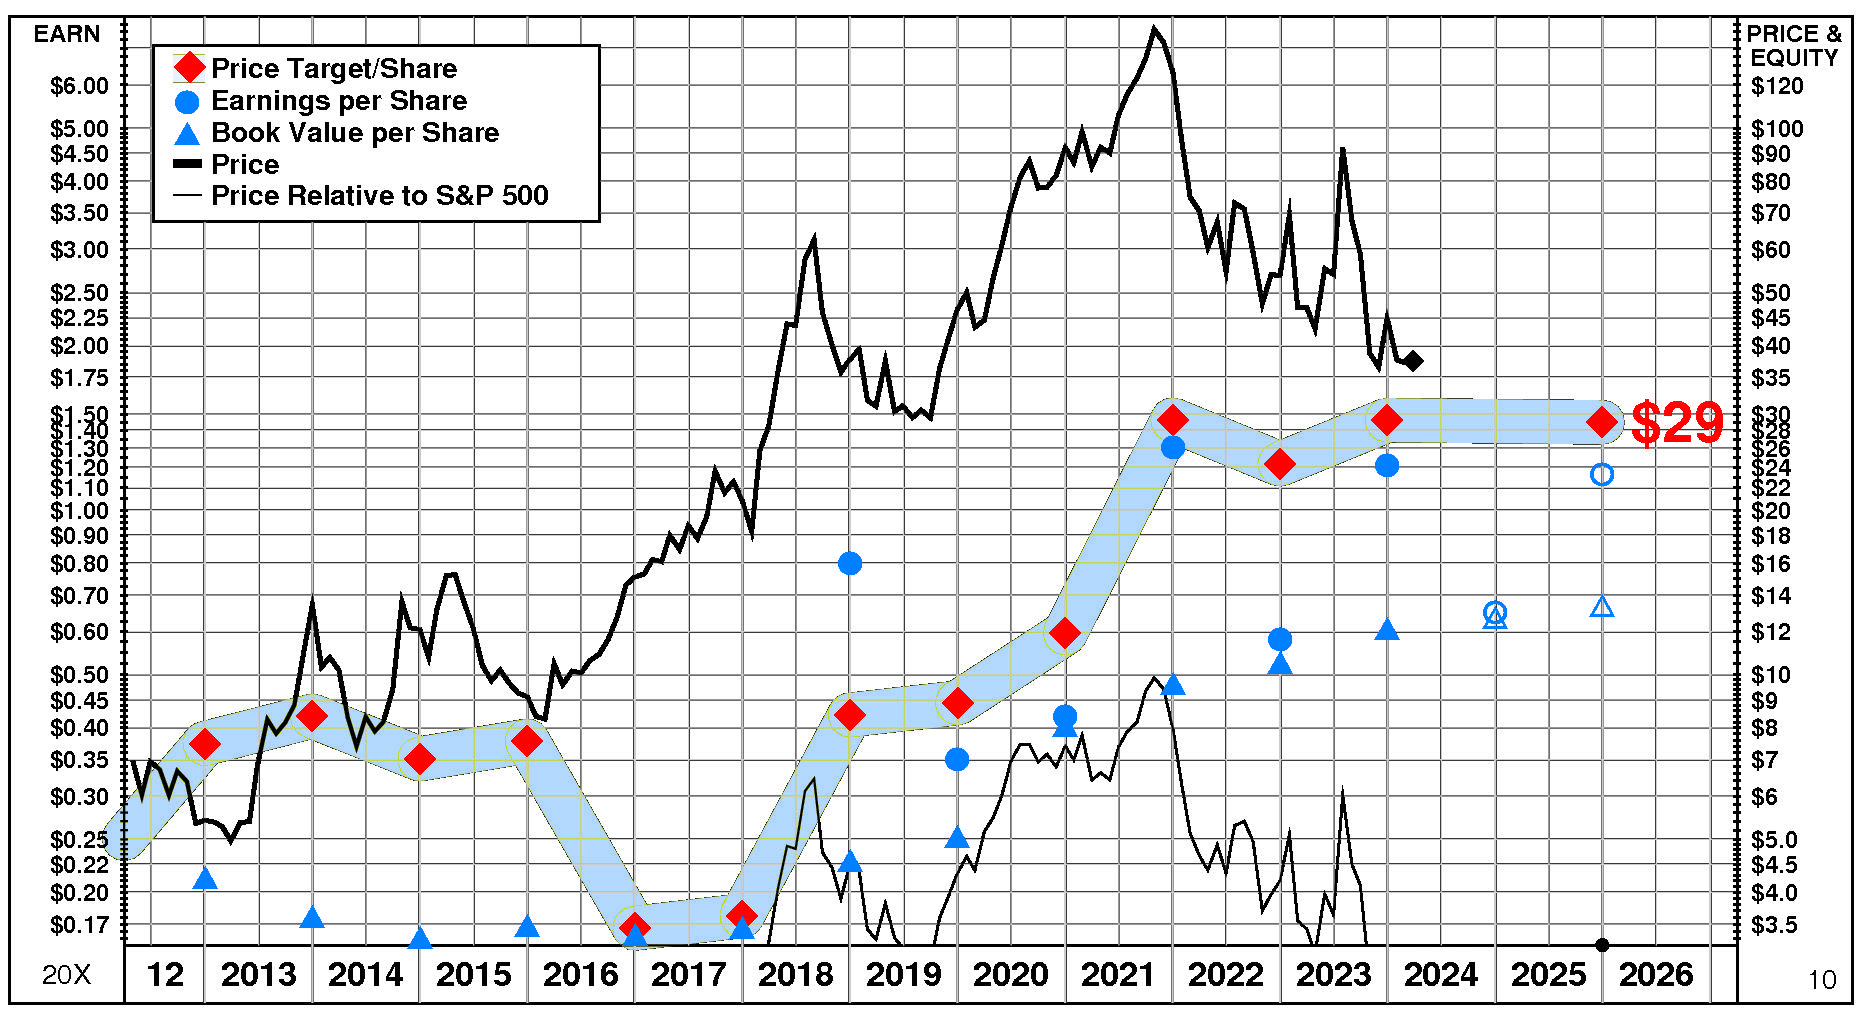
Vicor's current Price Target is $29 (-1% from the 2023 Target of $29 and -23% from the 03/25/24 price of $37.60).
This plateau in the Target is the result of a +9% increase in the equity base and a -9% decrease in the price/equity multiple. The forecasted decline in return on equity has a very large negative impact on the price/equity multiple and the forecasted decline in growth has a large negative impact as well. Partially offsetting these Drivers, the forecasted decline in cost of equity has a very large positive impact.
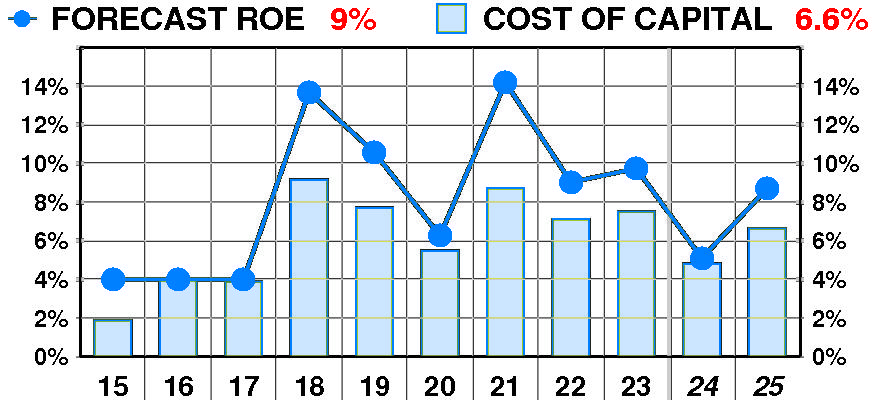
PTR's return on equity forecast is 8.7% — in line with our recent forecasts.
Forecasted return on equity enjoyed a dramatic, erratic increase between 2015 and 2023. The current forecast is well below the 2021 peak of 14%.
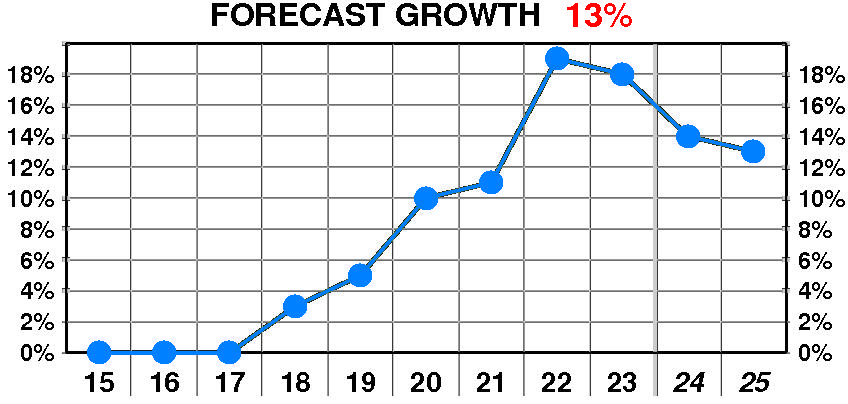
PTR's growth forecast is 13.0% — below our recent forecasts.
Forecasted growth enjoyed a dramatic, steady increase between 2018 and 2023. The current forecast is significantly above the 2018 low of 3%.
PTR's cost of equity forecast is 6.6% — in line with recent levels.
Forecasted cost of equity suffered a dramatic, erratic increase between 2015 and 2023. The current forecast is above the 2015 low of 1.9%.
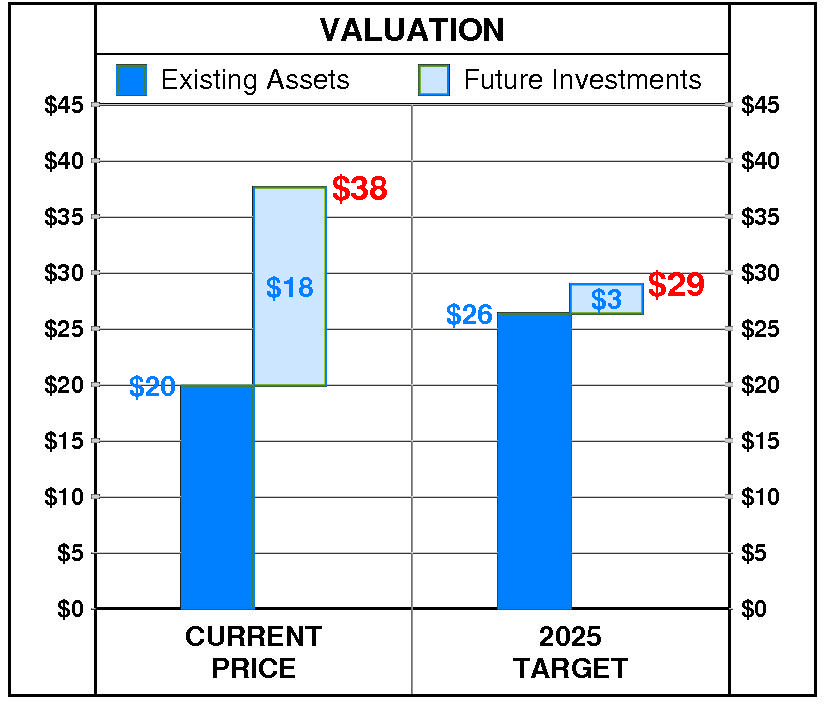
At Vicor's current price of $37.60, investors are placing a positive value of $18 on its future investments. This view is consistent with the company's most recent performance that reflected a growth rate of 18.0% per year, and a return on equity of 9.7% versus a cost of equity of 7.5%.
PTR's 2025 Price Target of $29 is based on these forecasts and reflects an estimated value of existing assets of $26 and a value of future investments of $3.