![]()
BUSINESS
Vulcan Materials Company, together with its subsidiaries, produces and supplies construction aggregates primarily in the United States. It operates through four segments: Aggregates, Asphalt, Concrete, and Calcium. The Aggregates segment provides crushed stones, sand and gravel, sand, and other aggregates; and related products and services that are applied in construction and maintenance of highways, streets, and other public works, as well as in the construction of housing and commercial, industrial, and other nonresidential facilities. The Asphalt Mix segment offers asphalt mix in Alabama, Arizona, California, New Mexico, Tennessee, and Texas, as well as engages in the asphalt construction paving activity in Alabama, Tennessee, and Texas.
INVESTMENT RATING
VMC is expected to continue to be an important Value Builder reflecting capital returns that are forecasted to be above the cost of capital.
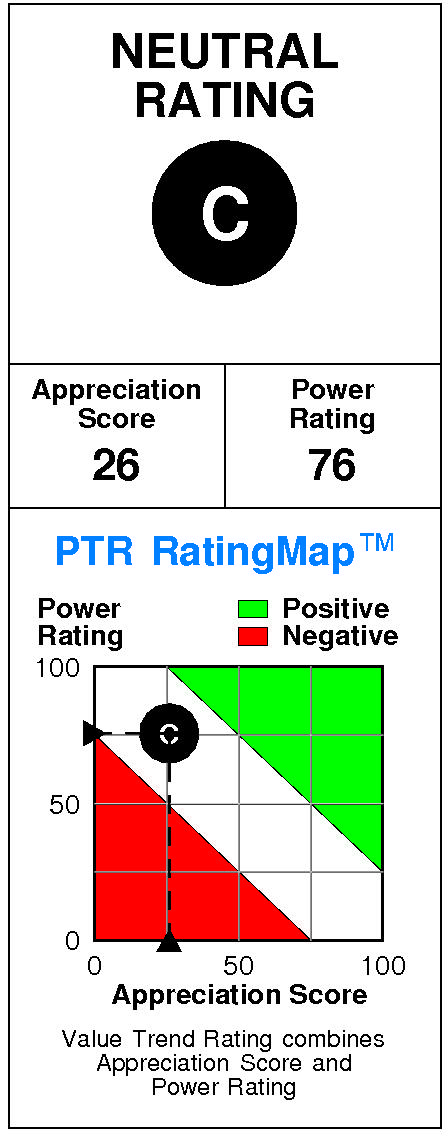
Vulcan Materials has a current Value Trend Rating of C (Neutral).
The Value Trend Rating reflects very contradictory signals from PTR’s two proprietary measures of a stock’s attractiveness. Vulcan Materials has a poor Appreciation Score of 26 but a good Power Rating of 76, leading to the Neutral Value Trend Rating.
Vulcan Materials’ stock is selling above targeted value. The current stock price of $272.62 compares to targeted value 12 months forward of $220.
This low appreciation potential results in an appreciation score of 26 (74% of the universe has greater appreciation potential.)
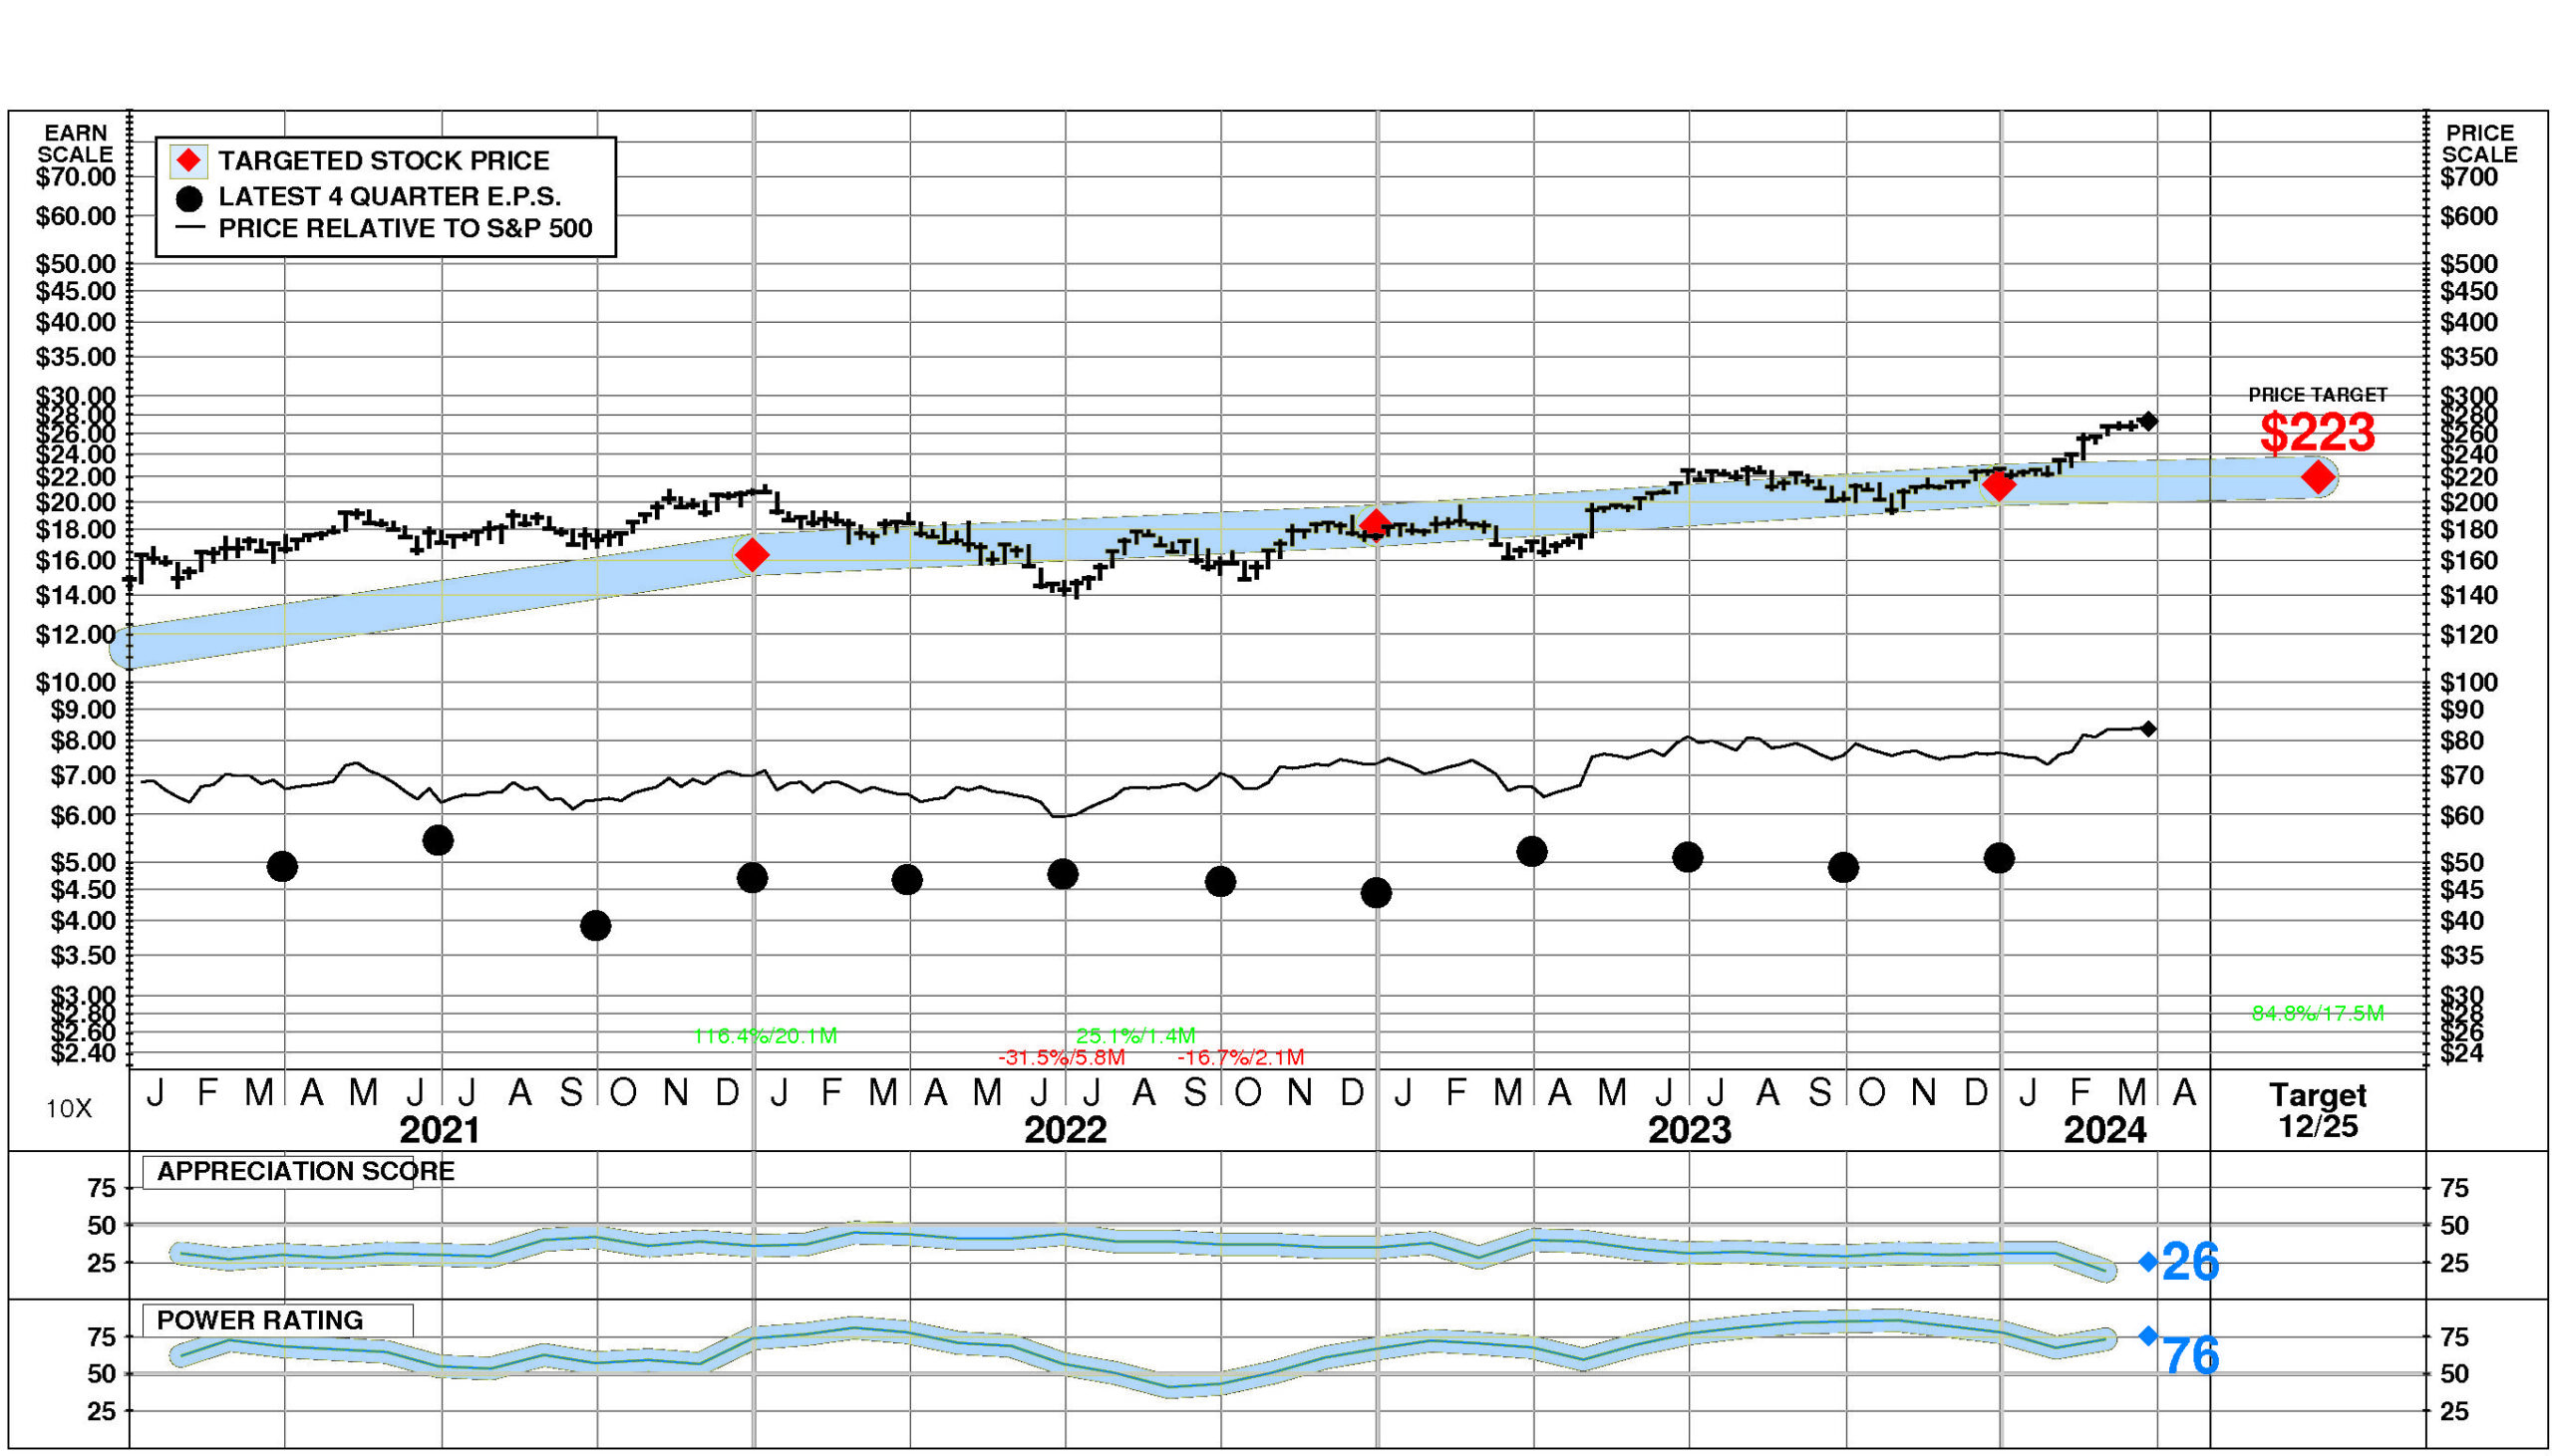
Vulcan Materials has a Power Rating of 76. (VMC’s good Power Rating indicates that it has a higher likelihood of achieving favorable investment performance over the near to intermediate term than all but 24% of companies in the universe.)
Factors contributing to this good Power Rating include: the recent trend in VMC’s earnings estimates has been extremely favorable; and recent price action has been favorable. An offsetting factor is the Mining, Quarry Nonmetal Minerals comparison group is in an extremely unfavorable position currently.
INVESTMENT PROFILE
VMC’s financial strength is above average. Financial strength rating is 69.
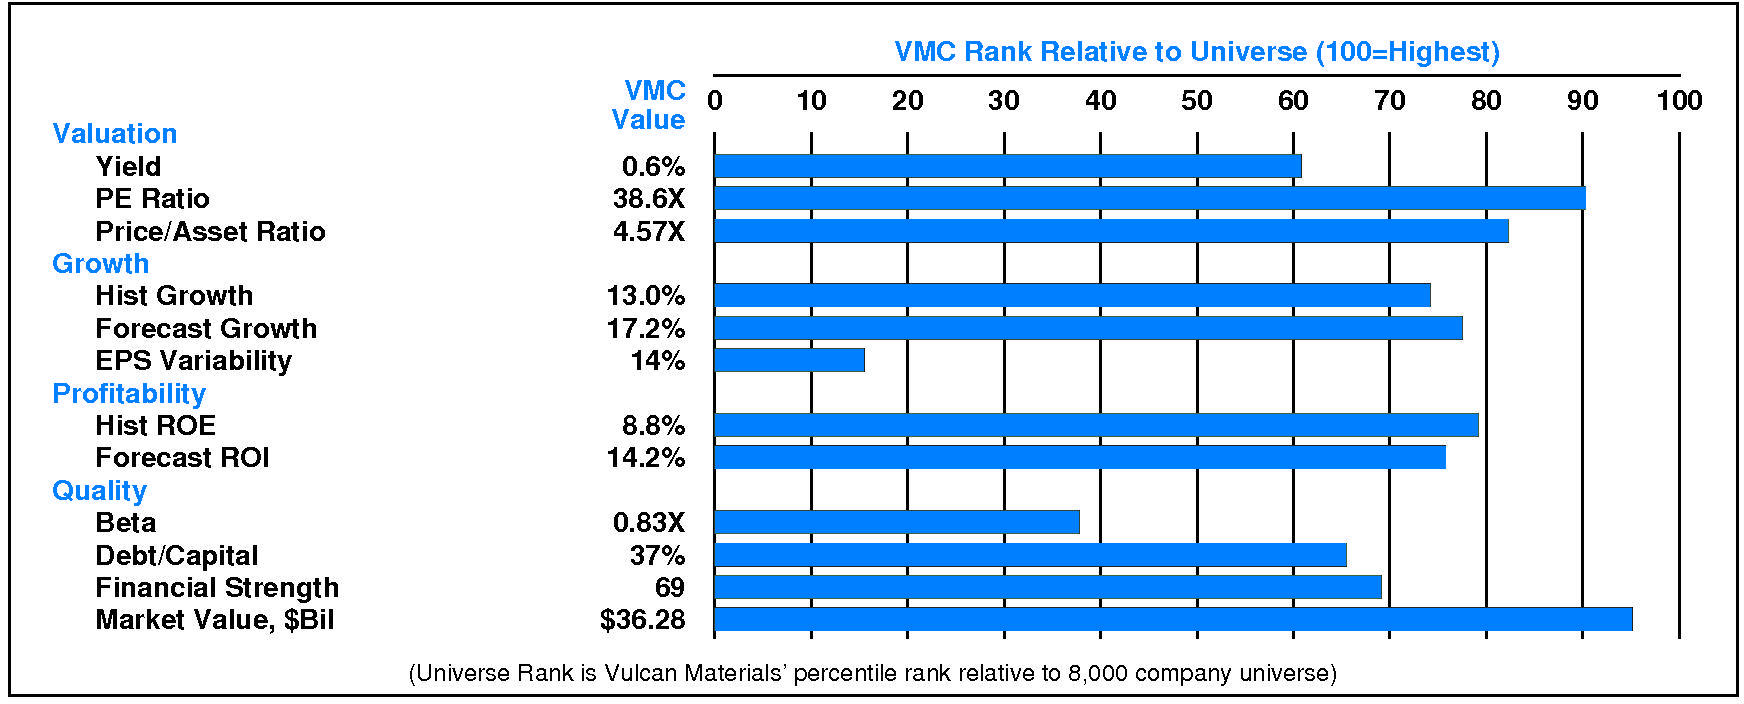
Relative to the S&P 500 Composite, Vulcan Materials Co has neutral Growth/Value characteristics; its appeal is likely to be to Capital Gain-oriented investors; the perception is that VMC is lower risk. All factors are relative strengths. VMC’s valuation is high: low dividend yield, high P/E ratio, and moderate price/book ratio. VMC has normal market capitalization.
CURRENT SIGNALS
Vulcan Materials’ current operations are strong. Return on equity is rising, reflecting: improving asset utilization; widening pretax margins; and rising leverage.
Vulcan Materials’ current technical position is very strong. The stock price is in a 17.5 month up move. The stock has appreciated 84.8% from its prior low. The stock price is above its 200 day moving average which is in an uptrend.
ALERTS
The stock is currently rated C.
Vulcan Materials Co (NYSE: VMC) stock declined slightly by -0.6% on 3/25/24. The stock closed at $272.62. However, trading volume in this decline was exceptionally low at 49% of normal. The stock has been strong relative to the market over the last nine months and has risen 2.2% during the last week.
CASH FLOW
In 2023, Vulcan Materials generated a very significant increase in cash of +$788 million (+488%). Sources of cash were much larger than uses. Cash generated from 2023 EBITDA totaled +$2,023 million. Non-operating sources contributed +$37 million (+2% of EBITDA). Cash taxes consumed -$343 million (-17% of EBITDA). Re-investment in the business amounted to -$172 million (-9% of EBITDA). On a net basis, debt investors pulled out -$368 million (-18% of EBITDA) while equity investors withdrew -$389 million (-19% of EBITDA).

Vulcan Materials’ Non-operating Income, %EBITDA has experienced a downtrend over the period. This downtrend was accompanied by an opposite trend for the Vulcan Materials Peer Group. In most years, Vulcan Materials was in the second quartile and third quartile. Currently, Vulcan Materials is substantially above median at +2% of EBITDA (+$37 million).
Vulcan Materials’ Cash Taxes, %EBITDA has exhibited a volatile overall uptrend over the period. This improvement was accompanied by stability for the Vulcan Materials Peer Group. (Since 2021 Cash Taxes, %EBITDA has experienced a very sharp decline.) In most years, Vulcan Materials was in the second quartile and top quartile. Currently, Vulcan Materials is lower quartile at -17% of EBITDA (-$343 million).
Vulcan Materials’ Business Re-investment, %EBITDA has suffered a volatile overall downtrend over the period. This downtrend was accompanied by stability for the Vulcan Materials Peer Group. (Since 2021 Business Re-investment, %EBITDA has experienced a very sharp recovery.) In most years, Vulcan Materials was in the second quartile and top quartile. Currently, Vulcan Materials is substantially above median at -9% of EBITDA (-$172 million).
Vulcan Materials’ Debt Investors, %EBITDA has experienced a volatile overall uptrend over the period. This improvement was accompanied by an opposite trend for the Vulcan Materials Peer Group. (Since 2021 Debt Investors, %EBITDA has experienced a very sharp decline.) In most years, Vulcan Materials was in the top quartile and second quartile. Currently, Vulcan Materials is above median at -18% of EBITDA (-$368 million).
Vulcan Materials’ Equity Investors, %EBITDA has experienced a downtrend over the period. This downtrend was accompanied by a similar trend for the Vulcan Materials Peer Group. In most years, Vulcan Materials was in the third quartile and second quartile. Currently, Vulcan Materials is slightly above median at -19% of EBITDA (-$389 million).
Vulcan Materials’ Change in Cash, %EBITDA has exhibited a volatile overall uptrend over the period. This improvement was accompanied by stability for the Vulcan Materials Peer Group. (Since 2021 Change in Cash, %EBITDA has accelerated very sharply.) In most years, Vulcan Materials was in the top quartile and second quartile. Currently, Vulcan Materials is upper quartile at +39% of EBITDA (+$788 million).
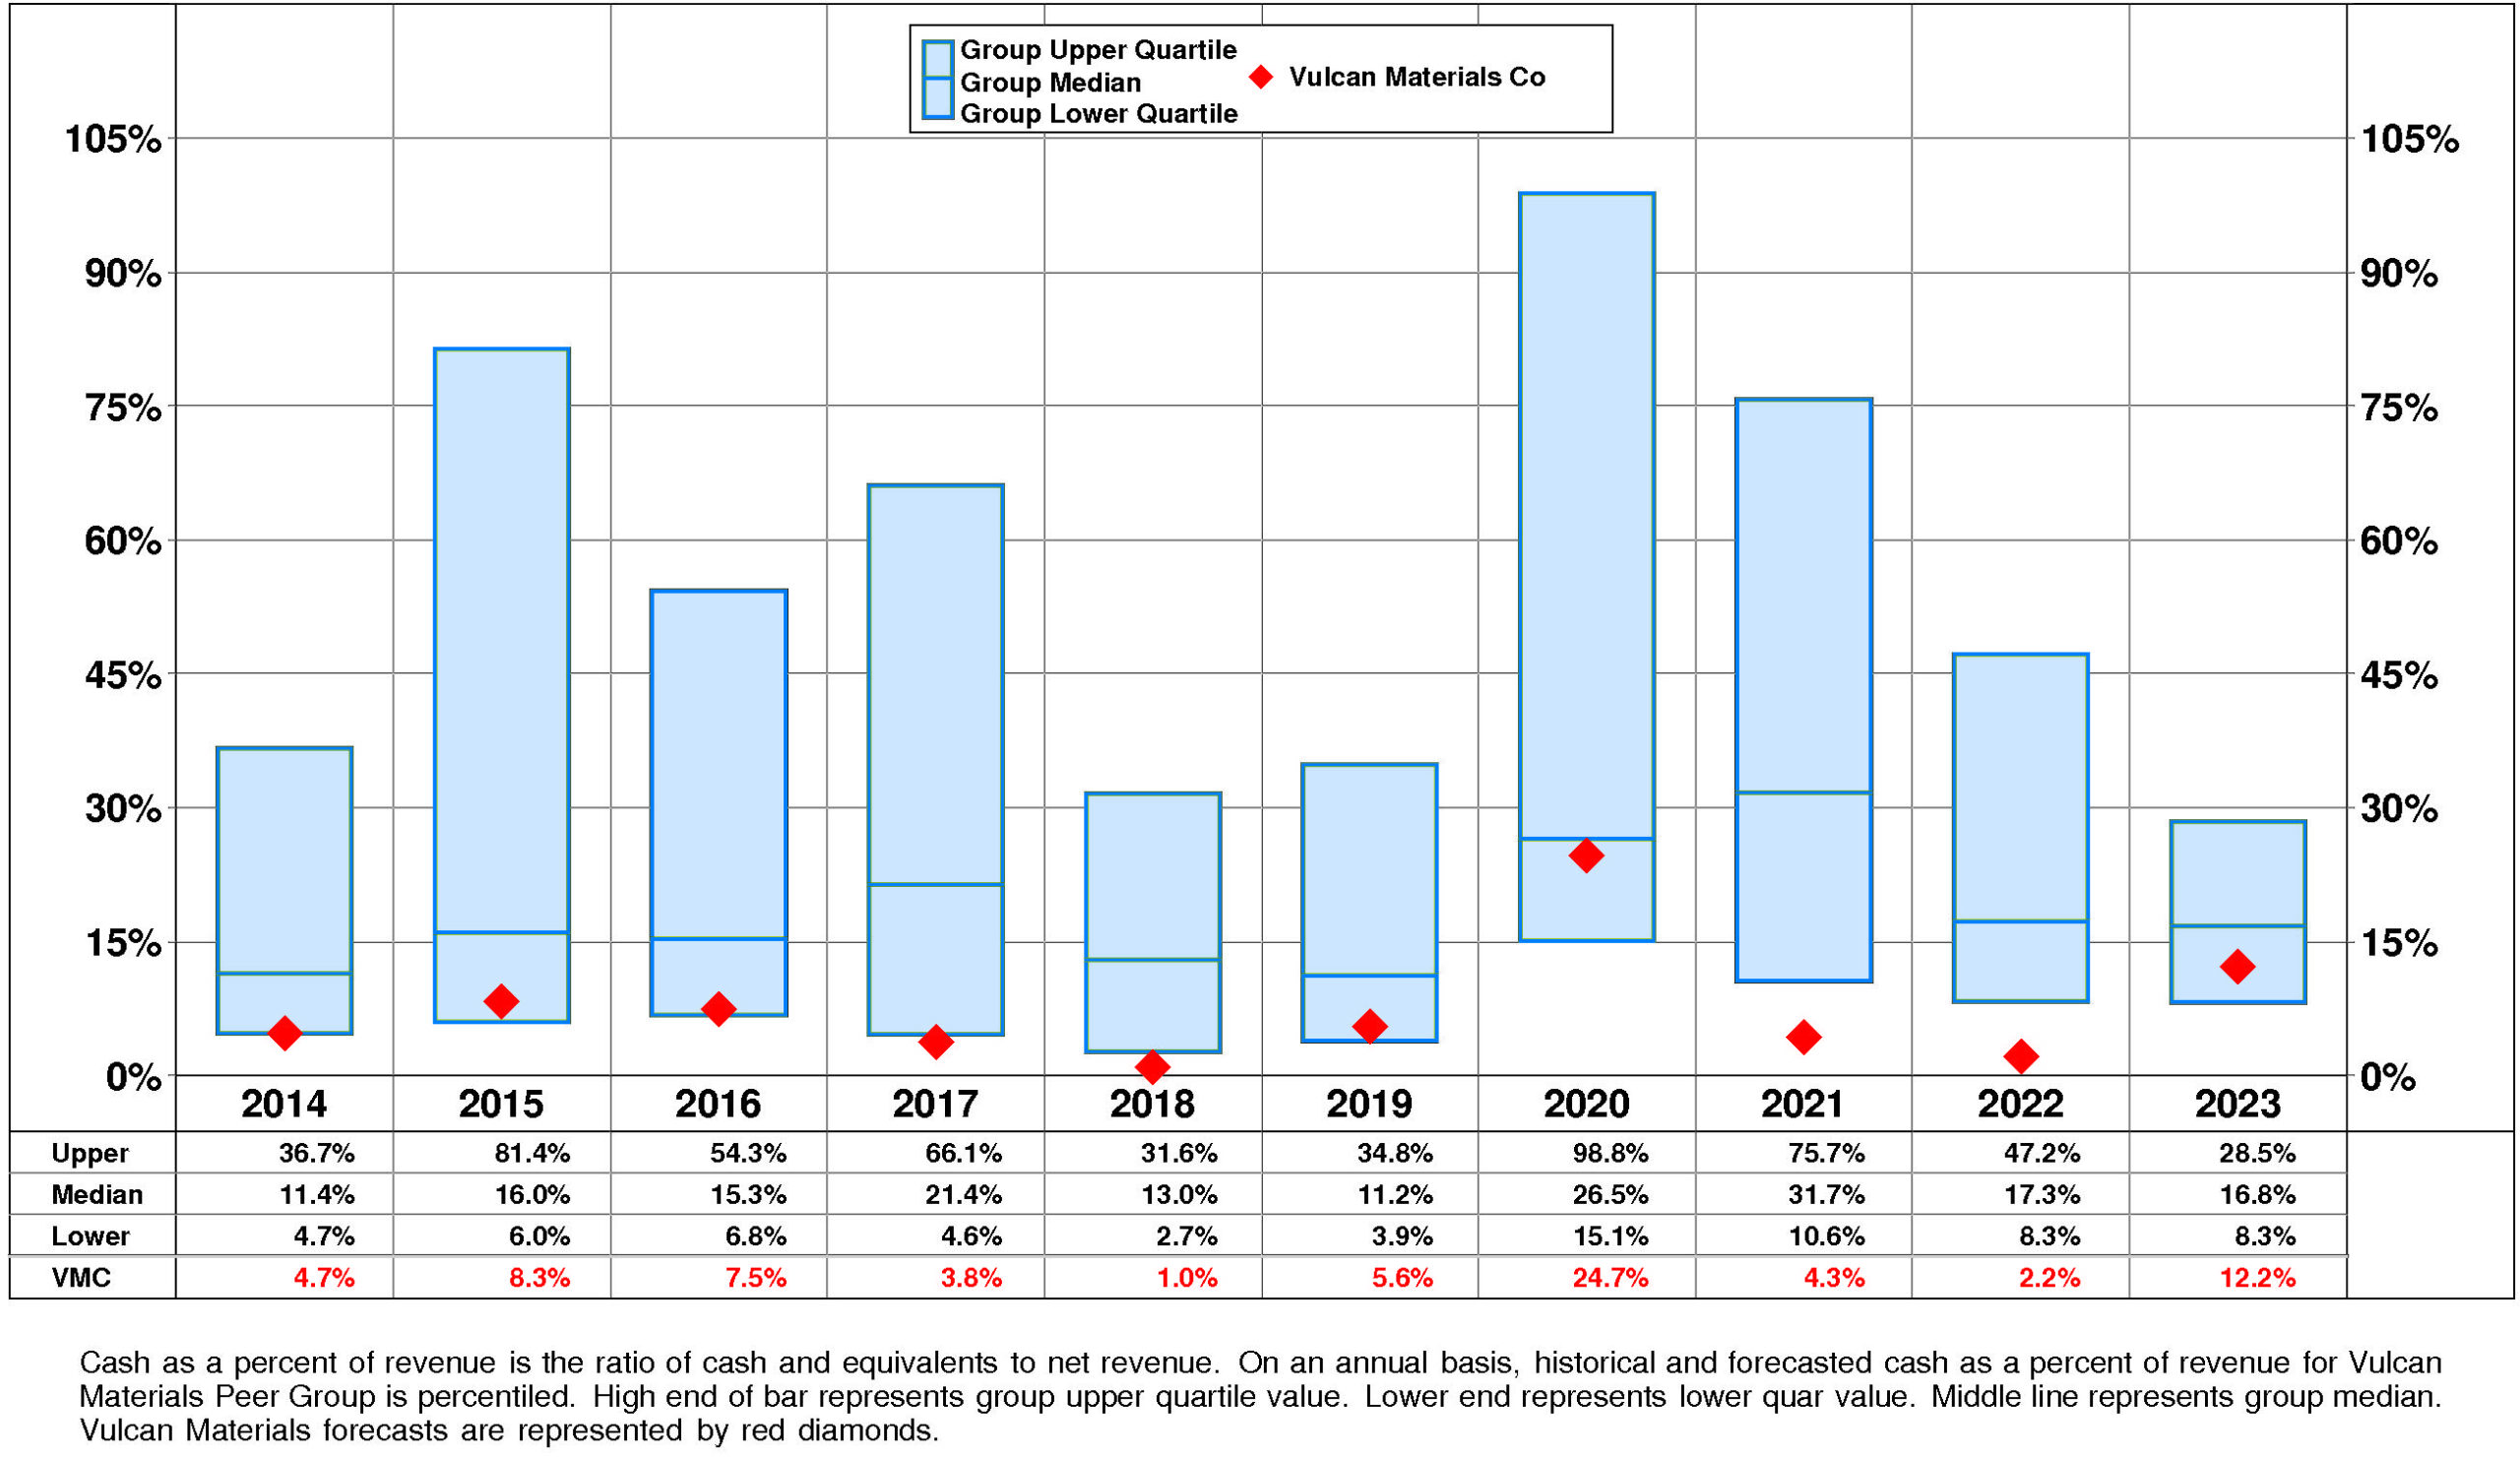
Vulcan Materials’ Cash, %Revenue has exhibited little to no overall change over the period. This stability was accompanied by an uptrend for the Vulcan Materials Peer Group. In most years, Vulcan Materials was in the third quartile and lower quartile. Currently, Vulcan Materials is below median at +12%.
PROFITABILITY
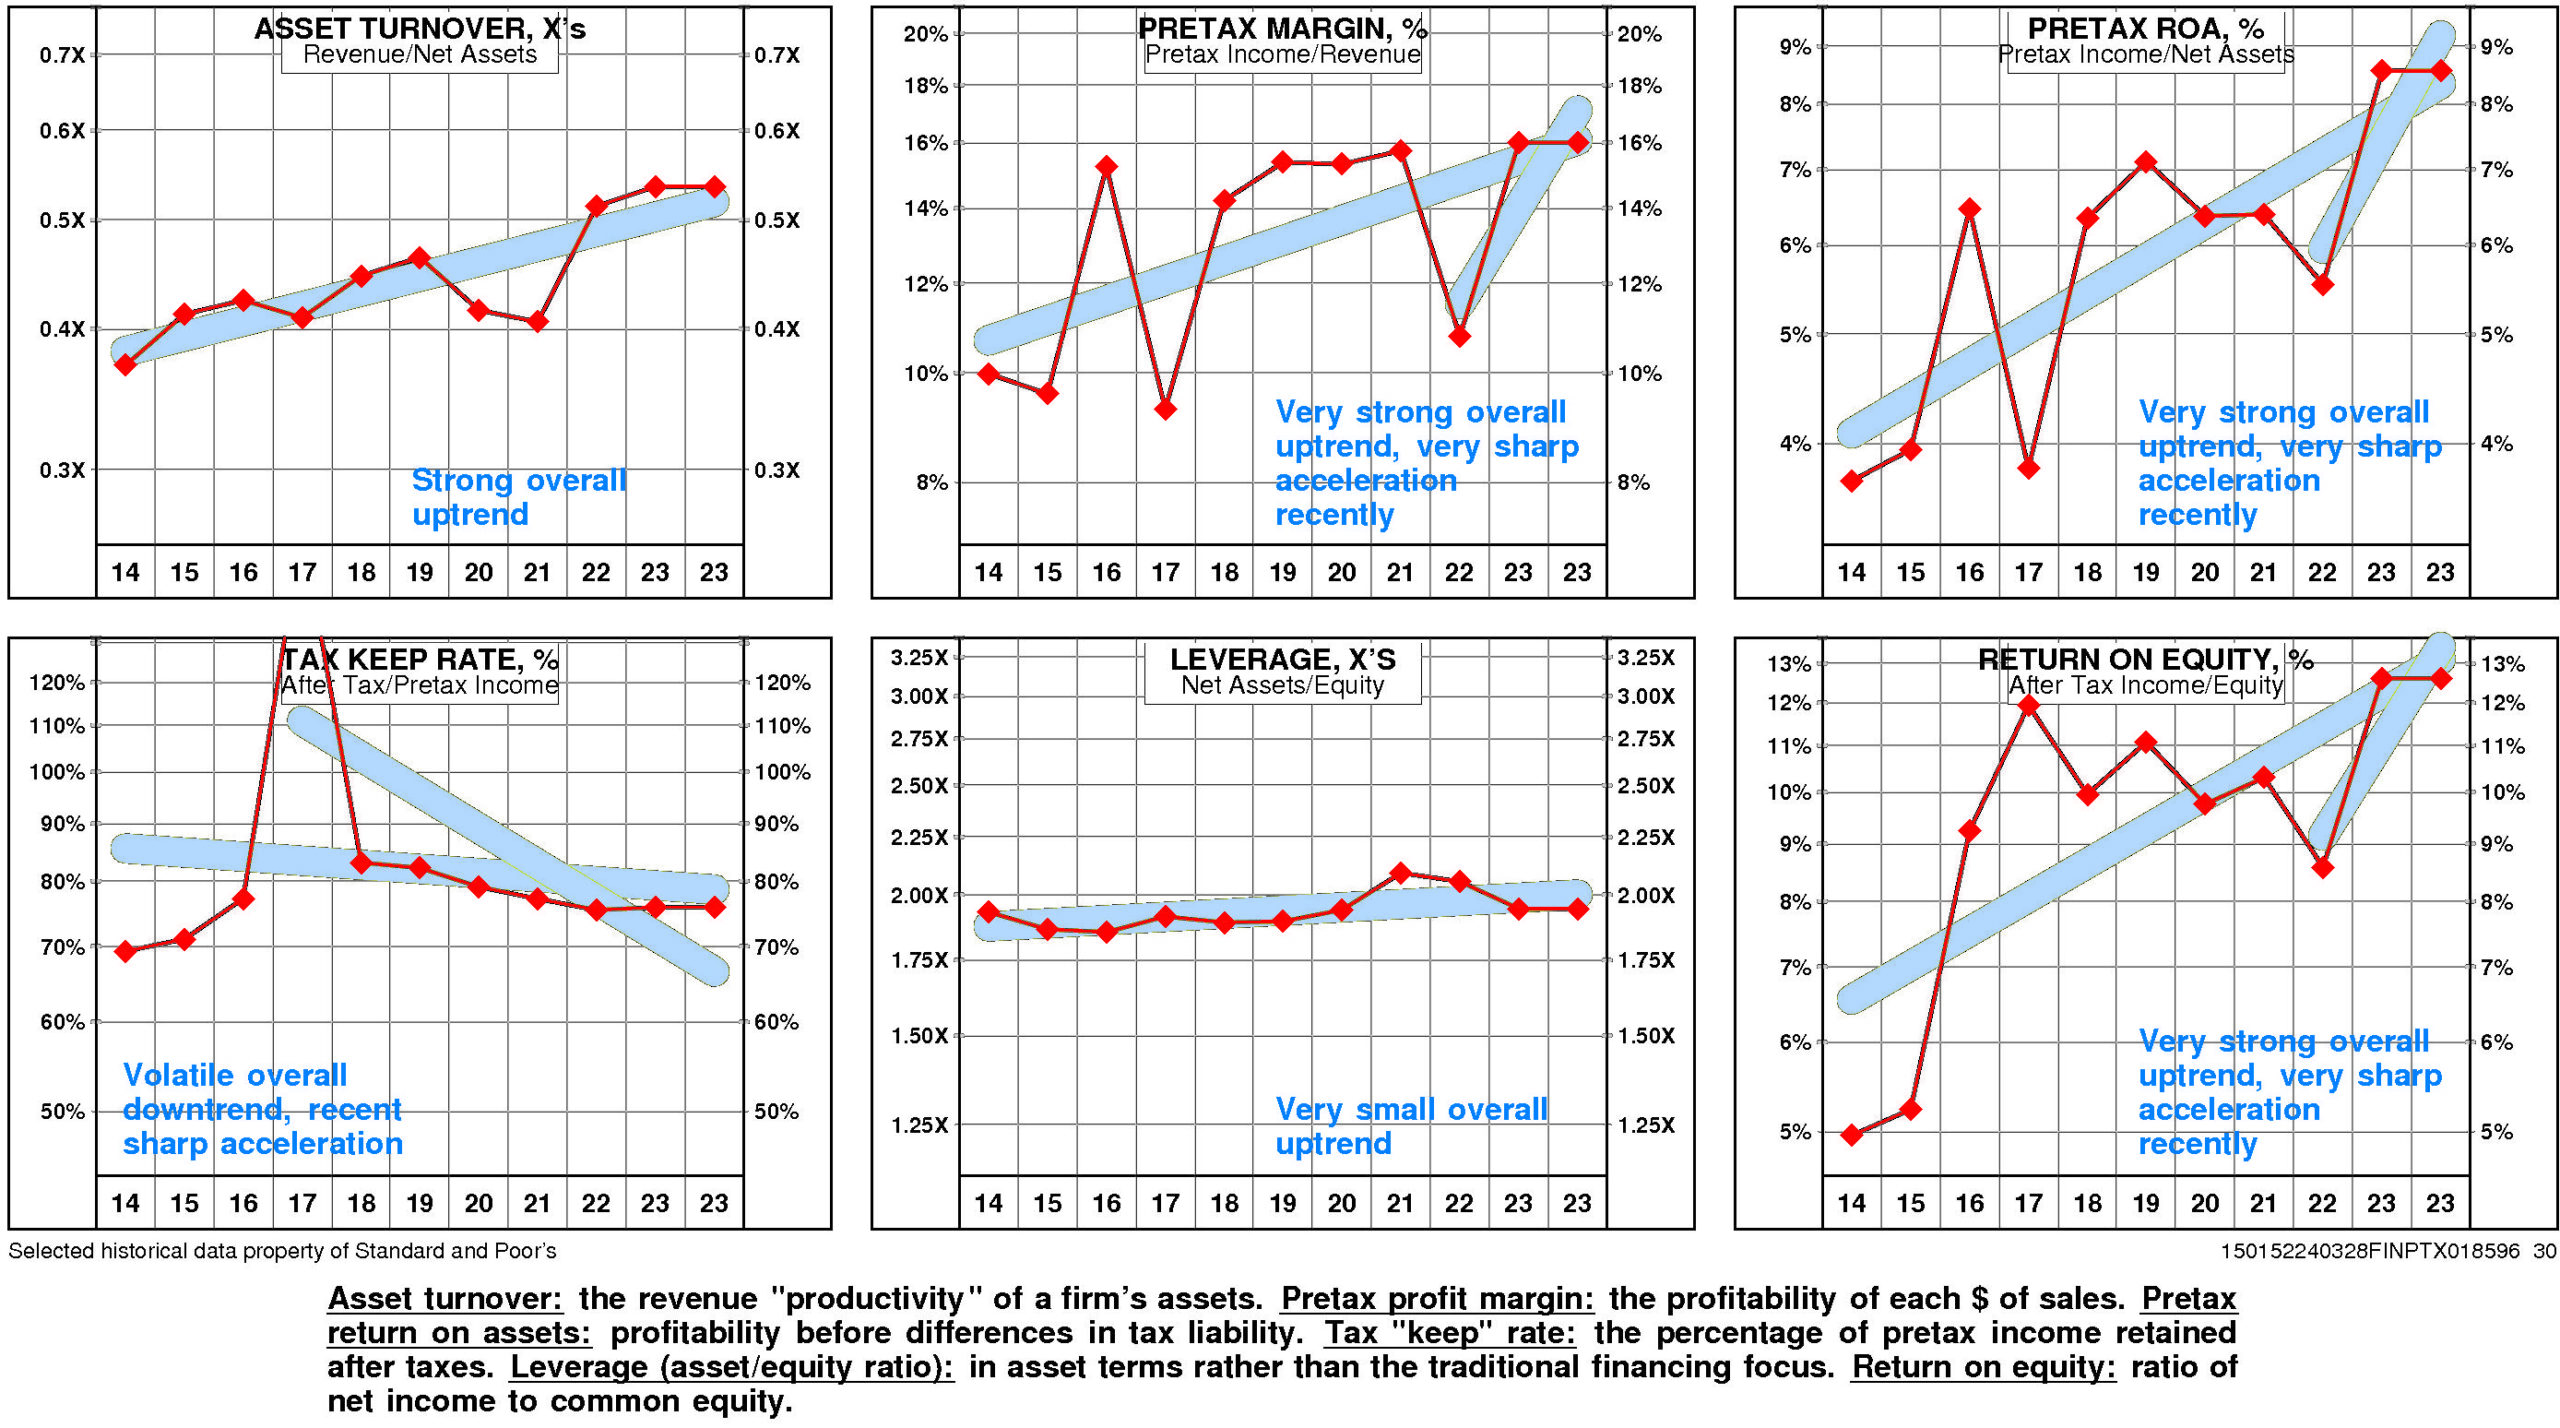
Vulcan Materials’ return on equity has improved very significantly since 2014. The current level of 12.6% is 2.54X the low for the period and is at the high.
This very significant improvement was due to very strong positive trend in pretax operating return and little change in non-operating factors.
The productivity of Vulcan Materials’ assets rose over the full period 2014-2023: asset turnover has enjoyed a strong overall uptrend.
Reinforcing this trend, pretax margin enjoyed a very strong overall uptrend that accelerated very sharply from the 2022 level.
Non-operating factors (income taxes and financial leverage) had little influence on return on equity.
Vulcan Materials’ return on equity is slightly above median (12.6%) for the four quarters ended December, 2023.
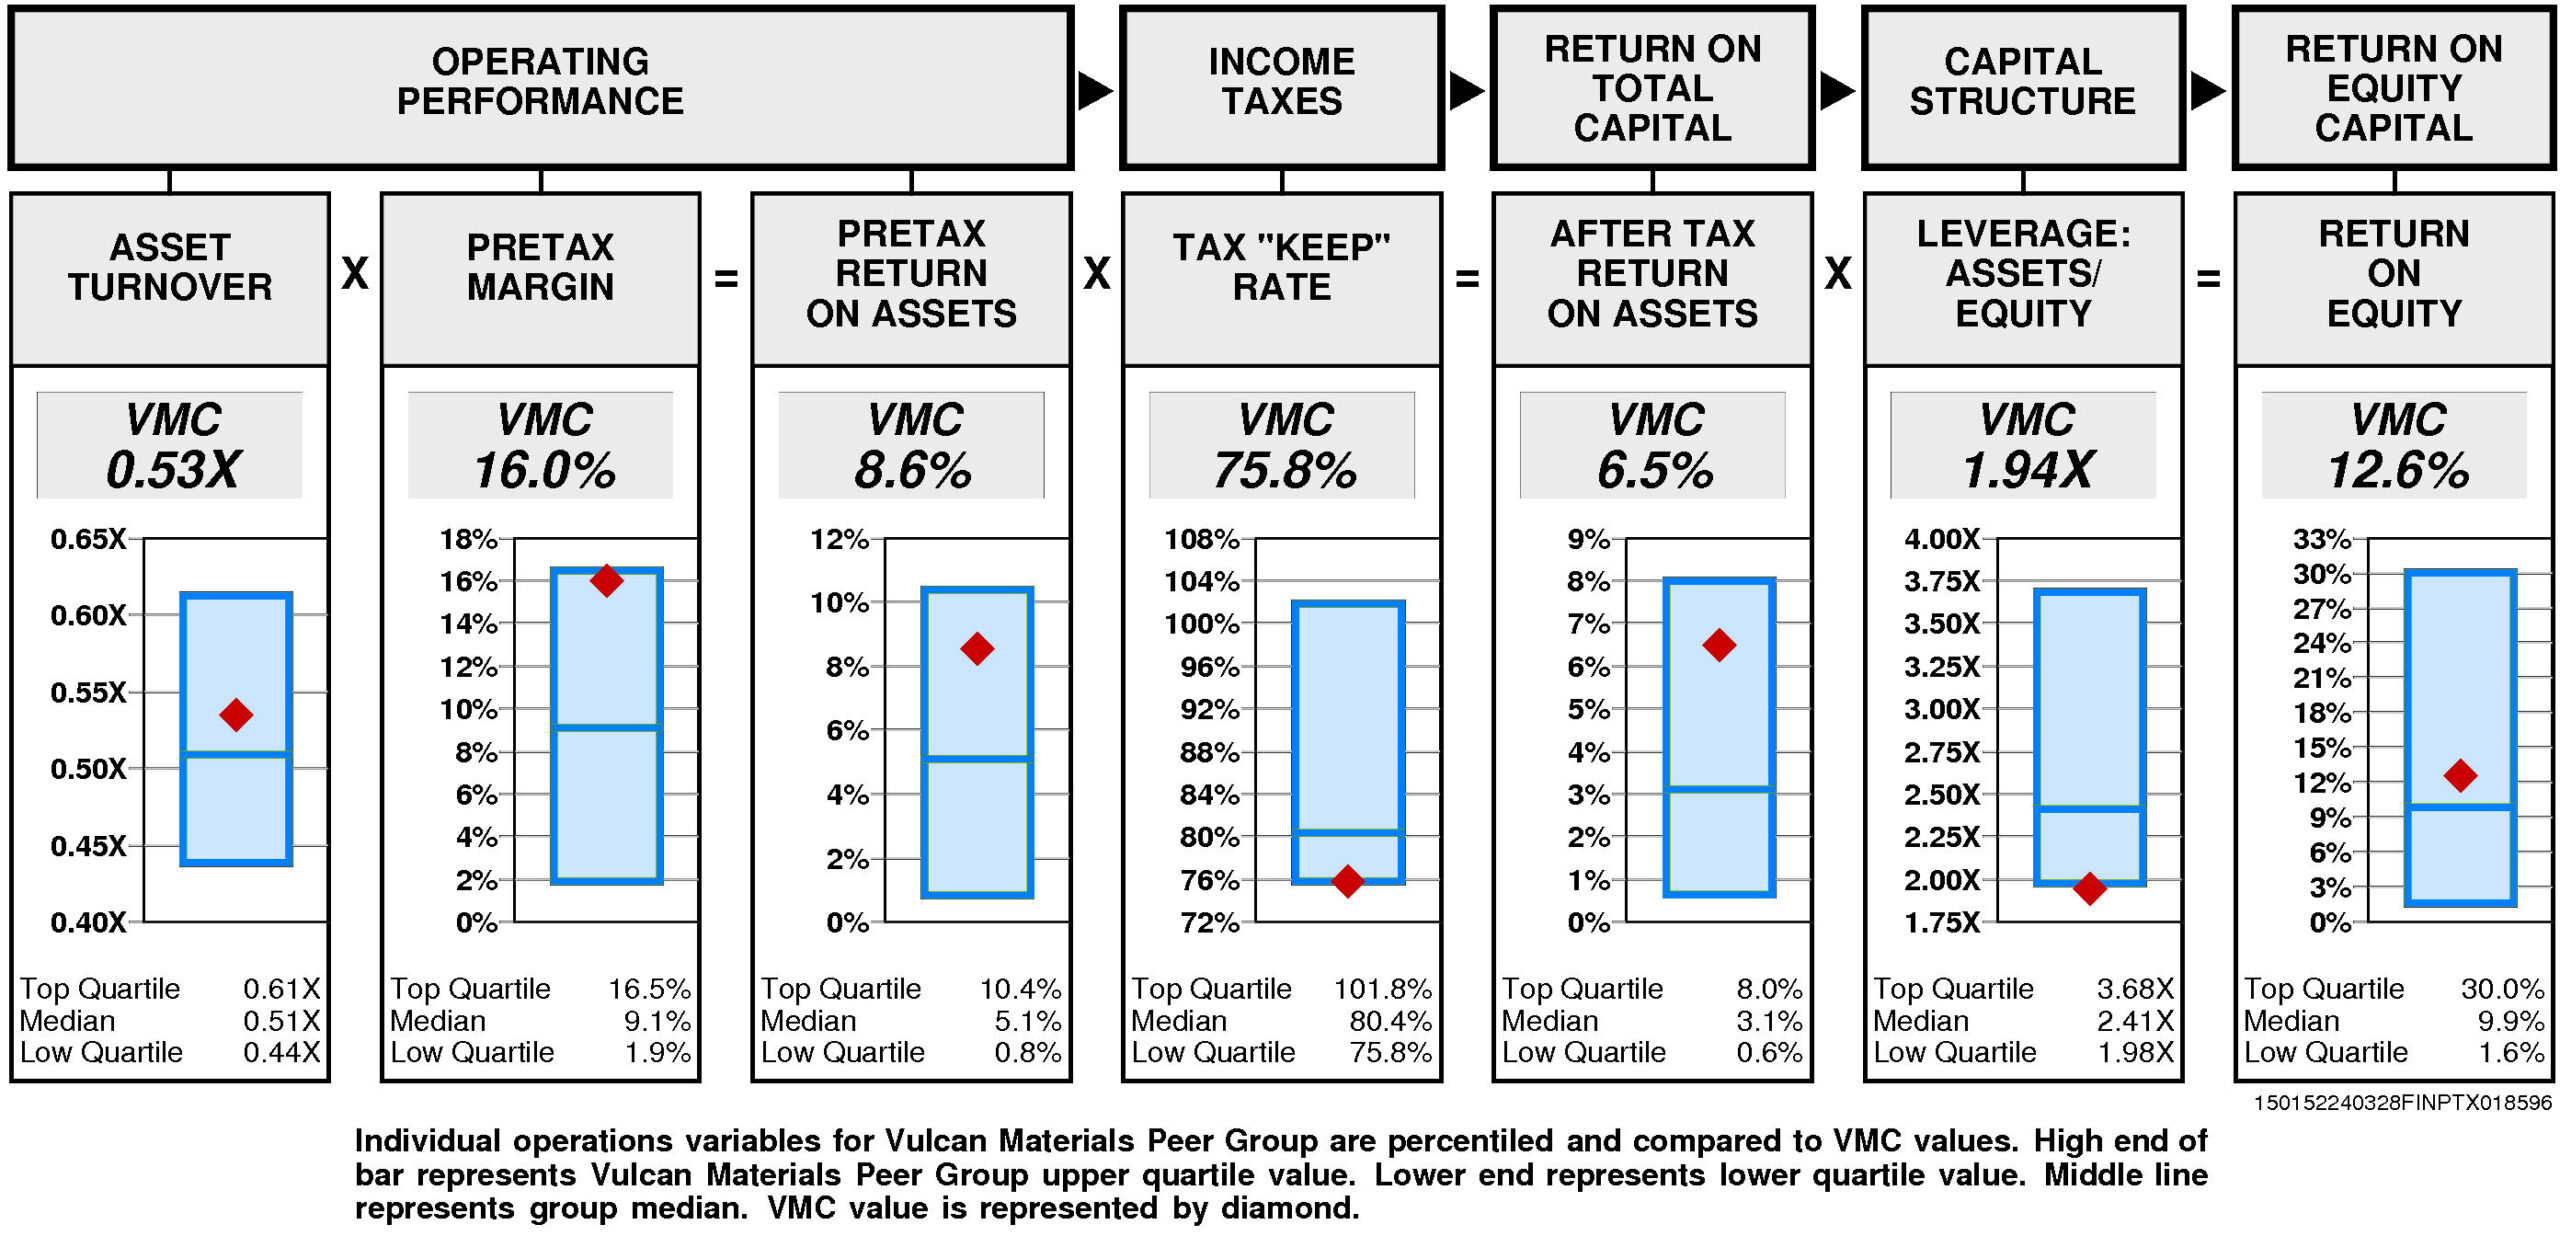
Operating performance (pretax return on assets) is above median (8.6%) reflecting asset turnover that is above median (0.53X) and substantially above median pretax margin (16.0%).
Tax “keep” rate (income tax management) is at the lower quartile (75.8%) resulting in after tax return on assets that is above median.
Financial leverage (leverage) is at the lower quartile (1.94X).
GROWTH RATES
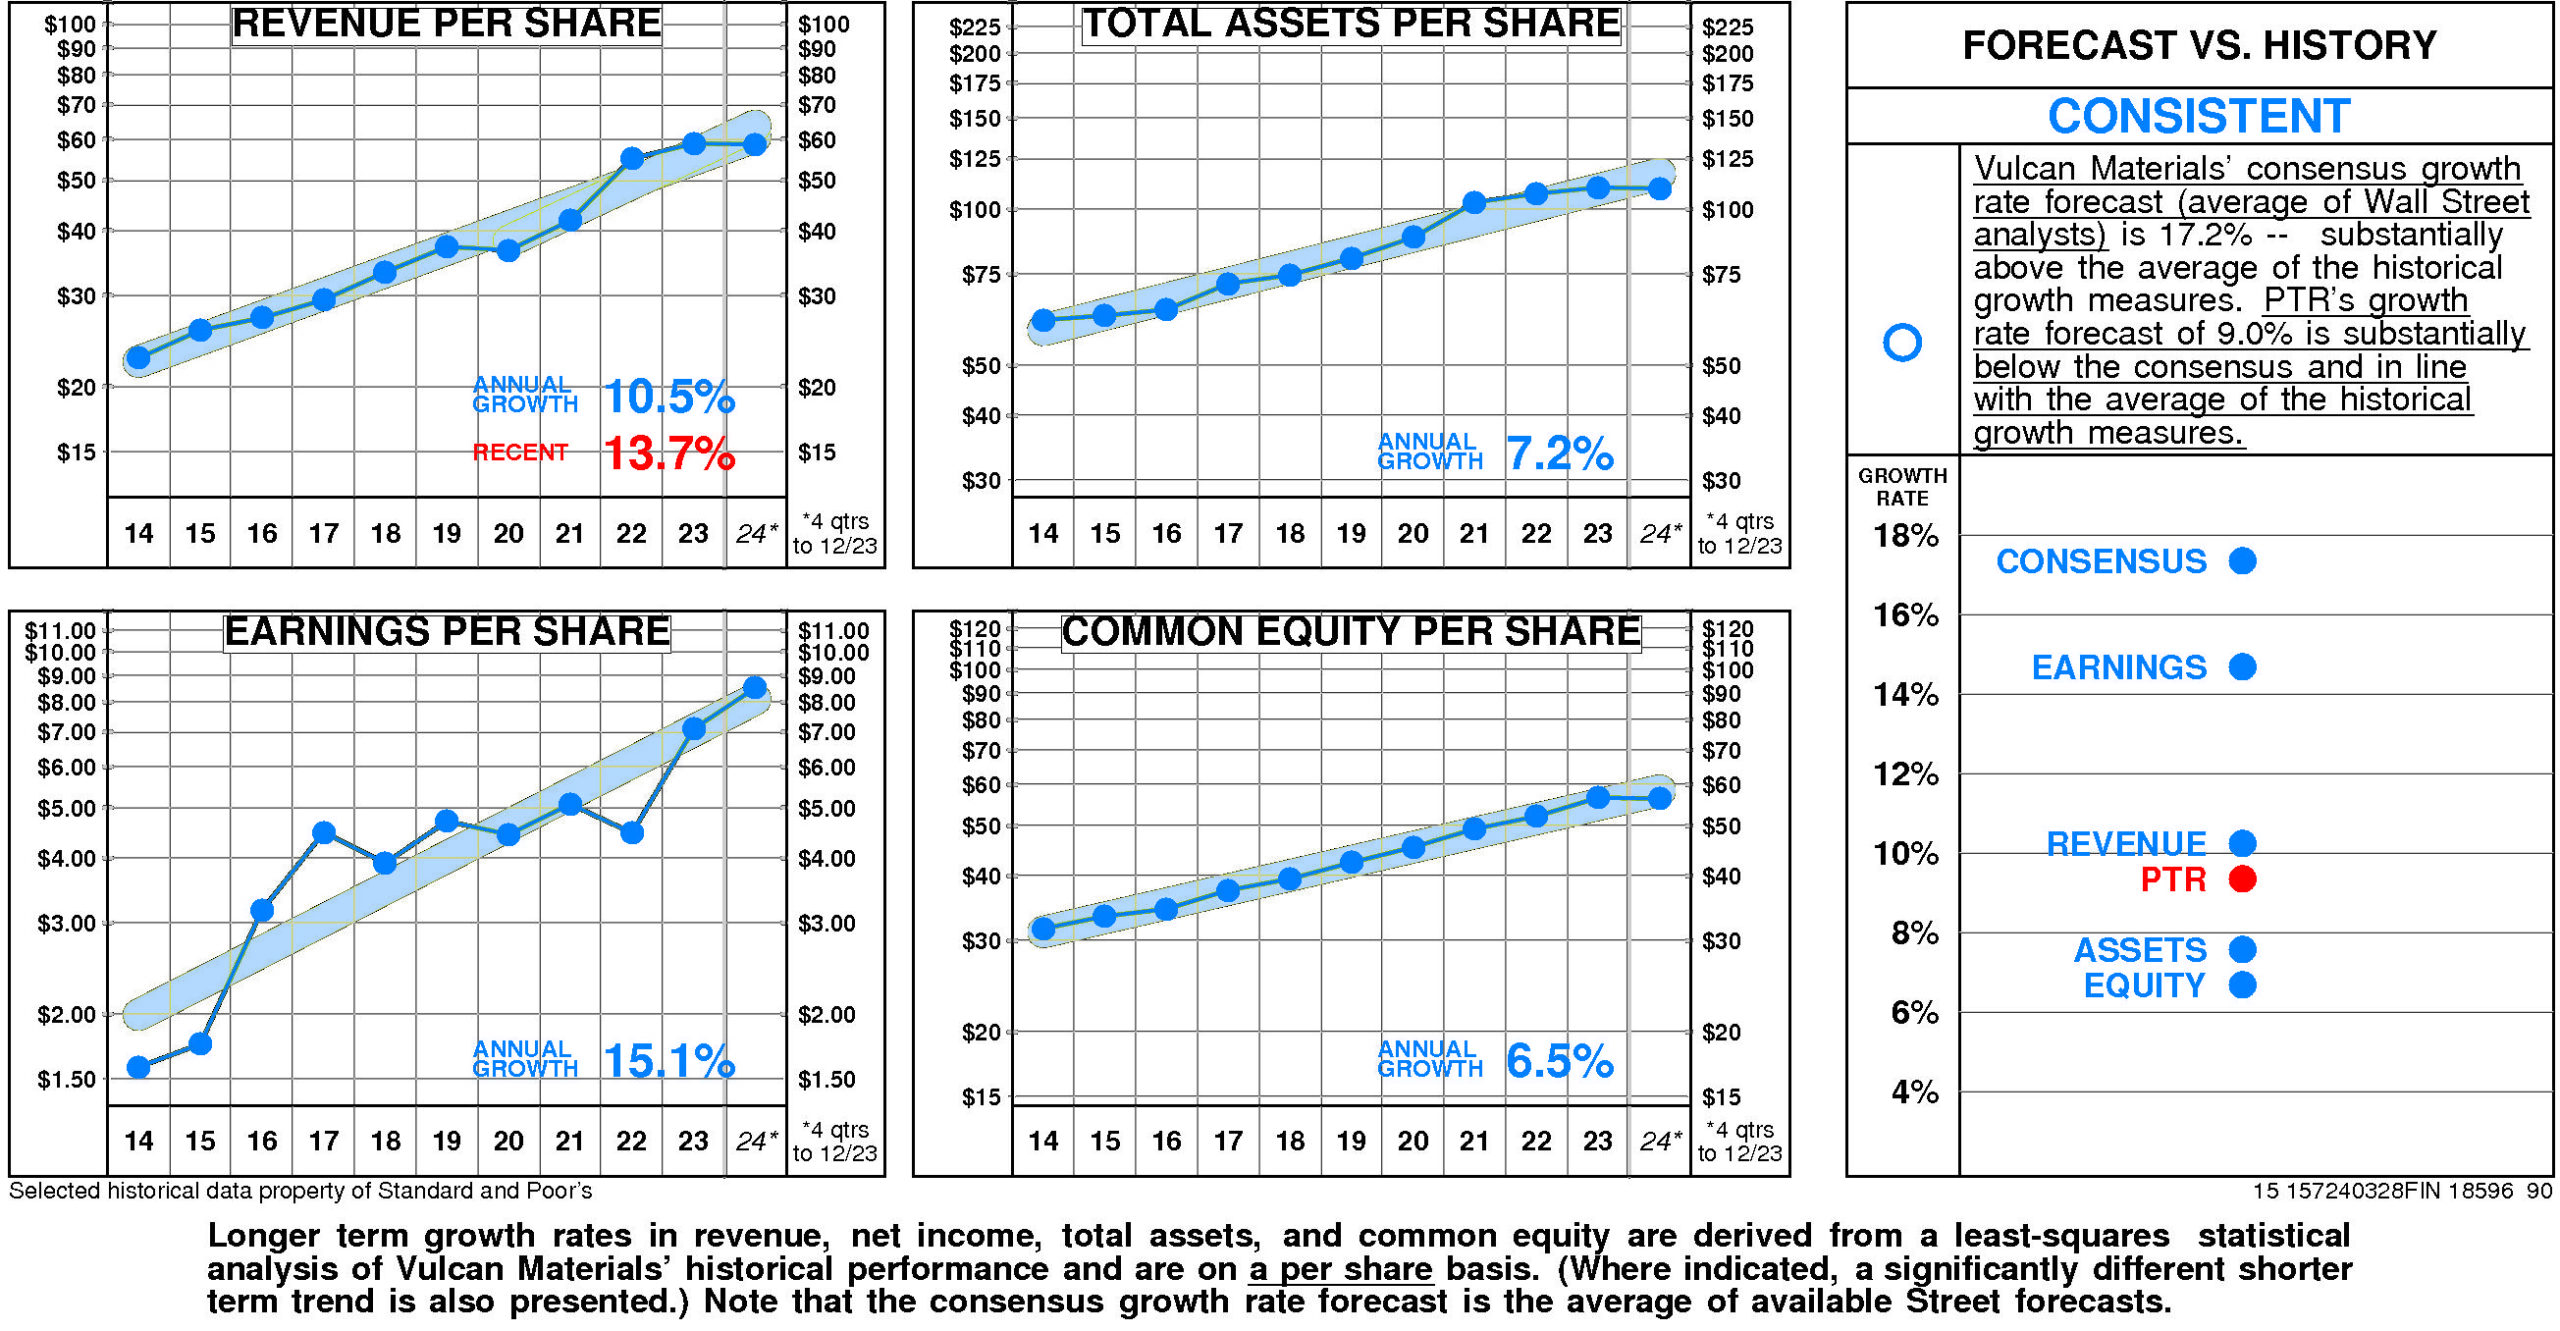
There are no significant differences between Vulcan Materials’ longer term growth and growth in recent years.
Vulcan Materials’ historical income statement growth and balance sheet growth have diverged. Revenue growth has paralleled asset growth; earnings growth has exceeded equity growth.
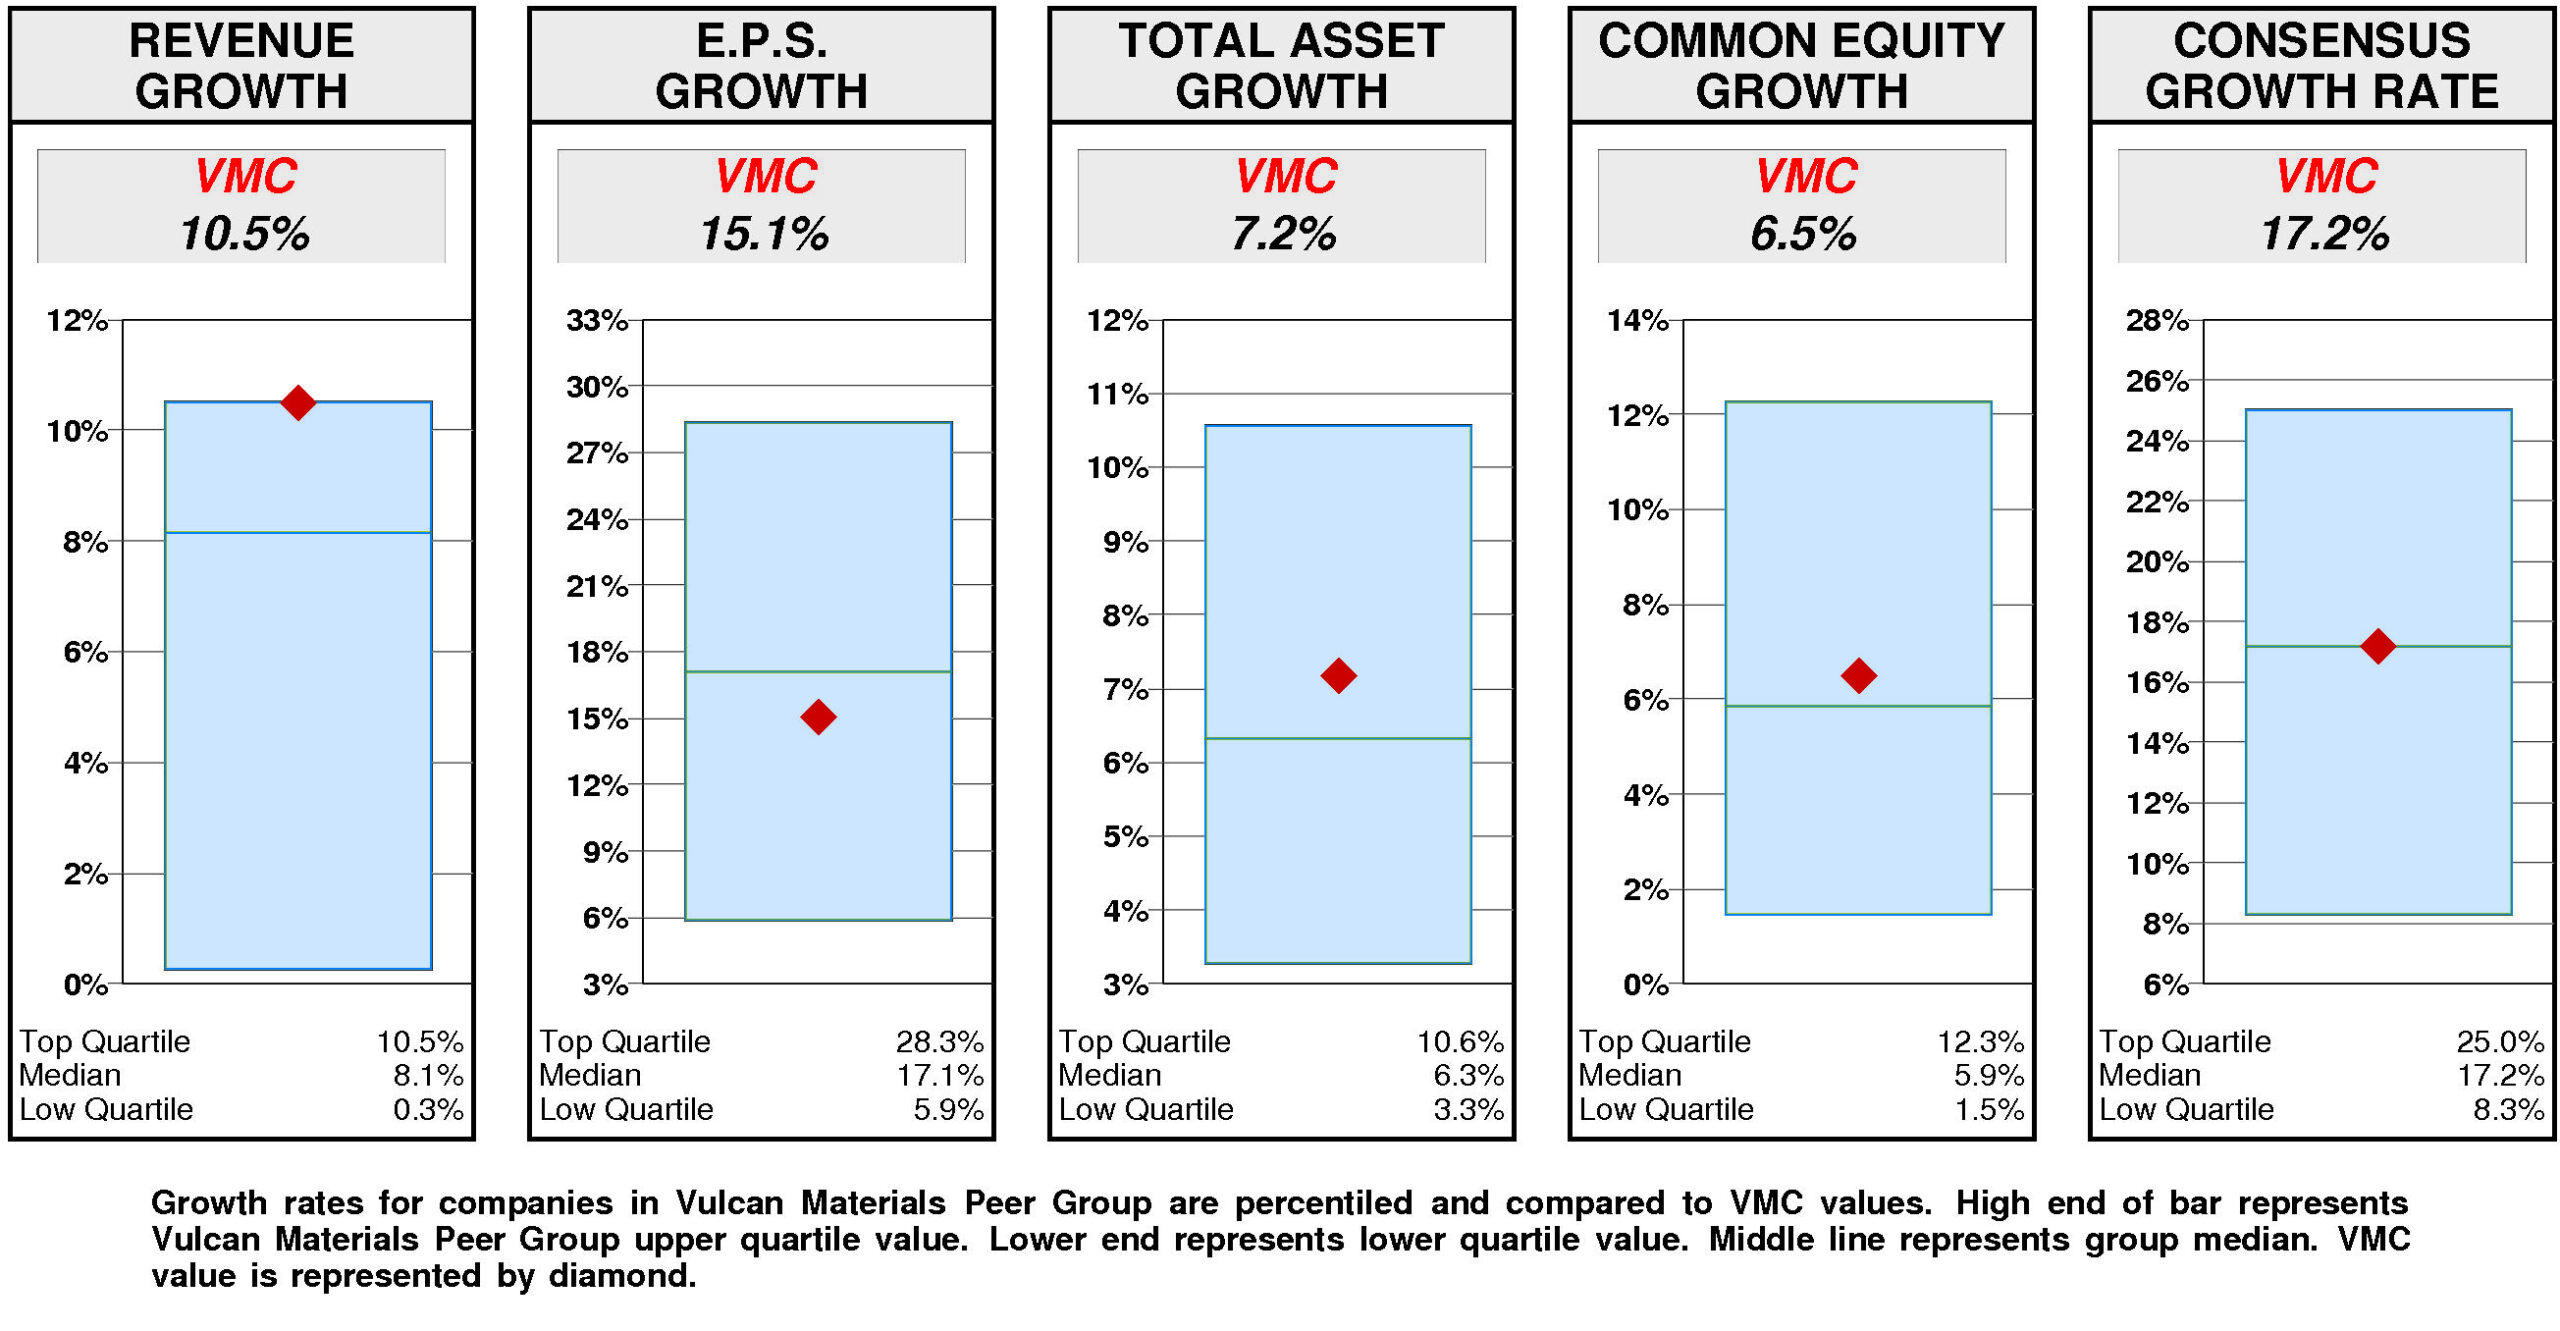
Annual revenue growth has been 10.5% per year. (More recently it has been 13.7%.)
Total asset growth has been 7.2% per year.
Annual E.P.S. growth has been 15.1% per year.
Equity growth has been 6.5% per year.
Vulcan Materials’ consensus growth rate forecast (average of Wall Street analysts) is 17.2% — substantially above the average of the historical growth measures.
Relative to the Vulcan Materials Peer Group, Vulcan Materials’ historical growth measures are erratic. Revenue growth (10.5%) has been at the upper quartile. Total asset growth (7.2%) has been slightly above median. Equity growth (6.5%) has been slightly above median. E.P.S. growth (15.1%) has been slightly below median.
Consensus growth forecast (17.2%) is at median.
PRICE HISTORY
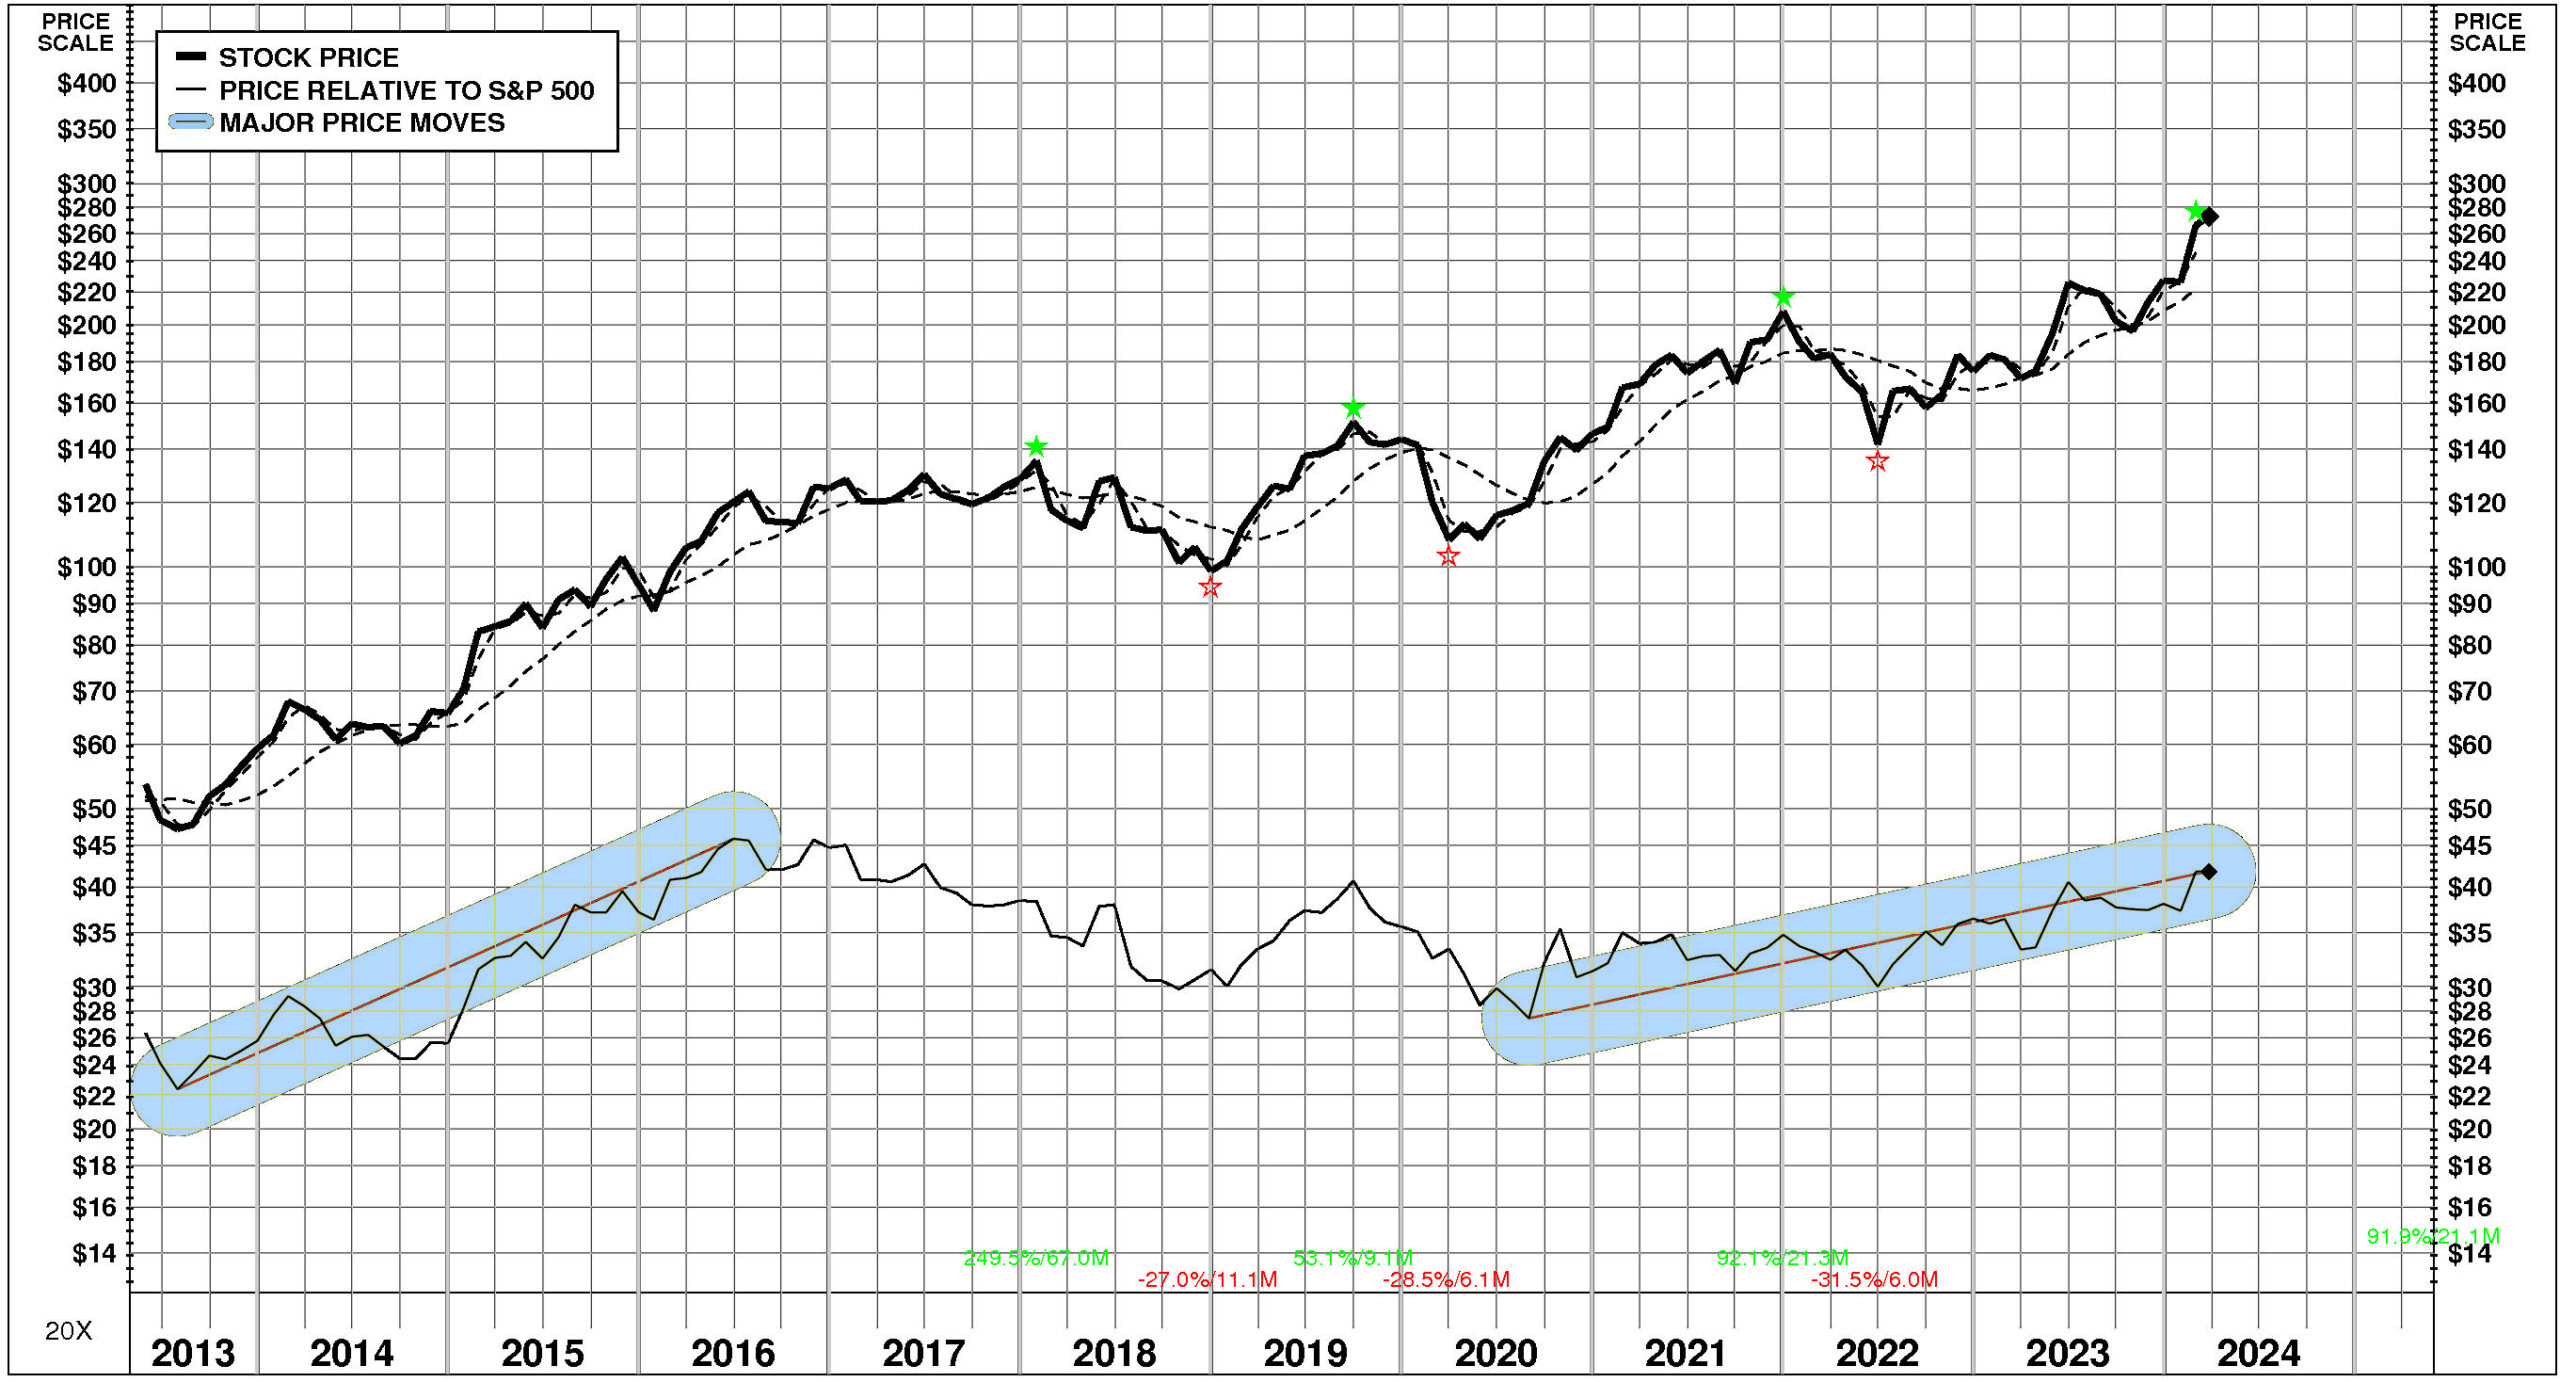
Over the full time period, Vulcan Materials’ stock price performance has been superior. Between May, 2013 and March, 2024, Vulcan Materials’ stock price rose +409%; relative to the market, this was a +59% gain.
TOTAL INVESTMENT RETURNS
Current annual total return performance of 48.2% is upper quartile relative to the S&P 500 Composite.
In addition to being upper quartile relative to S&P 500 Composite, current annual total return performance through February, 2024 of 48.2% is substantially above median relative to Vulcan Materials Co Peer Group.
Current 5-year total return performance of 20.0% is upper quartile relative to the S&P 500 Composite.
Through February, 2024, with upper quartile current 5-year total return of 20.0% relative to S&P 500 Composite, Vulcan Materials’ total return performance is above median relative to Vulcan Materials Co Peer Group.

VALUATION BENCHMARKS
Relative to S&P 500 Composite, VMC’s overall valuation is quite high. The highest factor, the ratio of enterprise value/assets, is near the upper quartile. Price/earnings ratio is upper quartile. Price/equity ratio is above median. Ratio of enterprise value/earnings before interest and taxes is upper quartile. The lowest factor, the ratio of enterprise value/revenue, is above median.
Relative to Vulcan Materials Peer Group, VMC’s overall valuation is quite high. The highest factor, the ratio of enterprise value/assets, is at the upper quartile. Ratio of enterprise value/revenue is at the upper quartile. Price/equity ratio is upper quartile. Price/earnings ratio is above median. The lowest factor, the ratio of enterprise value/earnings before interest and taxes, is above median.
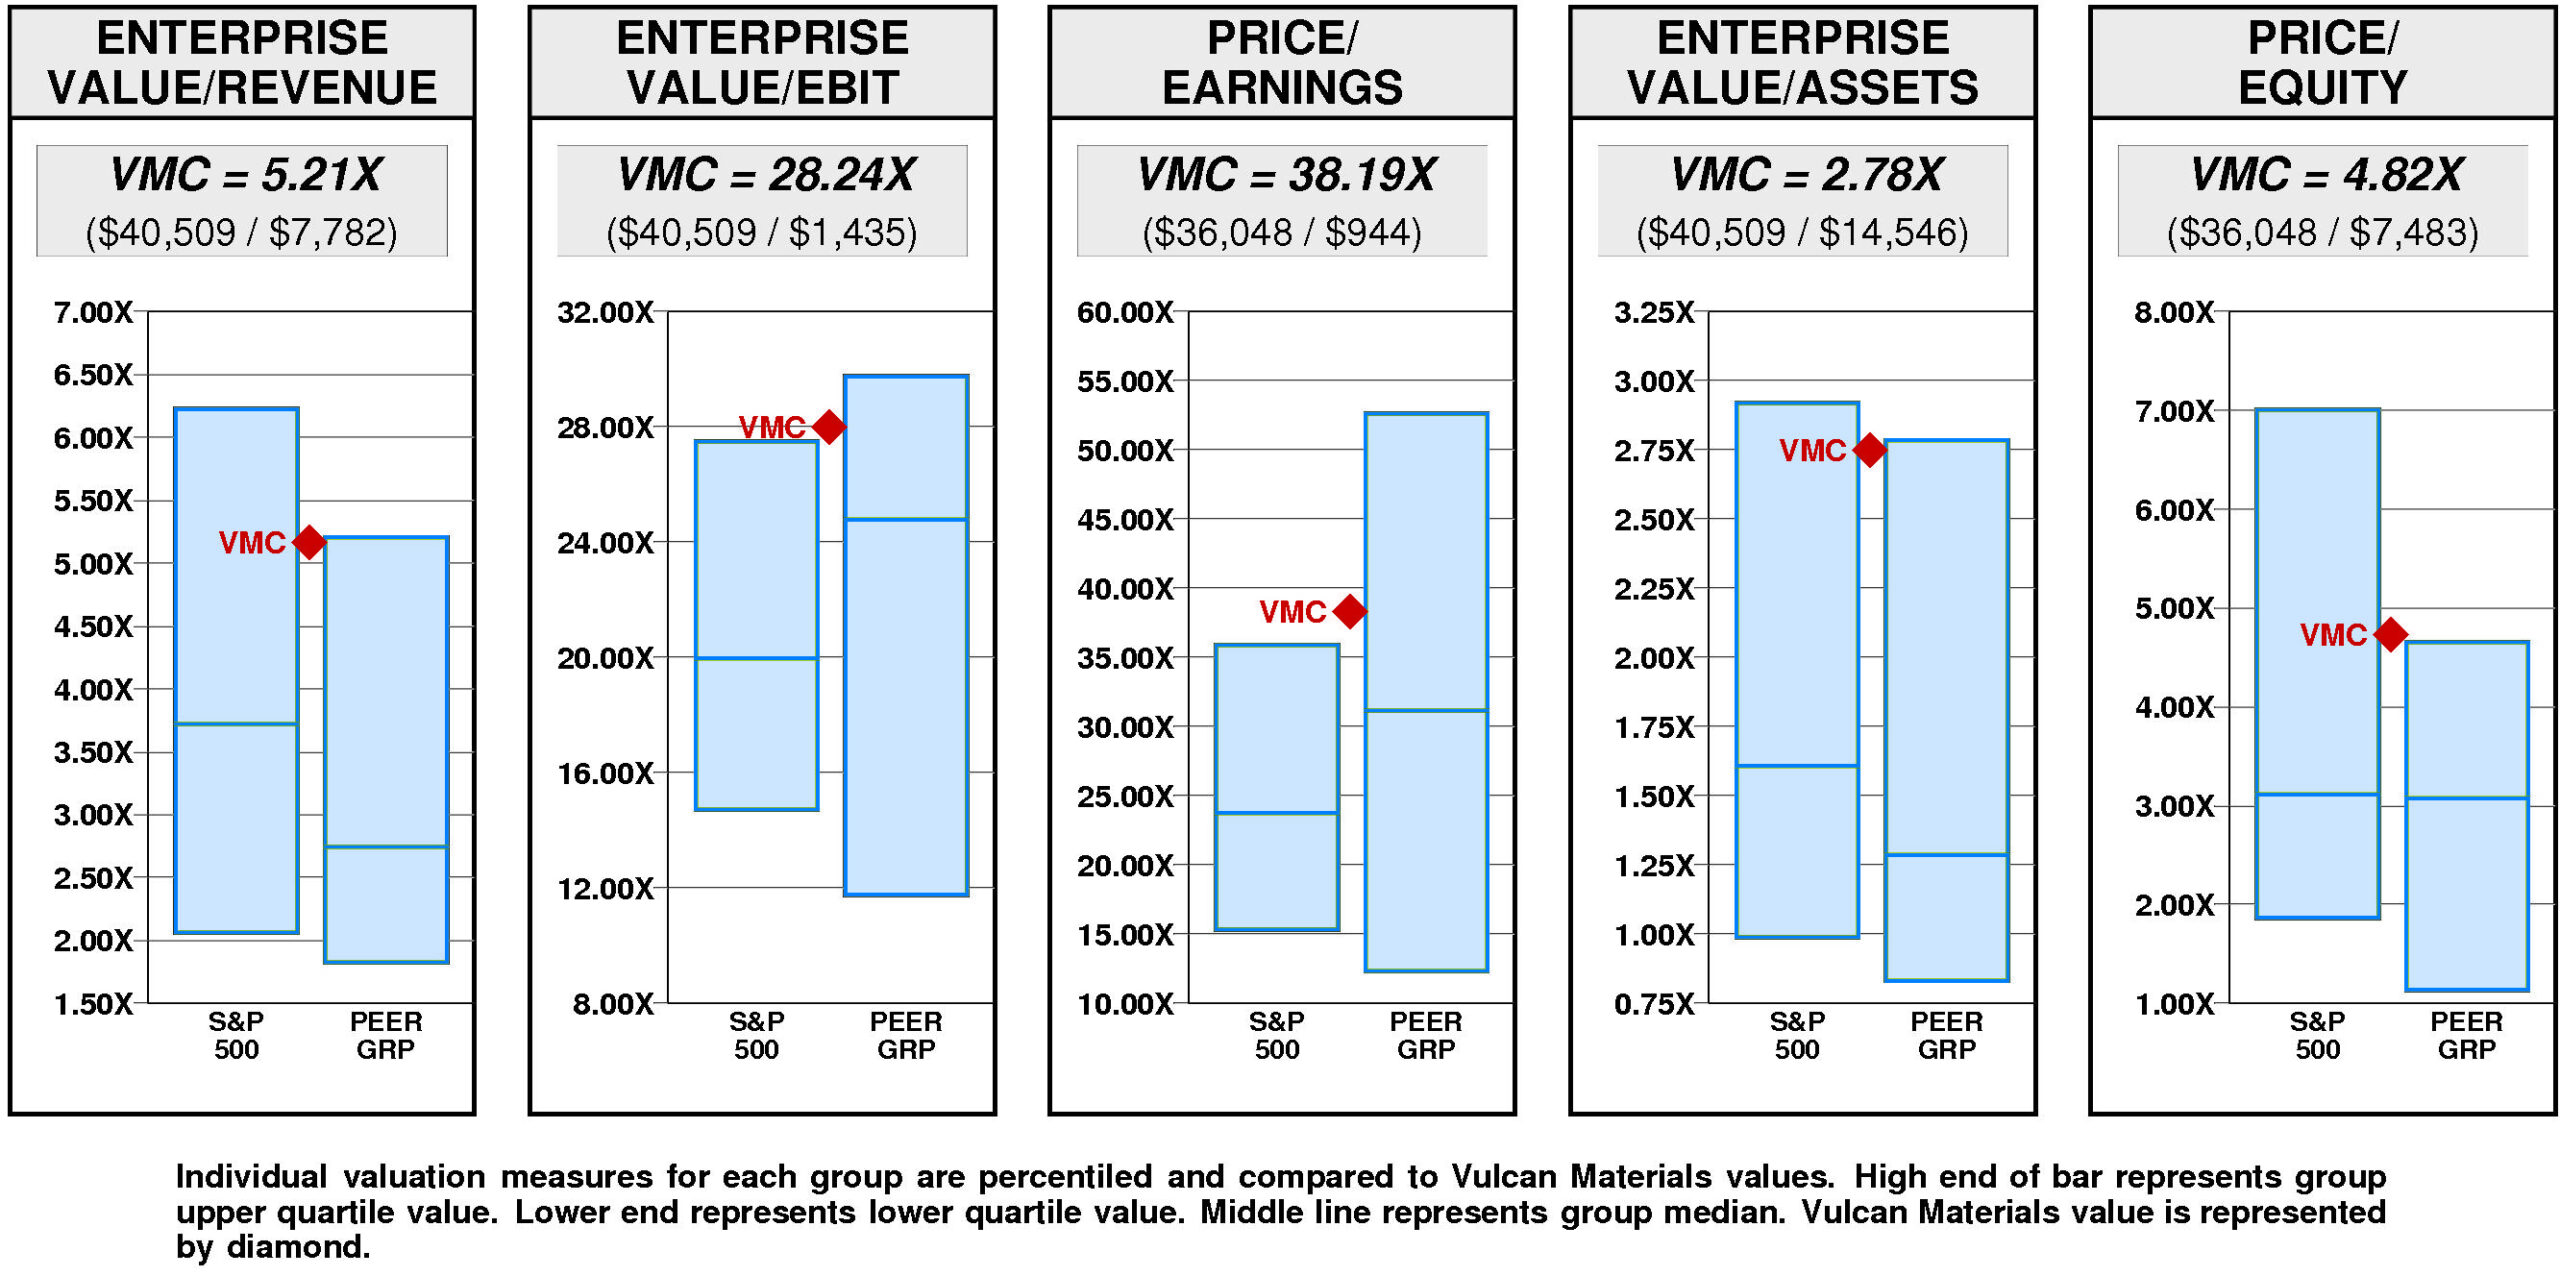
Vulcan Materials has a major value gap compared to the median valuation. For VMC to achieve median valuation, its current ratio of enterprise value/revenue would have to fall from the current level of 5.21X to 2.75X. If VMC’s ratio of enterprise value/revenue were to fall to 2.75X, its stock price would be lower by $-145 to $128.
For VMC to fall to lower quartile valuation relative to the Vulcan Materials Peer Group, its current ratio of enterprise value/revenue would have to fall from the current level of 5.21X to 1.83X. If VMC’s ratio of enterprise value/revenue were to fall to 1.83X, its stock price would decline by $-199 from the current level of $273.
VALUE TARGETS
VMC is expected to continue to be an important Value Builder reflecting capital returns that are forecasted to be above the cost of capital.
Vulcan Materials’ current Price Target of $223 represents a -18% change from the current price of $272.62.
This low appreciation potential results in an appreciation score of 26 (74% of the universe has greater appreciation potential.)
Notwithstanding this low Appreciation Score of 26, the high Power Rating of 76 results in an Value Trend Rating of C.
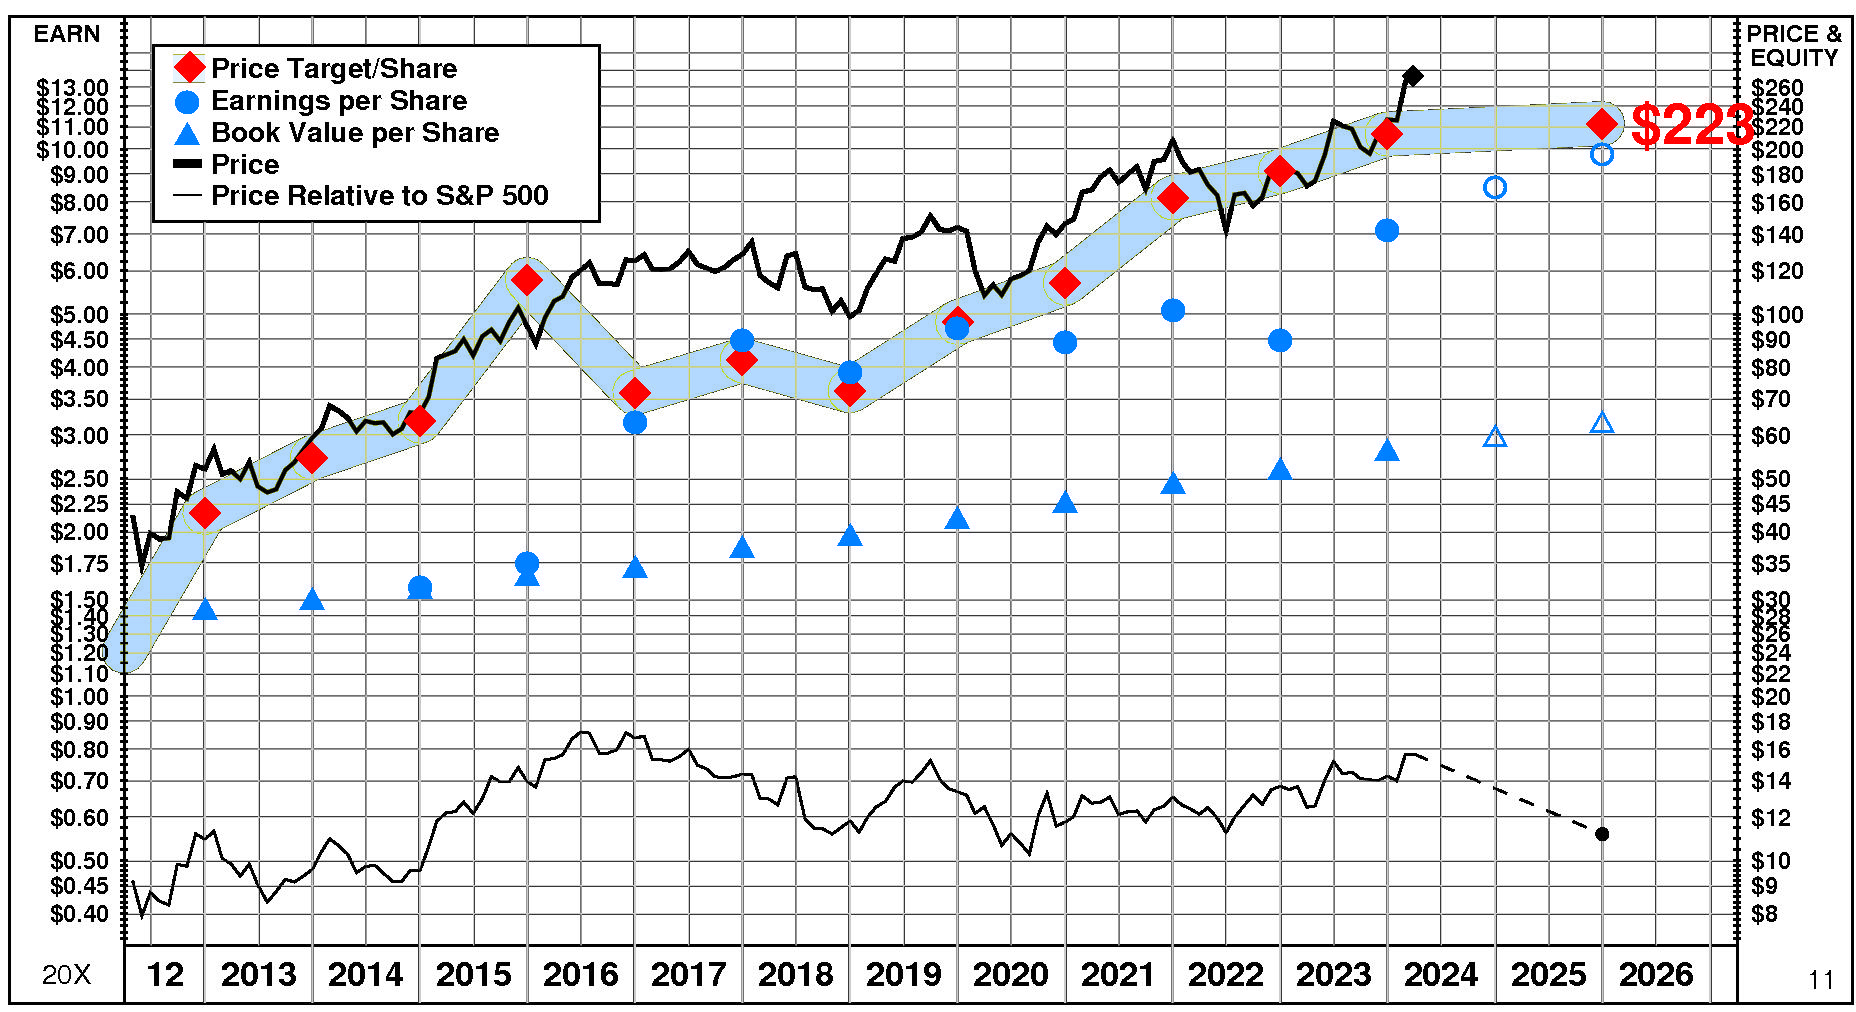
Vulcan Materials’ current Price Target is $223 (+5% from the 2023 Target of $213 but -18% from the 03/25/24 price of $272.62). This plateau in the Target is the result of a +10% increase in the equity base and a -5% decrease in the price/equity multiple. The forecasted increase in cost of equity has a very large negative impact on the price/equity multiple and the forecasted decline in growth has a large negative impact as well. Partially offsetting these Drivers, the forecasted increase in return on equity has a very large positive impact.
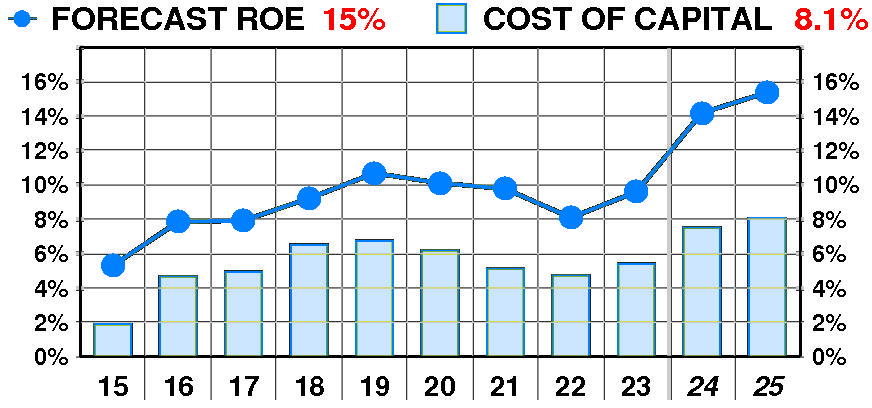
PTR’s return on equity forecast is 15.4% — above our recent forecasts. Forecasted return on equity enjoyed a dramatic, erratic increase between 2015 and 2023. The current forecast is significantly above the 2015 low of 5%.
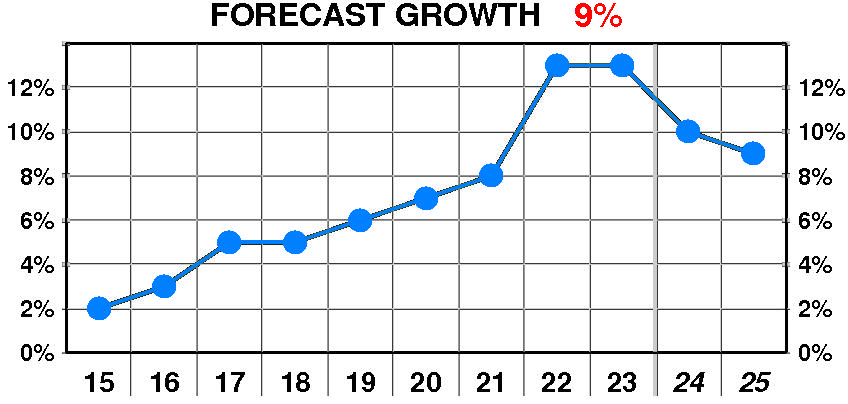
PTR’s growth forecast is 9.0% — slightly below our recent forecasts. Forecasted growth enjoyed a dramatic, steady increase between 2015 and 2023. The current forecast is well above the 2015 low of 2%.
PTR’s cost of equity forecast is 8.1% — slightly above recent levels. Forecasted cost of equity suffered a dramatic, erratic increase between 2015 and 2023. The current forecast is well above the 2015 low of 1.9%.
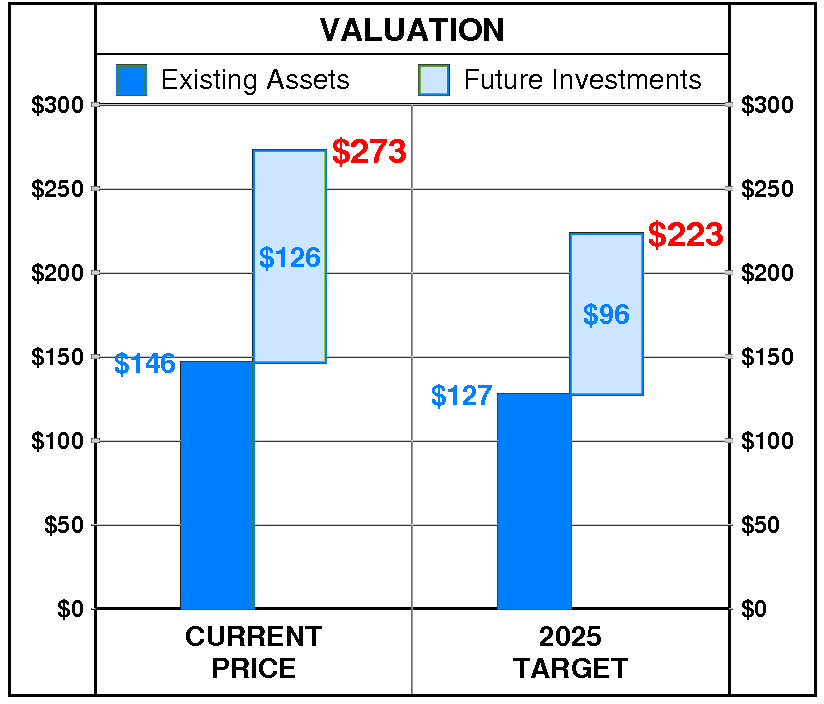
At Vulcan Materials’ current price of $272.62, investors are placing a positive value of $126 on its future investments. This view is consistent with the company’s most recent performance that reflected a growth rate of 13.0% per year, and a return on equity of 9.6% versus a cost of equity of 5.4%.
PTR’s 2025 Price Target of $223 is based on these forecasts and reflects an estimated value of existing assets of $127 and a value of future investments of $96.
Be the first to comment