![]()
BUSINESS
Movado Group, Inc. designs, sources, markets, and distributes watches worldwide. The company operates in two segments, Watch and Accessory Brands, and Company Stores. It offers its watches under the Movado, Concord, Ebel, Olivia Burton, and MVMT brands, as well as licensed brands, such as Coach, Tommy Hilfiger, HUGO BOSS, Lacoste, Calvin Klein, and Scuderia Ferrari. The company also provides after-sales and shipping services. Its customers include jewelry store chains, department stores, independent regional jewelers, network of independent distributors, online marketplaces, licensors’ retail stores, and third-party e-commerce retailers. The company also sells directly to consumers through its e-commerce platforms. As of January 31, 2022, it operated 51 retail outlet locations.
INVESTMENT RATING
With future capital returns forecasted to exceed the cost of capital, MOV is expected to continue to be an important Value Builder.
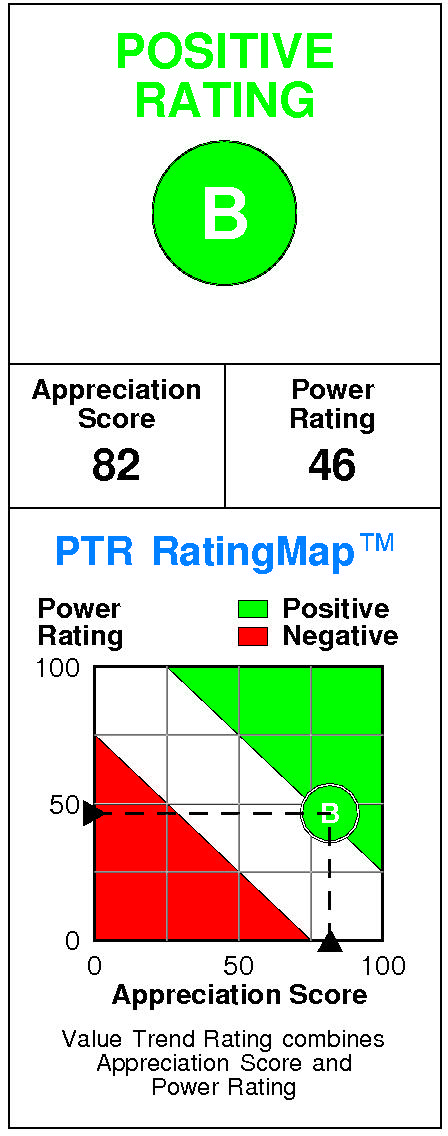
Movado Group has a current Value Trend Rating of B (Positive).
The Value Trend Rating reflects inconsistent signals from PTR’s two proprietary measures of a stock’s attractiveness. Movado Group has a good Appreciation Score of 82 but a neutral Power Rating of 46, and the Positive Value Trend Rating results.
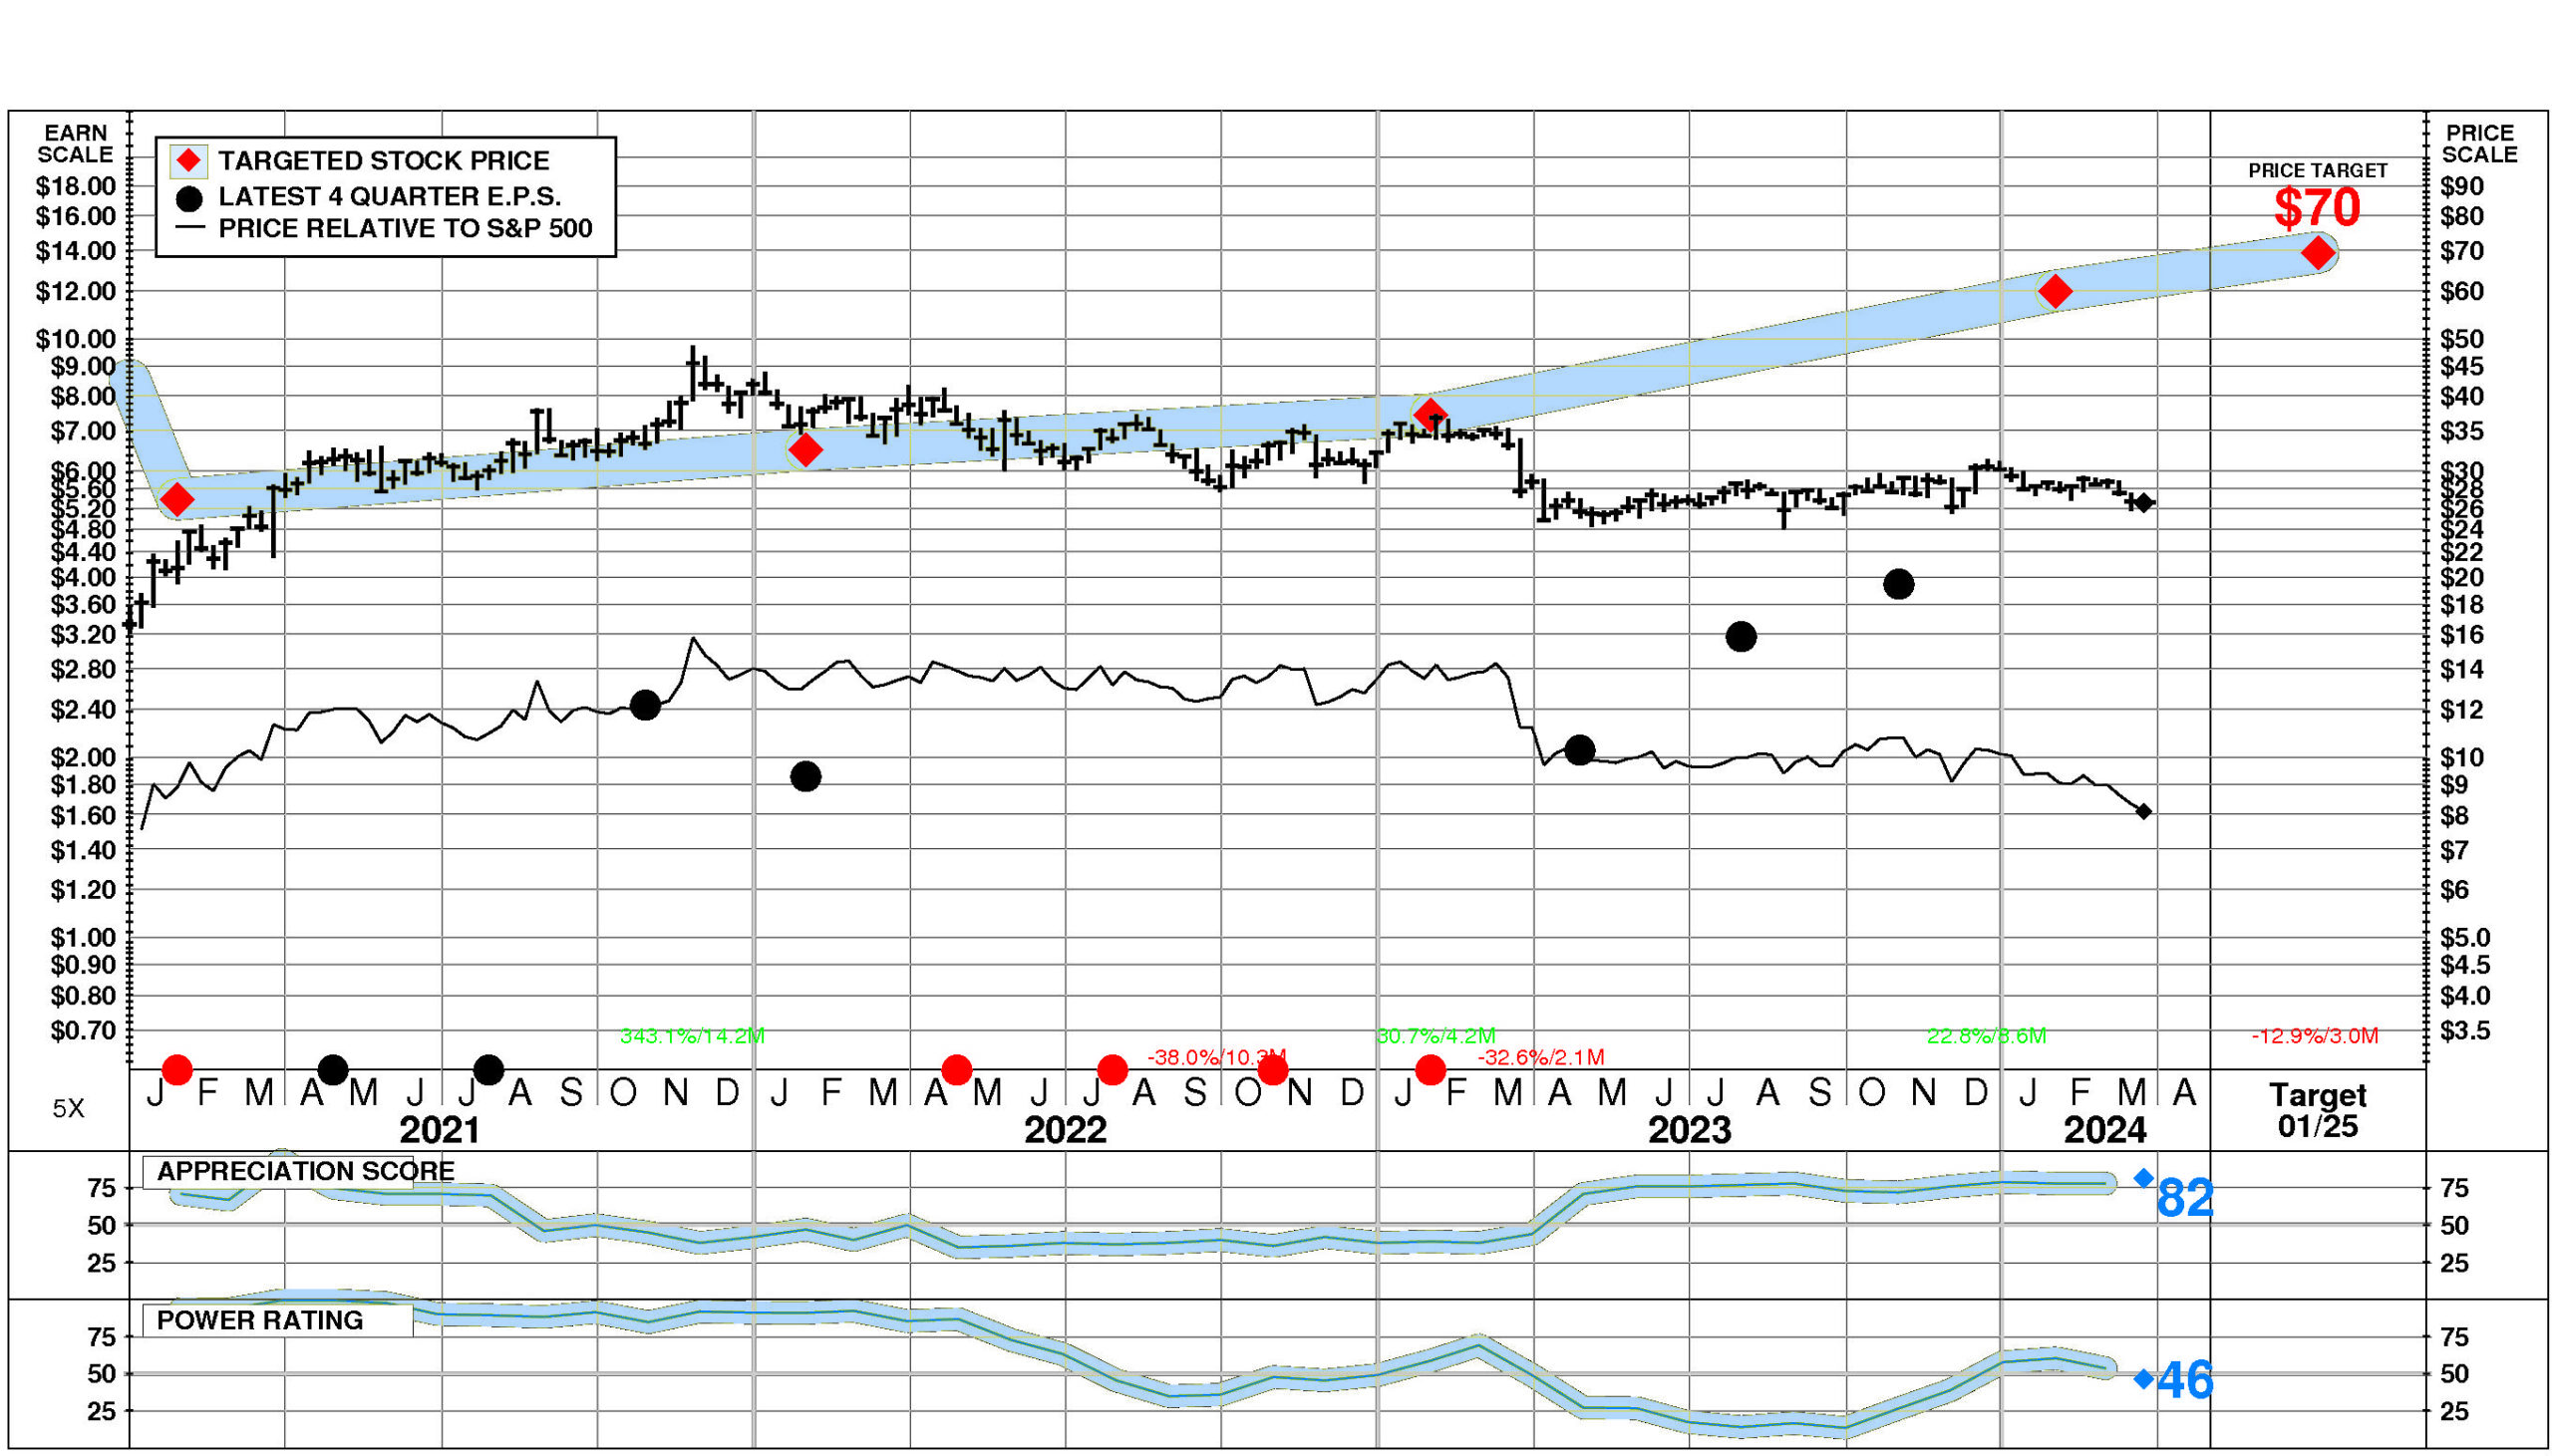
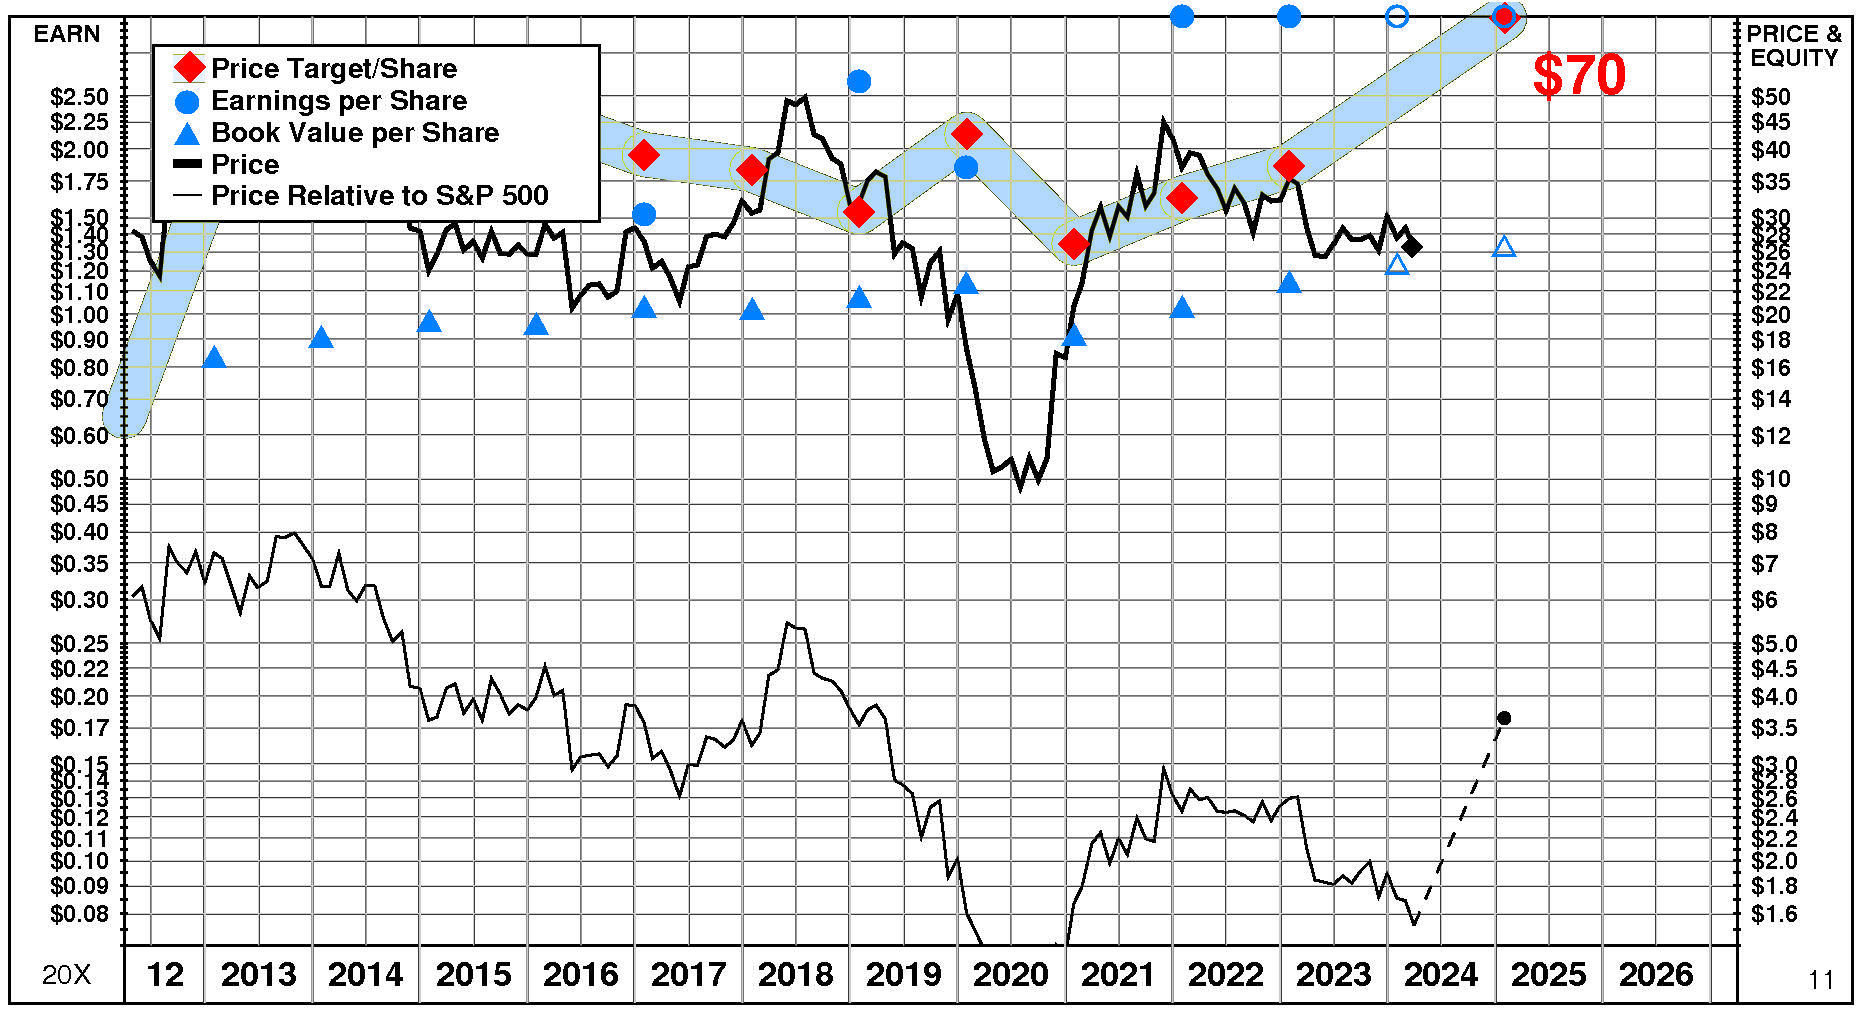
Movado Group’s stock is selling well below targeted value. The current stock price of $26.57 compares to targeted value 12 months forward of $71.
Movado Group’s high appreciation potential results in an appreciation score of 82 (only 18% of the universe has greater appreciation potential.)
Movado Group has a Power Rating of 46. (This neutral Power Rating indicates that MOV’s chances of enjoying attractive investment performance over the near to intermediate term are only average.)
Contributing to this neutral Power Rating: the Watches, Clocks and Parts comparison group is in an extremely unfavorable position currently. An offsetting factor is recent price action has been neutral.
INVESTMENT PROFILE
MOV’s financial strength is high. Financial strength rating is 78.
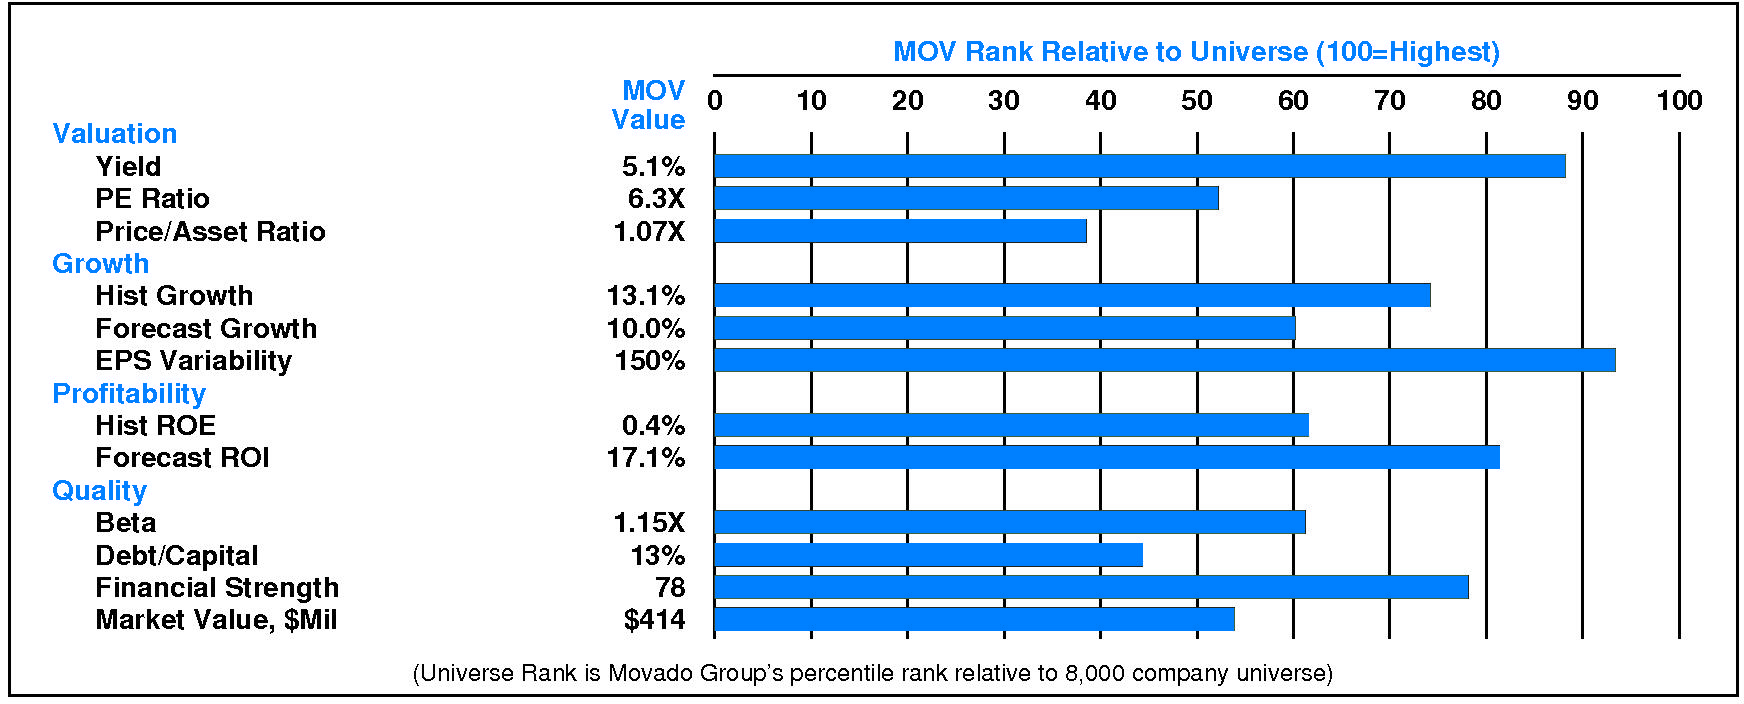
Relative to the S&P 500 Composite, Movado Group Inc has moderate Value characteristics; its appeal is likely to be to investors heavily oriented toward Income; the perception is that MOV is normal risk. Low financial leverage is a positive for MOV. Relative weaknesses include: low historical profitability, and high earnings variability. MOV’s valuation is low: high dividend yield, low P/E ratio, and low price/book ratio. MOV has unusually low market capitalization.
CURRENT SIGNALS
Movado Group’s current operations are eroding. Return on equity is falling, reflecting: falling asset utilization; declining pretax margin; and falling leverage.
Movado Group’s current technical position is moderately positive. The stock price is in a 8.6 month up move. The stock has appreciated 22.8% from its prior low. The stock price is above its 200 day moving average which is in an uptrend.
ALERTS
Movado Group Inc (NYSE: MOV) has recently experienced moderate negative changes in fundamentals. Negative developments: the stock’s power rating fell below 50, and significant quarterly sales deceleration occurred. Positive development: significant quarterly earnings acceleration occurred.
The stock is currently rated B.
Movado Group Inc (NYSE: MOV) stock was unchanged 0.0% on 3/22/24. The shares closed at $26.57. However, trading volume in this flat performance was below average at 70% of normal. The stock has performed in line with the market over the last nine months and has risen 2.0% during the last week.
CASH FLOW
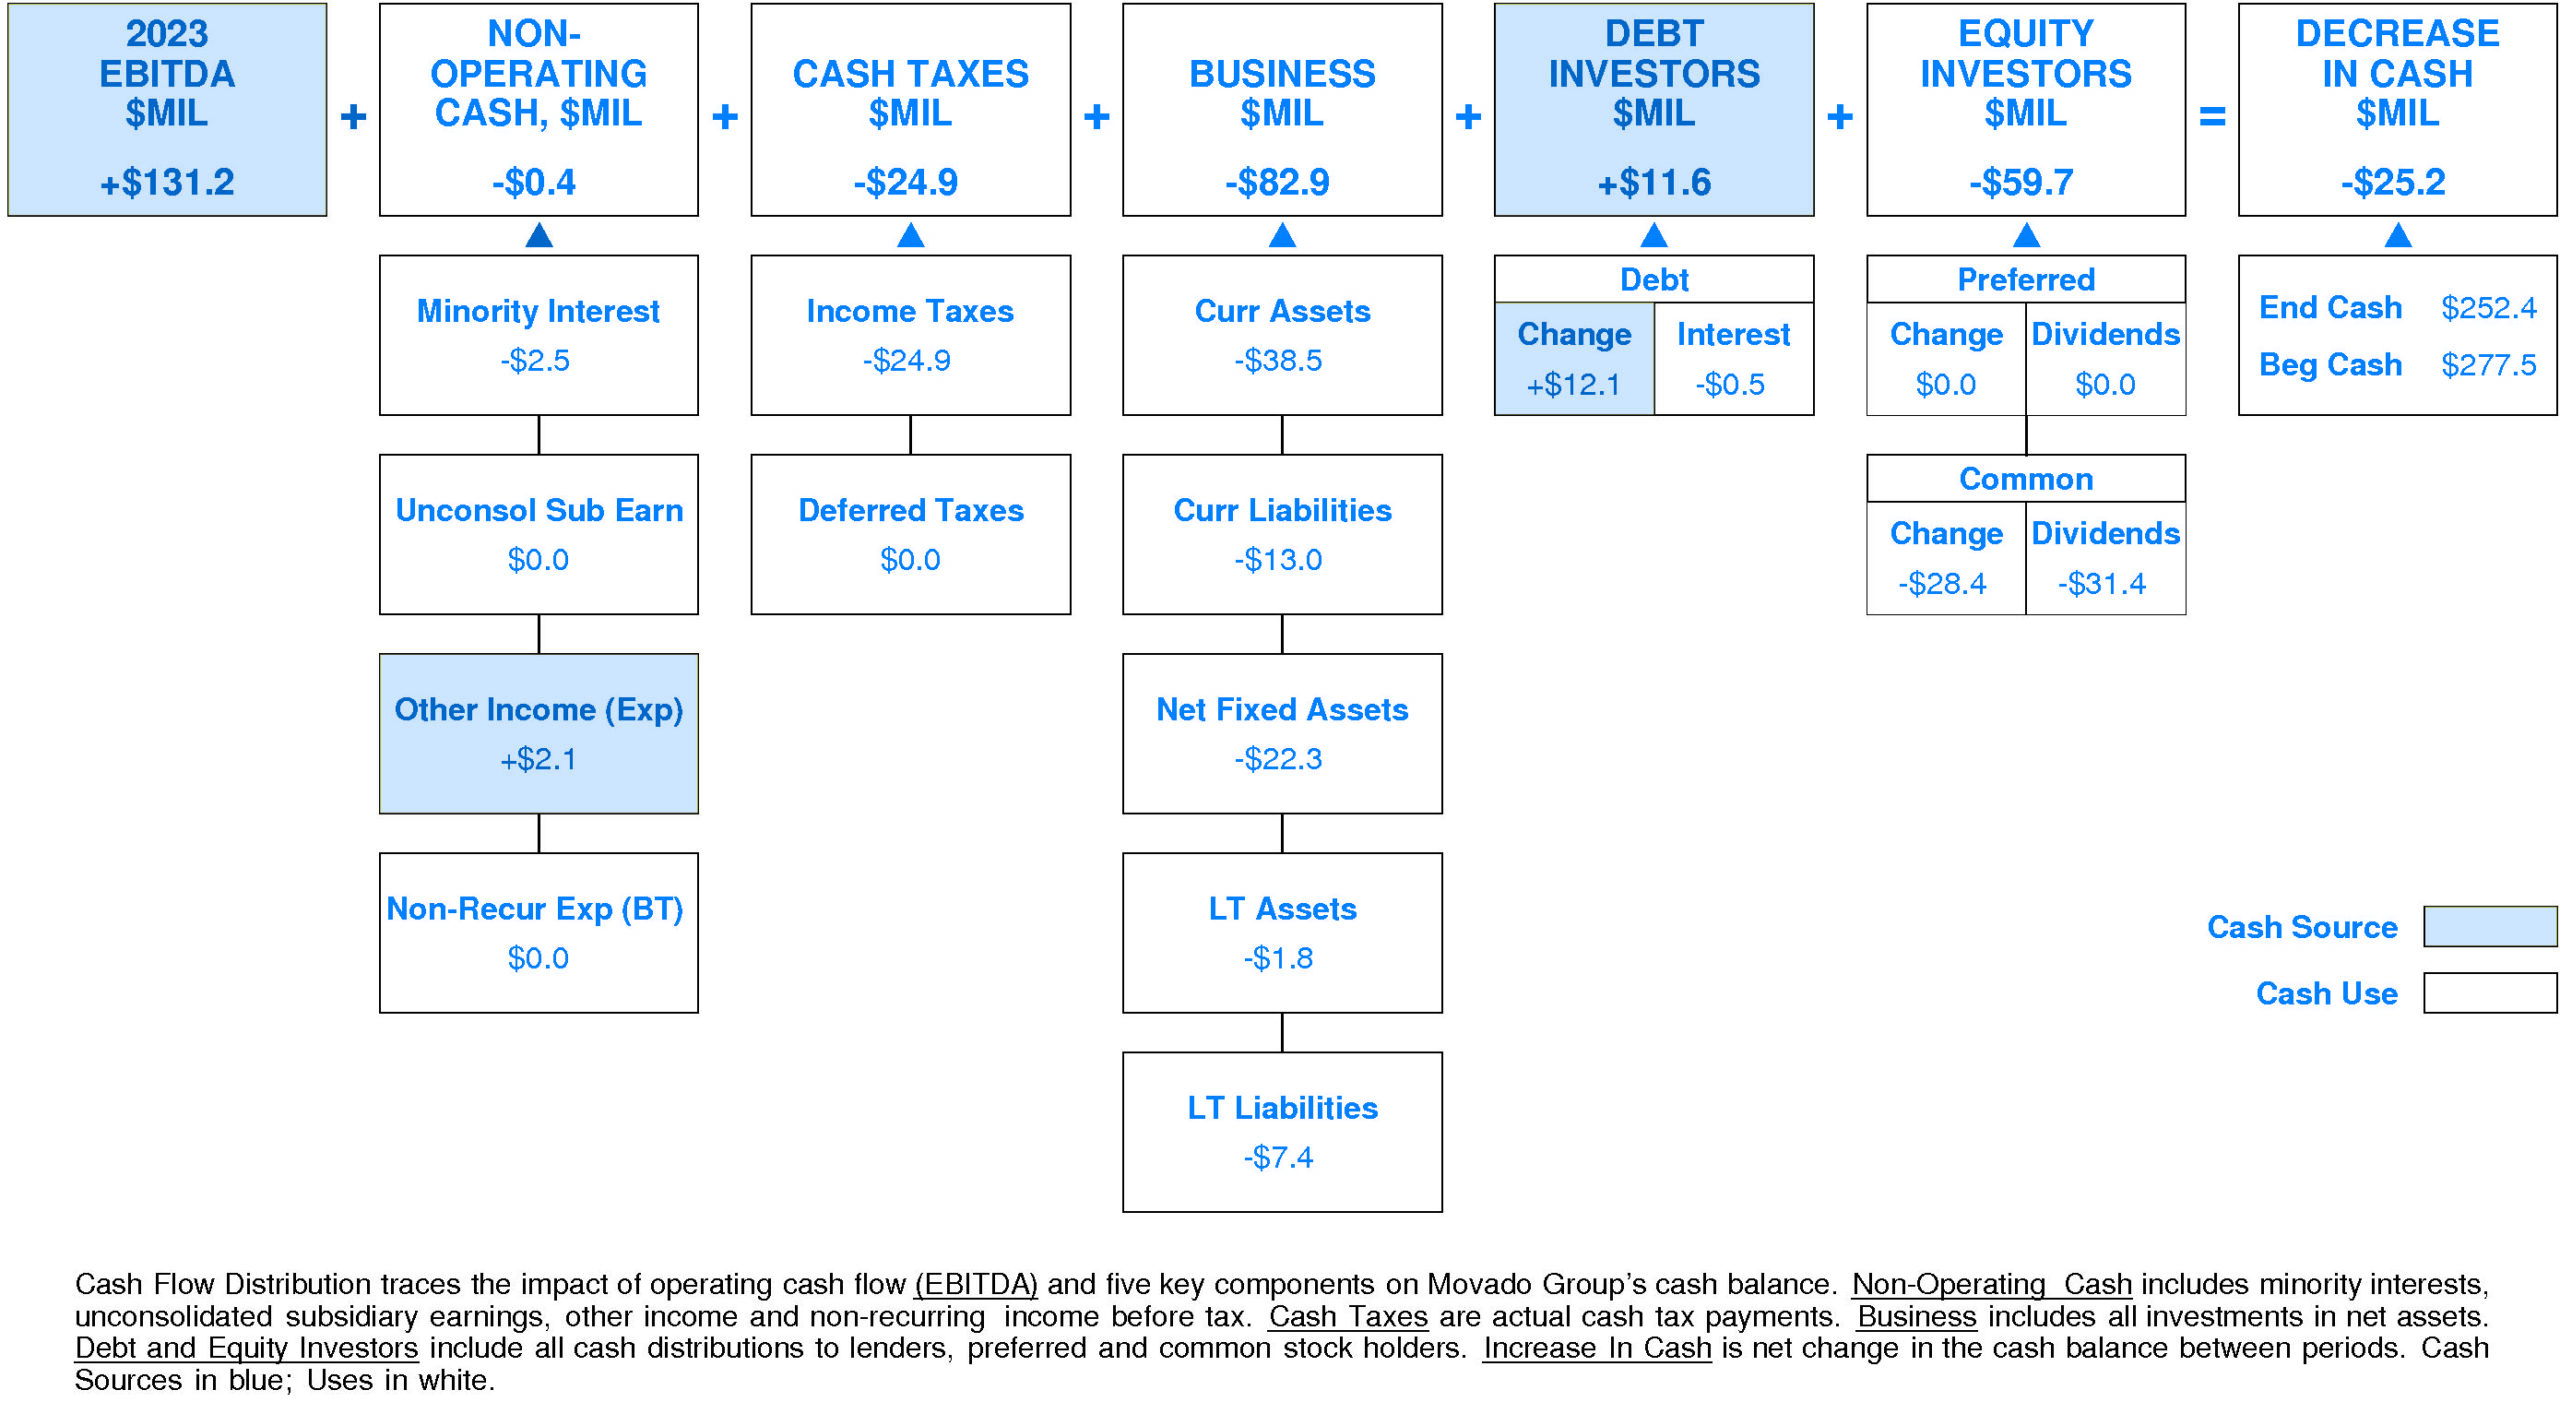
In 2023, Movado Group experienced a slight decrease in cash of -$25.2 million (-9%). Sources of cash were slightly lower than uses. Cash generated from 2023 EBITDA totaled +$131.2 million. Non-operating uses consumed -$0.4 million (-0% of EBITDA). Cash taxes consumed -$24.9 million (-19% of EBITDA). Re-investment in the business amounted to -$82.9 million (-63% of EBITDA). On a net basis, debt investors supplied +$11.6 million (+9% of EBITDA) while equity investors removed -$59.7 million (-46% of EBITDA).
Movado Group’s Non-operating Income, %EBITDA has suffered a volatile overall downtrend over the period. This downtrend was accompanied by an opposite trend for the Movado Group Peer Group. In most years, Movado Group was in the second quartile and top quartile. Currently, Movado Group is slightly above median at -0% of EBITDA (-$0.4 million).
Movado Group’s Cash Taxes, %EBITDA enjoyed a volatile overall uptrend over the period. This improvement was accompanied by a similar trend for the Movado Group Peer Group. In most years, Movado Group was in the third quartile and top quartile. Currently, Movado Group is below median at -19% of EBITDA (-$24.9 million).
Movado Group’s Business Re-investment, %EBITDA has enjoyed a volatile overall uptrend over the period. This improvement was accompanied by an opposite trend for the Movado Group Peer Group. (Since 2021 Business Re-investment, %EBITDA has experienced a very sharp decline.) In most years, Movado Group was in the third quartile and second quartile. Currently, Movado Group is substantially below median at -63% of EBITDA (-$82.9 million).
Movado Group’s Debt Investors, %EBITDA has experienced a downtrend over the period. This downtrend was accompanied by stability for the Movado Group Peer Group. (Since 2021 Debt Investors, %EBITDA has experienced a very sharp recovery.) In most years, Movado Group was in the top quartile and third quartile. Currently, Movado Group is upper quartile at +9% of EBITDA (+$11.6 million).
Movado Group’s Equity Investors, %EBITDA has exhibited a volatile overall uptrend over the period. This improvement was accompanied by stability for the Movado Group Peer Group. (Since 2021 Equity Investors, %EBITDA has experienced a very sharp decline.) In most years, Movado Group was in the third quartile and top quartile. Currently, Movado Group is lower quartile at -46% of EBITDA (-$59.7 million).
Movado Group’s Change in Cash, %EBITDA has exhibited little to no overall change over the period. This stability was accompanied by stability for the Movado Group Peer Group as well. (Since 2021 Change in Cash, %EBITDA has experienced a very sharp decline.) In most years, Movado Group was in the top quartile and second quartile. Currently, Movado Group is substantially below median at -19% of EBITDA (-$25.2 million).
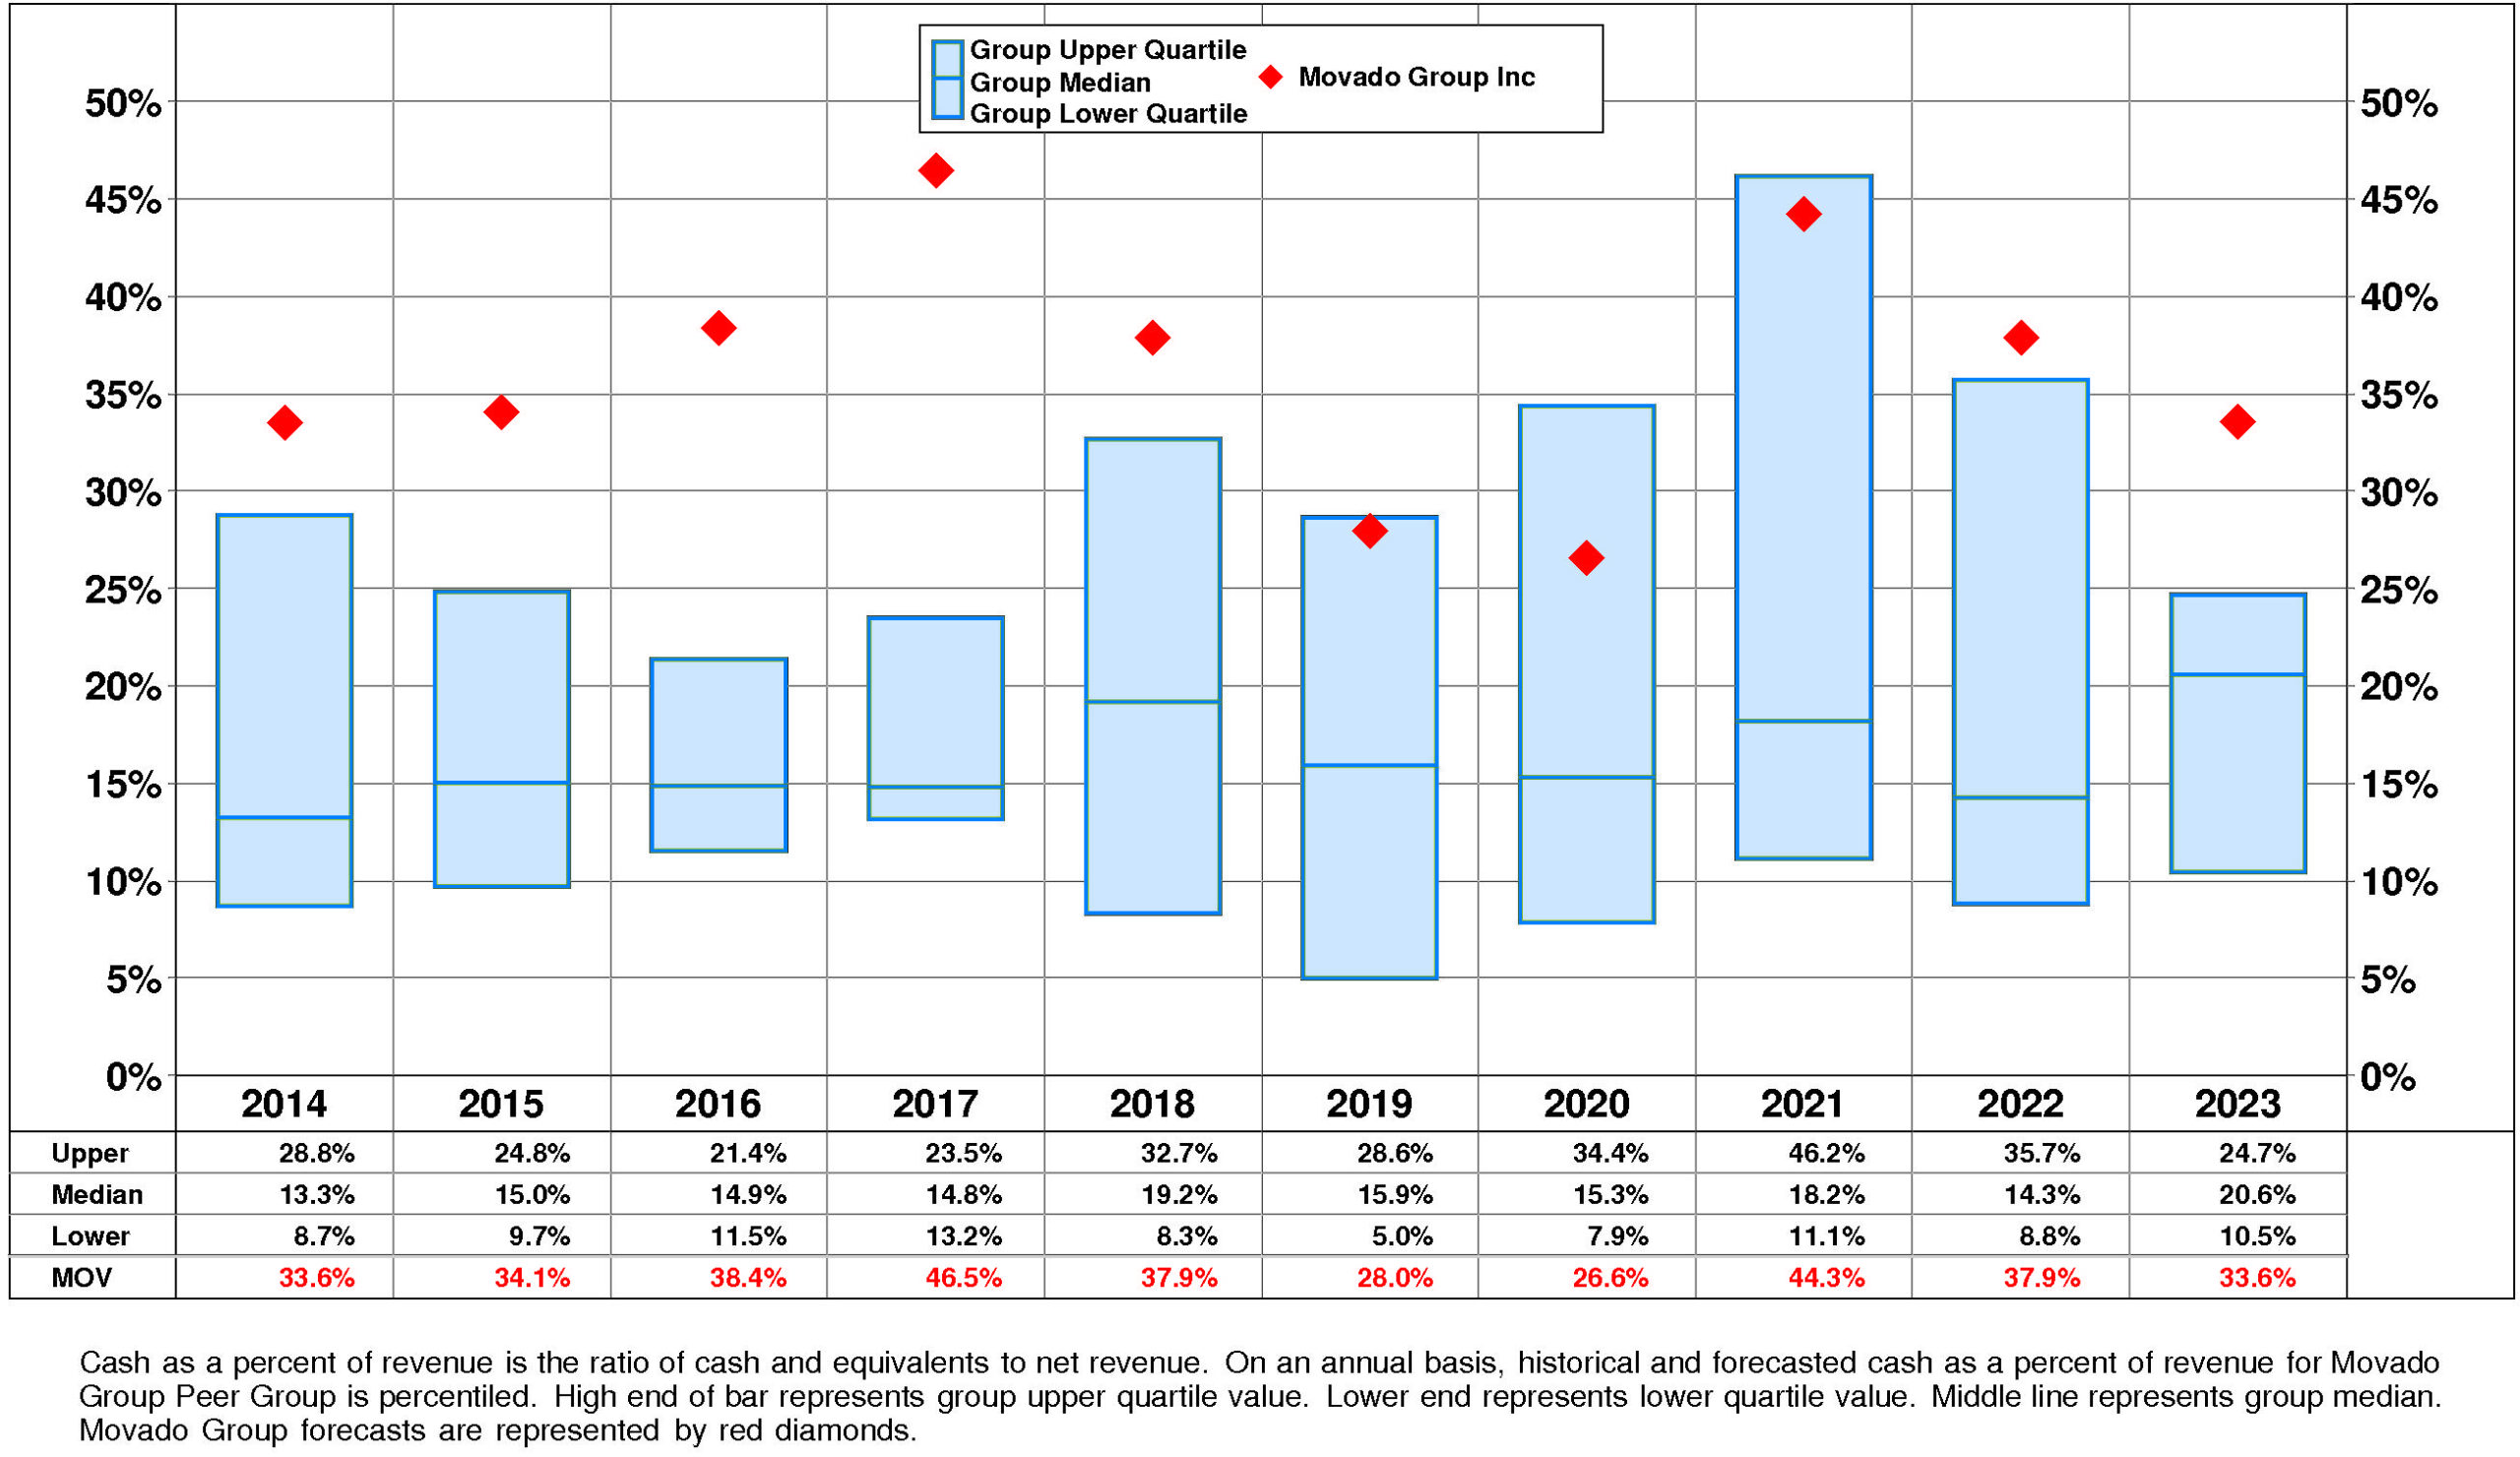
Movado Group’s Cash, %Revenue has exhibited little to no overall change over the period. This stability was accompanied by stability for the Movado Group Peer Group as well. (Since 2021 Cash, %Revenue has experienced a very sharp decline.) In most years, Movado Group was in the top quartile. Currently, Movado Group is upper quartile at +34%.
PROFITABILITY
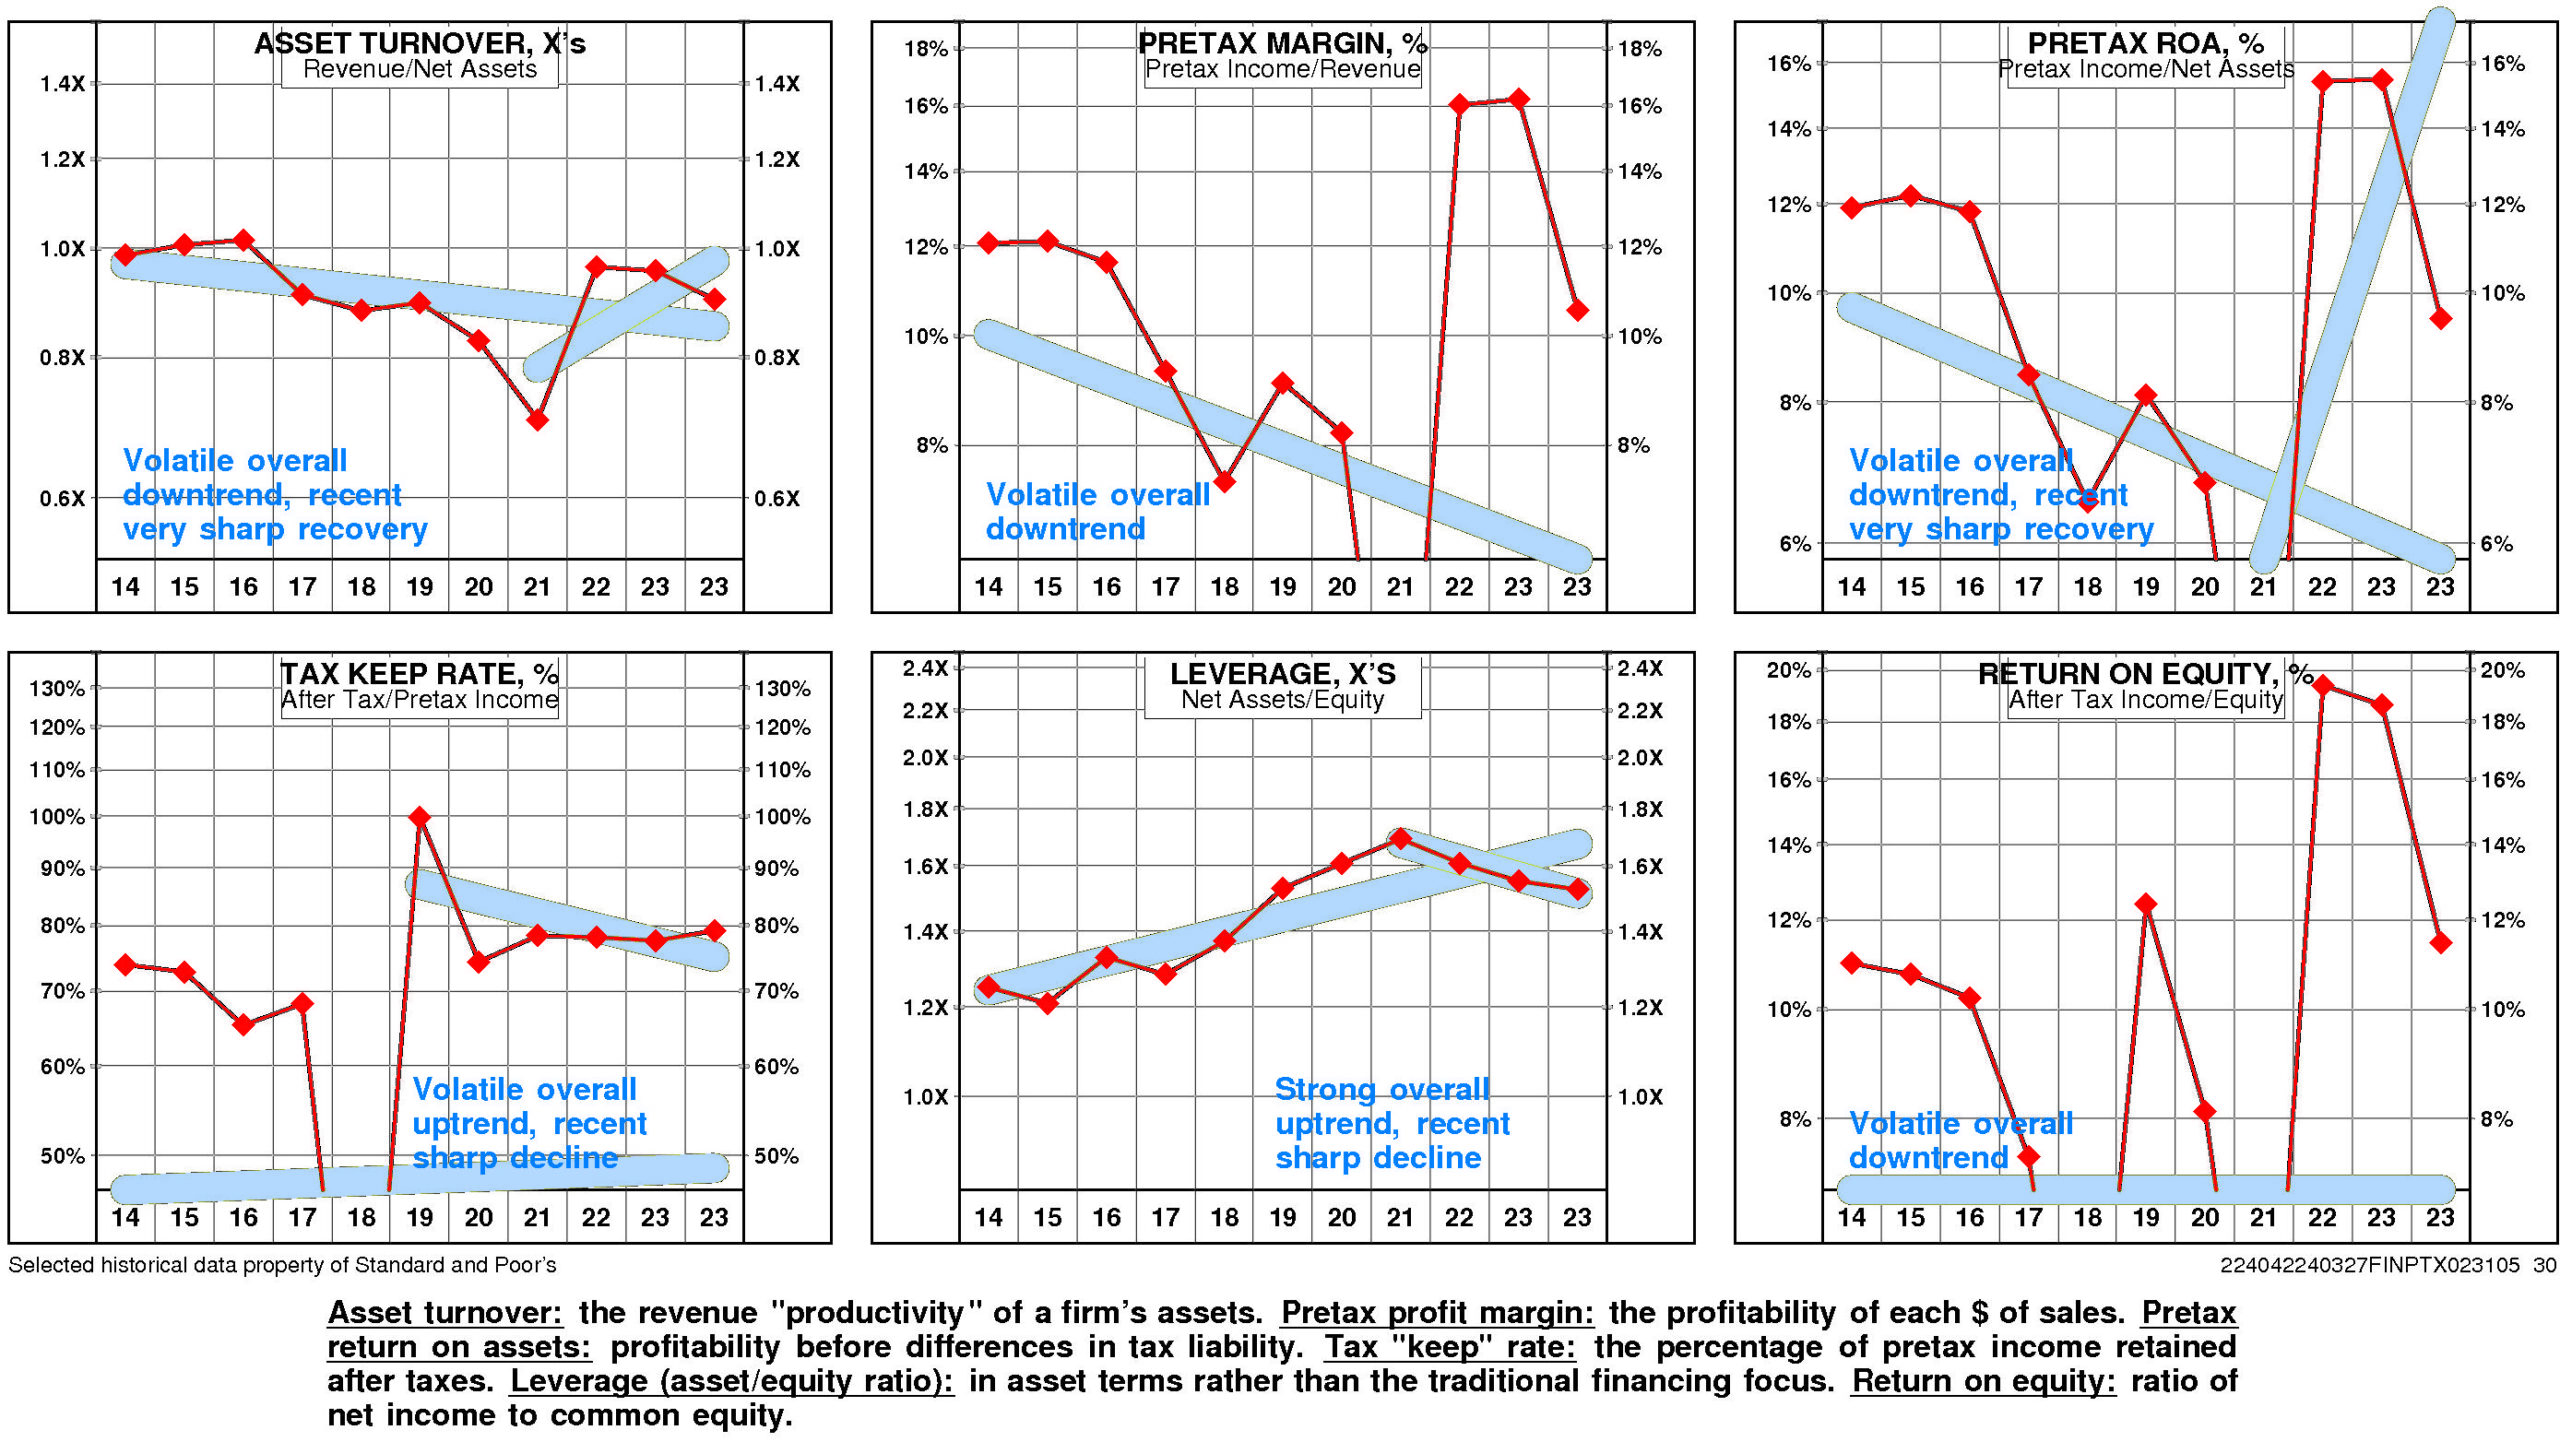
Movado Group’s return on equity has eroded very significantly since 2014. The current level of 11.4% is 1.04X the low for the period and is -7.7% from the high.
The key to the story for MOV is a very strong negative trend in pretax operating return significantly offset by a very strong positive trend in non-operating factors.
The productivity of Movado Group’s assets declined over the full period 2014-2023: asset turnover has experienced a downtrend even as it experienced a very sharp recovery after the 2021 low.
Movado Group’s pretax margin experienced a volatile overall downtrend over the period 2014-2023.
Non-operating factors (income taxes and financial leverage) had a very significant positive influence on return on equity.
Movado Group’s return on equity is at median (11.4%) for the four quarters ended October, 2023.
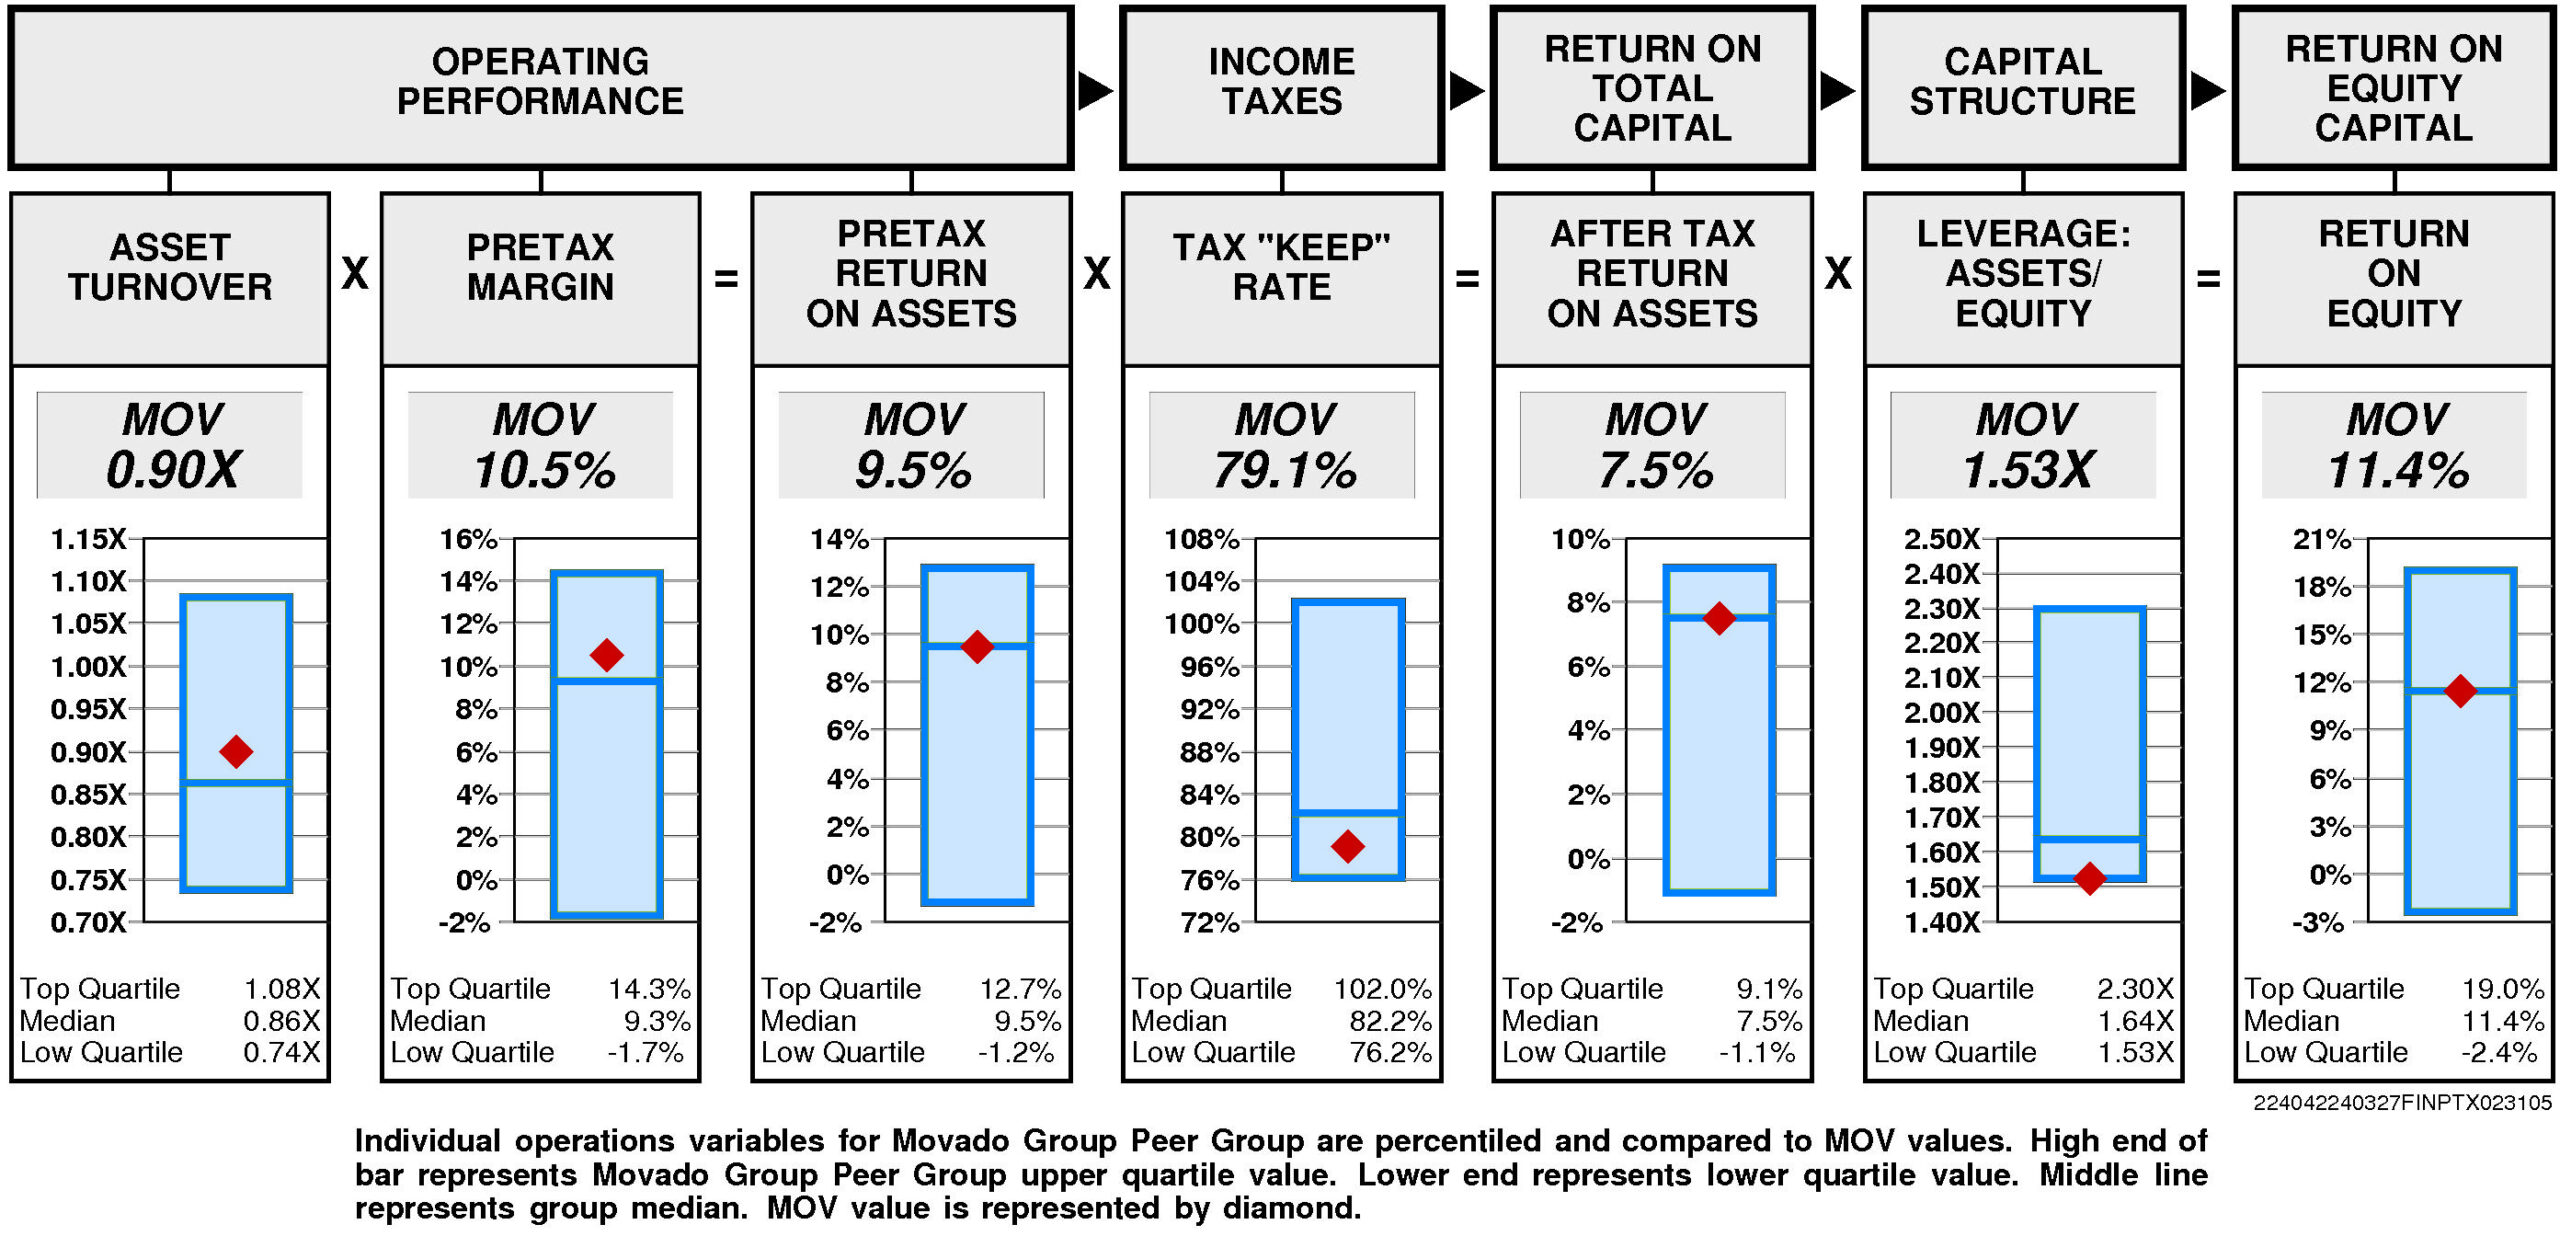
Operating performance (pretax return on assets) is at median (9.5%) reflecting asset turnover that is slightly above median (0.90X) and slightly above median pretax margin (10.5%).
Tax “keep” rate (income tax management) is below median (79.1%) resulting in after tax return on assets that is at median.
Financial leverage (leverage) is at the lower quartile (1.53X).
GROWTH RATES
Overall, Movado Group’s growth rate has slowed considerably in recent years.
Movado Group’s historical income statement growth and balance sheet growth have diverged. Revenue growth has paralleled asset growth; earnings growth has exceeded equity growth.
Annual revenue growth has been 3.3% per year. (More recently it has been 10.6%.)
Total asset growth has been 4.6% per year. (More recently it has been -0.6%.)
Annual E.P.S. growth has been 9.6% per year. (More recently it has been 3.6%.)
Equity growth has been 1.5% per year. (More recently it has been 6.5%.)
No consensus growth rate forecast is available for Movado Group.
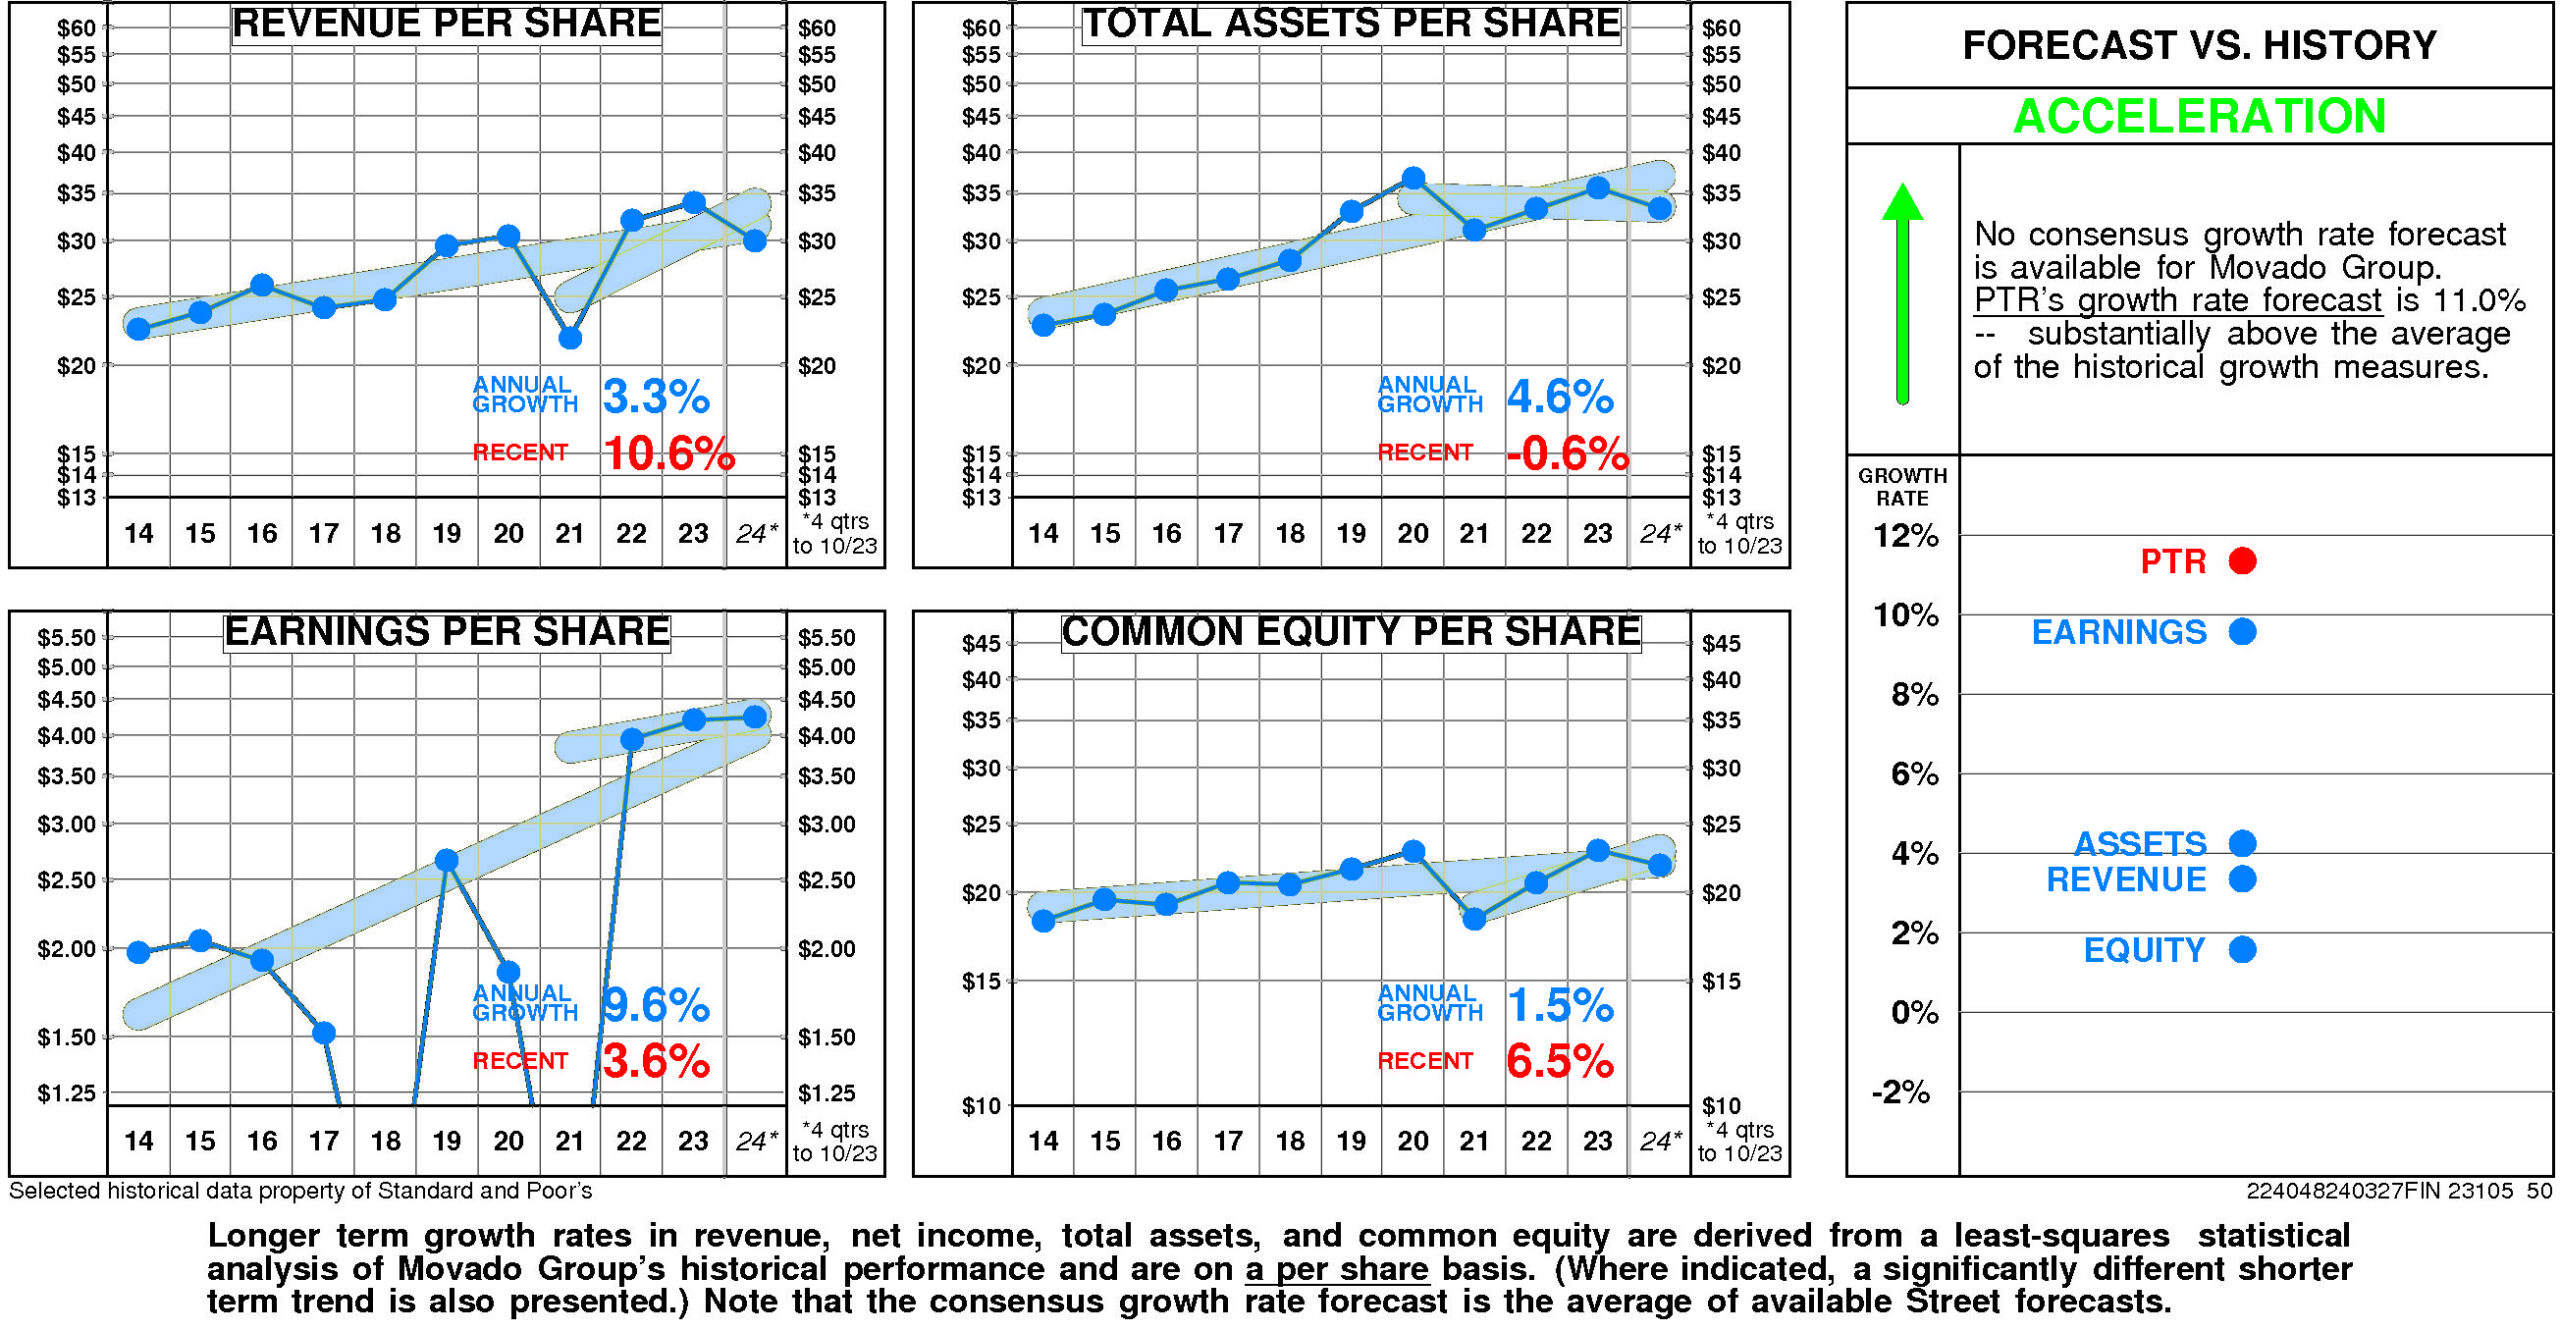
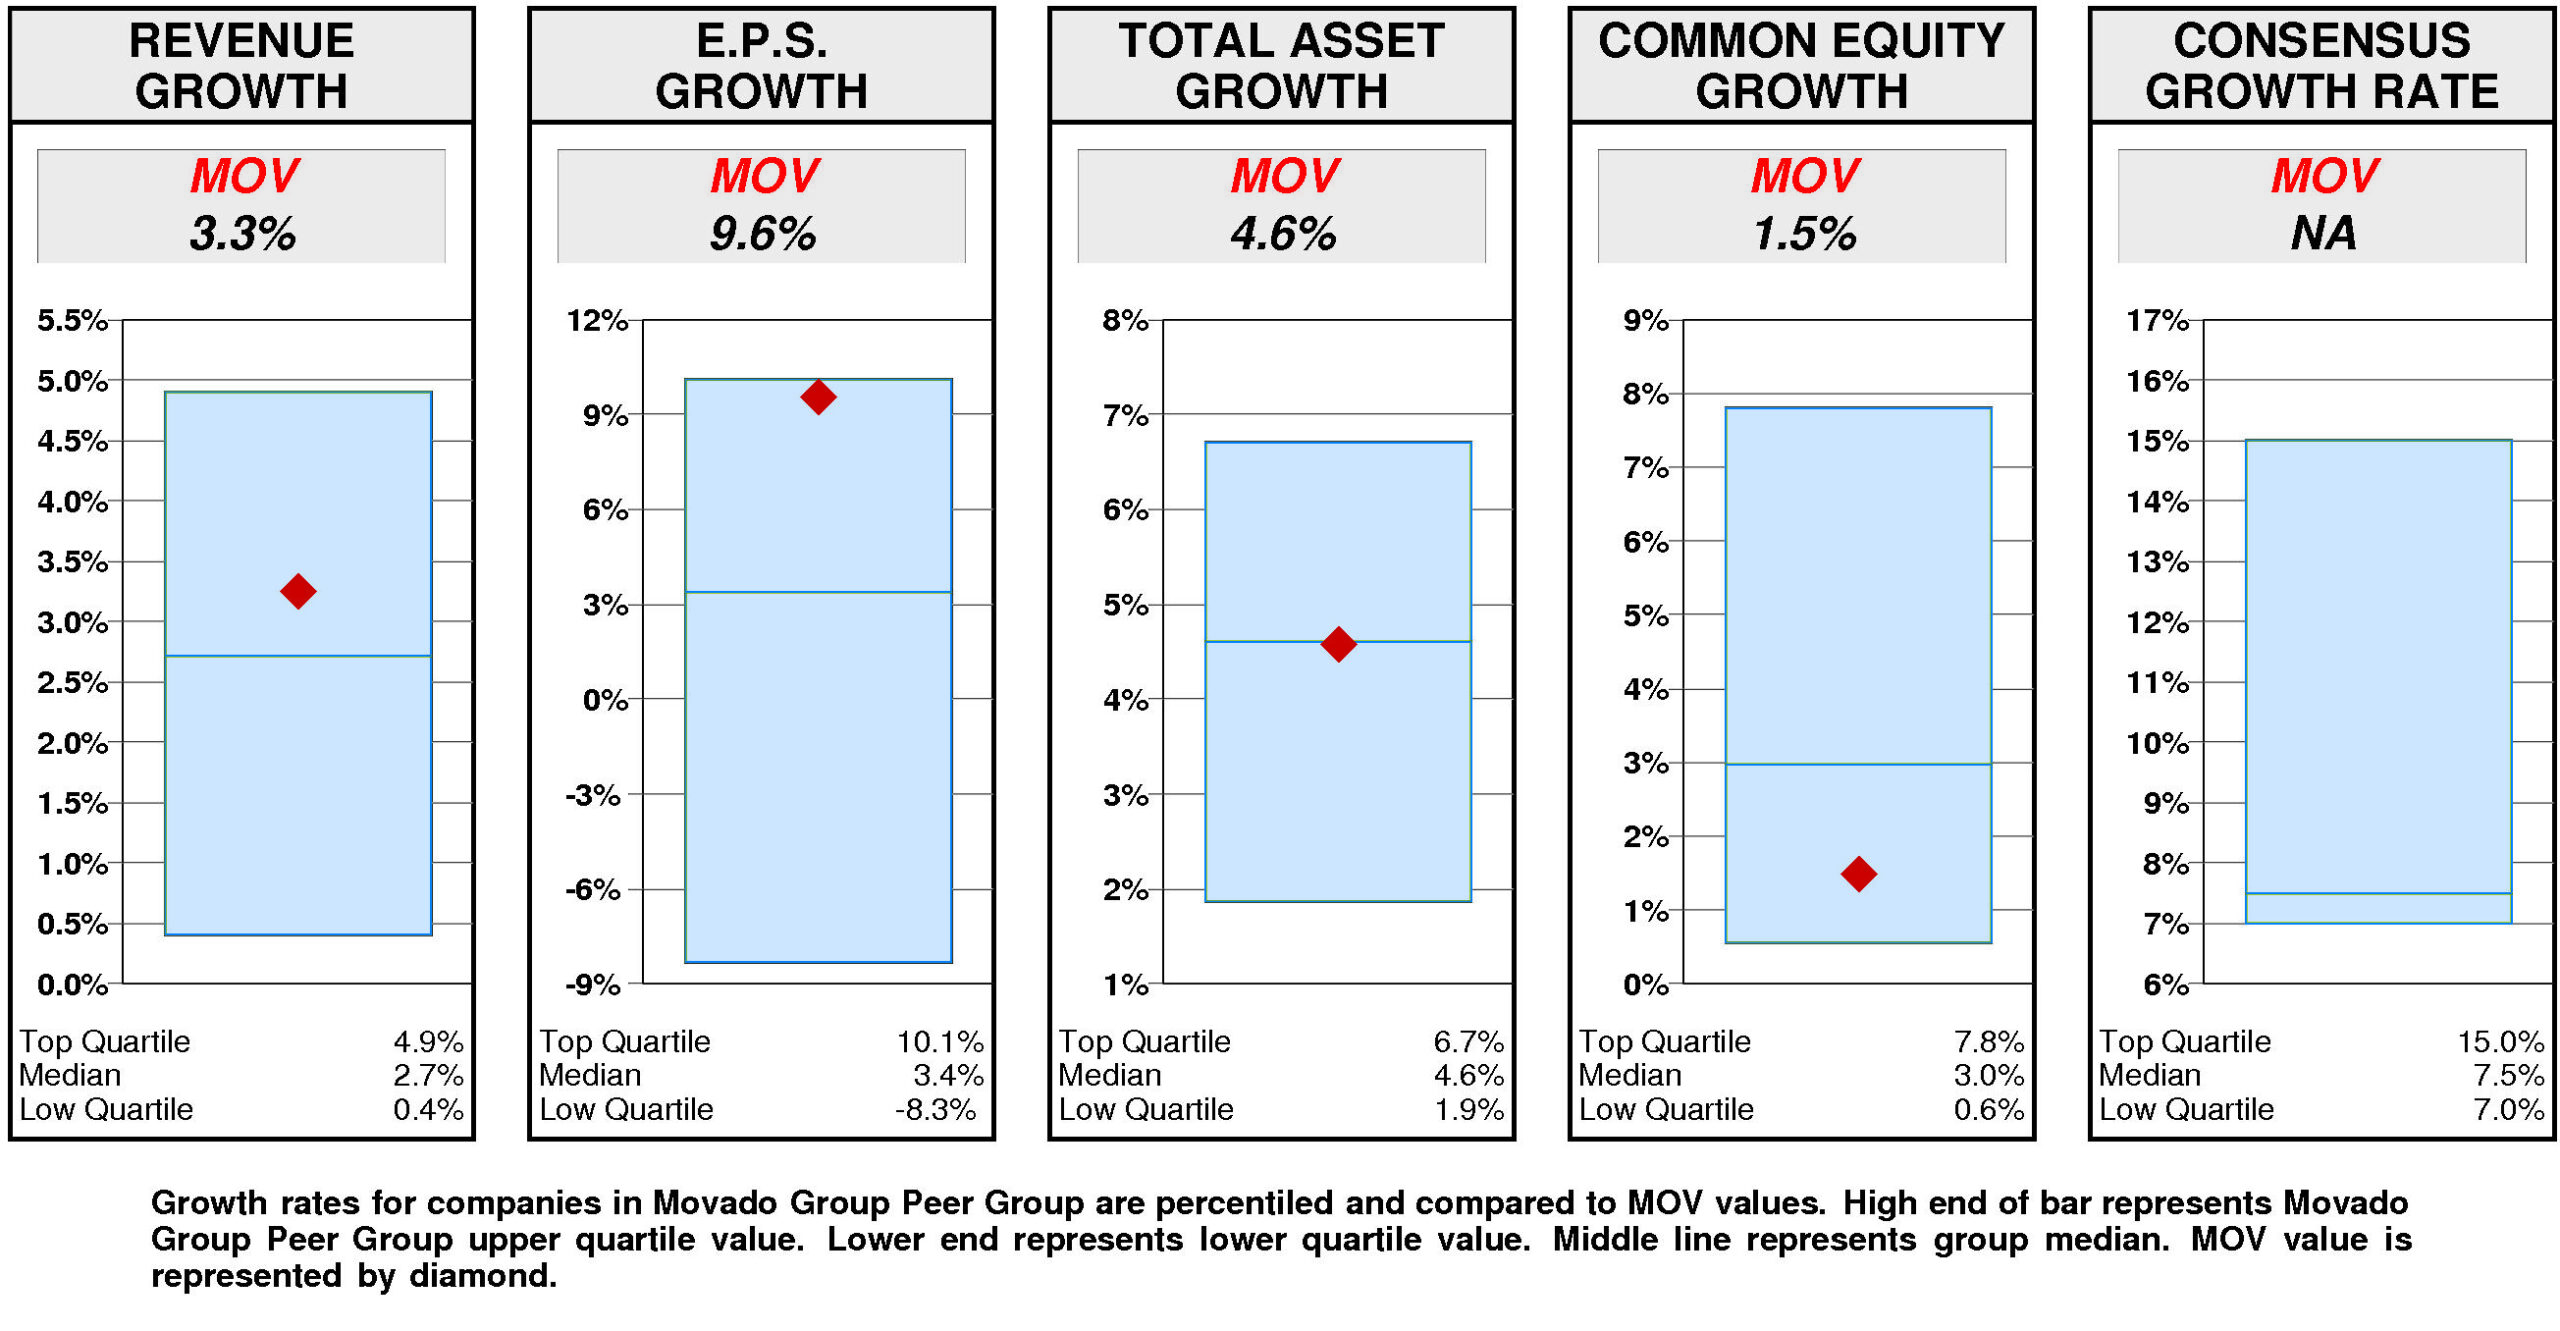
Relative to the Movado Group Peer Group, Movado Group’s historical growth measures are erratic. Revenue growth (3.3%) has been slightly above median. E.P.S. growth (9.6%) has been substantially above median. Total asset growth (4.6%) has been at median. Equity growth (1.5%) has been below median.
Consensus growth forecast is unavailable.
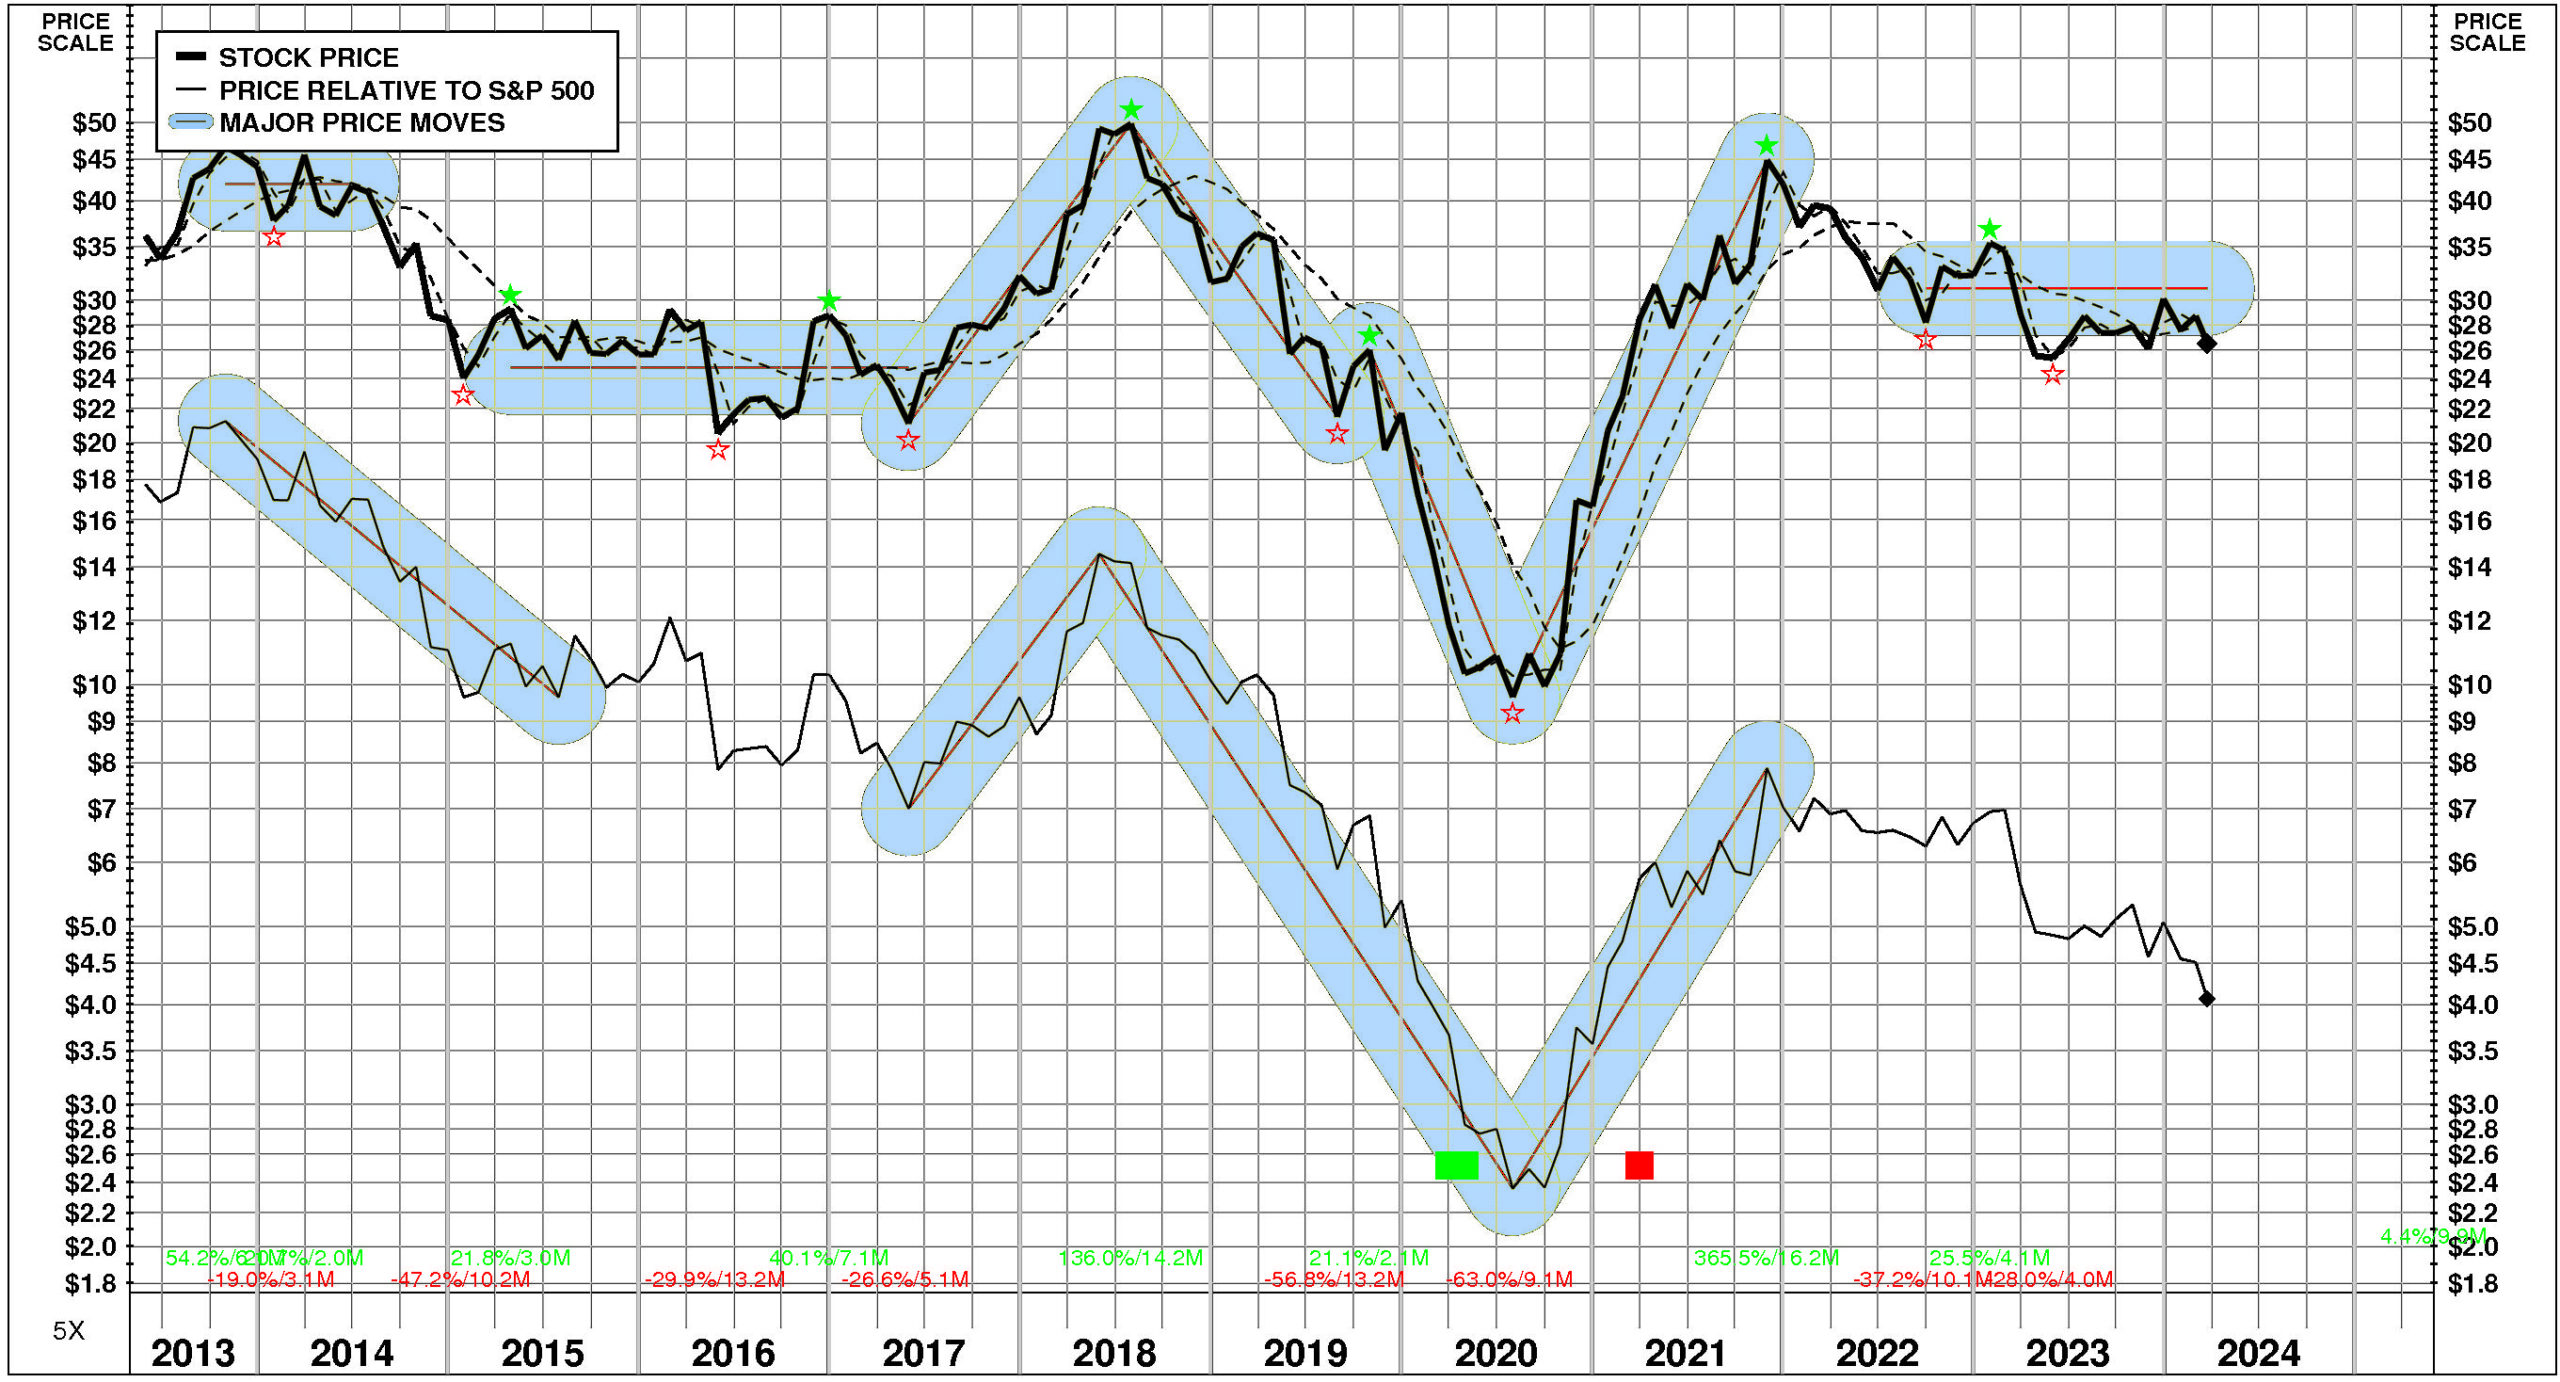
PRICE HISTORY
Over the full time period, Movado Group’s stock price performance has been variable and significantly below market. Between May, 2013 and March, 2024, Movado Group’s stock price fell -26%; relative to the market, this was a -77% loss. Significant price moves during the period: 1) July, 2020 – November, 2021: +365%; 2) October, 2019 – July, 2020: -63%; 3) July, 2018 – August, 2019: -57%; and 4) May, 2017 – July, 2018: +136%.
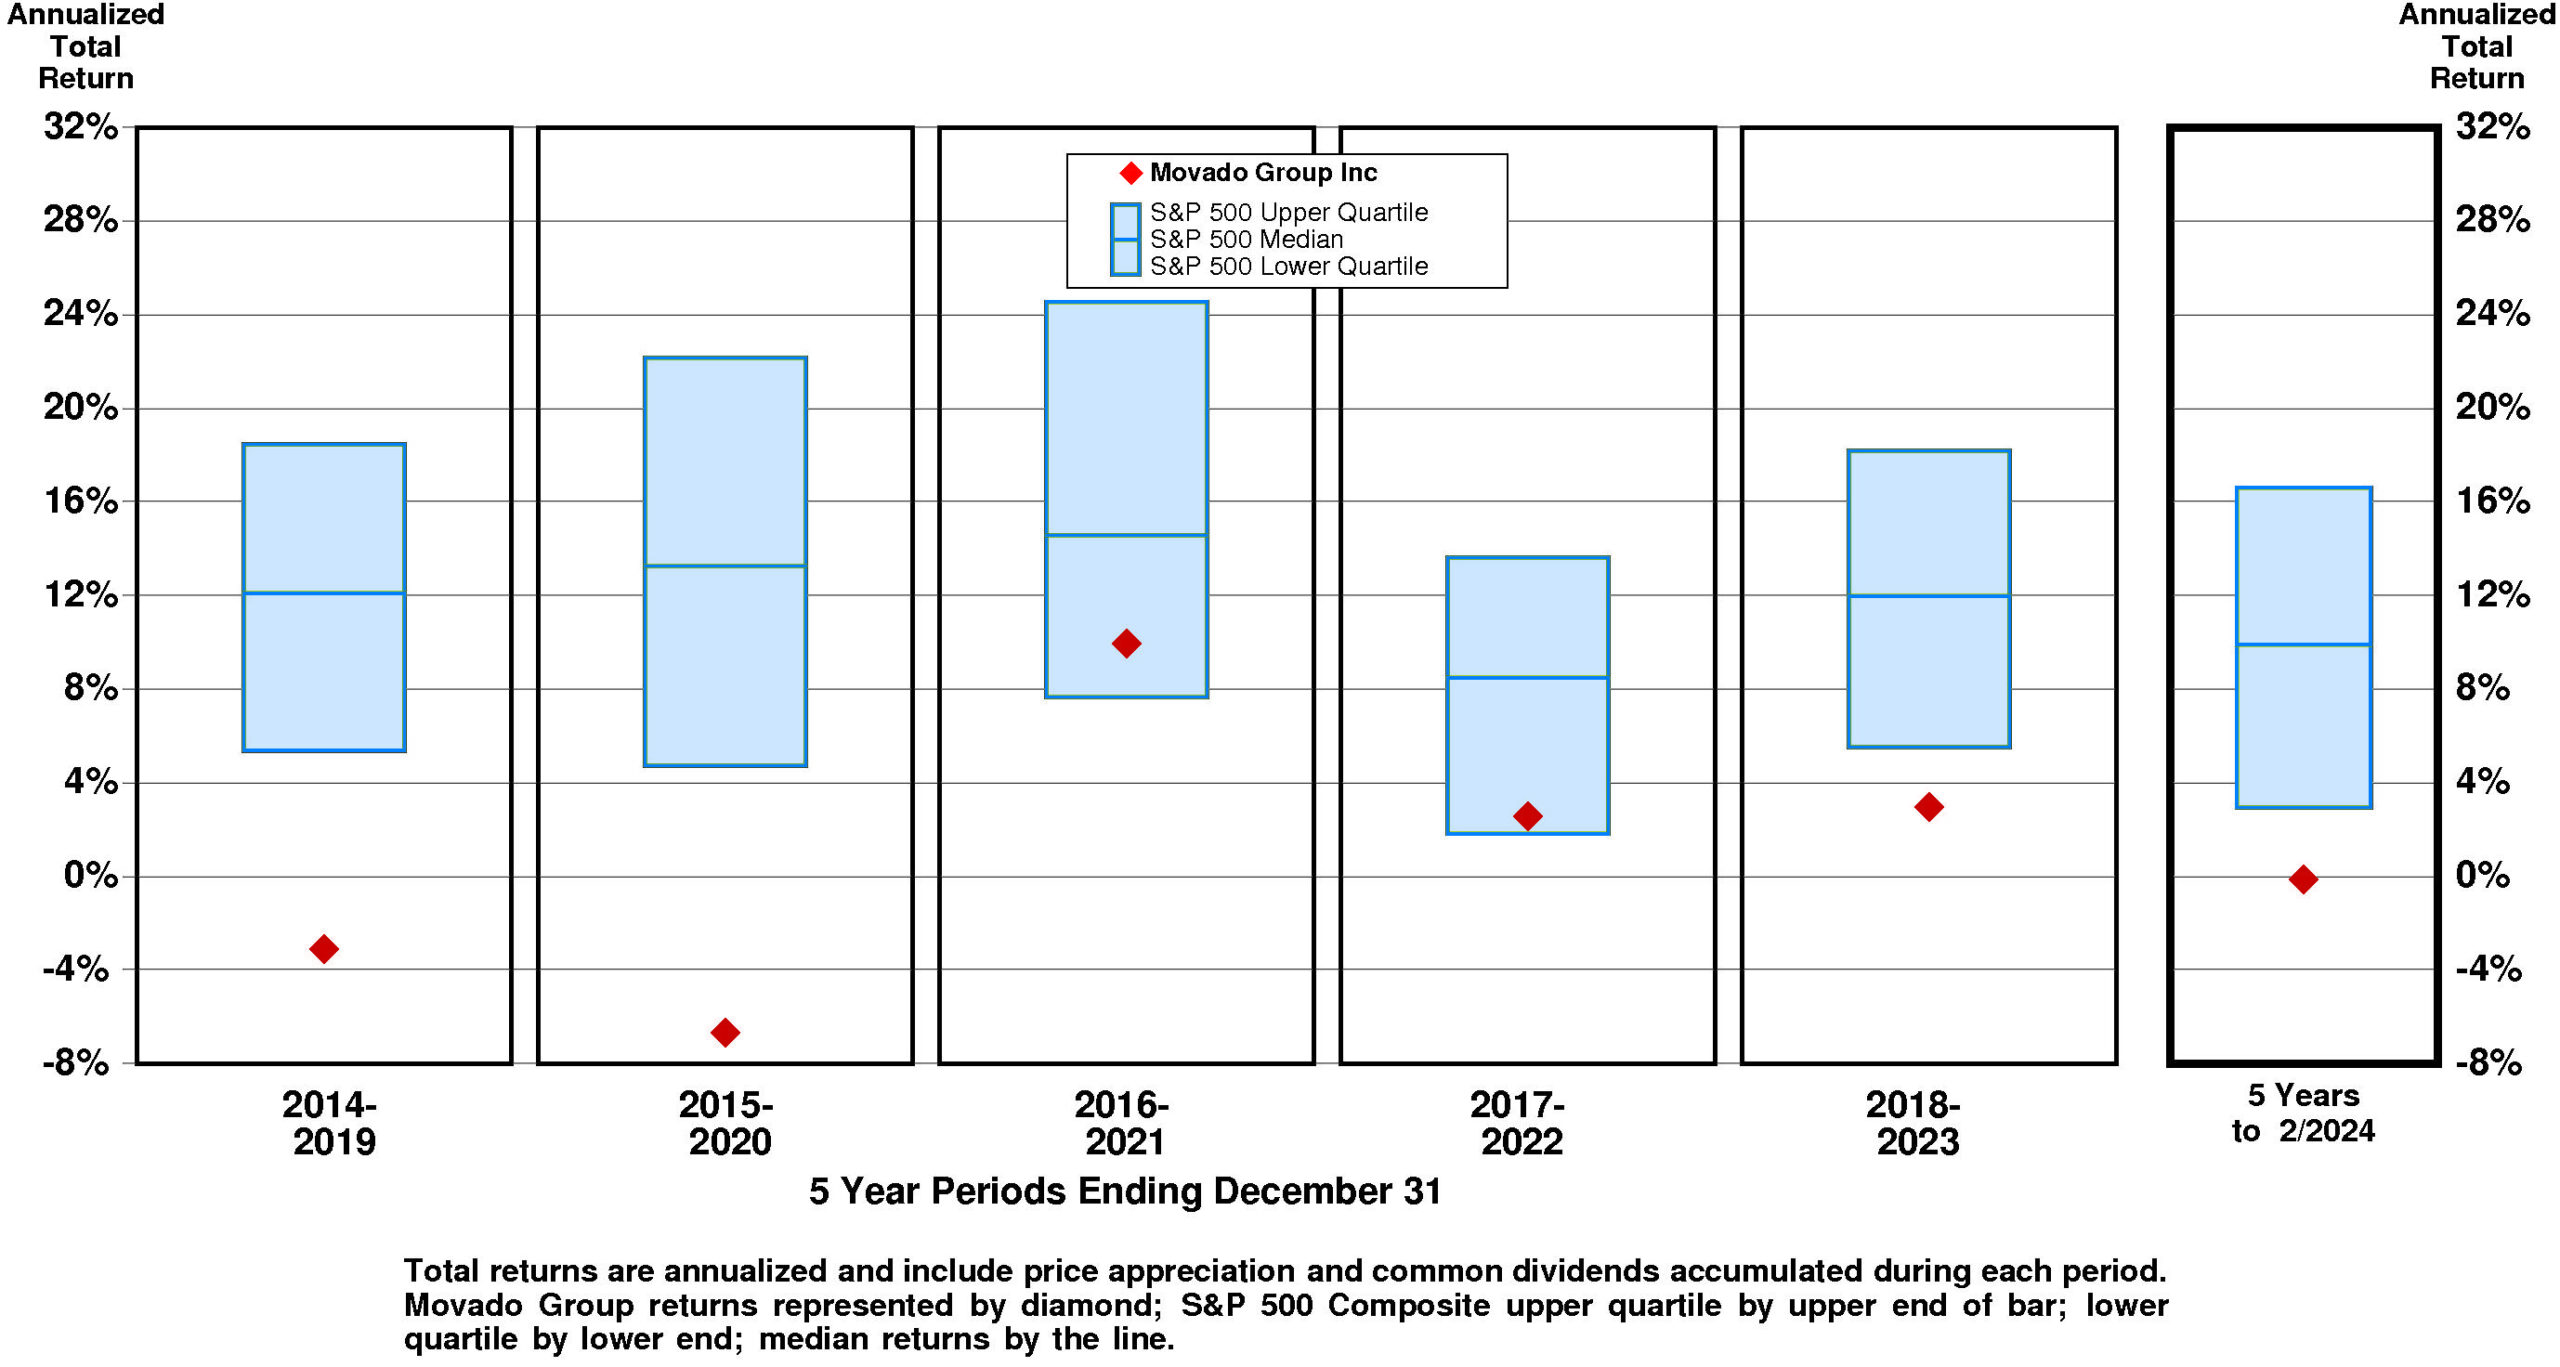
TOTAL INVESTMENT RETURNS
Current annual total return performance of -9.4% is lower quartile relative to the S&P 500 Composite.
In addition to being lower quartile relative to S&P 500 Composite, current annual total return performance through February, 2024 of -9.4% is below median relative to Movado Group Inc Peer Group.
Current 5-year total return performance of -0.1% is lower quartile relative to the S&P 500 Composite.
Through February, 2024, with lower quartile current 5-year total return of -0.1% relative to S&P 500 Composite, Movado Group’s total return performance is slightly above median relative to Movado Group Inc Peer Group.
VALUATION BENCHMARKS
Relative to S&P 500 Composite, MOV’s overall valuation is exceptionally low. All five factors are lower quartile. The highest factor is the ratio of enterprise value/assets, followed by the ratio of enterprise value/earnings before interest and taxes, then by the price/earnings ratio, then by the price/equity ratio. The lowest factor is the ratio of enterprise value/revenue.
Relative to Movado Group Peer Group, MOV’s overall valuation is quite low. The highest factor, the ratio of enterprise value/assets, is at the lower quartile. Ratio of enterprise value/revenue is lower quartile. Ratio of enterprise value/earnings before interest and taxes is lower quartile. Price/equity ratio is at the lower quartile. The lowest factor, the price/earnings ratio, is lower quartile.
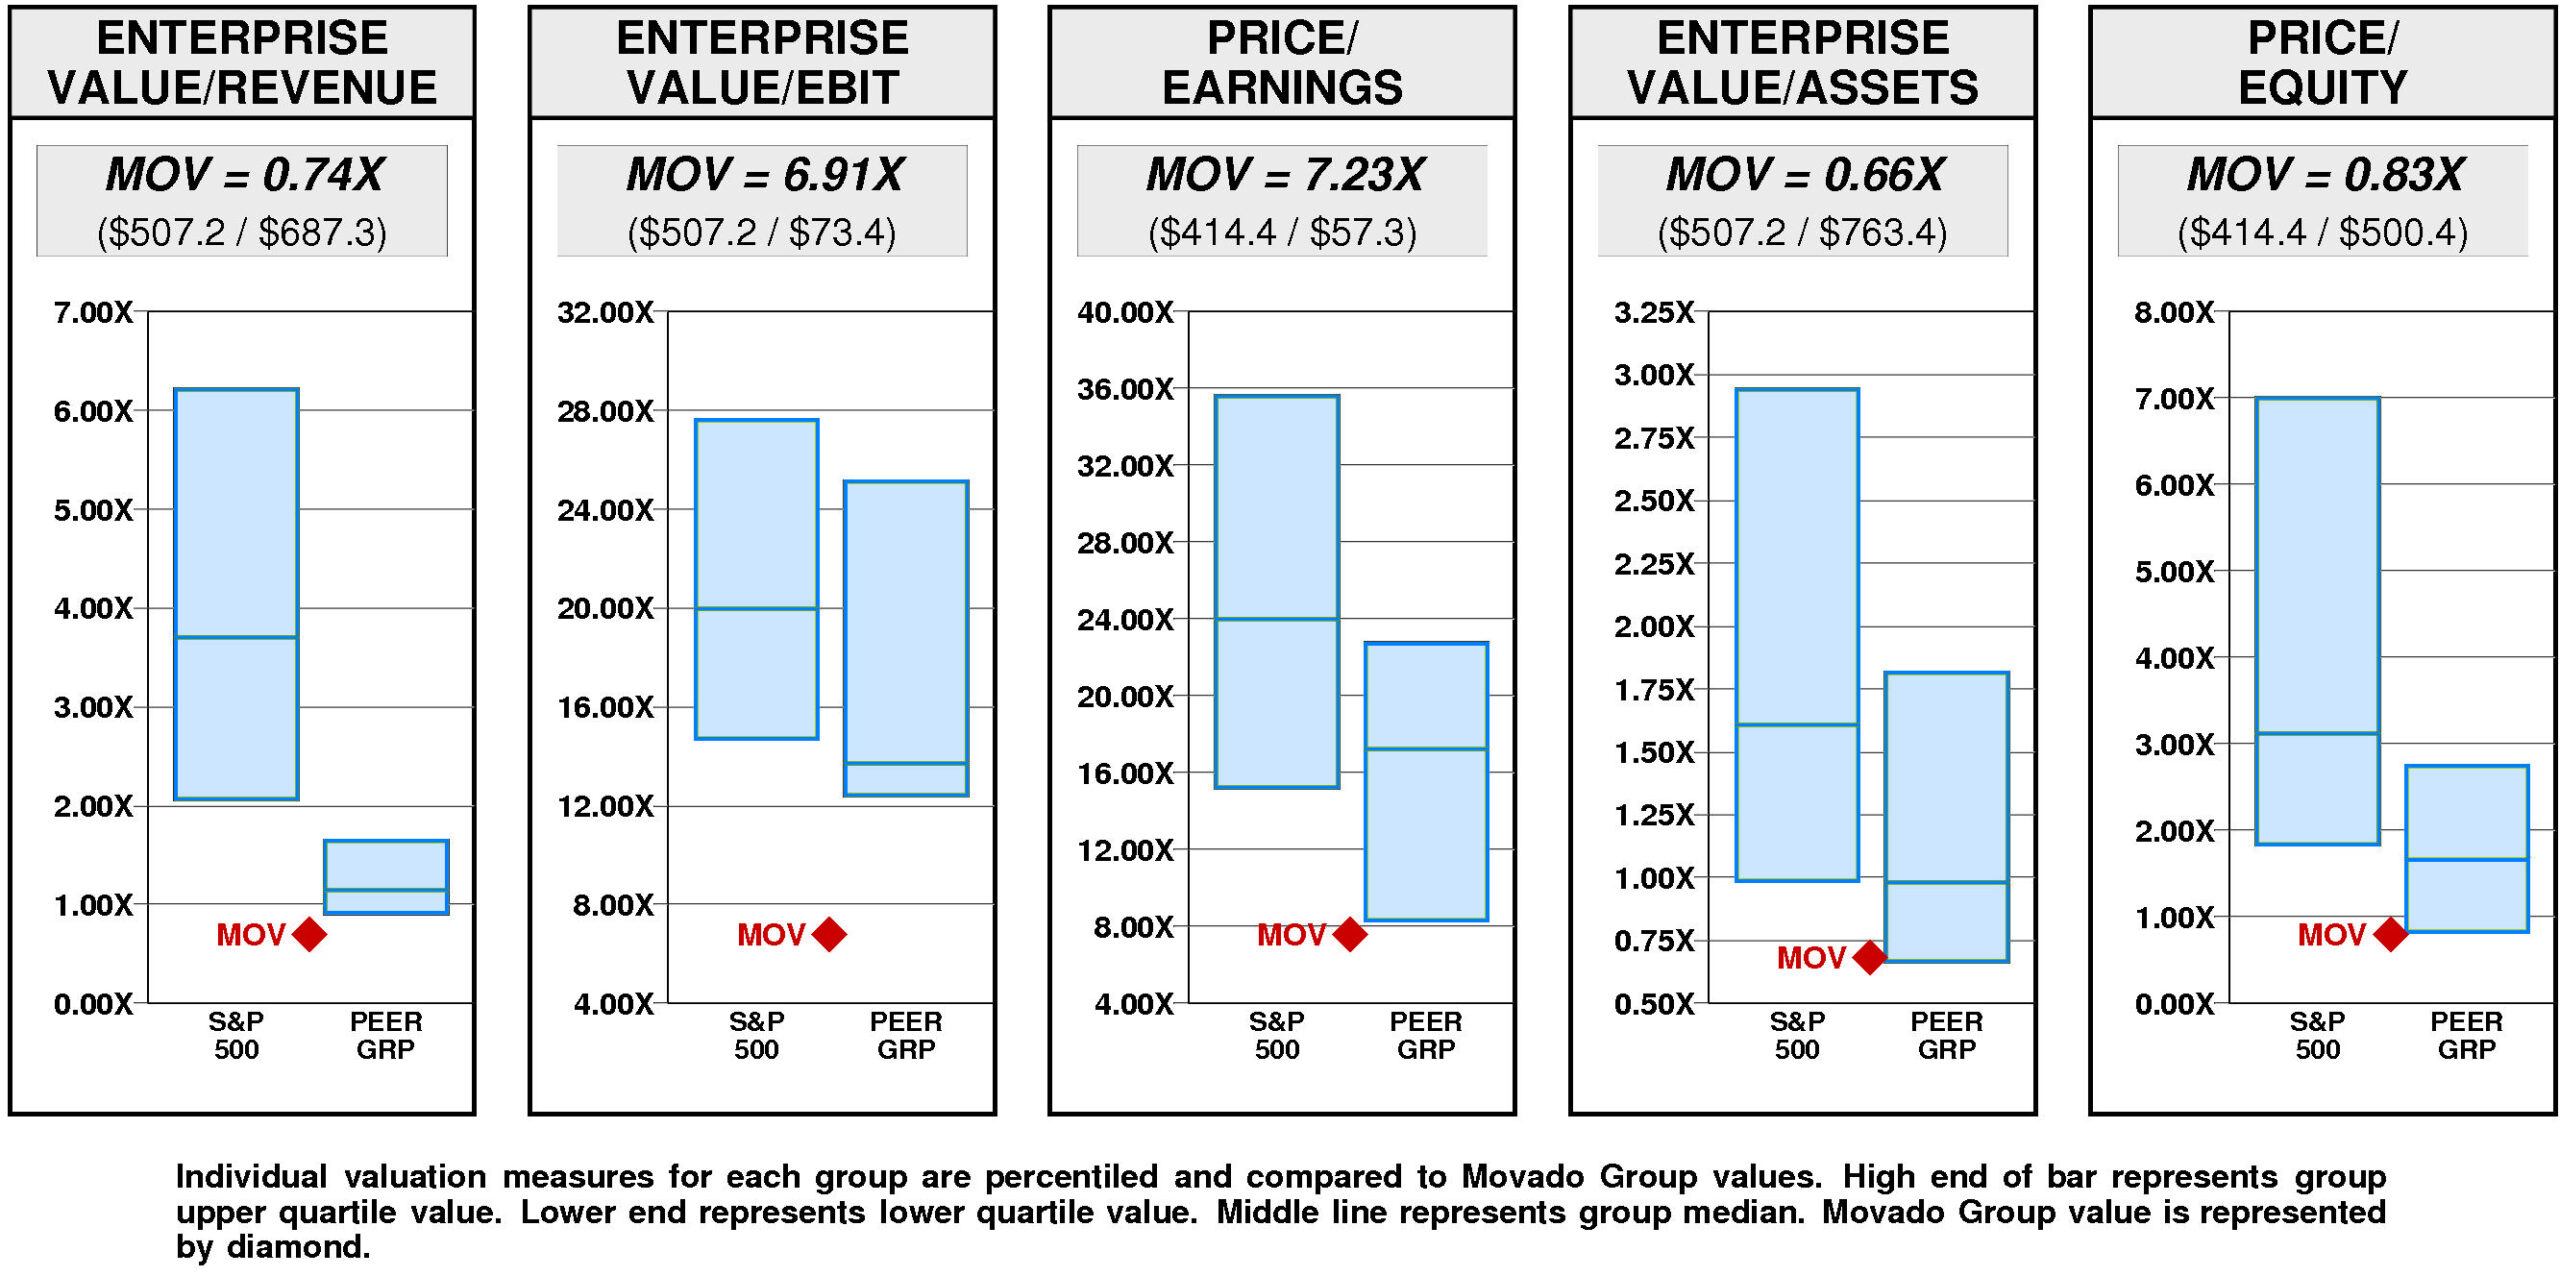
Movado Group has a major value gap compared to the median. For MOV to hit median valuation, its current ratio of enterprise value/revenue would have to rise from the current level of 0.74X to 1.15X. If MOV’s ratio of enterprise value/revenue were to rise to 1.15X, its stock price would be higher by $18 to $45.
For MOV to achieve upper quartile valuation relative to the Movado Group Peer Group, its current ratio of enterprise value/revenue would have to rise from the current level of 0.74X to 1.65X. If MOV’s ratio of enterprise value/revenue were to rise to 1.65X, its stock price would increase by $40 from the current level of $27.
VALUE TARGETS
With future capital returns forecasted to exceed the cost of capital, MOV is expected to continue to be an important Value Builder.
Movado Group’s current Price Target of $70 represents a +162% change from the current price of $26.57.
This high appreciation potential results in an appreciation score of 82 (only 18% of the universe has greater appreciation potential.)
With this high Appreciation Score of 82, the neutral Power Rating of 46 results in an Value Trend Rating of B.
Movado Group’s current Price Target is $70 (+87% from the 2023 Target of $37 and +162% from the 03/22/24 price of $26.57). This dramatic rise in the Target is the result of a +23% increase in the equity base and a +52% increase in the price/equity multiple. The forecasted increase in growth has a very large positive impact on the price/equity multiple and the forecasted increase in return on equity has a very large positive impact as well. Partially offsetting these Drivers, the forecasted increase in cost of equity has a very large negative impact.
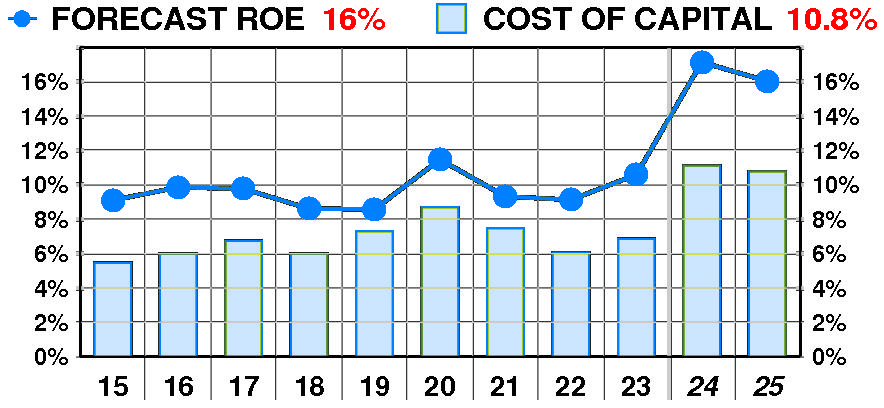
PTR’s return on equity forecast is 16.0% — above our recent forecasts. Forecasted return on equity exhibited a slight, erratic increase between 2015 and 2023. The current forecast is well above the 2019 low of 9%.
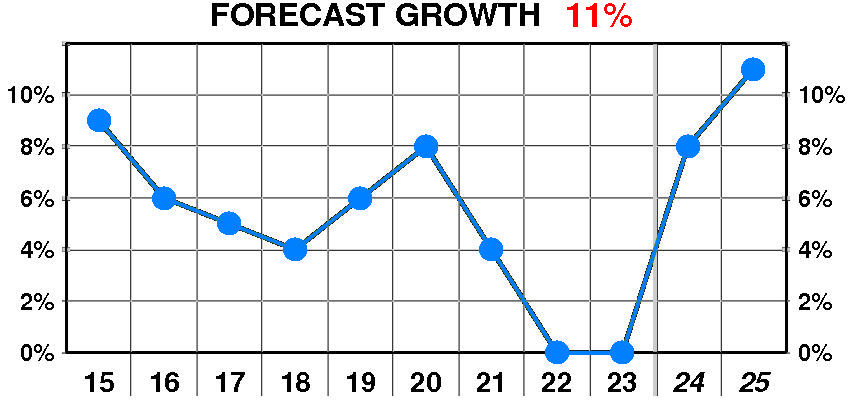
PTR’s growth forecast is 11.0% — substantially above our recent forecasts. Forecasted growth suffered a dramatic, erratic decline between 2015 and 2023. The current forecast is well above the 2018 low of 4%.
PTR’s cost of equity forecast is 10.8% — slightly above recent levels. Forecasted cost of equity suffered a dramatic, erratic increase between 2015 and 2023. The current forecast is well above the 2015 low of 5.5%.
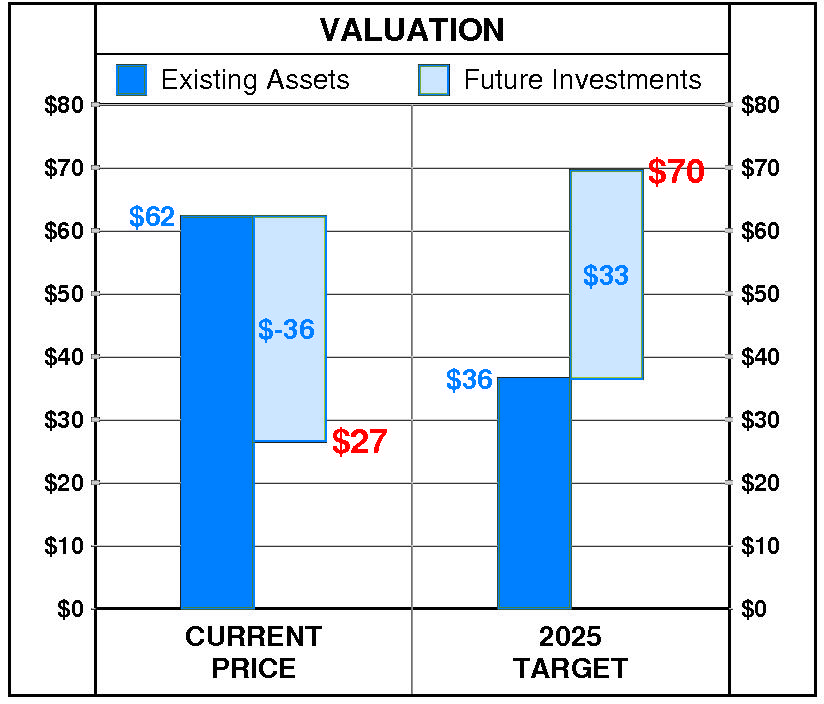
At Movado Group’s current price of $26.57, investors are placing a negative value of $-36 on its future investments. This view is not supported by the company’s most recent performance that reflected a growth rate of 0.0% per year, and a return on equity of 10.6% versus a cost of equity of 6.9%.
PTR’s 2025 Price Target of $70 is based on these forecasts and reflects an estimated value of existing assets of $36 and a value of future investments of $33.
Be the first to comment