![]()
BUSINESS
Deckers Outdoor Corporation, together with its subsidiaries, designs, markets, and distributes footwear, apparel, and accessories for casual lifestyle use and high-performance activities. The company offers premium footwear, apparel, and accessories under the UGG brand name; sandals, shoes, and boots under the Teva brand name; and relaxed casual shoes and sandals under the Sanuk brand name. It also provides footwear and apparel for ultra-runners and athletes under the Hoka brand name; and fashion casual footwear using other plush materials under the Koolaburra brand. The company sells its products through department stores, domestic independent action sports and outdoor specialty footwear retailers, and larger national retail chains, as well as online retailers.
INVESTMENT RATING
With future capital returns forecasted to exceed the cost of capital, DECK is expected to continue to be a major Value Builder.
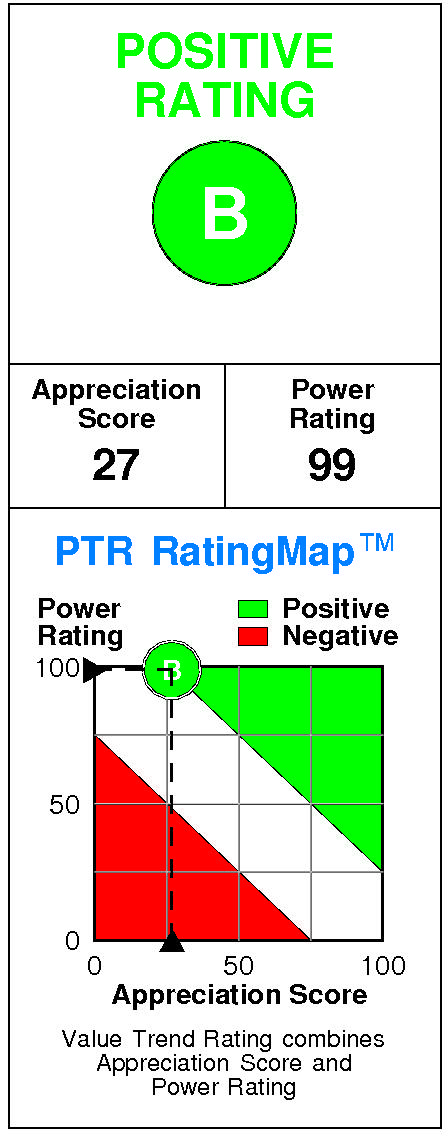
Deckers Outdoor has a current Value Trend Rating of B (Positive).
This rating combines very contradictory signals from two proprietary PTR measures of a stock’s attractiveness. Deckers Outdoor has a poor Appreciation Score of 27 but a very high Power Rating of 99, triggering the Positive Value Trend Rating.
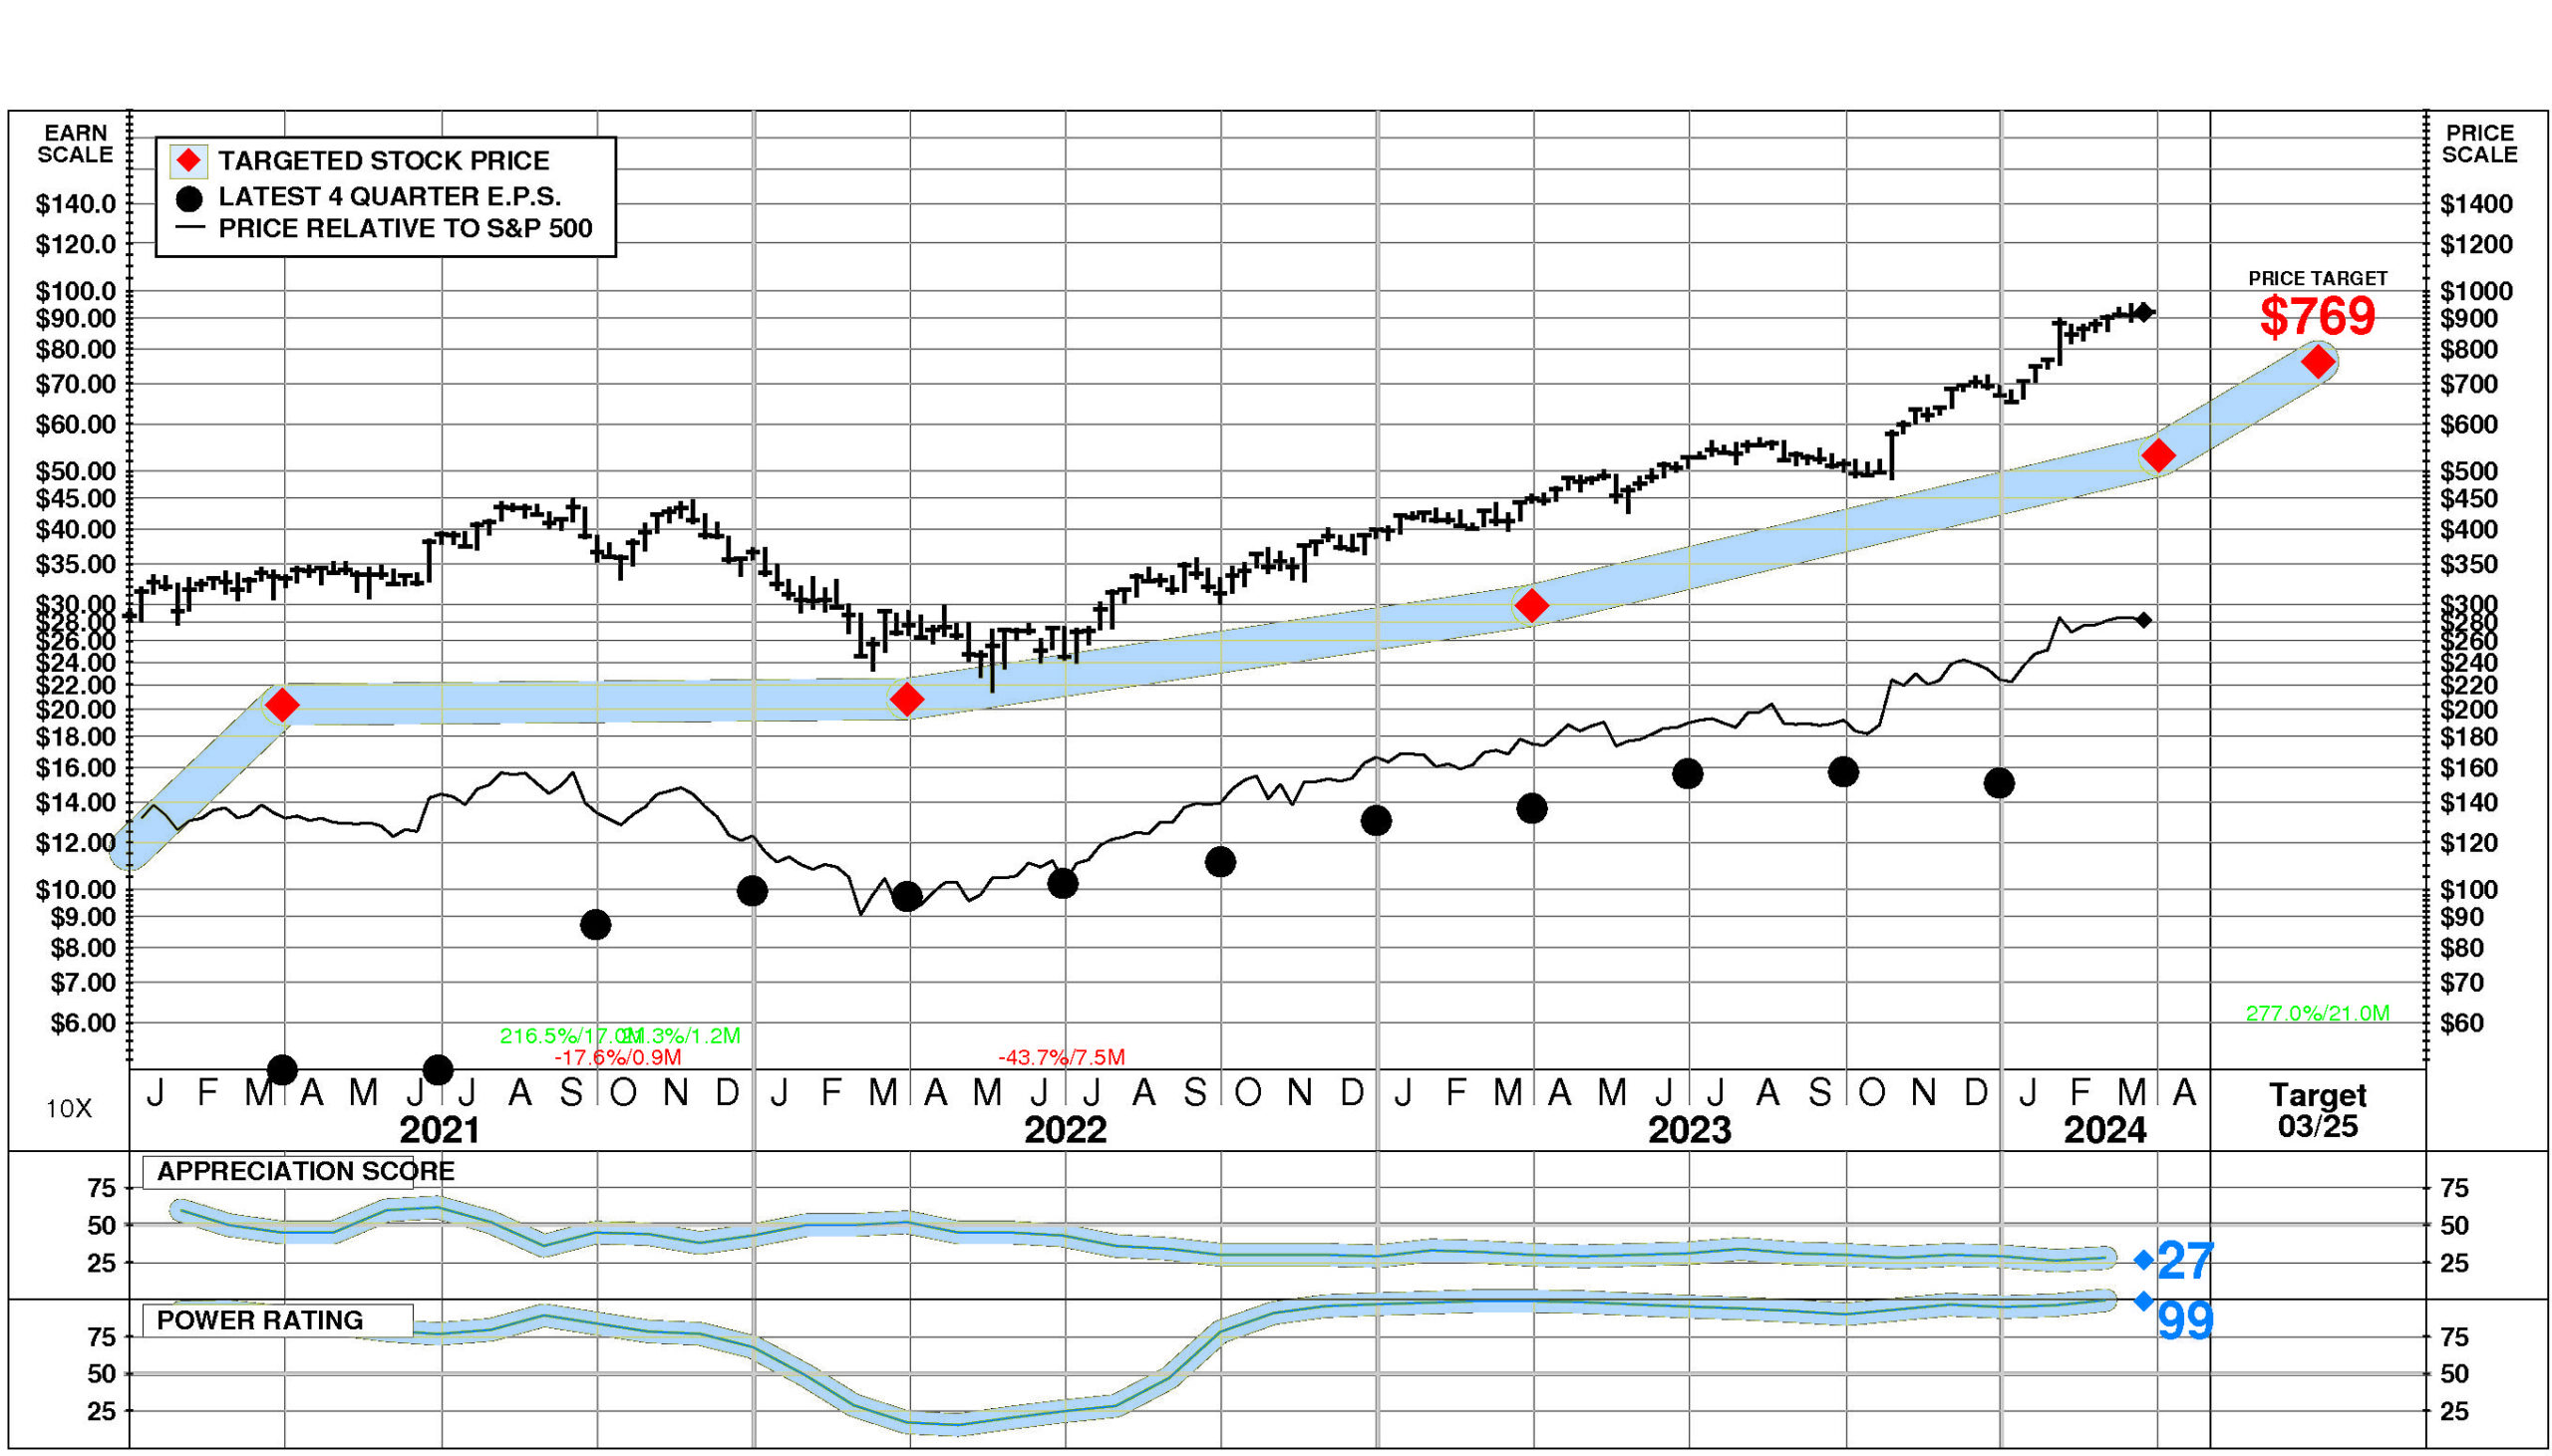
Deckers Outdoor’s stock is selling above targeted value. The current stock price of $922.44 compares to targeted value 12 months forward of $763.
This low appreciation potential results in an appreciation score of 27 (73% of the universe has greater appreciation potential.)
Deckers Outdoor has a Power Rating of 99. (DECK’s very high Power Rating indicates that it has a higher likelihood of achieving favorable investment performance over the near to intermediate term than all but 1% of companies in the universe.)
Factors contributing to this very high Power Rating include: recent price action has been extremely favorable; the Leather and Leather Products comparison group is in a strong phase currently; and the recent trend in DECK’s earnings estimates has been favorable.
INVESTMENT PROFILE
DECK’s financial strength is exceptional. Financial strength rating is 90.
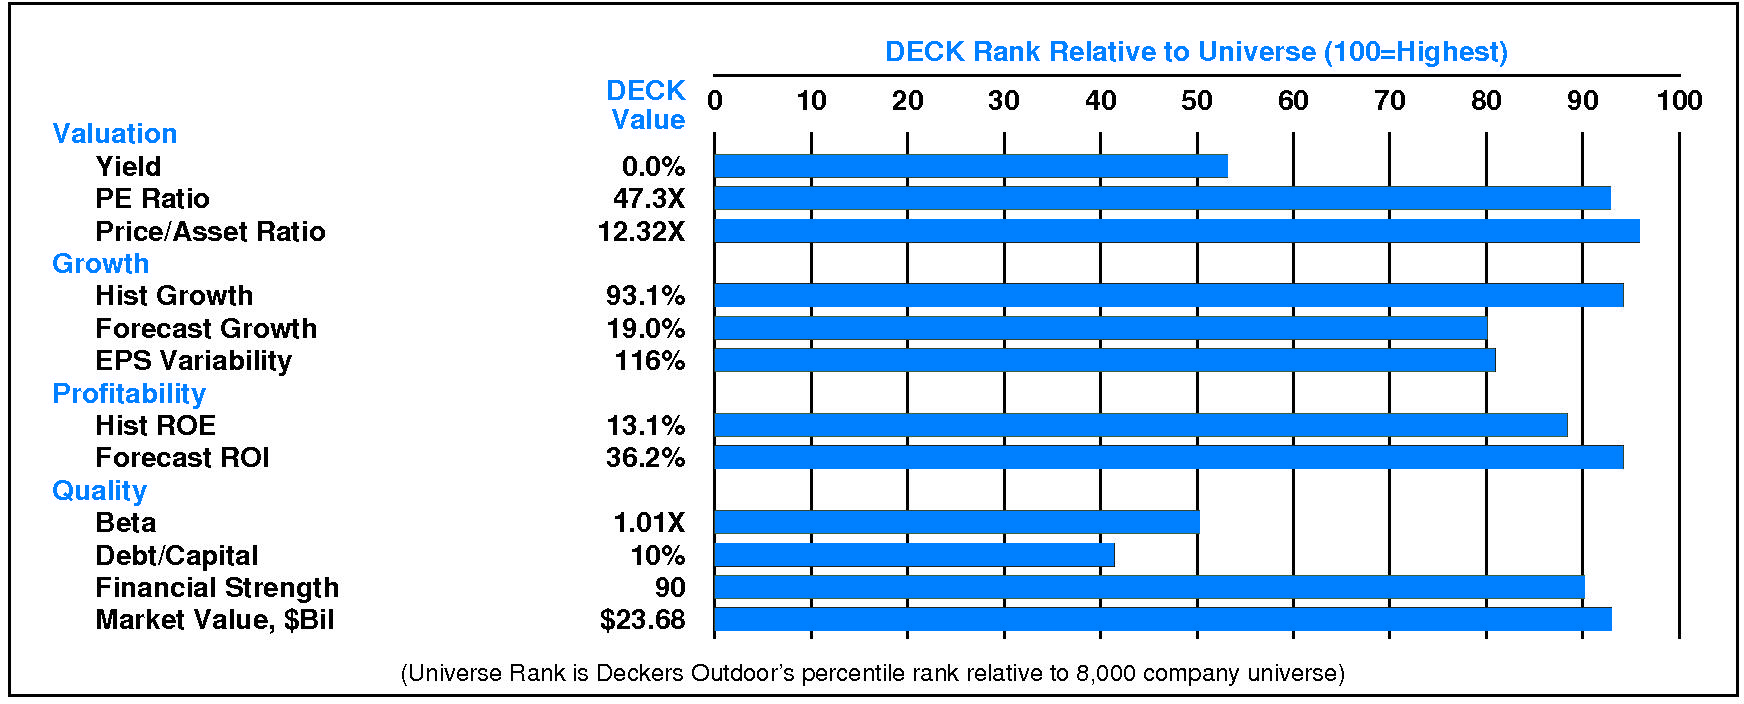
Relative to the S&P 500 Composite, Deckers Outdoor Corp has significant Growth characteristics; its appeal is likely to be to Capital Gain-oriented investors; the perception is that DECK is normal risk. High earnings variability is a relative weakness for DECK. DECK’s valuation is high: low dividend yield, high P/E ratio, and high price/book ratio. DECK has low market capitalization.
CURRENT SIGNALS
Deckers Outdoor’s current operations are strong. Return on equity is rising, reflecting: widening pretax margins; and rising leverage.
Deckers Outdoor’s current technical position is very strong. The stock price is in a 21.0 month up move. The stock has appreciated 277.0% from its prior low. The stock price is above its 200 day moving average which is in an uptrend.
ALERTS
Recent notable negative changes in investment behavior have affected Deckers Outdoor Corp (NYSE: DECK): negative upside/downside volume developed.
The stock is currently rated B.
Deckers Outdoor Corp (NYSE: DECK) stock closed at $922.44 on 3/22/24 after a decline of -3.2%. NORMAL trading volume accompanied the decline. The stock has declined -1.1% during the last week but has been exceptionally strong relative to the market over the last nine months.
CASH FLOW
In 2023, Deckers Outdoor generated a significant increase in cash of +$138.3 million (+16%). Sources of cash were larger than uses. Cash generated from 2023 EBITDA totaled +$700.6 million. Non-operating sources contributed +$16.5 million (+2% of EBITDA). Cash taxes consumed -$149.3 million (-21% of EBITDA). Re-investment in the business amounted to -$160.9 million (-23% of EBITDA). On a net basis, debt investors contributed +$21.2 million (+3% of EBITDA) while equity investors withdrew -$289.9 million (-41% of EBITDA).
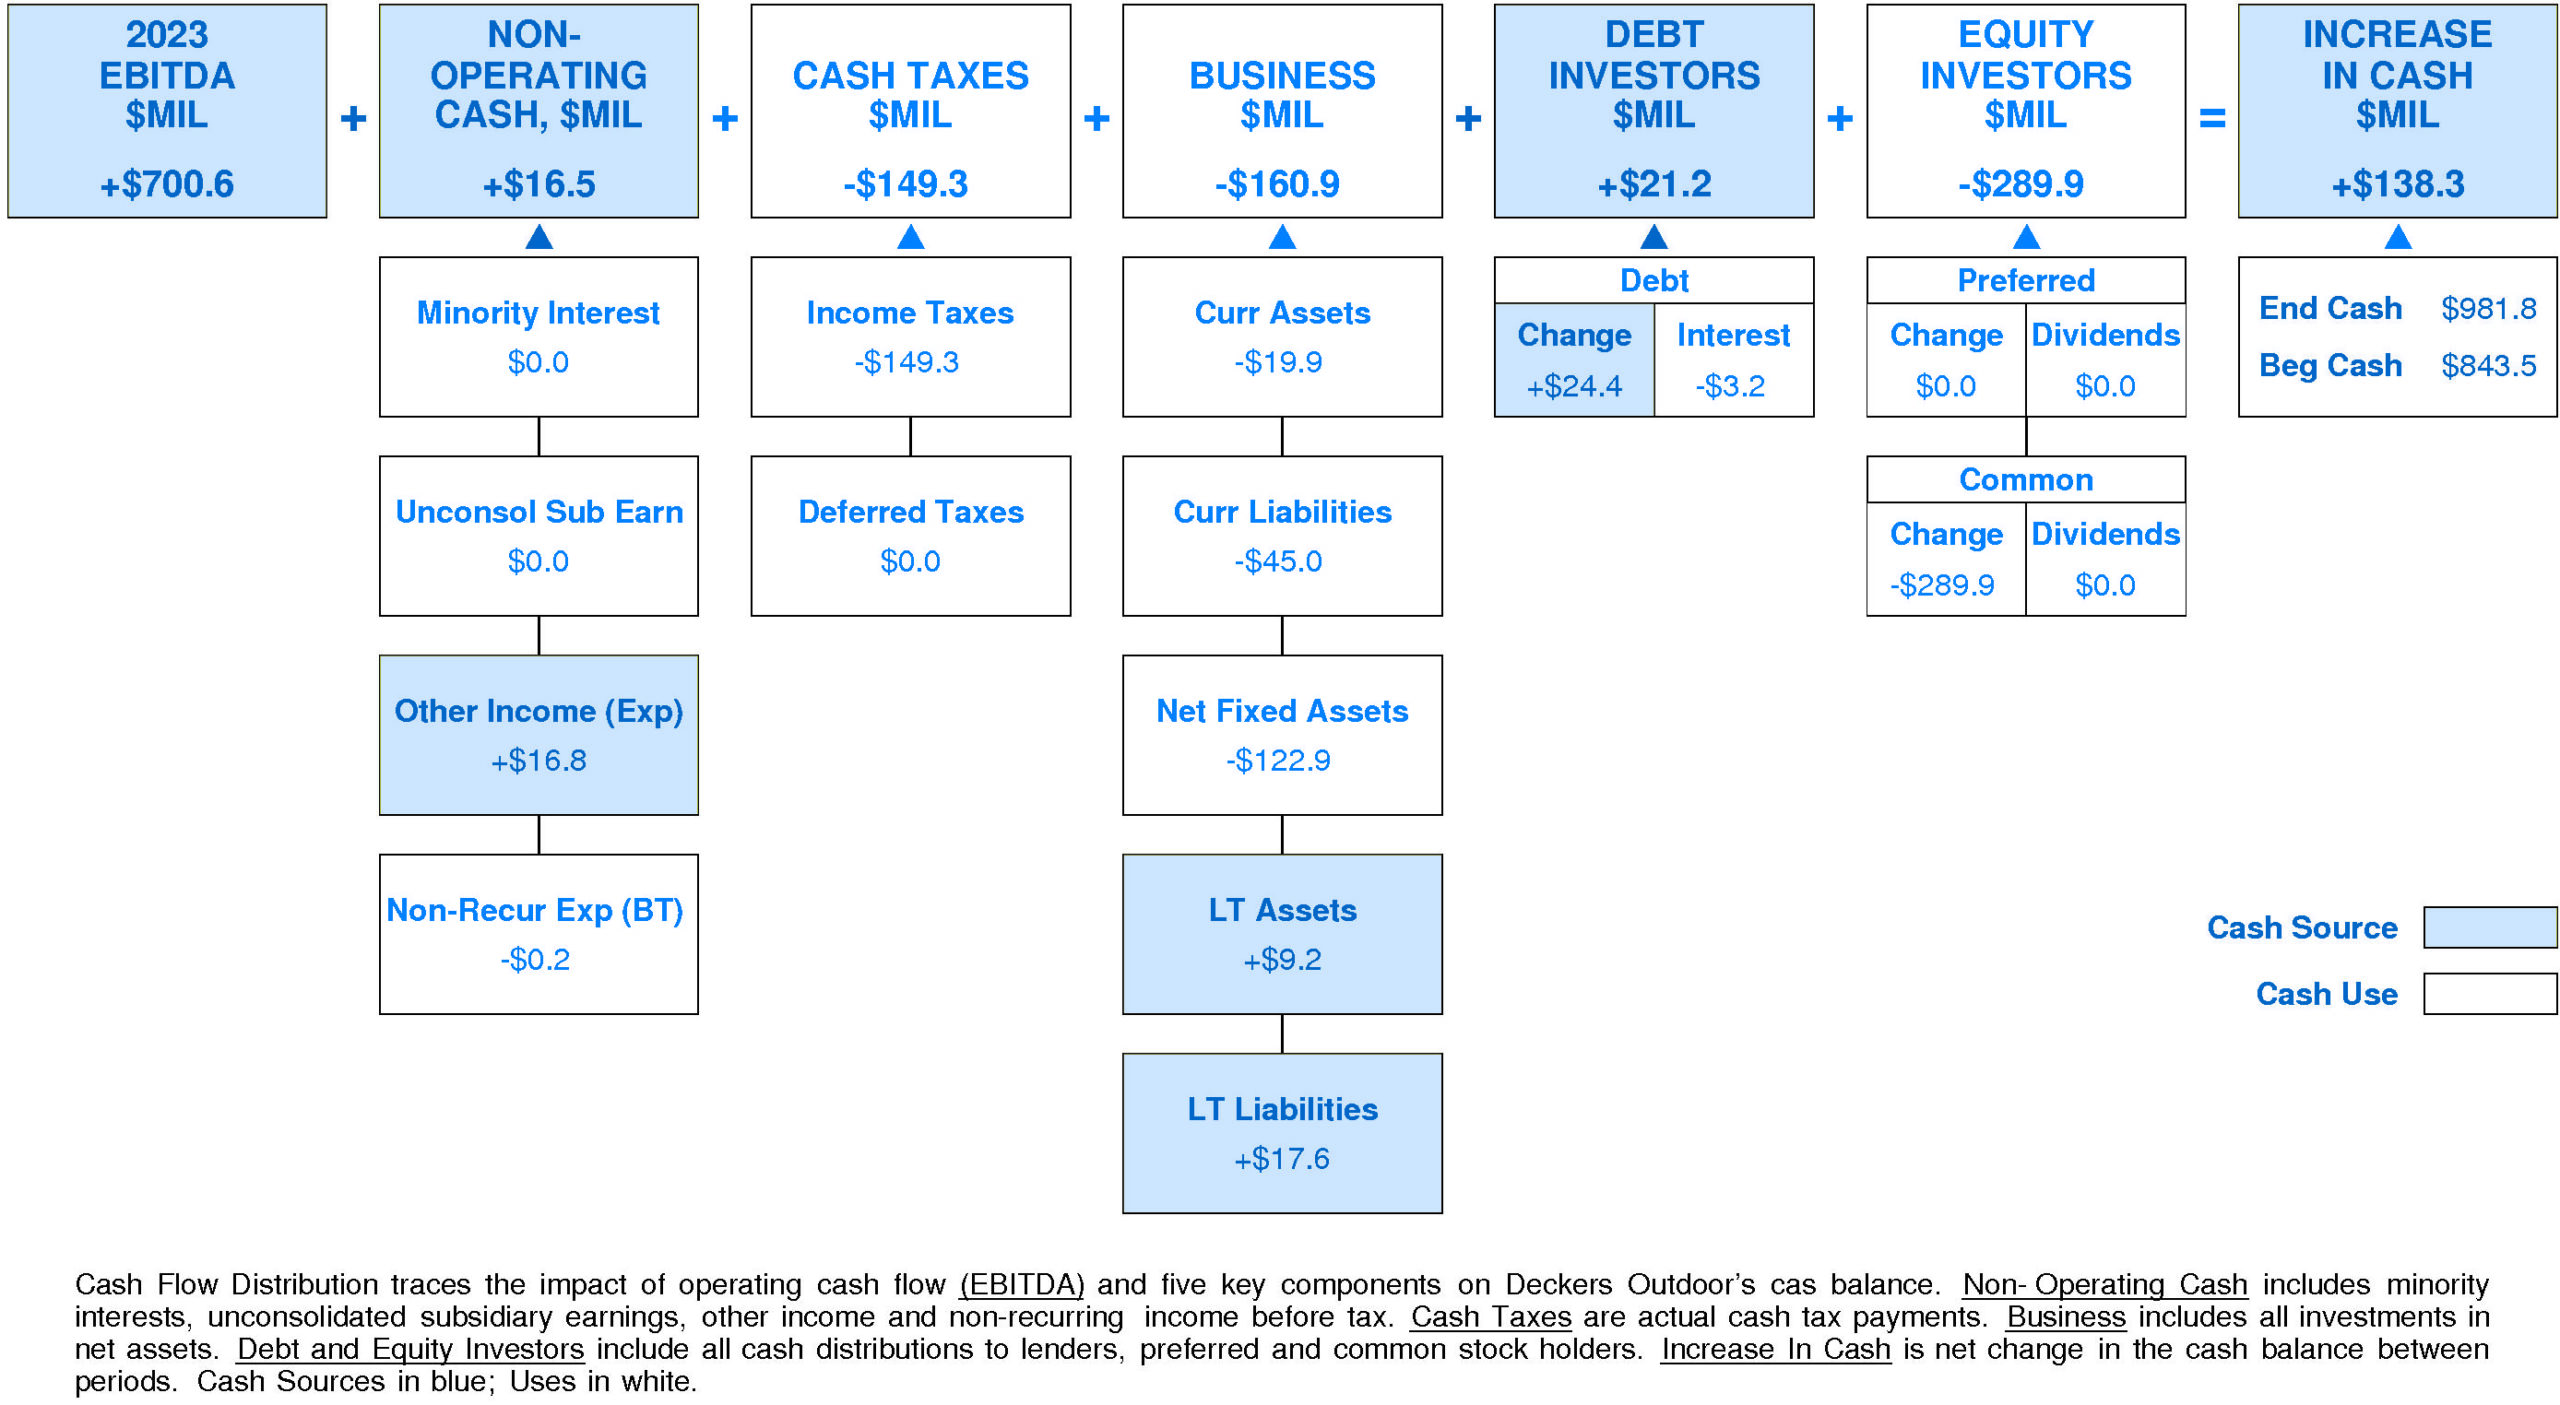
Deckers Outdoor’s Non-operating Income, %EBITDA has exhibited a volatile overall uptrend over the period. This improvement was accompanied by stability for the Deckers Outdoor Peer Group. In most years, Deckers Outdoor was in the top quartile and second quartile. Currently, Deckers Outdoor is upper quartile at +2% of EBITDA (+$16.5 million).
Deckers Outdoor’s Cash Taxes, %EBITDA has exhibited little to no overall change over the period. This stability was accompanied by an uptrend for the Deckers Outdoor Peer Group. In most years, Deckers Outdoor was in the third quartile and second quartile. Currently, Deckers Outdoor is at the lower quartile at -21% of EBITDA (-$149.3 million).
Deckers Outdoor’s Business Re-investment, %EBITDA has experienced a downtrend over the period. This downtrend was accompanied by a similar trend for the Deckers Outdoor Peer Group. In most years, Deckers Outdoor was in the top quartile and third quartile. Currently, Deckers Outdoor is upper quartile at -23% of EBITDA (-$160.9 million).
Deckers Outdoor’s Debt Investors, %EBITDA has exhibited a volatile overall uptrend over the period. This improvement was accompanied by a similar trend for the Deckers Outdoor Peer Group. (Since 2021 Debt Investors, %EBITDA has sharply accelerated.) In most years, Deckers Outdoor was in the second quartile and lower quartile. Currently, Deckers Outdoor is slightly above median at +3% of EBITDA (+$21.2 million).
Deckers Outdoor’s Equity Investors, %EBITDA has suffered a volatile overall downtrend over the period. This downtrend was accompanied by stability for the Deckers Outdoor Peer Group. In most years, Deckers Outdoor was in the lower quartile and third quartile. Currently, Deckers Outdoor is substantially below median at -41% of EBITDA (-$289.9 million).
Deckers Outdoor’s Change in Cash, %EBITDA has experienced a downtrend over the period. This downtrend was accompanied by stability for the Deckers Outdoor Peer Group. In most years, Deckers Outdoor was in the top quartile and second quartile. Currently, Deckers Outdoor is above median at +20% of EBITDA (+$138.3 million).
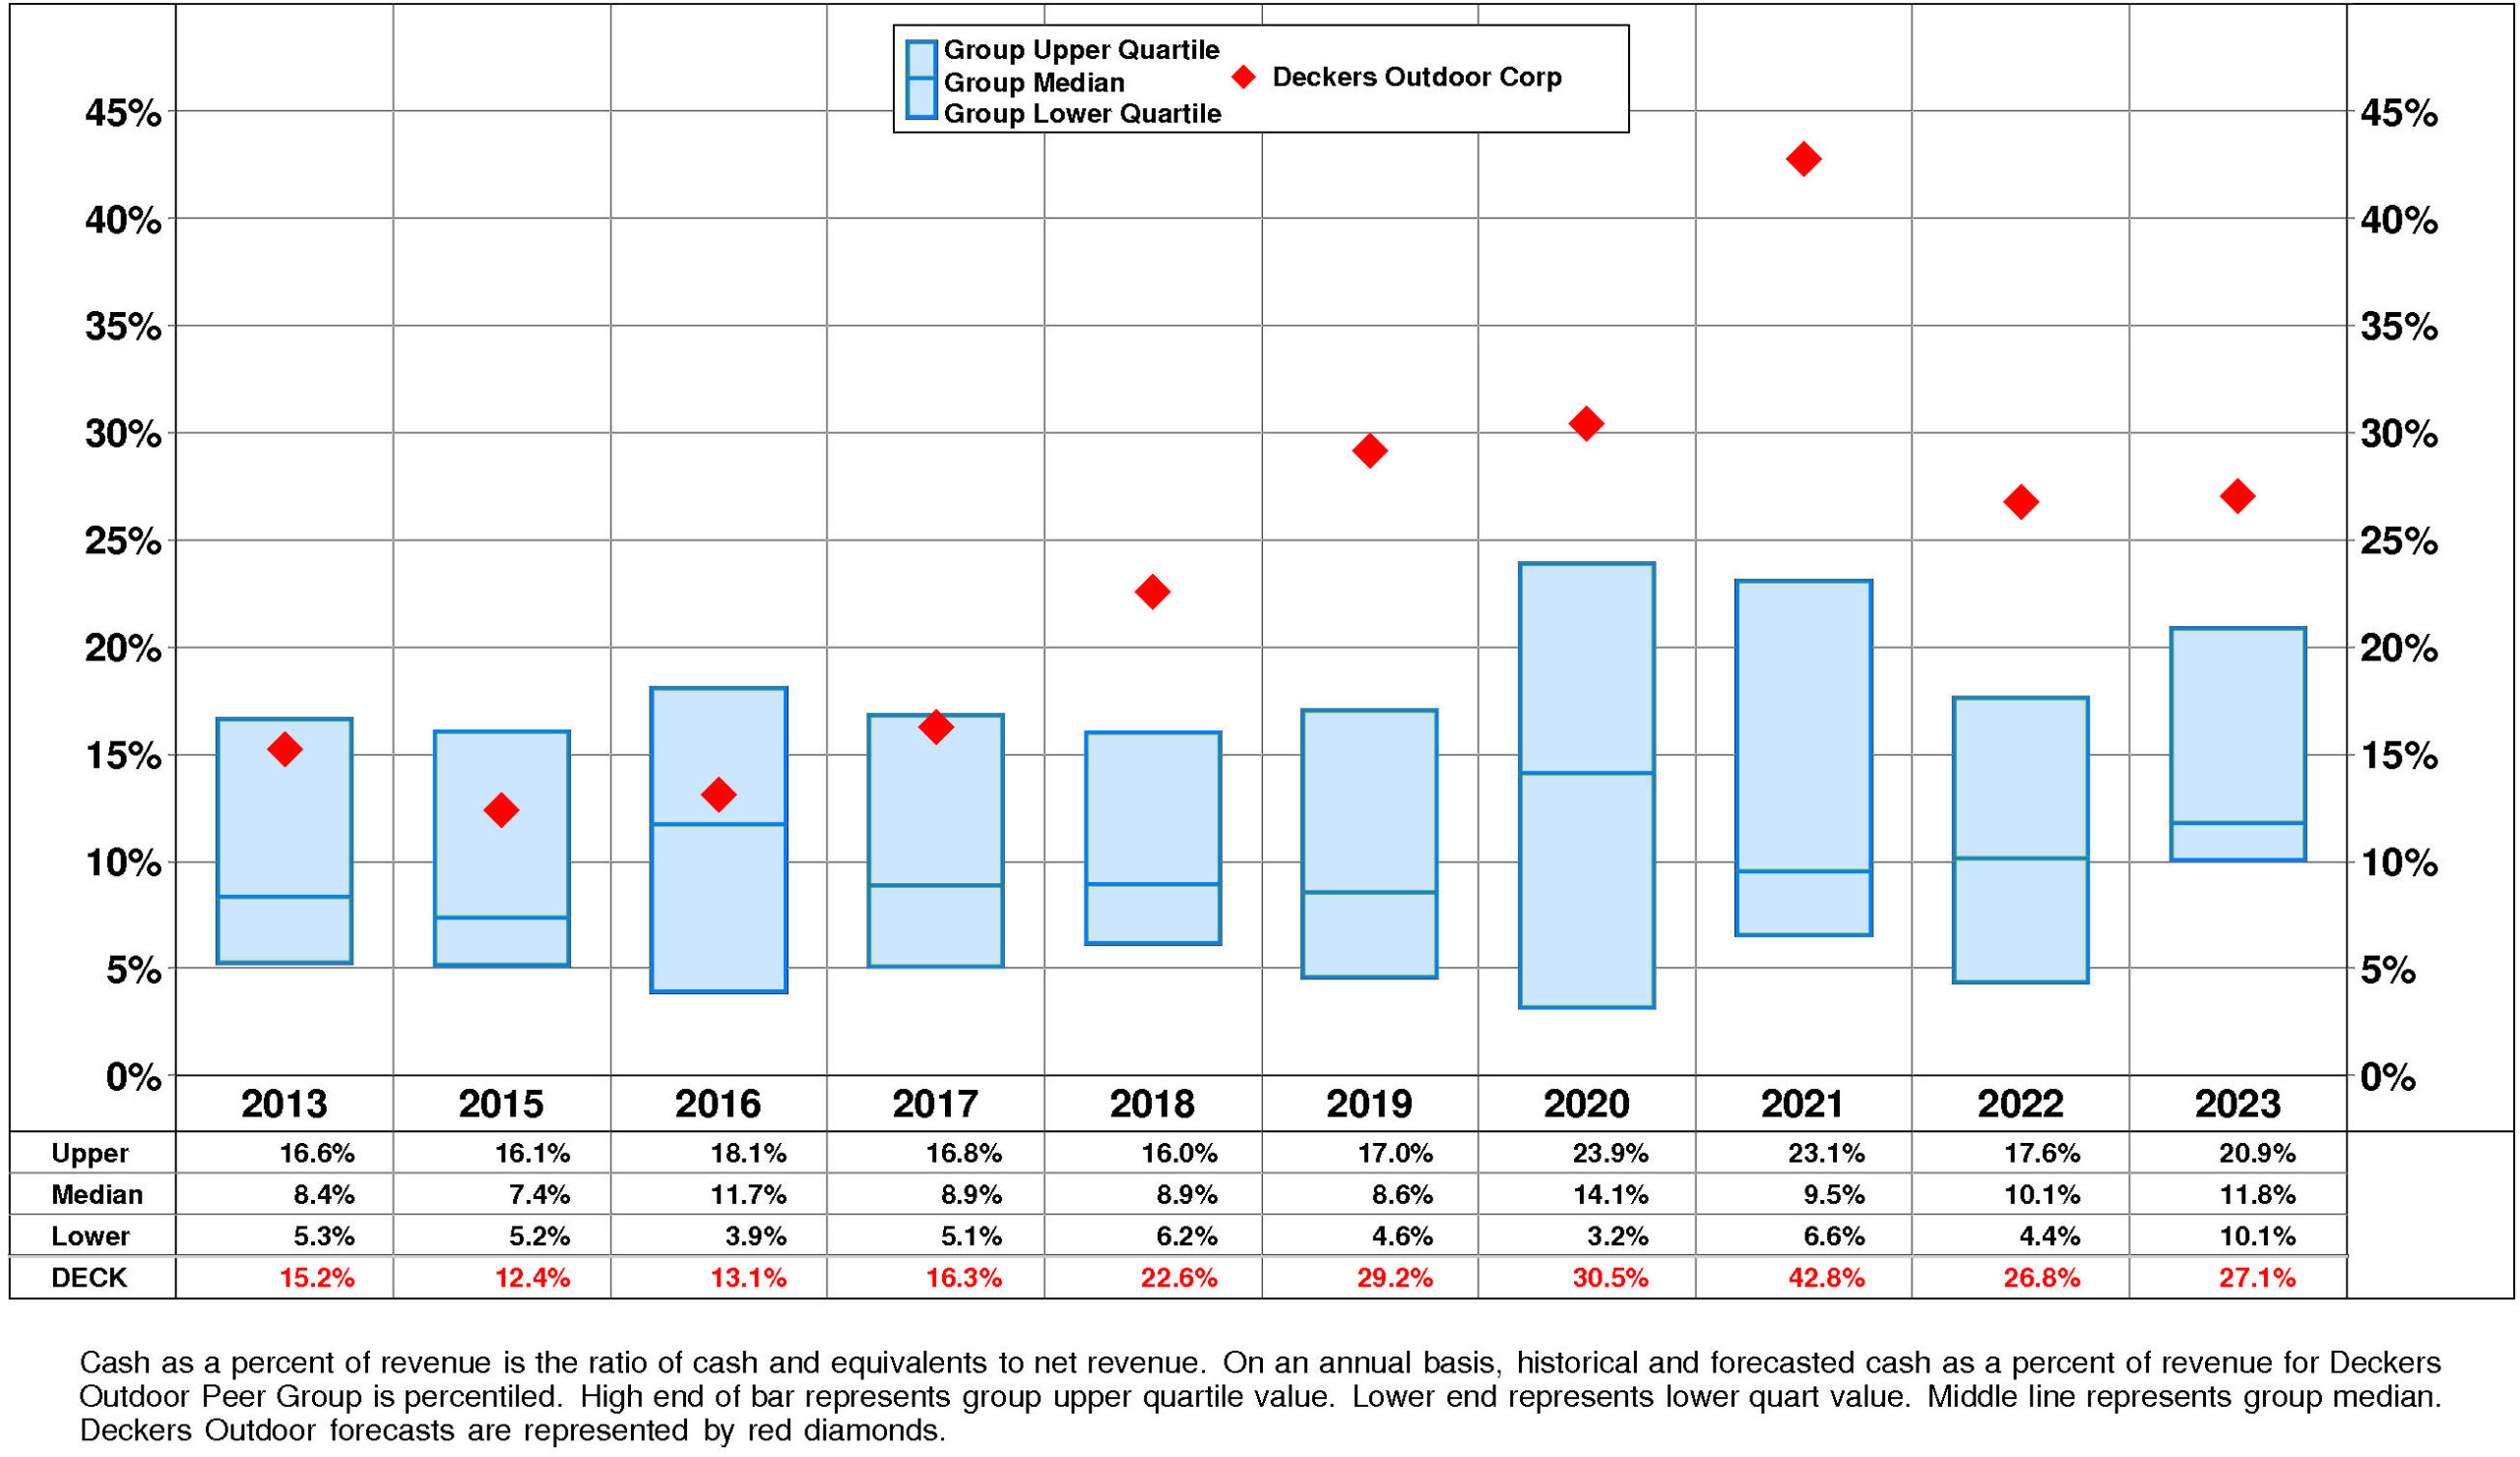
Deckers Outdoor’s Cash, %Revenue has enjoyed a strong overall uptrend over the period. This improvement was accompanied by stability for the Deckers Outdoor Peer Group. (Since 2021 Cash, %Revenue has experienced a very sharp decline.) In most years, Deckers Outdoor was in the top quartile and second quartile. Currently, Deckers Outdoor is upper quartile at +27%.
PROFITABILITY
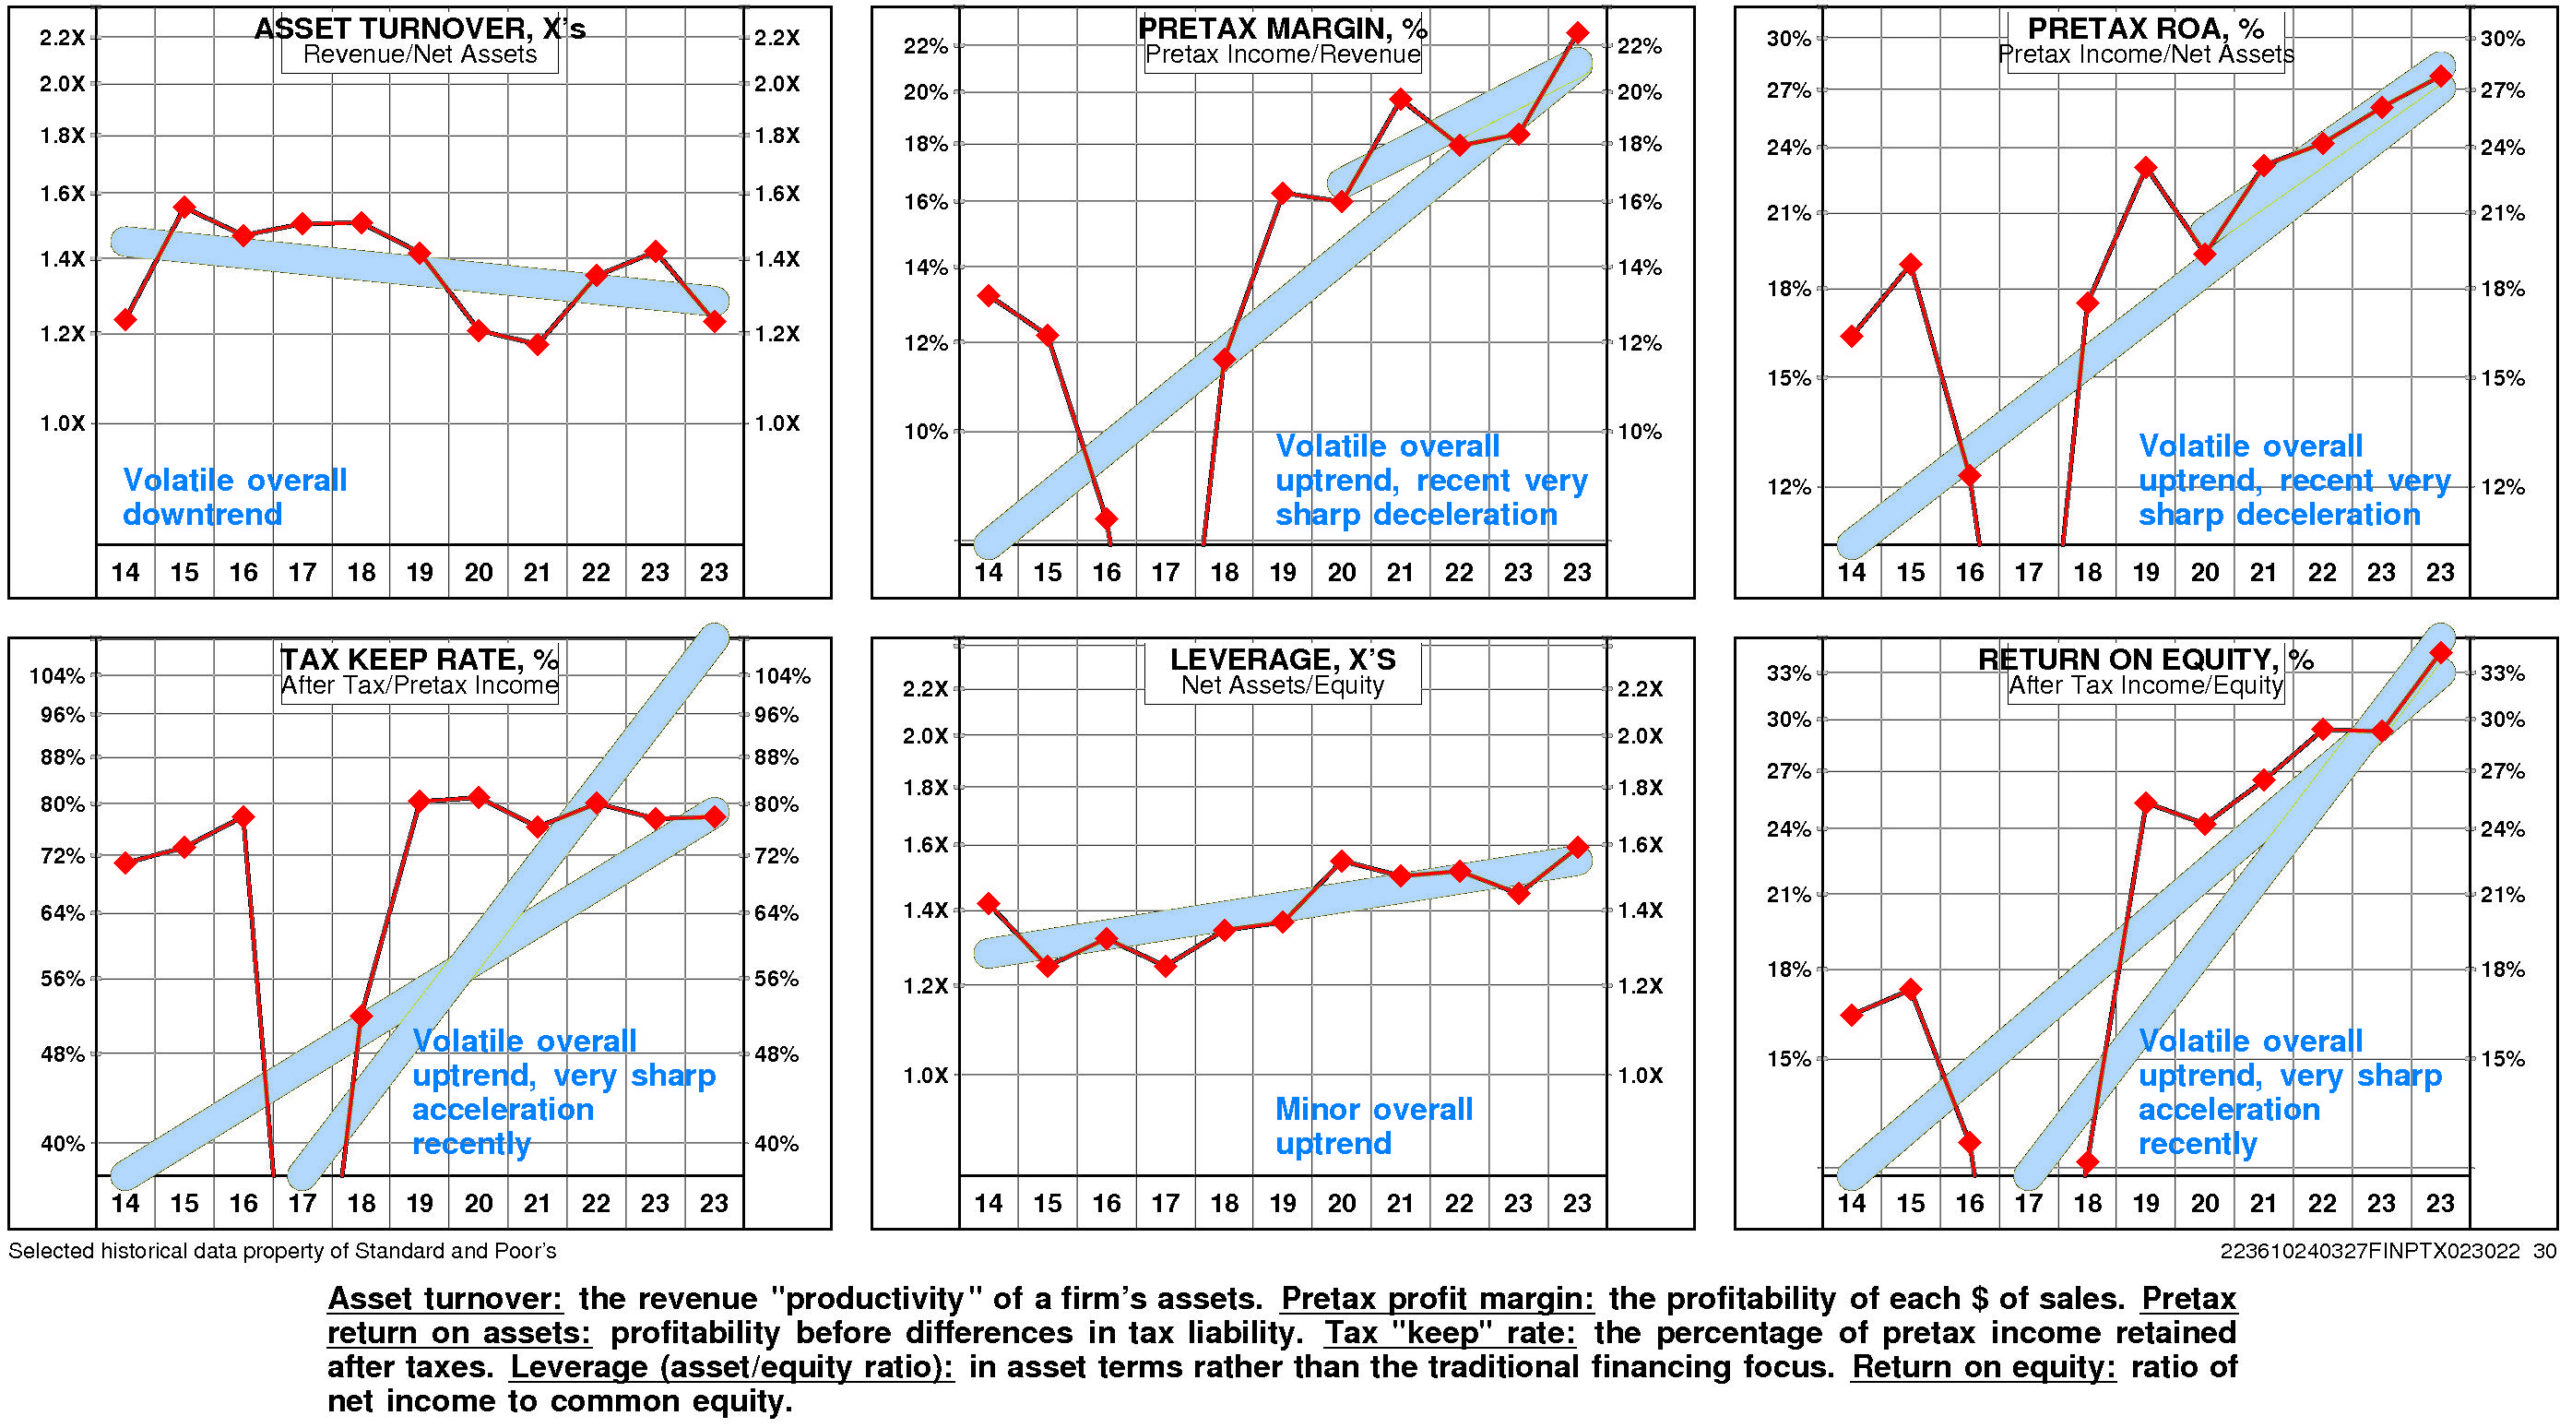
Deckers Outdoor’s return on equity has improved very significantly since 2014. The current level of 34.4% is 2.10X the low for the period and is at the high.
Deckers Outdoor’s very strong positive trend in pretax operating return significantly offset by a very strong negative trend in non-operating factors is a significant analytical factor.
The productivity of Deckers Outdoor’s assets declined over the full period 2014-2023: asset turnover has experienced a downtrend.
More than offsetting this trend, however, pretax margin enjoyed a volatile overall uptrend that decelerated very sharply from the 2020 level.
Non-operating factors (income taxes and financial leverage) had a significant negative influence on return on equity.
Deckers Outdoor’s return on equity is upper quartile (34.4%) for the four quarters ended December, 2023.
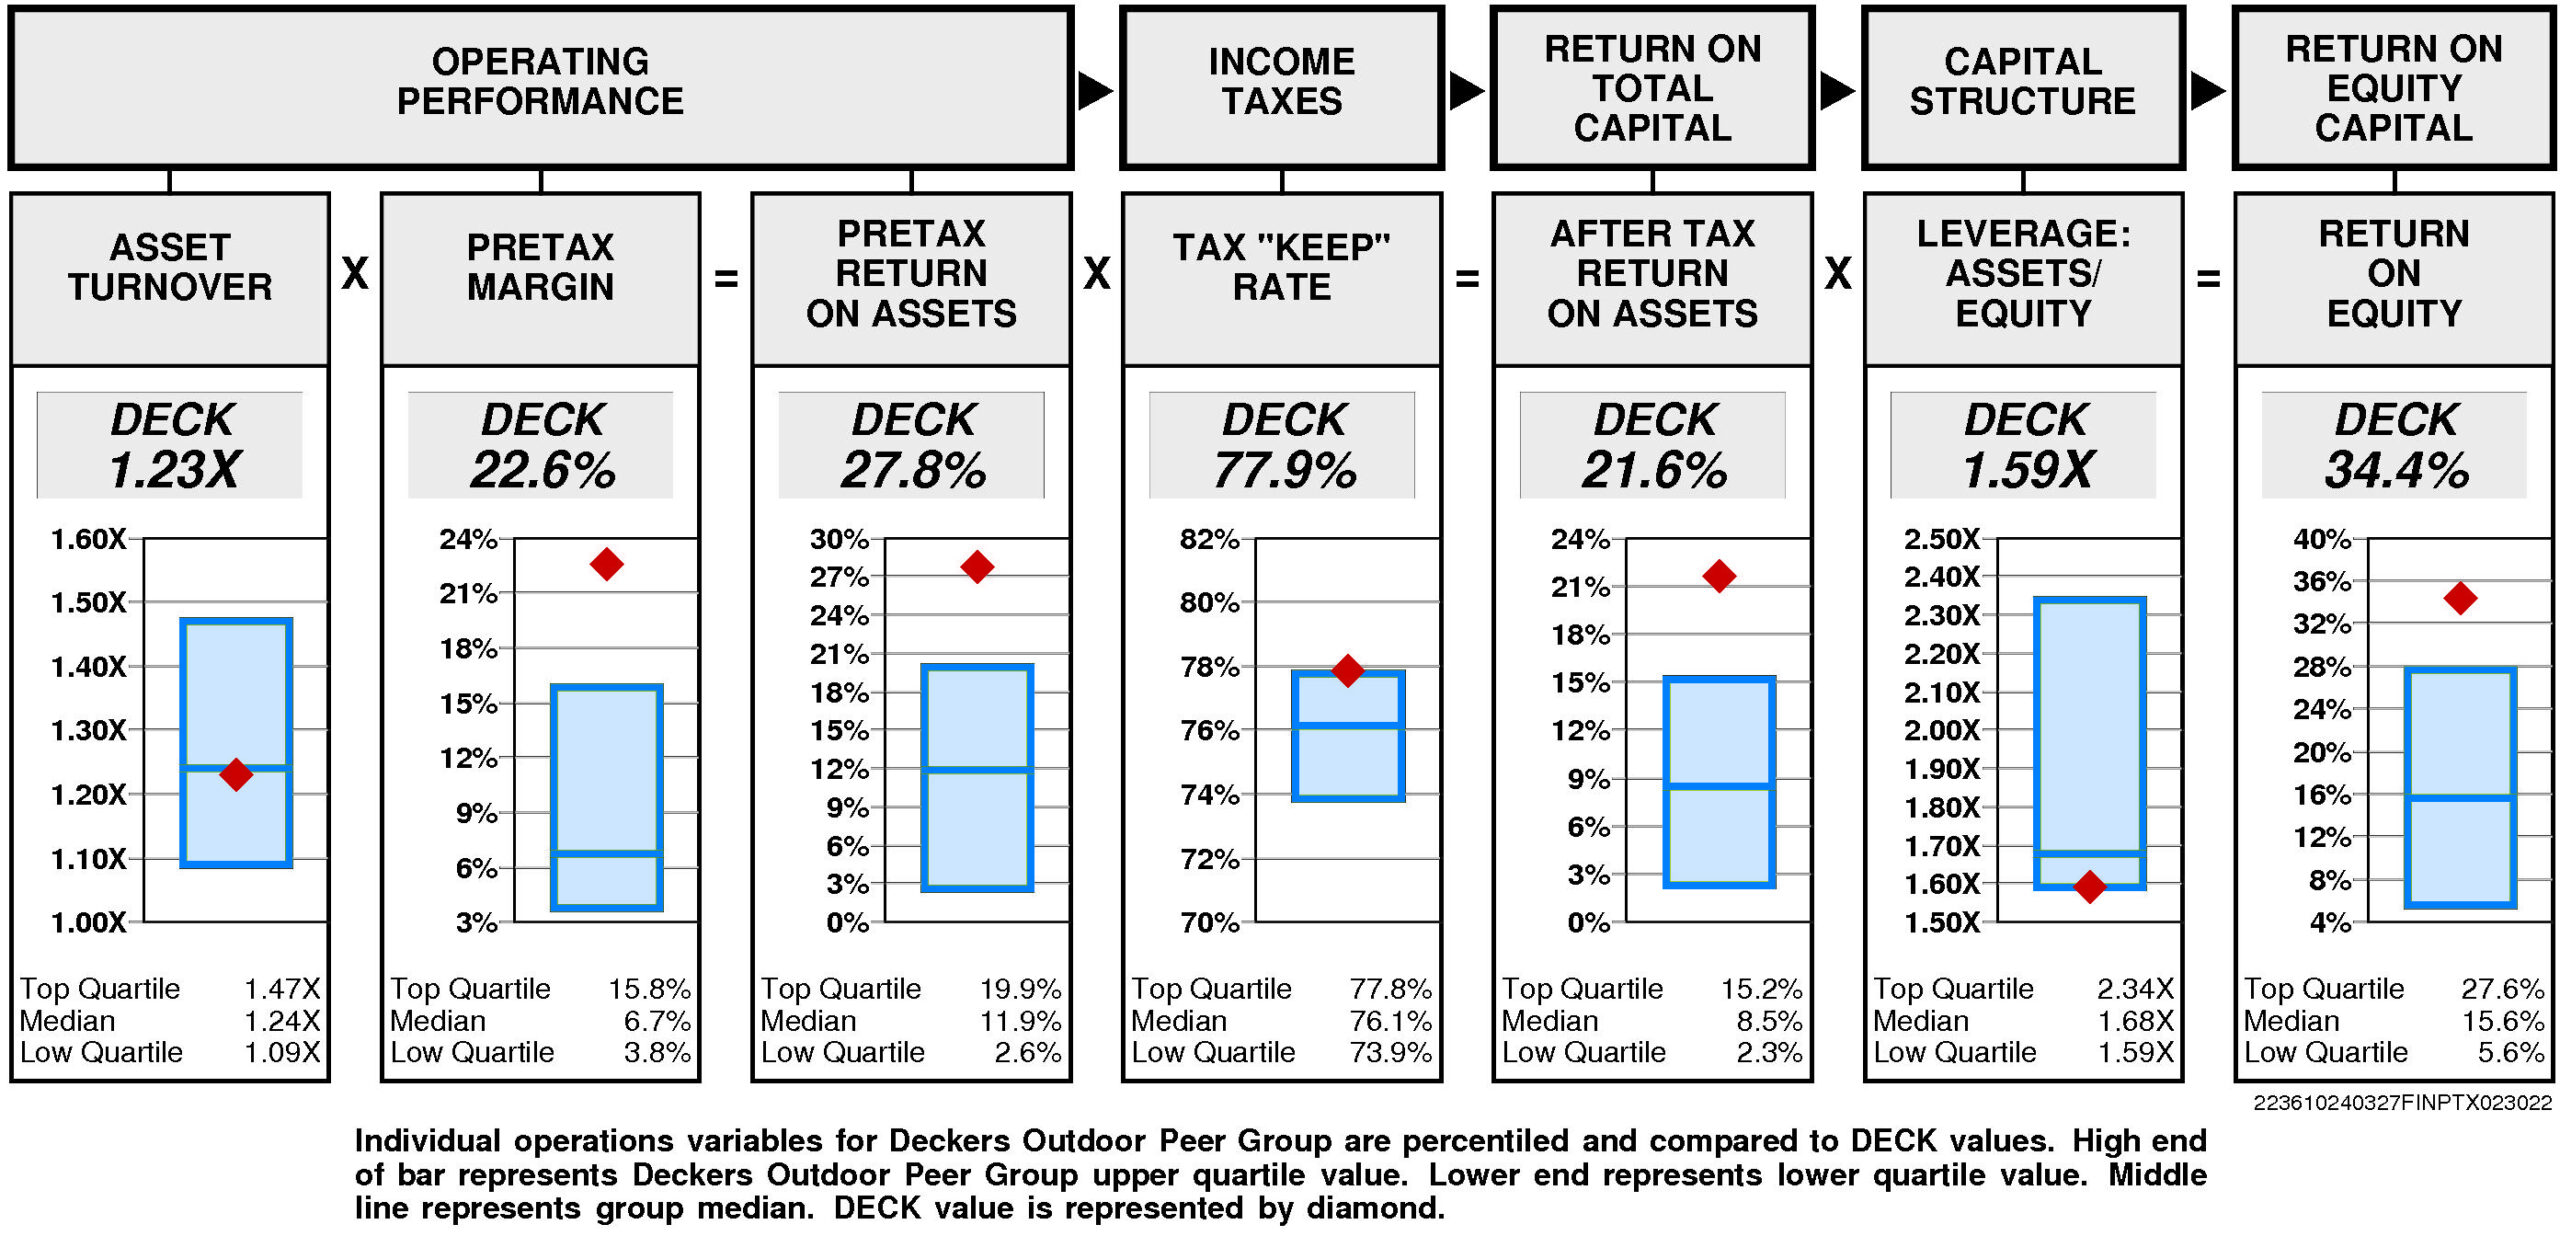
Operating performance (pretax return on assets) is upper quartile (27.8%) reflecting asset turnover that is at median (1.23X) and upper quartile pretax margin (22.6%).
Tax “keep” rate (income tax management) is at the upper quartile (77.9%) resulting in after tax return on assets that is upper quartile.
Financial leverage (leverage) is at the lower quartile (1.59X).
GROWTH RATES
There are no significant differences between Deckers Outdoor’s longer term growth and growth in recent years.
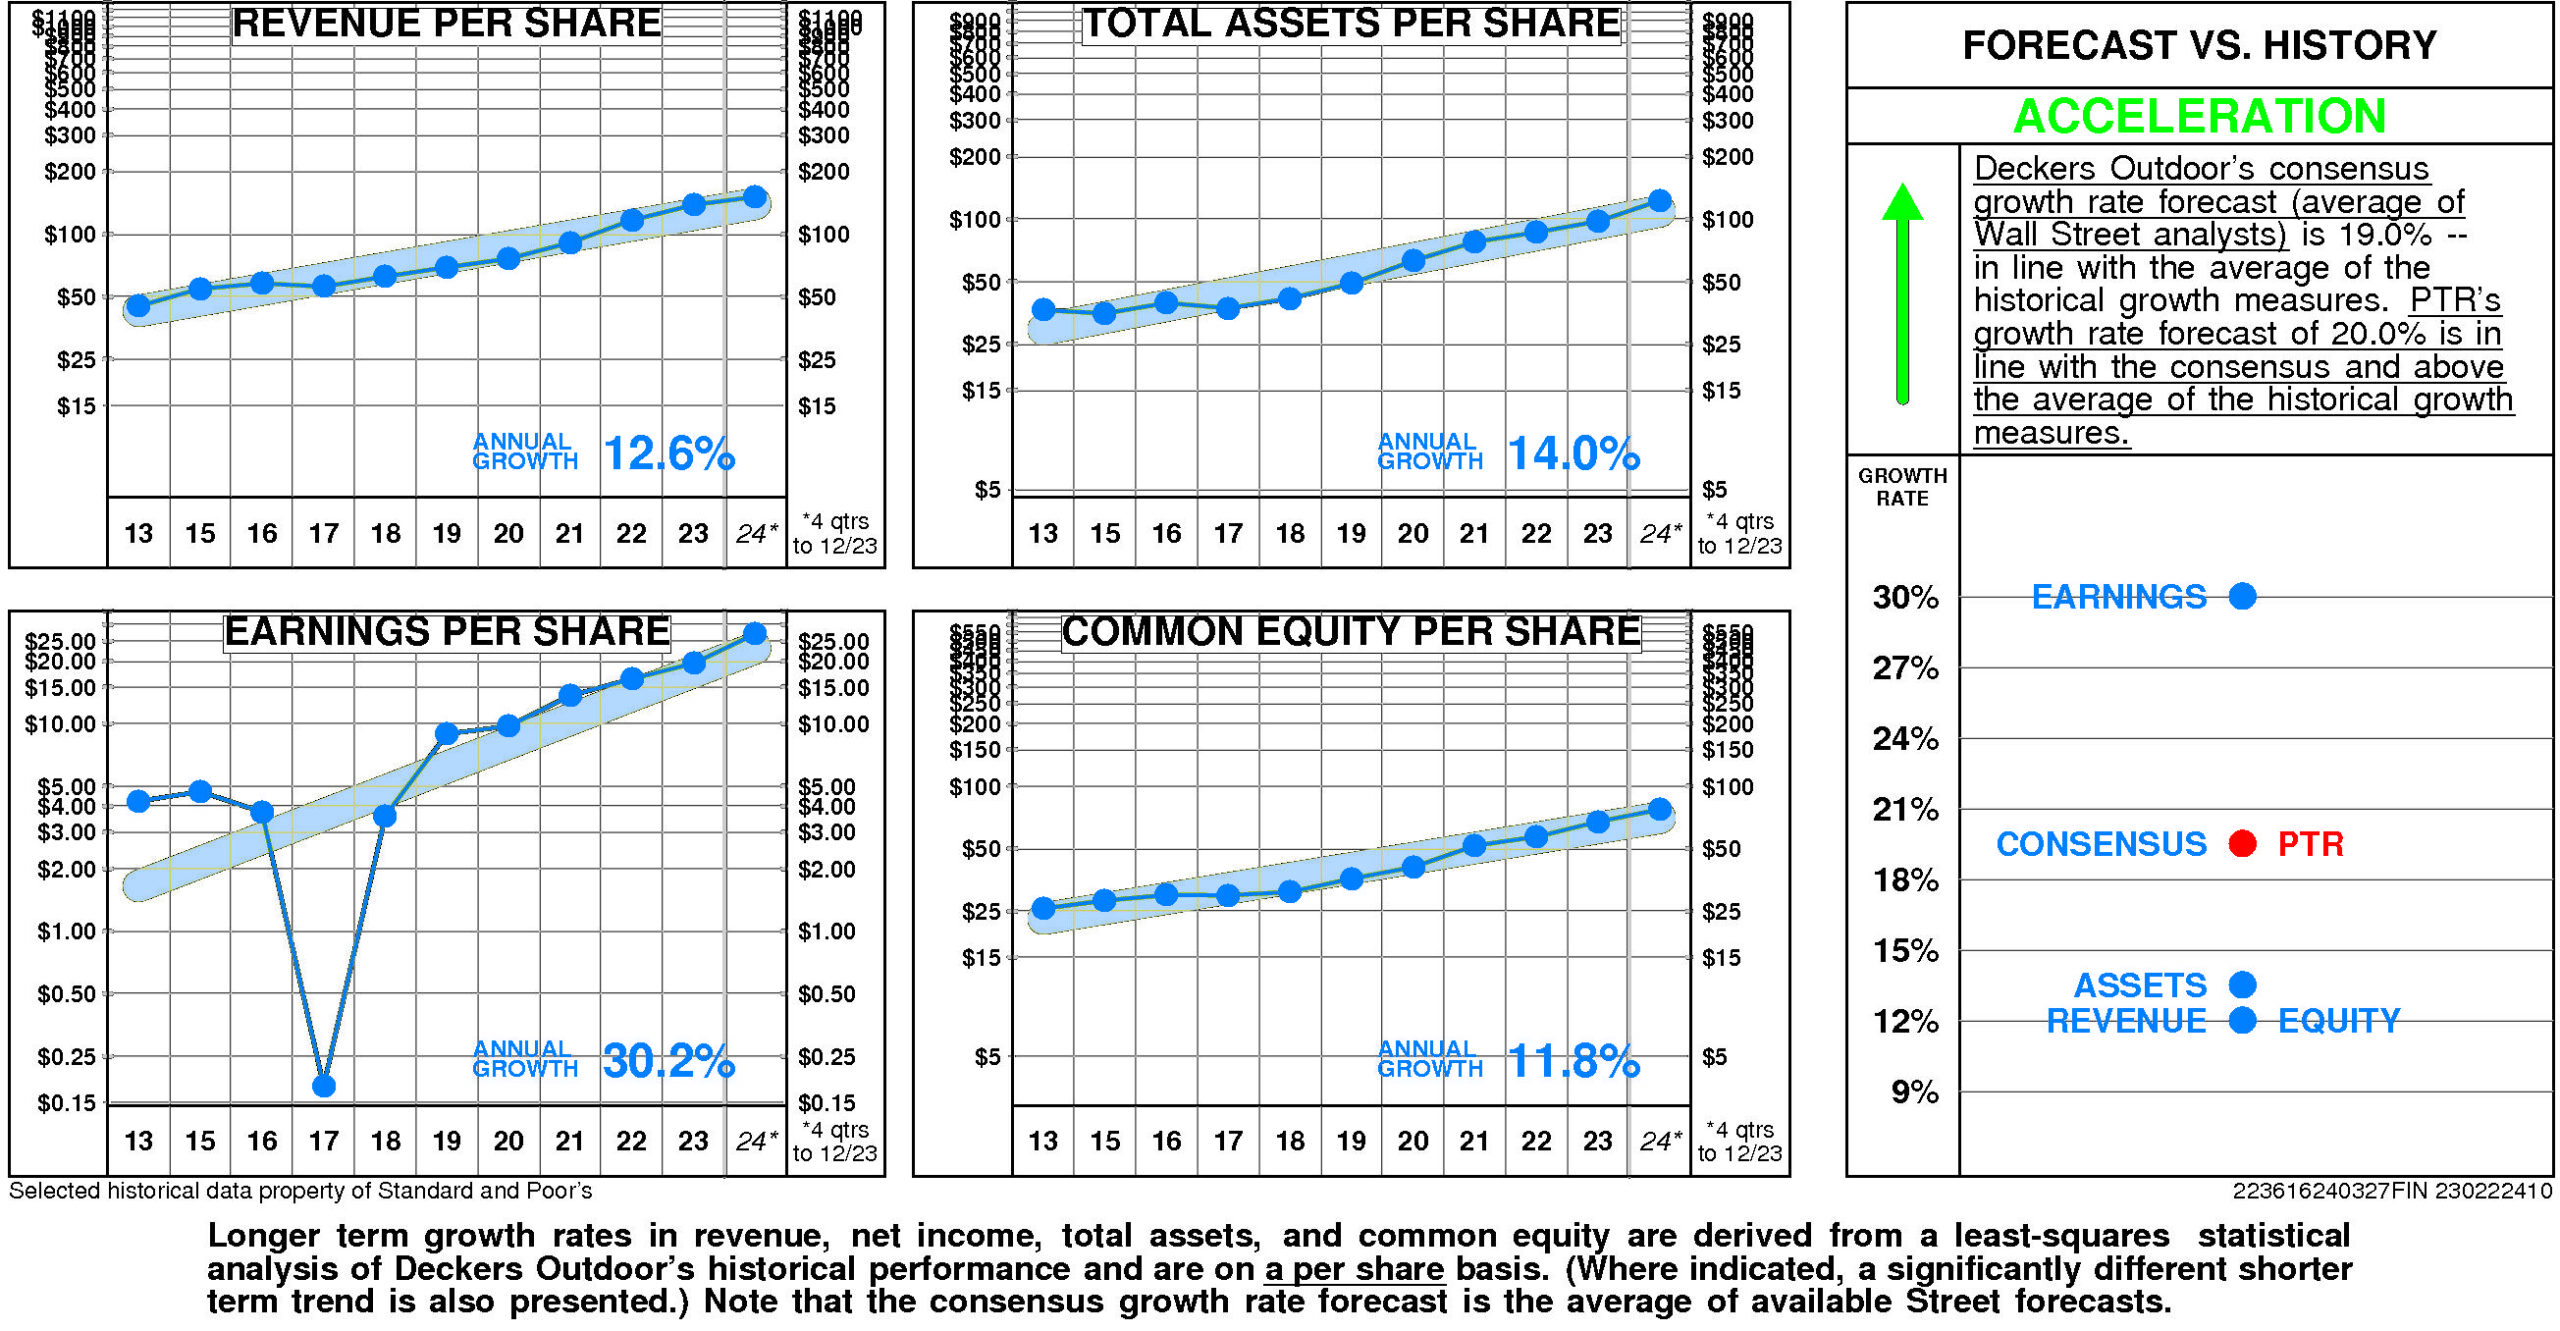
Deckers Outdoor’s historical income statement growth and balance sheet growth have diverged. Revenue growth has paralleled asset growth; earnings growth has exceeded equity growth.
Annual revenue growth has been 12.6% per year.
Total asset growth has been 14.0% per year.
Annual E.P.S. growth has been 30.2% per year.
Equity growth has been 11.8% per year.
Deckers Outdoor’s consensus growth rate forecast (average of Wall Street analysts) is 19.0% — in line with the average of the historical growth measures.
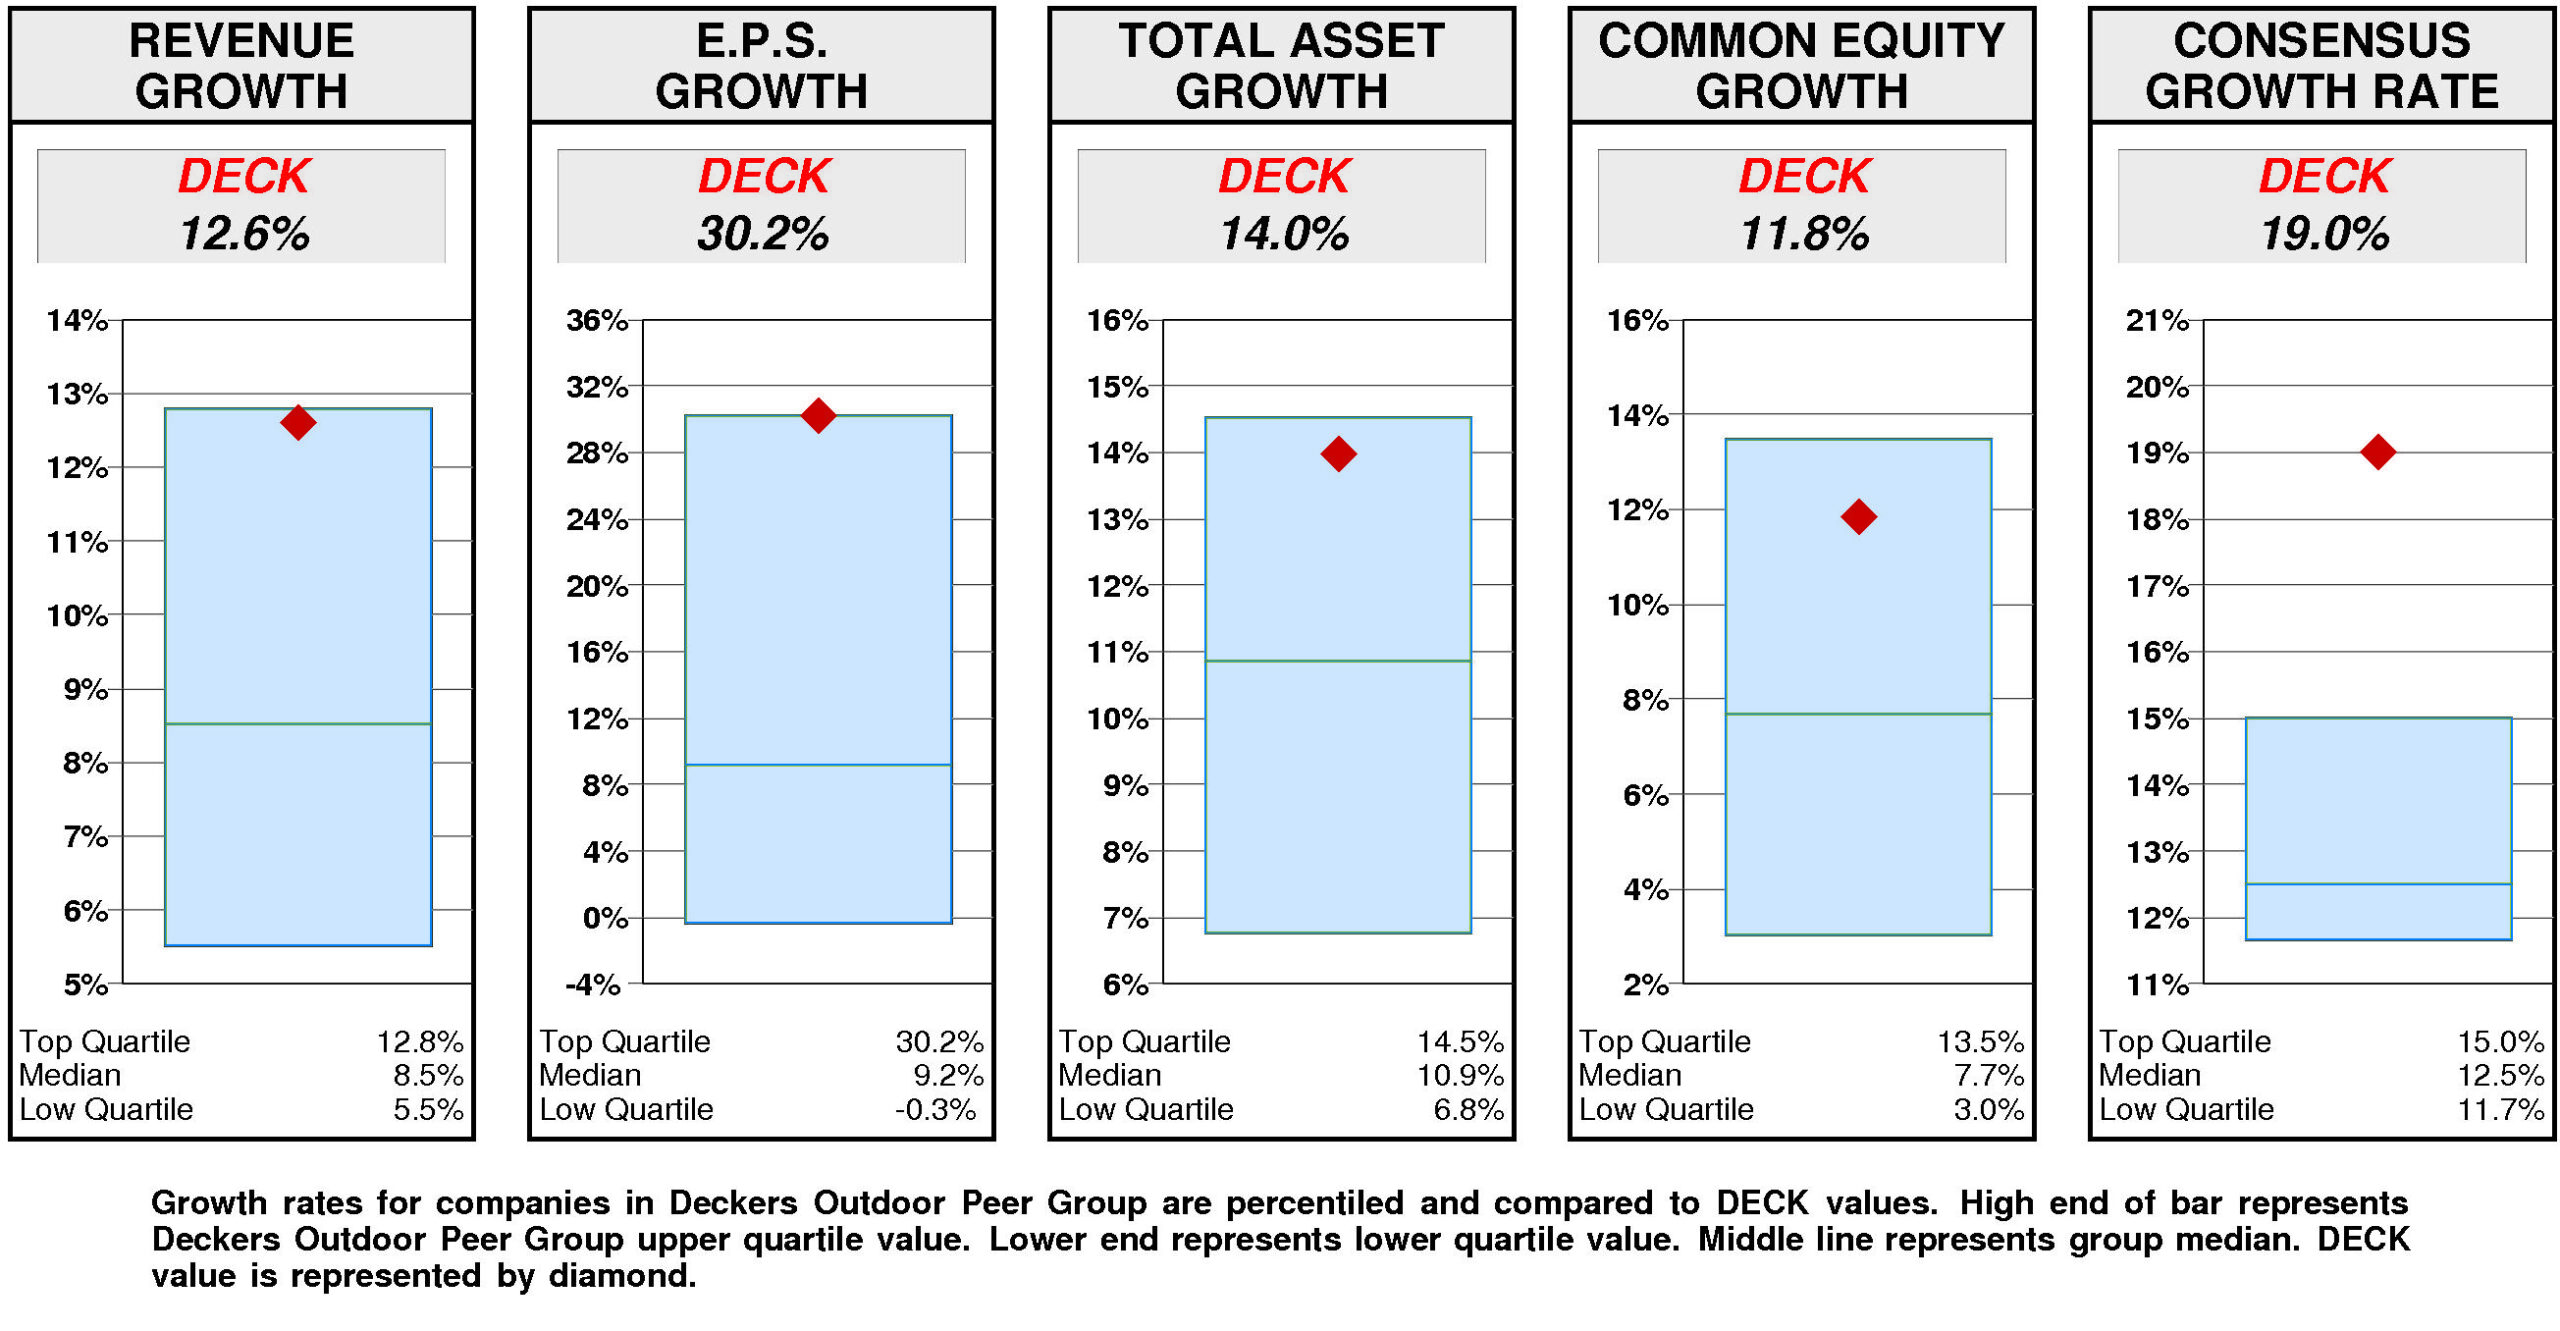
Relative to the Deckers Outdoor Peer Group, Deckers Outdoor’s historical growth measures are generally second quartile. Revenue growth (12.6%) has been at the upper quartile. E.P.S. growth (30.2%) has been at the upper quartile. Equity growth (11.8%) has been above median. Total asset growth (14.0%) has been substantially above median.
Consistent with this pattern, consensus growth forecast (19.0%) is also upper quartile.
PRICE HISTORY
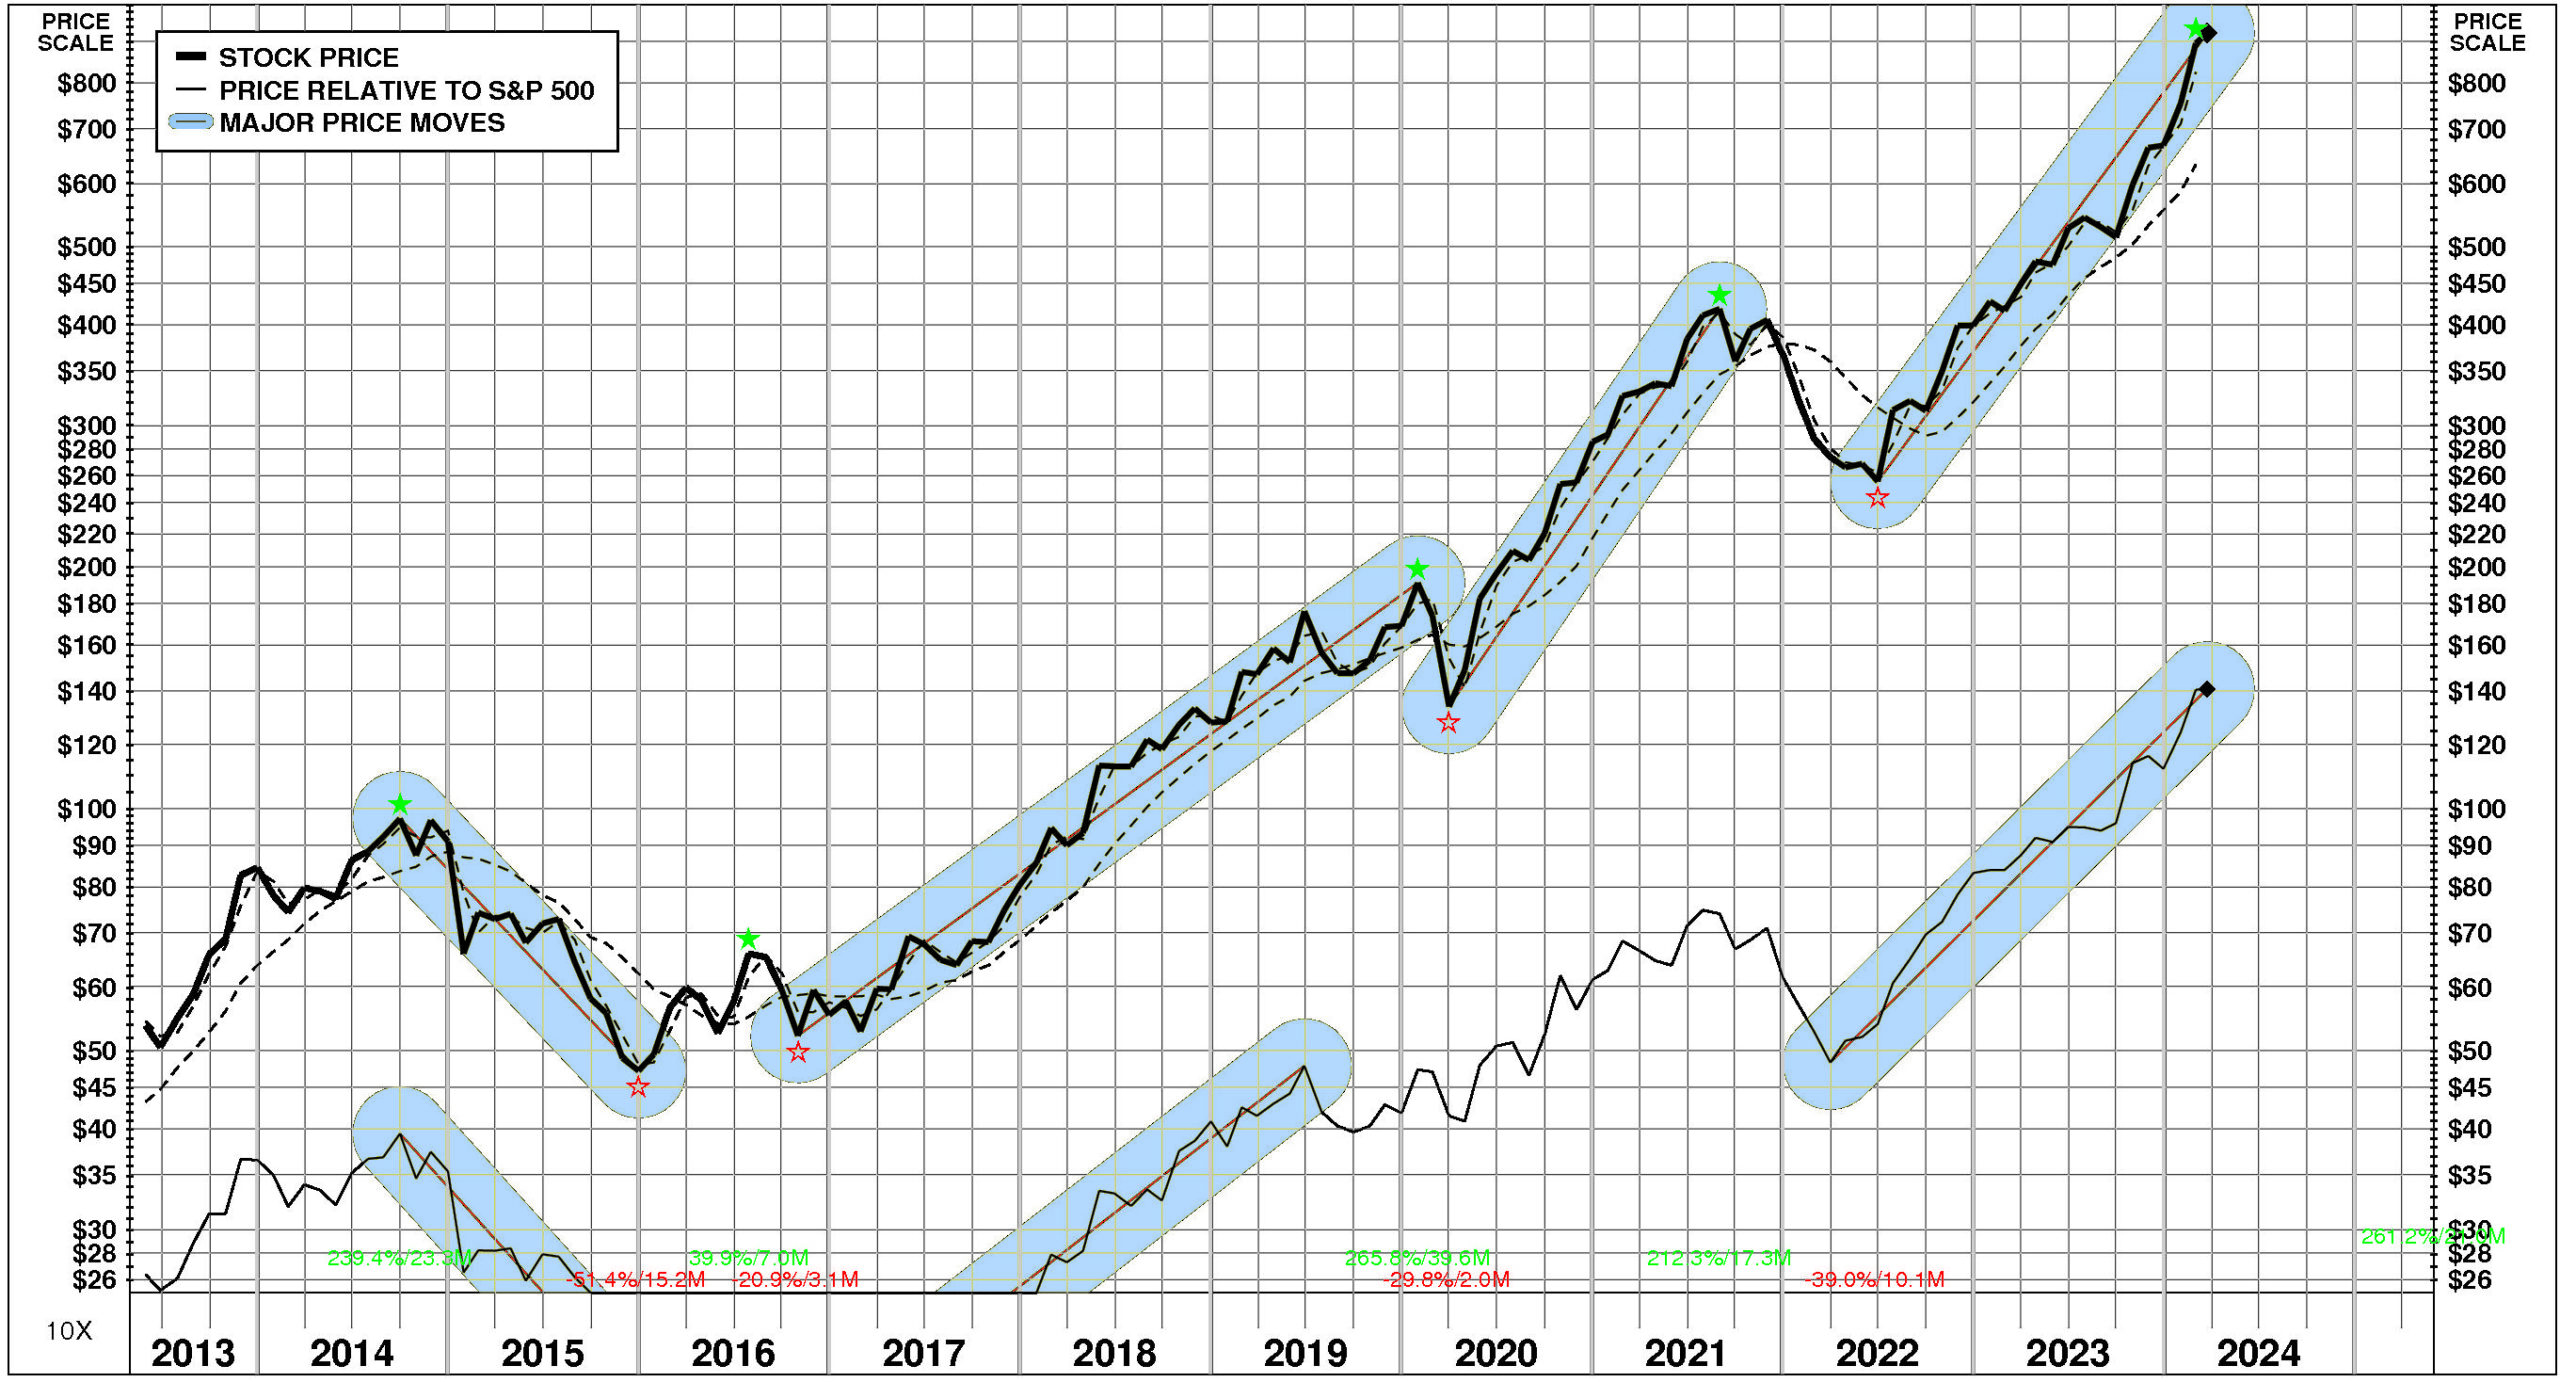
Over the full time period, Deckers Outdoor’s stock price performance has been variable and exceptional. Between May, 2013 and March, 2024, Deckers Outdoor’s stock price rose +1618%; relative to the market, this was a +435% gain. Significant price moves during the period: 1) June, 2022 – March, 2024: +261%; 2) March, 2020 – August, 2021: +212%; 3) October, 2016 – January, 2020: +266%; and 4) September, 2014 – December, 2015: -51%.
TOTAL INVESTMENT RETURNS
Current annual total return performance of 115.1% is upper quartile relative to the S&P 500 Composite.
In addition to being upper quartile relative to S&P 500 Composite, current annual total return performance through February, 2024 of 115.1% is upper quartile relative to Deckers Outdoor Corp Peer Group.
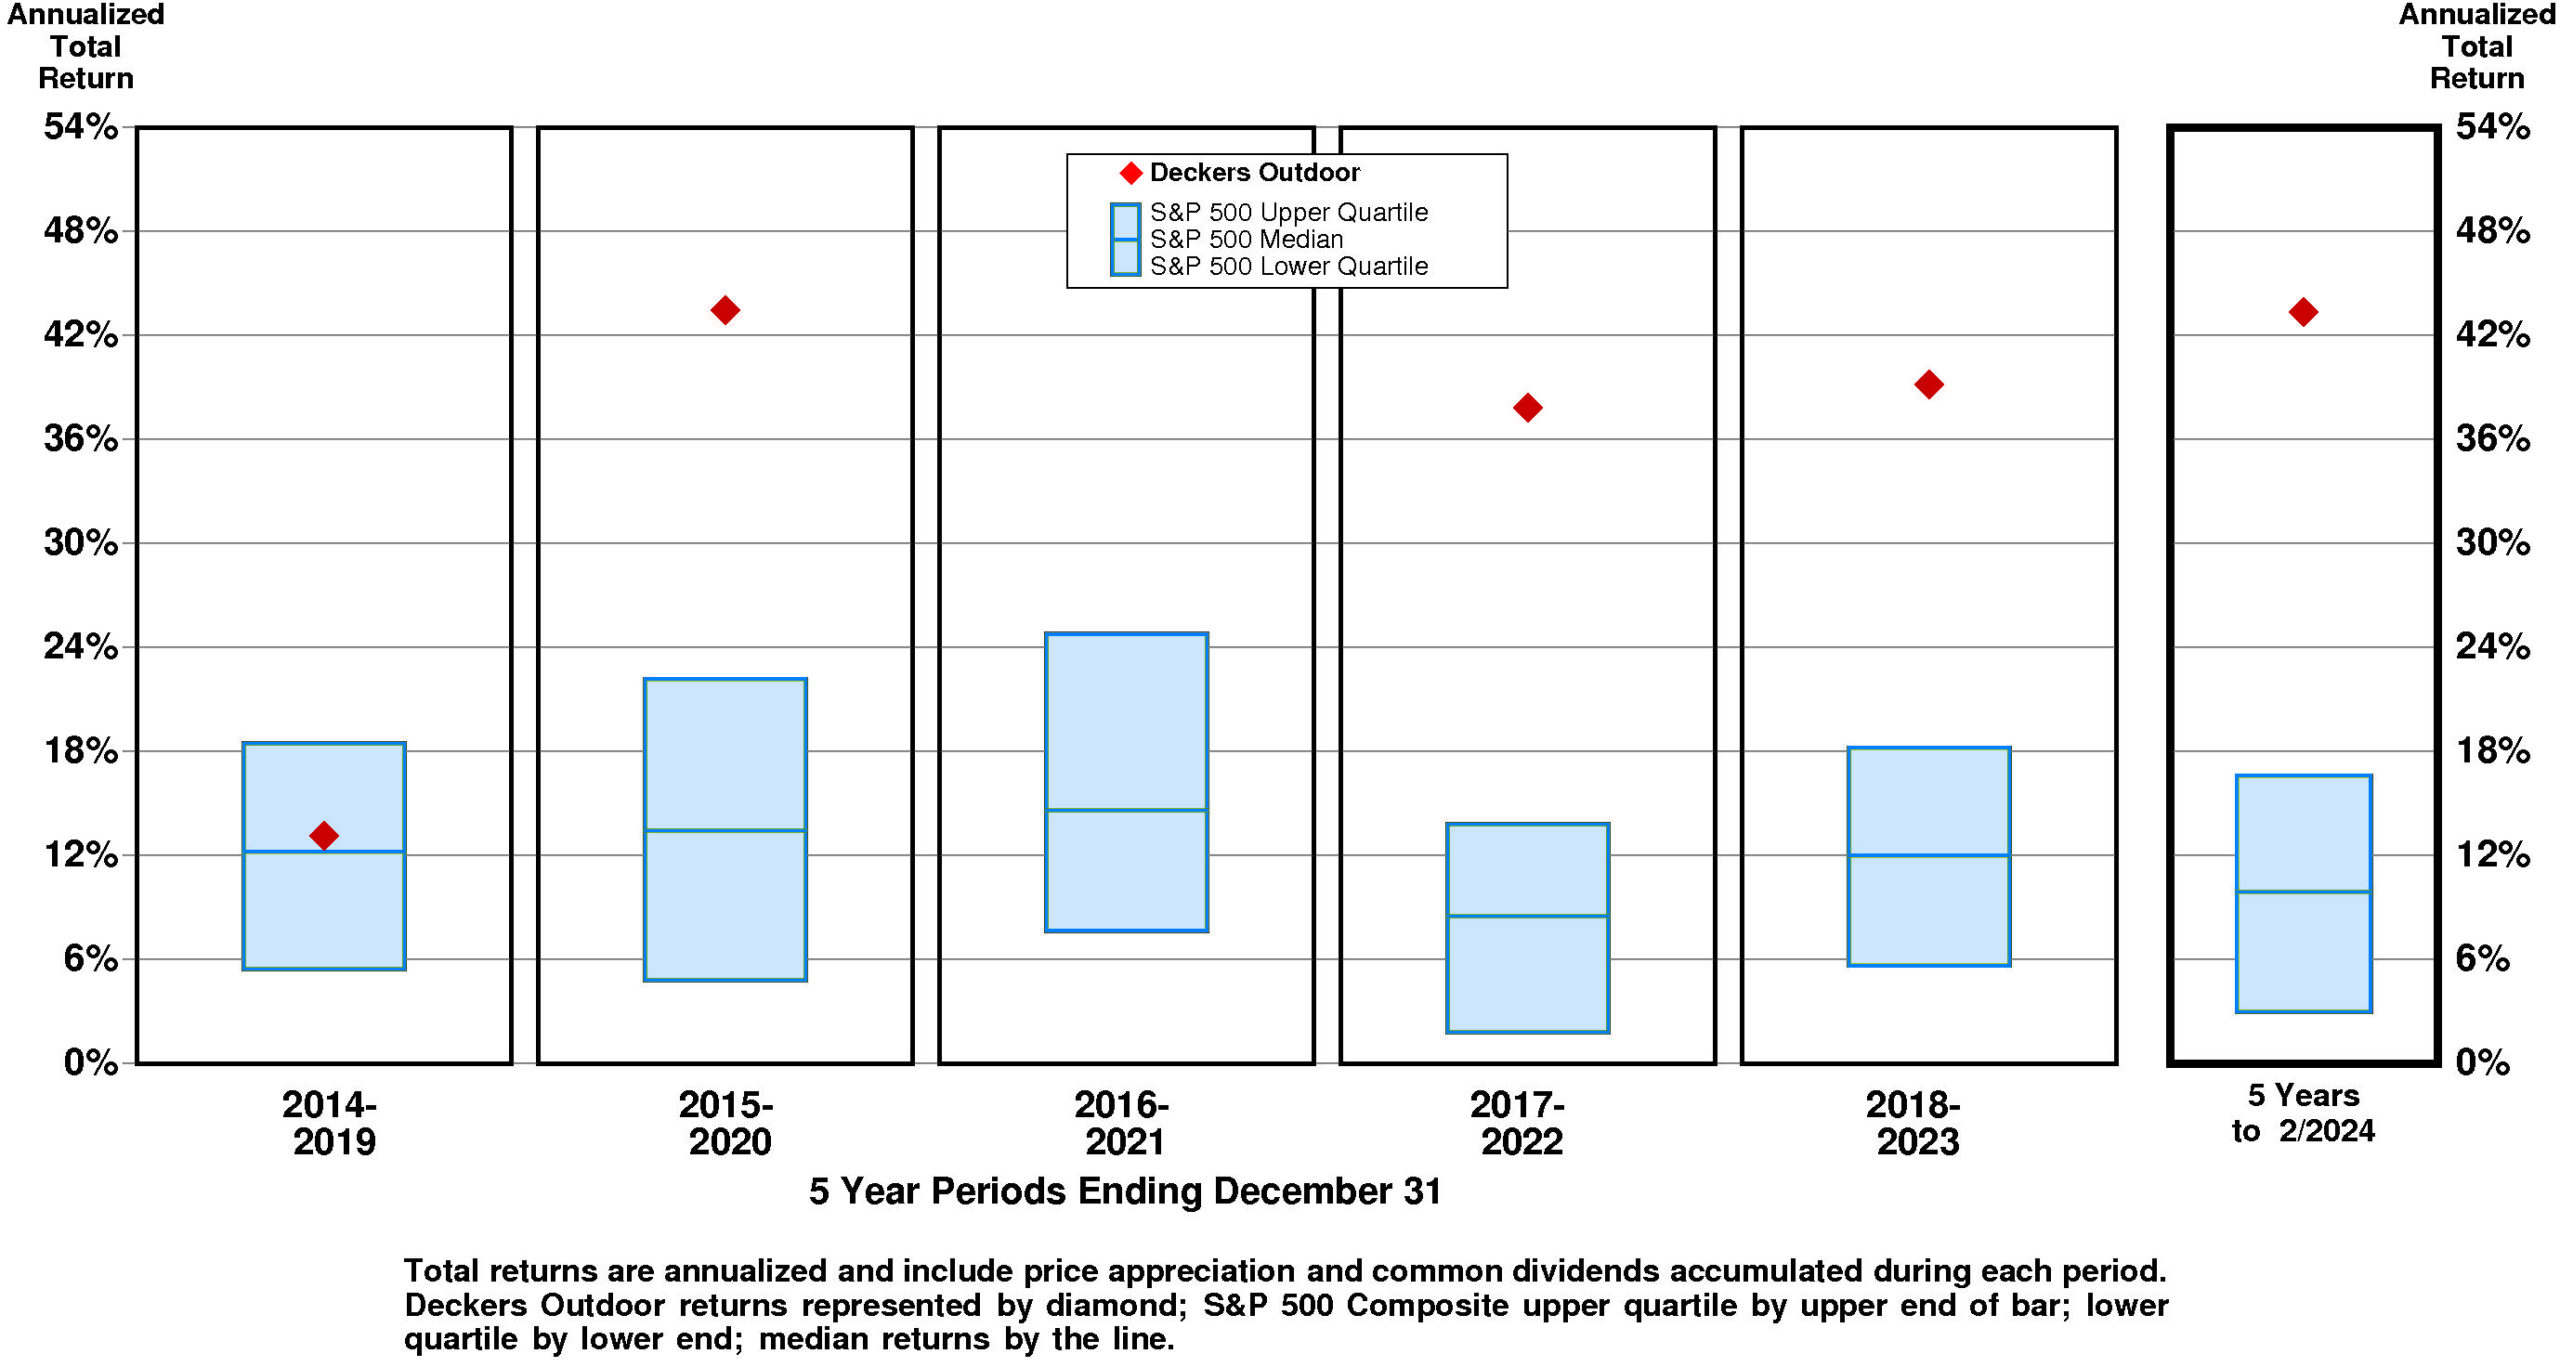
Current 5-year total return performance of 43.4% is upper quartile relative to the S&P 500 Composite.
Through February, 2024, with upper quartile current 5-year total return of 43.4% relative to S&P 500 Composite, Deckers Outdoor’s total return performance is upper quartile relative to Deckers Outdoor Corp Peer Group.
VALUATION BENCHMARKS
Relative to S&P 500 Composite, DECK’s overall valuation is quite high. The highest factor, the ratio of enterprise value/assets, is upper quartile. Price/equity ratio is upper quartile. Ratio of enterprise value/revenue is near the upper quartile. Price/earnings ratio is above median. The lowest factor, the ratio of enterprise value/earnings before interest and taxes, is above median.
Relative to Deckers Outdoor Peer Group, DECK’s overall valuation is quite high. The highest factor, the ratio of enterprise value/revenue, is upper quartile. Price/equity ratio is upper quartile. Ratio of enterprise value/assets is upper quartile. Ratio of enterprise value/earnings before interest and taxes is at the upper quartile. The lowest factor, the price/earnings ratio, is at the upper quartile.
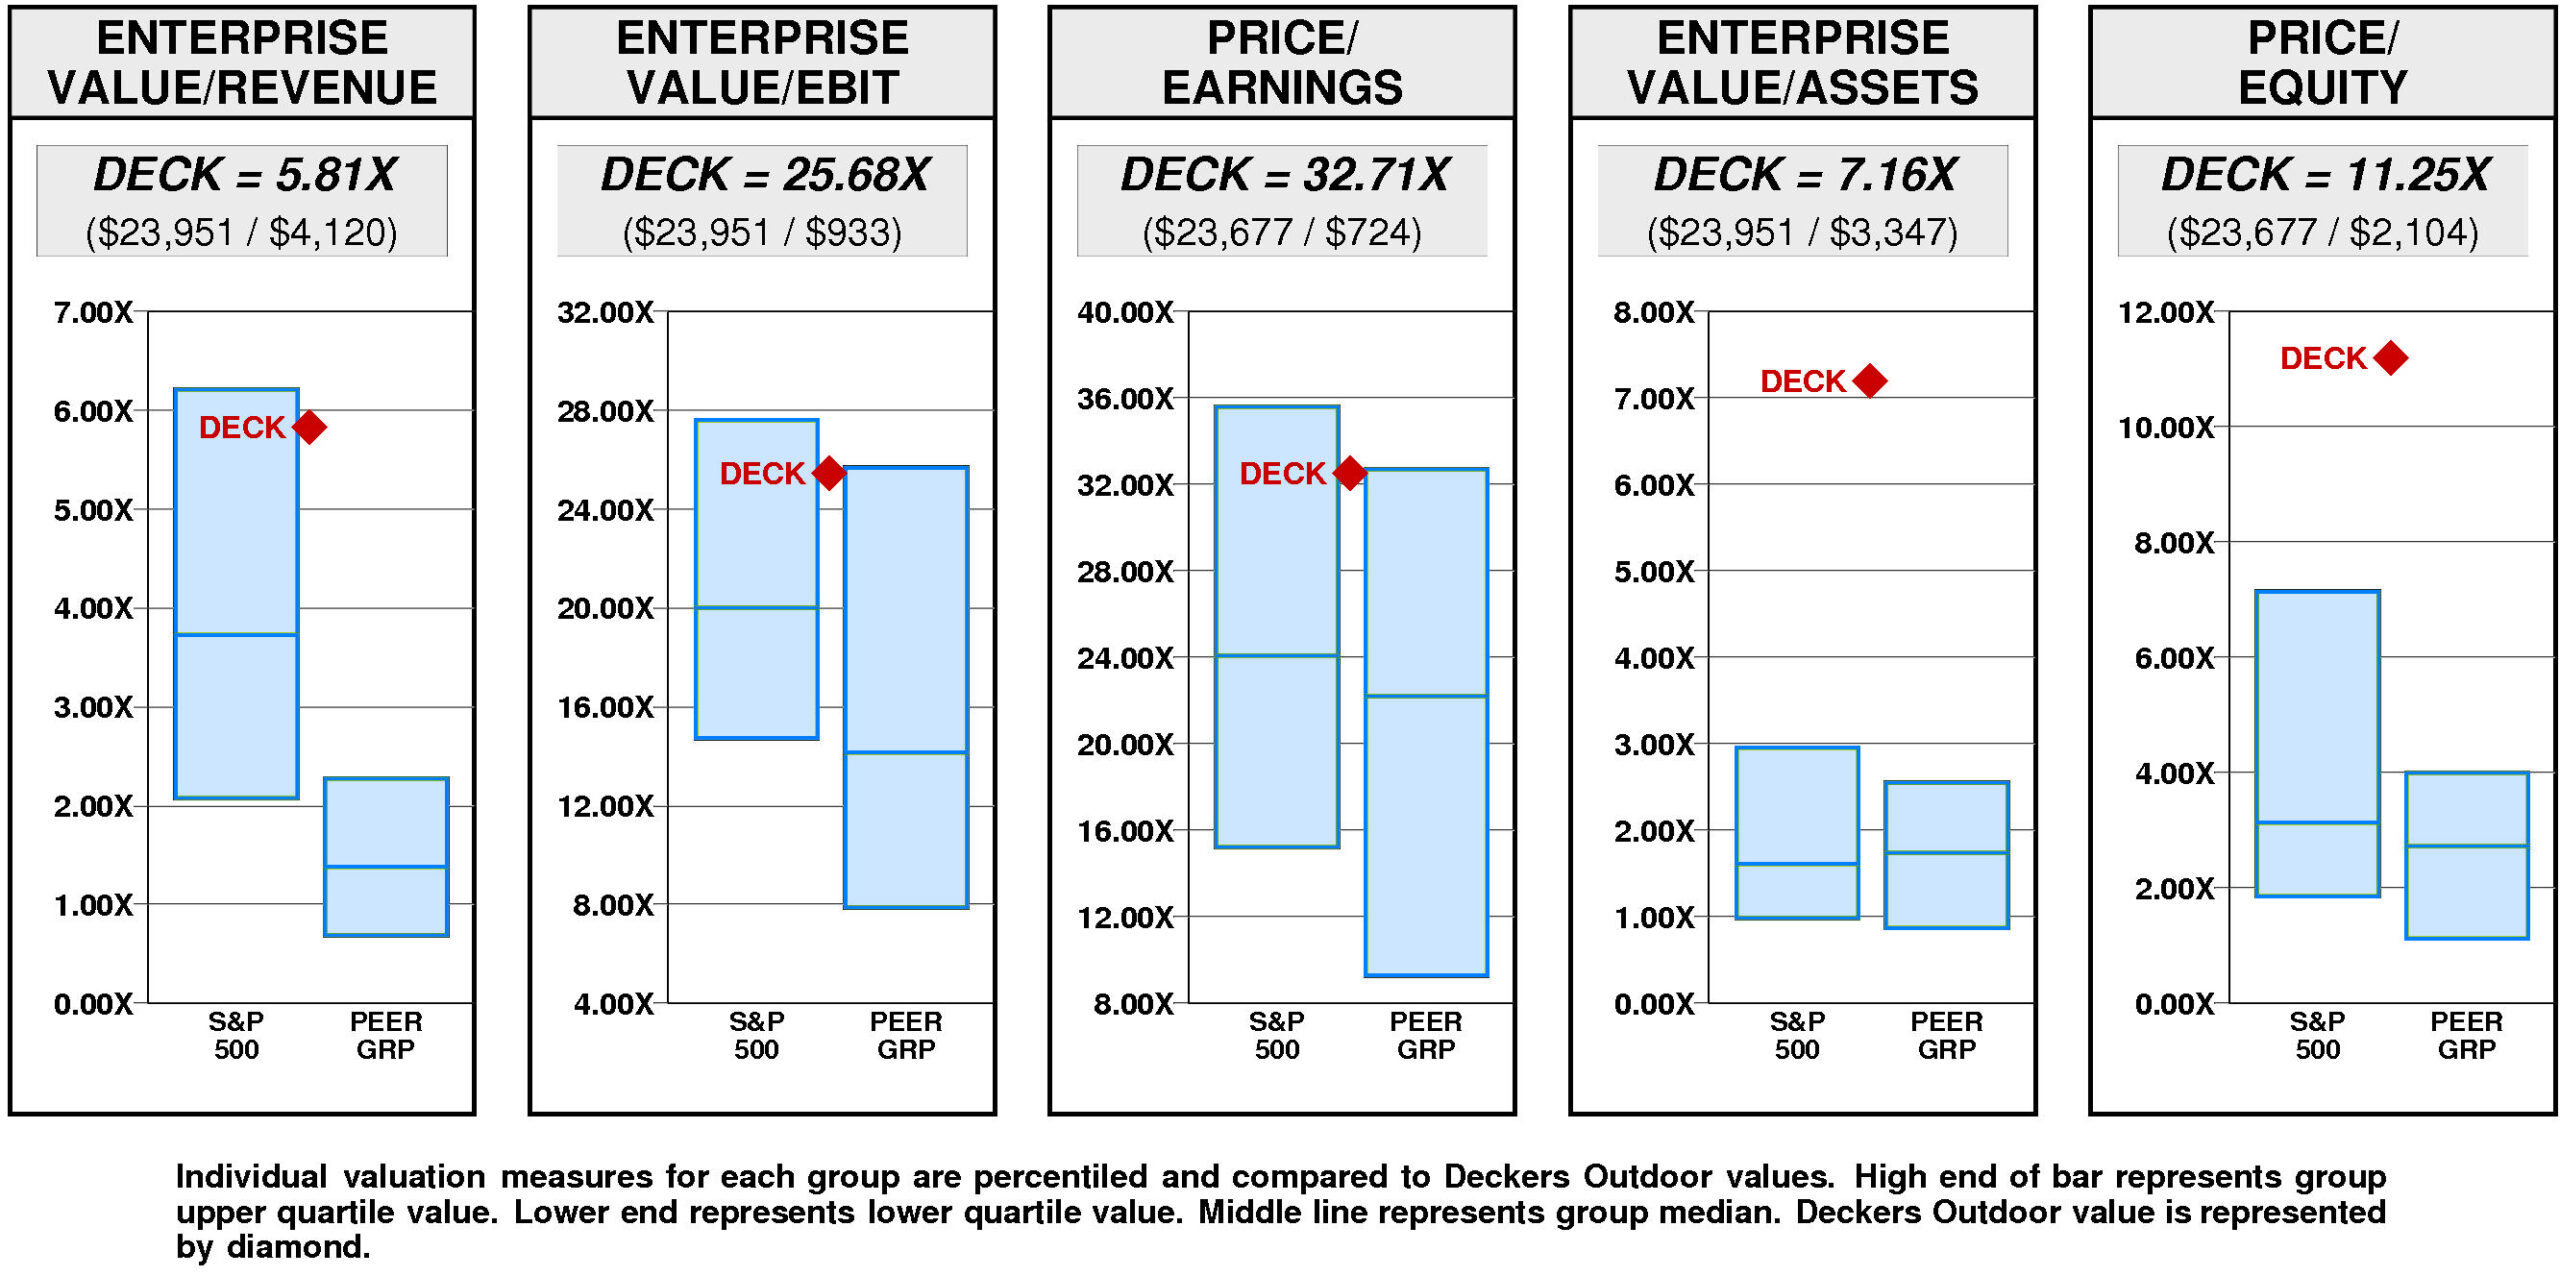
Deckers Outdoor has a major value gap compared to the median valuation. For DECK to achieve median valuation, its current ratio of enterprise value/revenue would have to fall from the current level of 5.81X to 1.38X. If DECK’s ratio of enterprise value/revenue were to fall to 1.38X, its stock price would be lower by $-711 to $211.
For DECK to fall to lower quartile valuation relative to the Deckers Outdoor Peer Group, its current ratio of enterprise value/revenue would have to fall from the current level of 5.81X to 0.69X. If DECK’s ratio of enterprise value/revenue were to fall to 0.69X, its stock price would decline by $-822 from the current level of $922.
VALUE TARGETS
With future capital returns forecasted to exceed the cost of capital, DECK is expected to continue to be a major Value Builder.
Deckers Outdoor’s current Price Target of $769 represents a -17% change from the current price of $922.44.
This low appreciation potential results in an appreciation score of 27 (73% of the universe has greater appreciation potential.)
Notwithstanding this low Appreciation Score of 27, the high Power Rating of 99 results in an Value Trend Rating of B.
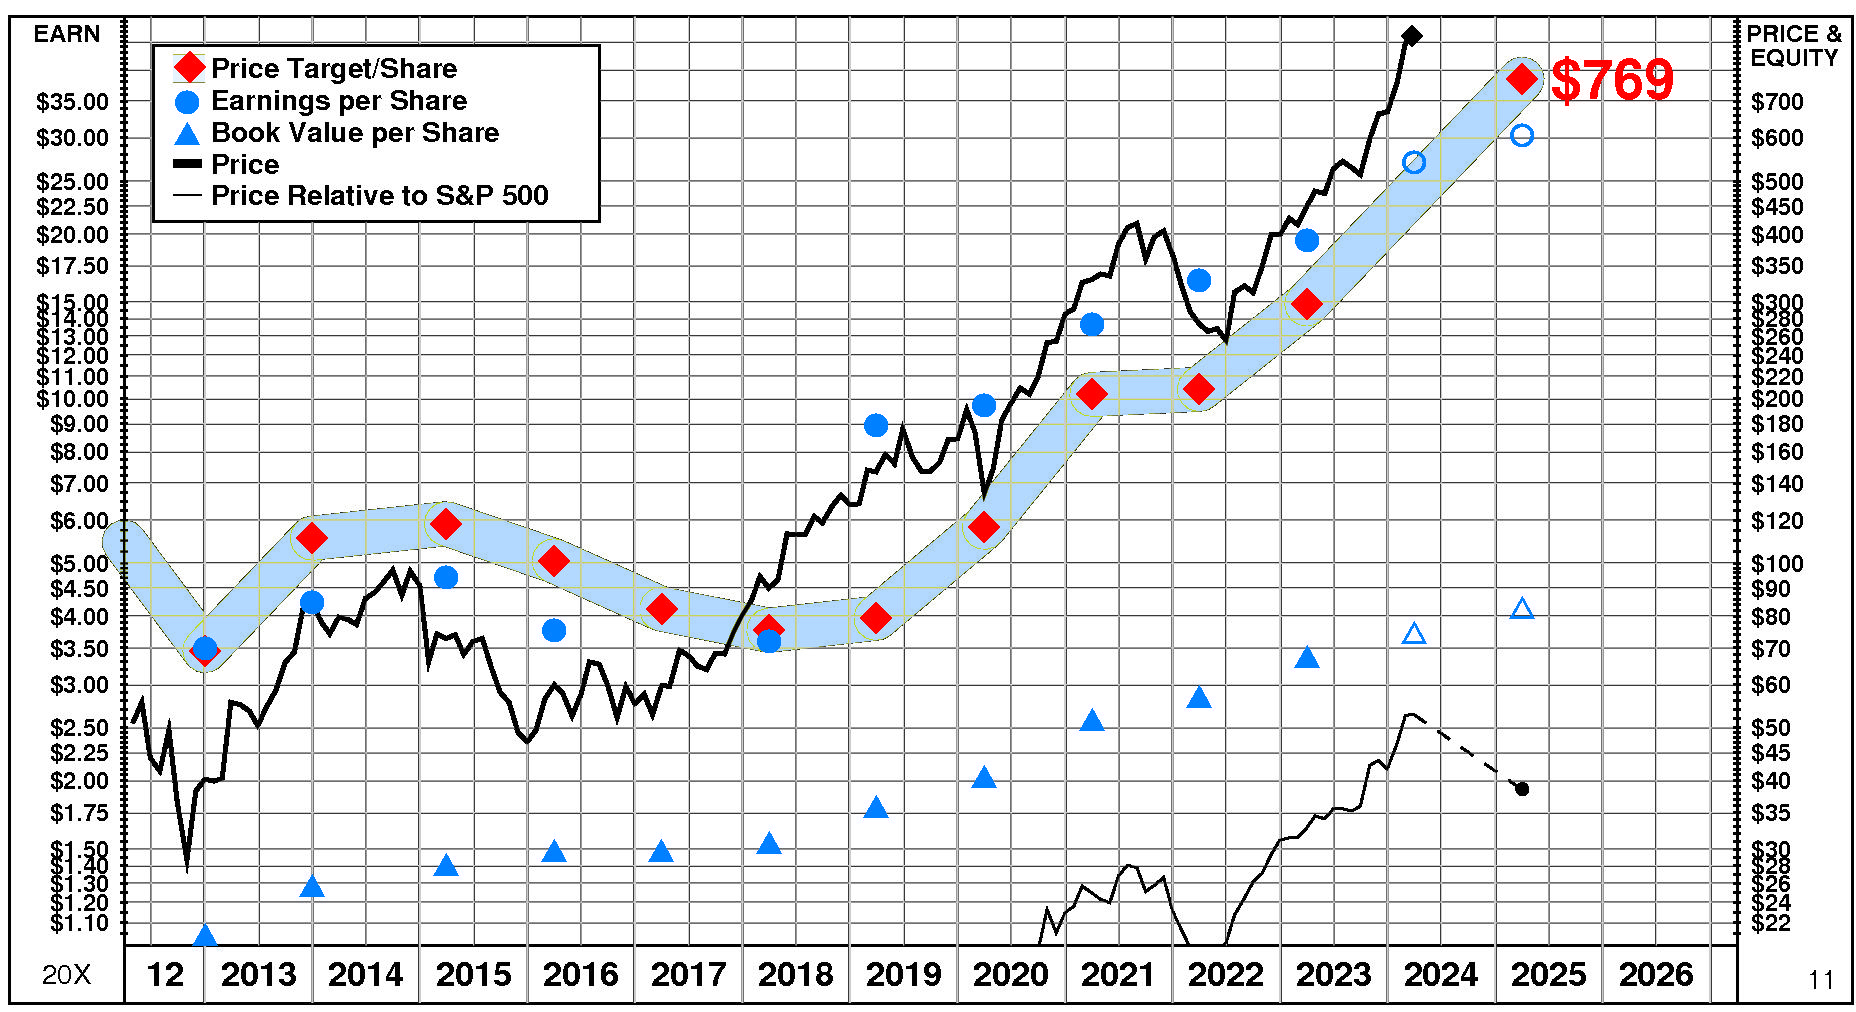
Deckers Outdoor’s current Price Target is $769 (+158% from the 2023 Target of $298 but -17% from the 03/22/24 price of $922.44). This dramatic rise in the Target is the result of a +23% increase in the equity base and a +109% increase in the price/equity multiple. Each of the Value Drivers contributed to this increase in the price/equity multiple. The forecasted increase in return on equity has a very large positive impact on the multiple. The forecasted increase in growth also has a slight positive impact and the decline in cost of equity did as well.
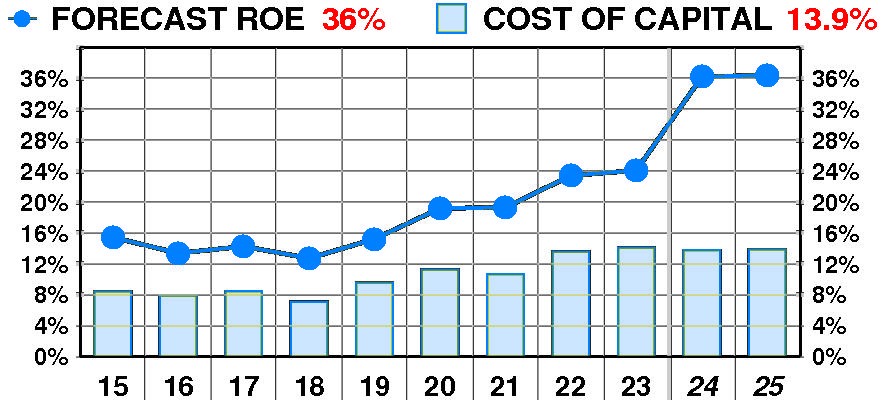
PTR’s return on equity forecast is 36.4% — substantially above our recent forecasts. Forecasted return on equity enjoyed a dramatic, variable increase between 2015 and 2023. The current forecast is significantly above the 2018 low of 13%.
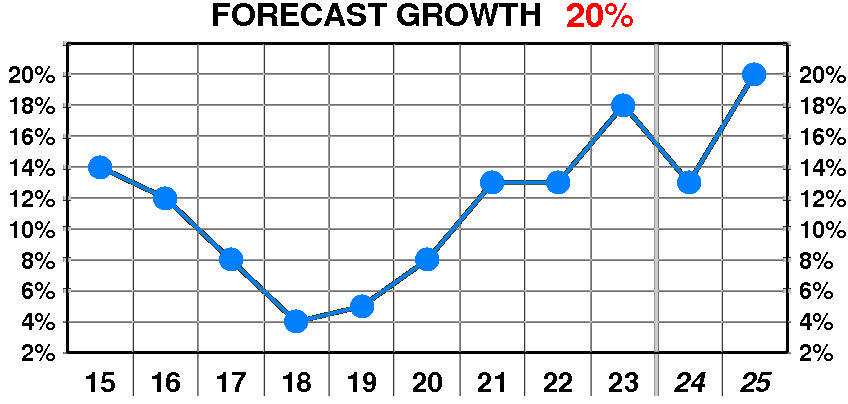
PTR’s growth forecast is 20.0% — in line with our recent forecasts. Forecasted growth enjoyed a dramatic, erratic increase between 2015 and 2023. The current forecast is significantly above the 2018 low of 4%.
PTR’s cost of equity forecast is 13.9% — in line with recent levels. Forecasted cost of equity suffered a dramatic, variable increase between 2015 and 2023. The current forecast is well above the 2018 low of 7.1%.
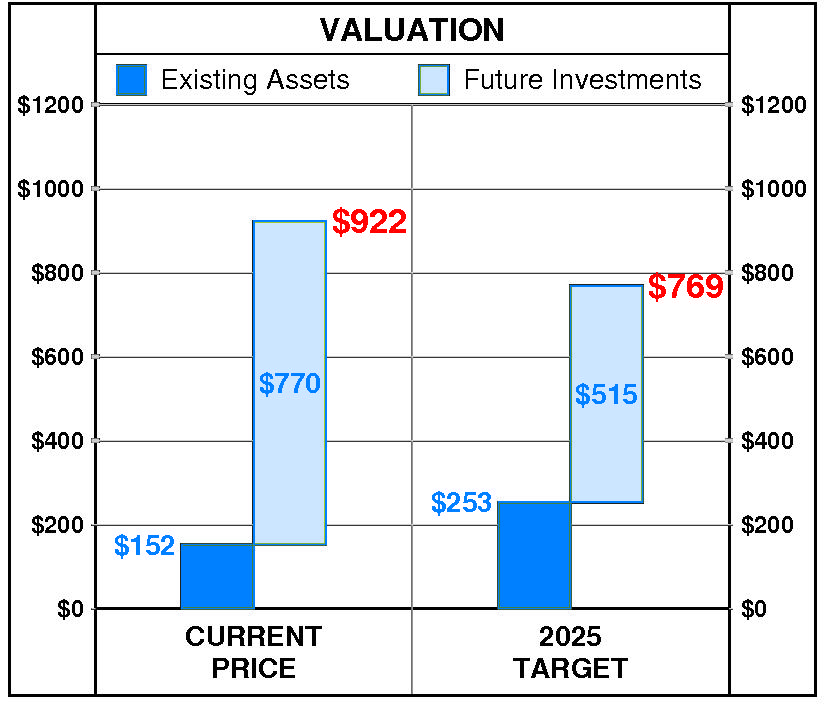
At Deckers Outdoor’s current price of $922.44, investors are placing a positive value of $770 on its future investments. This view is consistent with the company’s most recent performance that reflected a growth rate of 18.0% per year, and a return on equity of 24.1% versus a cost of equity of 14.1%.
PTR’s 2025 Price Target of $769 is based on these forecasts and reflects an estimated value of existing assets of $253 and a value of future investments of $515.
Be the first to comment