![]()
BUSINESS
MDU Resources Group, Inc. engages in the regulated energy delivery, and construction materials and services businesses in the United States. The company’s Electric segment generates, transmits, and distributes electricity for residential, commercial, industrial, and municipal customers in Montana, North Dakota, South Dakota, and Wyoming, as well as operates 3,500 miles of transmission lines and 4,800 miles of distribution lines. Its Natural Gas Distribution segment distributes natural gas for residential, commercial, and industrial customers in Idaho, Minnesota, Montana, North Dakota, Oregon, South Dakota, Washington, and Wyoming; and offers supply-related value-added services.
INVESTMENT RATING
MDU is expected to continue to be an important Value Builder reflecting capital returns that are forecasted to be above the cost of capital.
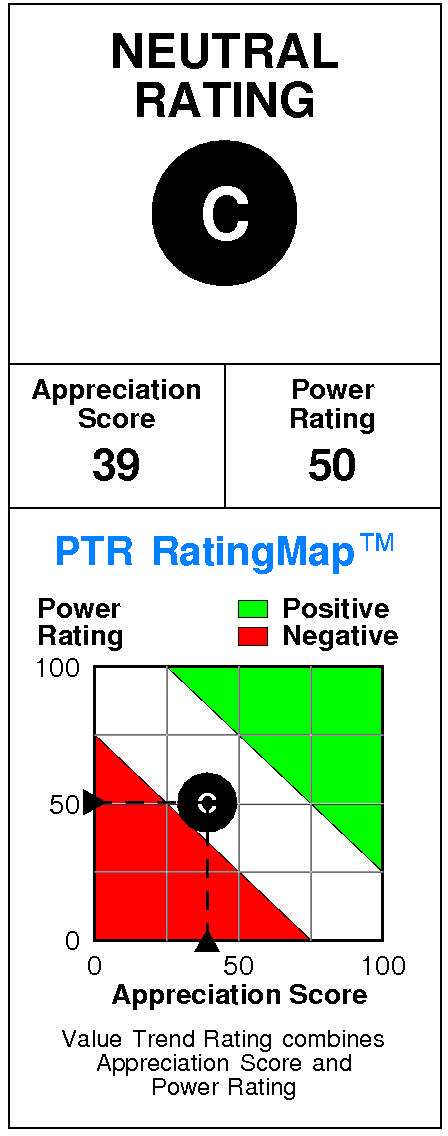
MDU Resources Group has a current Value Trend Rating of C (Low Neutral).
The Value Trend Rating reflects consistent signals from PTR’s two proprietary measures of a stock’s attractiveness. MDU Resources Group has a slightly negative Appreciation Score of 39 and a neutral Power Rating of 50, triggering the Low Neutral Value Trend Rating.
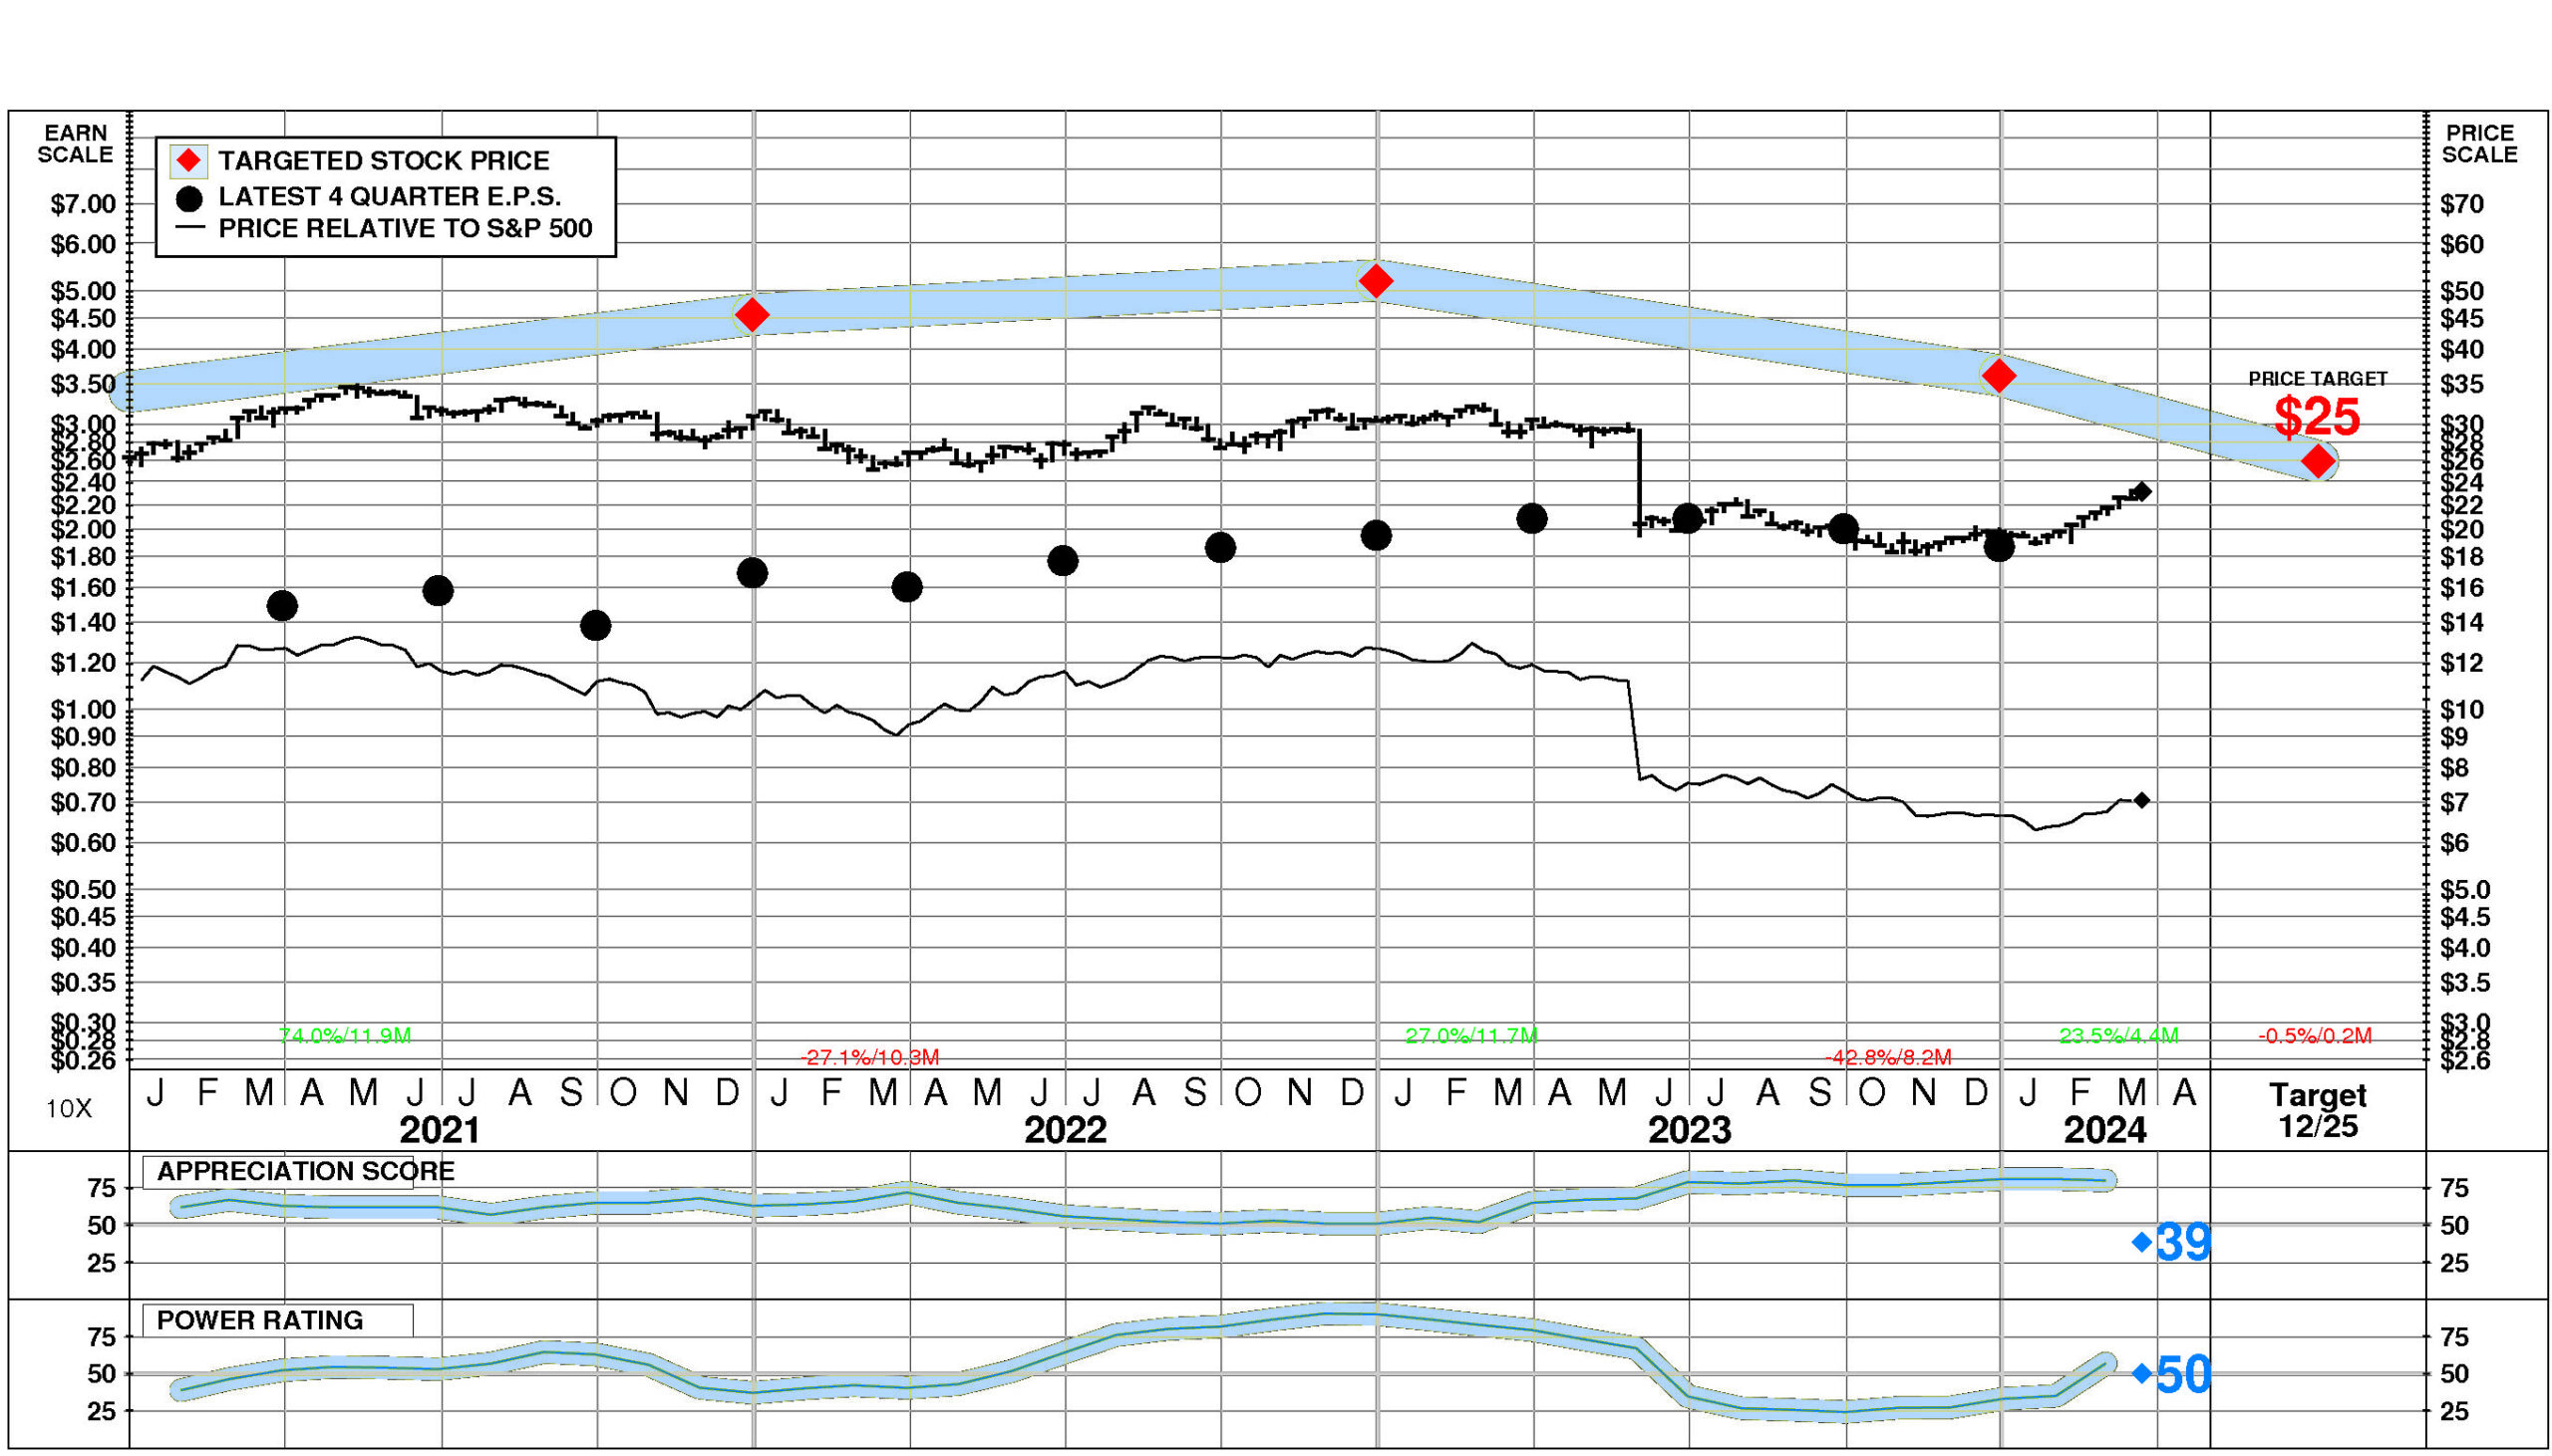
MDU Resources Group’s stock is selling below targeted value. The current stock price of $23.14 compares to targeted value 12 months forward of $26.
This moderately low appreciation potential results in an appreciation score of 39 (61% of the universe has greater appreciation potential.)
MDU Resources Group has a Power Rating of 50. (This neutral Power Rating indicates that MDU’s chances of enjoying attractive investment performance over the near to intermediate term are only average.)
Contributing to this neutral Power Rating: the Construction – Special Trade comparison group is in a strong phase currently. Offsetting factors are recent price action has been neutral; and the trend in MDU’s earnings estimates has been unfavorable in recent months.
INVESTMENT PROFILE
MDU’s financial strength is average. Financial strength rating is 53.
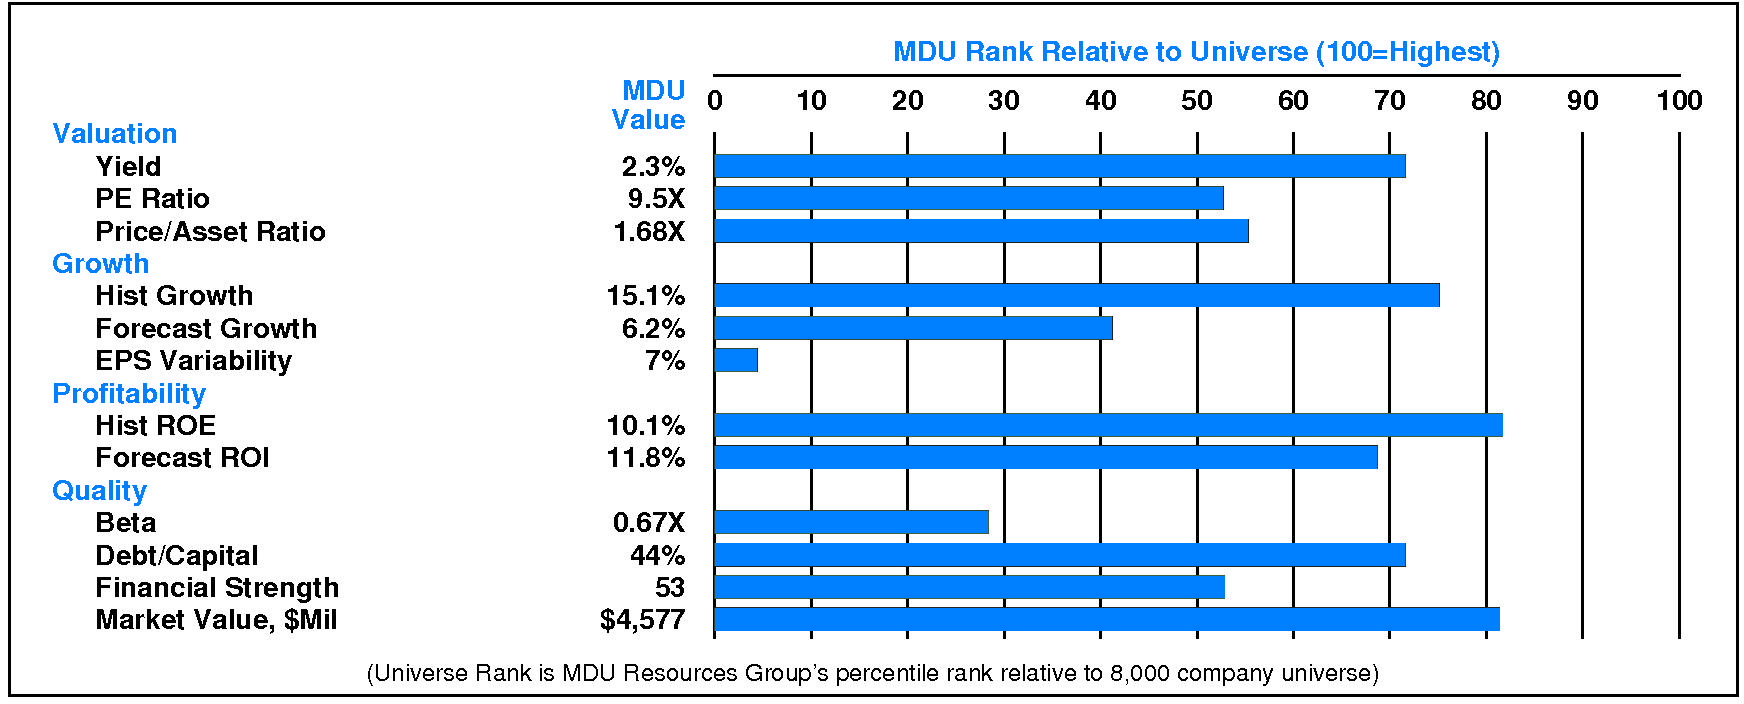
Relative to the S&P 500 Composite, MDU Resources Group Inc. has moderate Value characteristics; its appeal is likely to be to Income-oriented investors; the perception is that MDU is lower risk. Low expected growth is a relative weakness for MDU. MDU’s valuation is low: moderate dividend yield, low P/E ratio, and low price/book ratio. MDU has unusually low market capitalization.
CURRENT SIGNALS
MDU Resources Group’s current operations are strong. Return on equity is rising, reflecting: widening pretax margins; rising tax keep rate; and rising leverage.
MDU Resources Group’s current technical position is very strong. The stock price is in a 4.4 month up move. The stock has appreciated 23.5% from its prior low. The stock price is above its 200 day moving average which is in an uptrend.
ALERTS
Important positive changes in MDU Resources Group Inc. (NYSE: MDU) investment behavior have recently occurred: positive upside/downside volume developed.
The stock is currently rated C.
MDU Resources Group Inc. (NYSE: MDU) stock closed at $23.14 on 3/21/24 after an increase of 1.7%. However, this advance was accompanied by below average trading volume at 81% of normal. The stock has performed in line with the market over the last nine months and has risen 2.9% during the last week.
CASH FLOW
In 2023, MDU Resources Group experienced a decrease in cash of -$3.5 million (-4%). Sources of cash were very modestly less than uses. Cash generated from 2023 EBITDA totaled +$639.6 million. Non-operating sources contributed +$238.3 million (+37% of EBITDA). Cash taxes consumed -$232.2 million (-36% of EBITDA). Withdrawal of investment from the business totaled +$1,377.7 million (+215% of EBITDA). On a net basis, debt investors withdrew -$864.6 million (-135% of EBITDA) while equity investors received -$1,162.3 million (-182% of EBITDA).
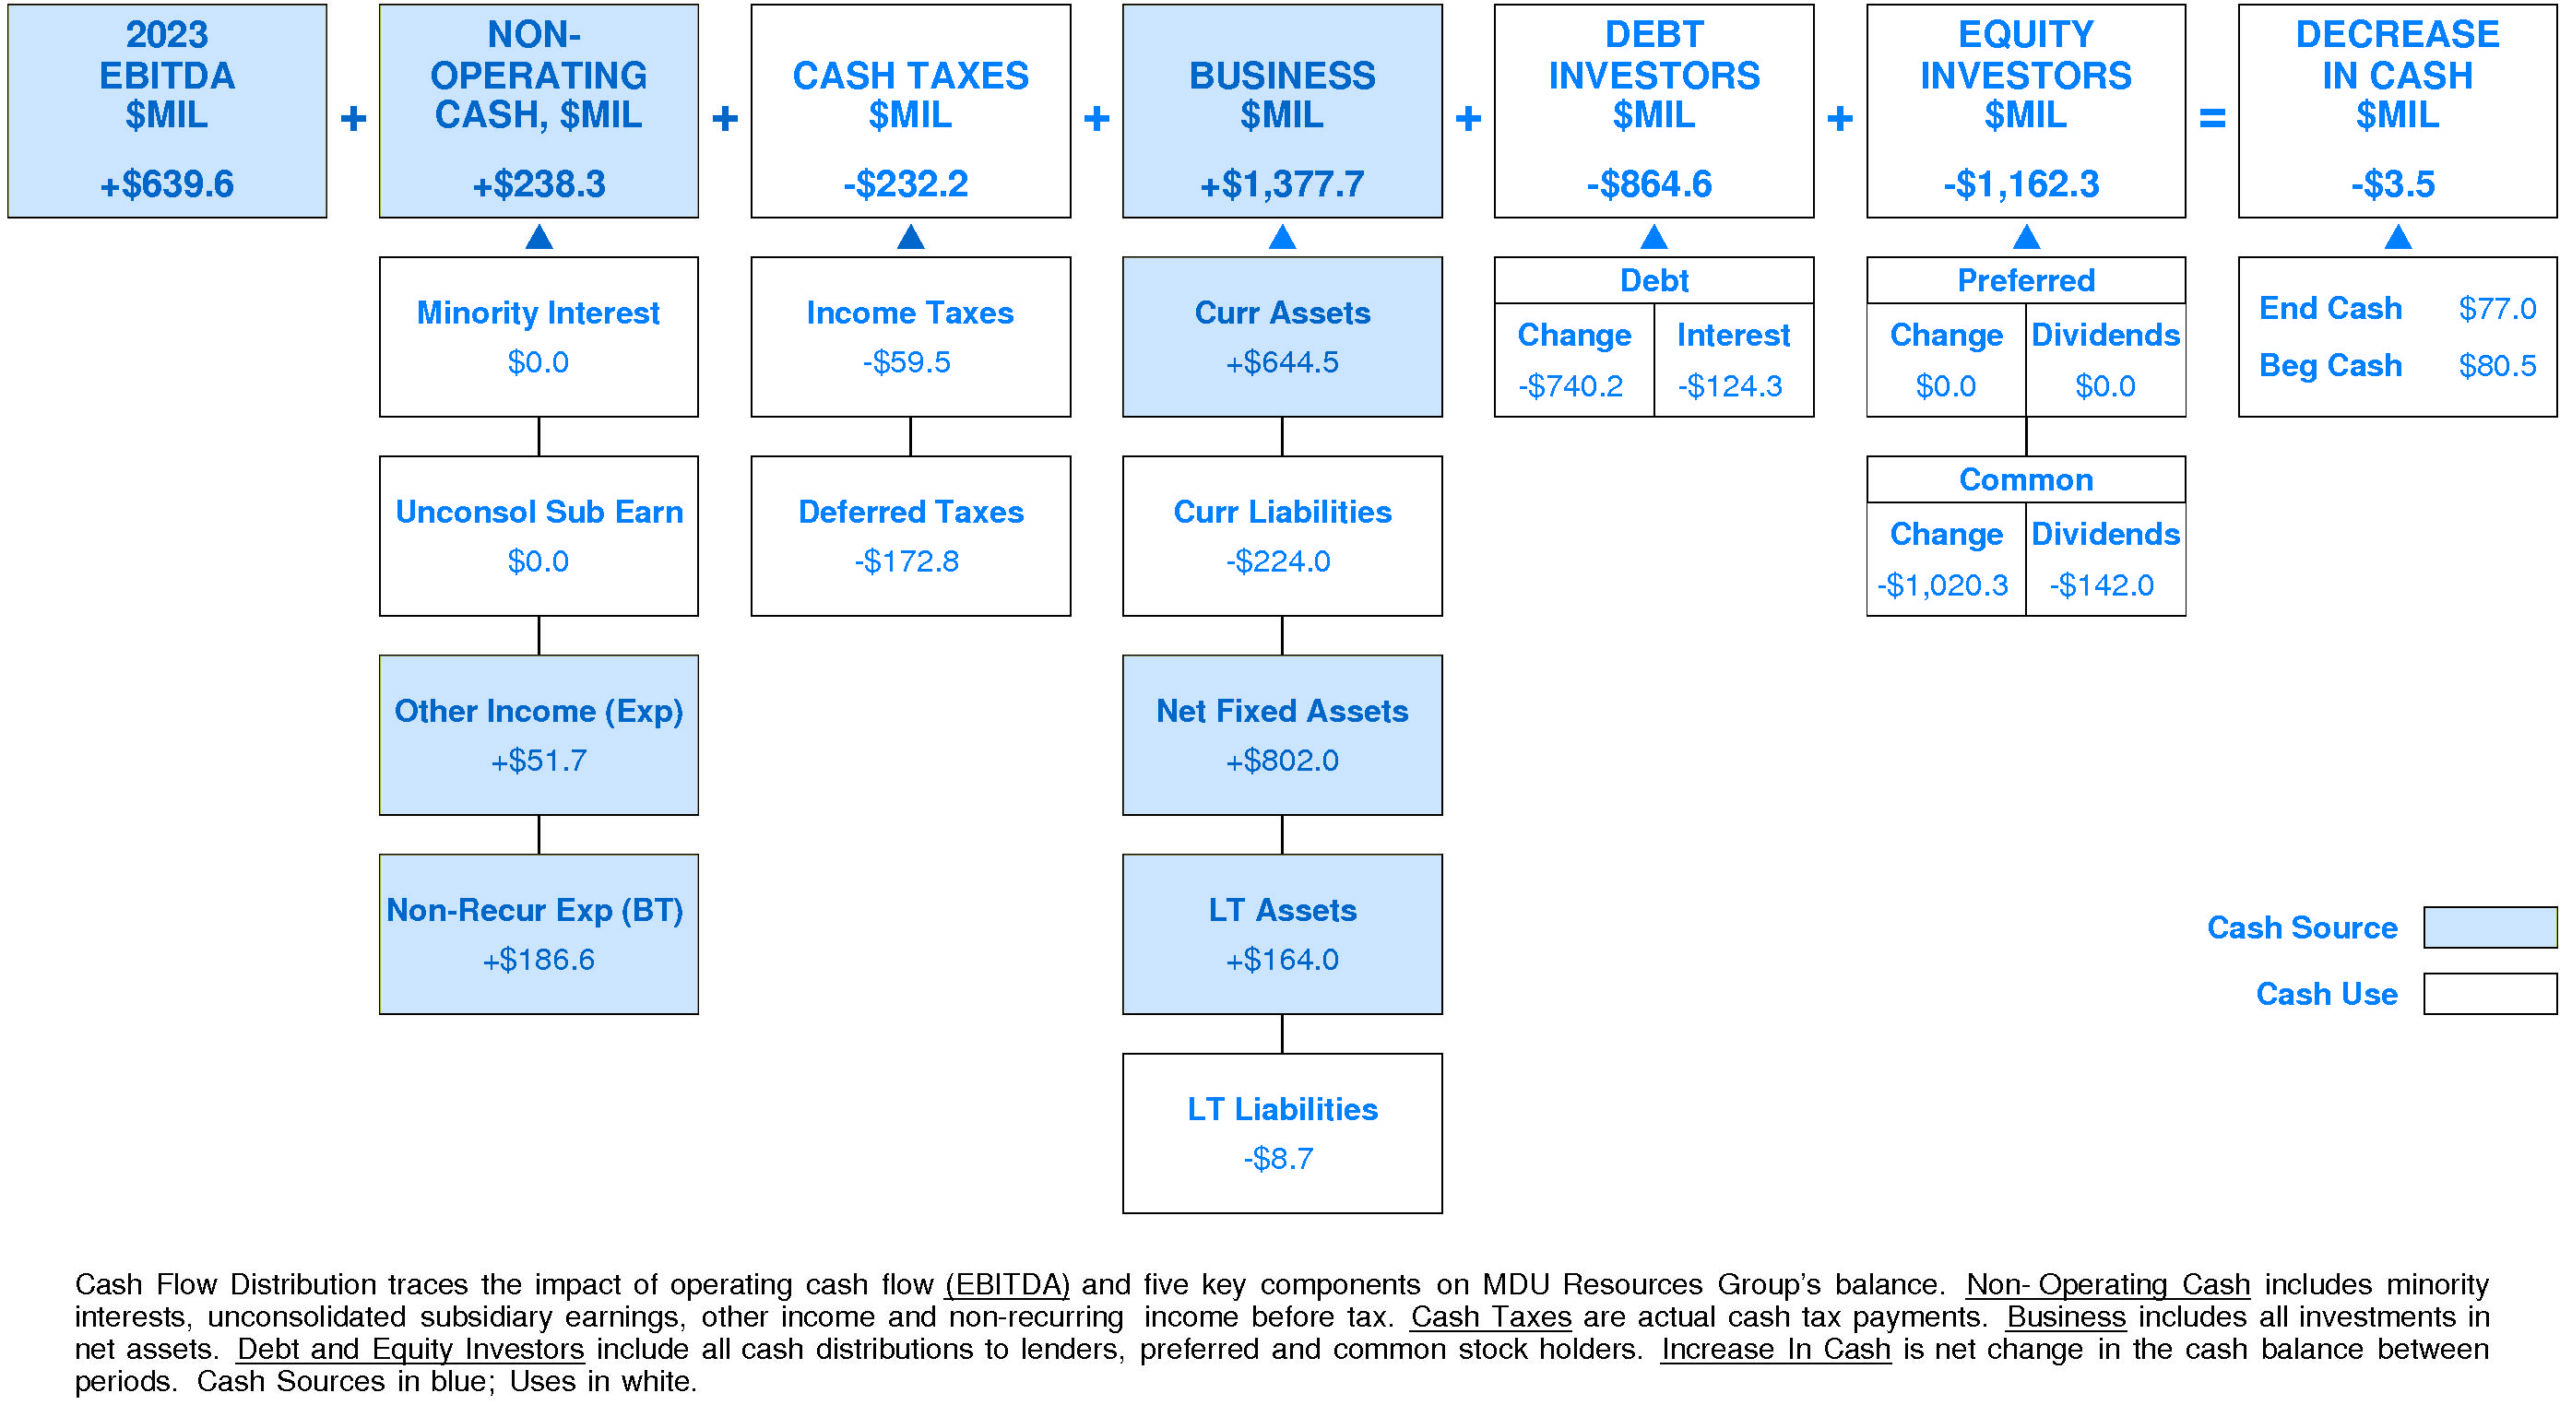
MDU Resources Group’s Non-operating Income, %EBITDA has exhibited a volatile overall uptrend over the period. This improvement was accompanied by stability for the Mdu Resources Group Peer Group. In most years, MDU Resources Group was in the top quartile. Currently, MDU Resources Group is upper quartile at +37% of EBITDA (+$238.3 million).
MDU Resources Group’s Cash Taxes, %EBITDA has exhibited a volatile overall uptrend over the period. This improvement was accompanied by stability for the Mdu Resources Group Peer Group. (Since 2021 Cash Taxes, %EBITDA has experienced a very sharp decline.) In most years, MDU Resources Group was in the third quartile and top quartile. Currently, MDU Resources Group is lower quartile at -36% of EBITDA (-$232.2 million).
MDU Resources Group’s Business Re-investment, %EBITDA has exhibited little to no overall change over the period. This stability was accompanied by an uptrend for the Mdu Resources Group Peer Group. (Since 2021 Business Re-investment, %EBITDA has experienced very sharp improvement.) In most years, MDU Resources Group was in the third quartile and top quartile. Currently, MDU Resources Group is upper quartile at +215% of EBITDA (+$1,377.7 million).
MDU Resources Group’s Debt Investors, %EBITDA has experienced a downtrend over the period. This downtrend was accompanied by a similar trend for the Mdu Resources Group Peer Group. (Since 2021 Debt Investors, %EBITDA has accelerated very sharply.) In most years, MDU Resources Group was in the top quartile and lower quartile. Currently, MDU Resources Group is lower quartile at -135% of EBITDA (-$864.6 million).
MDU Resources Group’s Equity Investors, %EBITDA has experienced a downtrend over the period. This downtrend was accompanied by stability for the Mdu Resources Group Peer Group. (Since 2021 Equity Investors, %EBITDA has accelerated very sharply.) In most years, MDU Resources Group was in the lower quartile and top quartile. Currently, MDU Resources Group is lower quartile at -182% of EBITDA (-$1,162.3 million).
MDU Resources Group’s Change in Cash, %EBITDA has exhibited little to no overall change over the period. This stability was accompanied by stability for the Mdu Resources Group Peer Group as well. In most years, MDU Resources Group was in the second quartile and top quartile. Currently, MDU Resources Group is slightly above median at -1% of EBITDA (-$3.5 million).
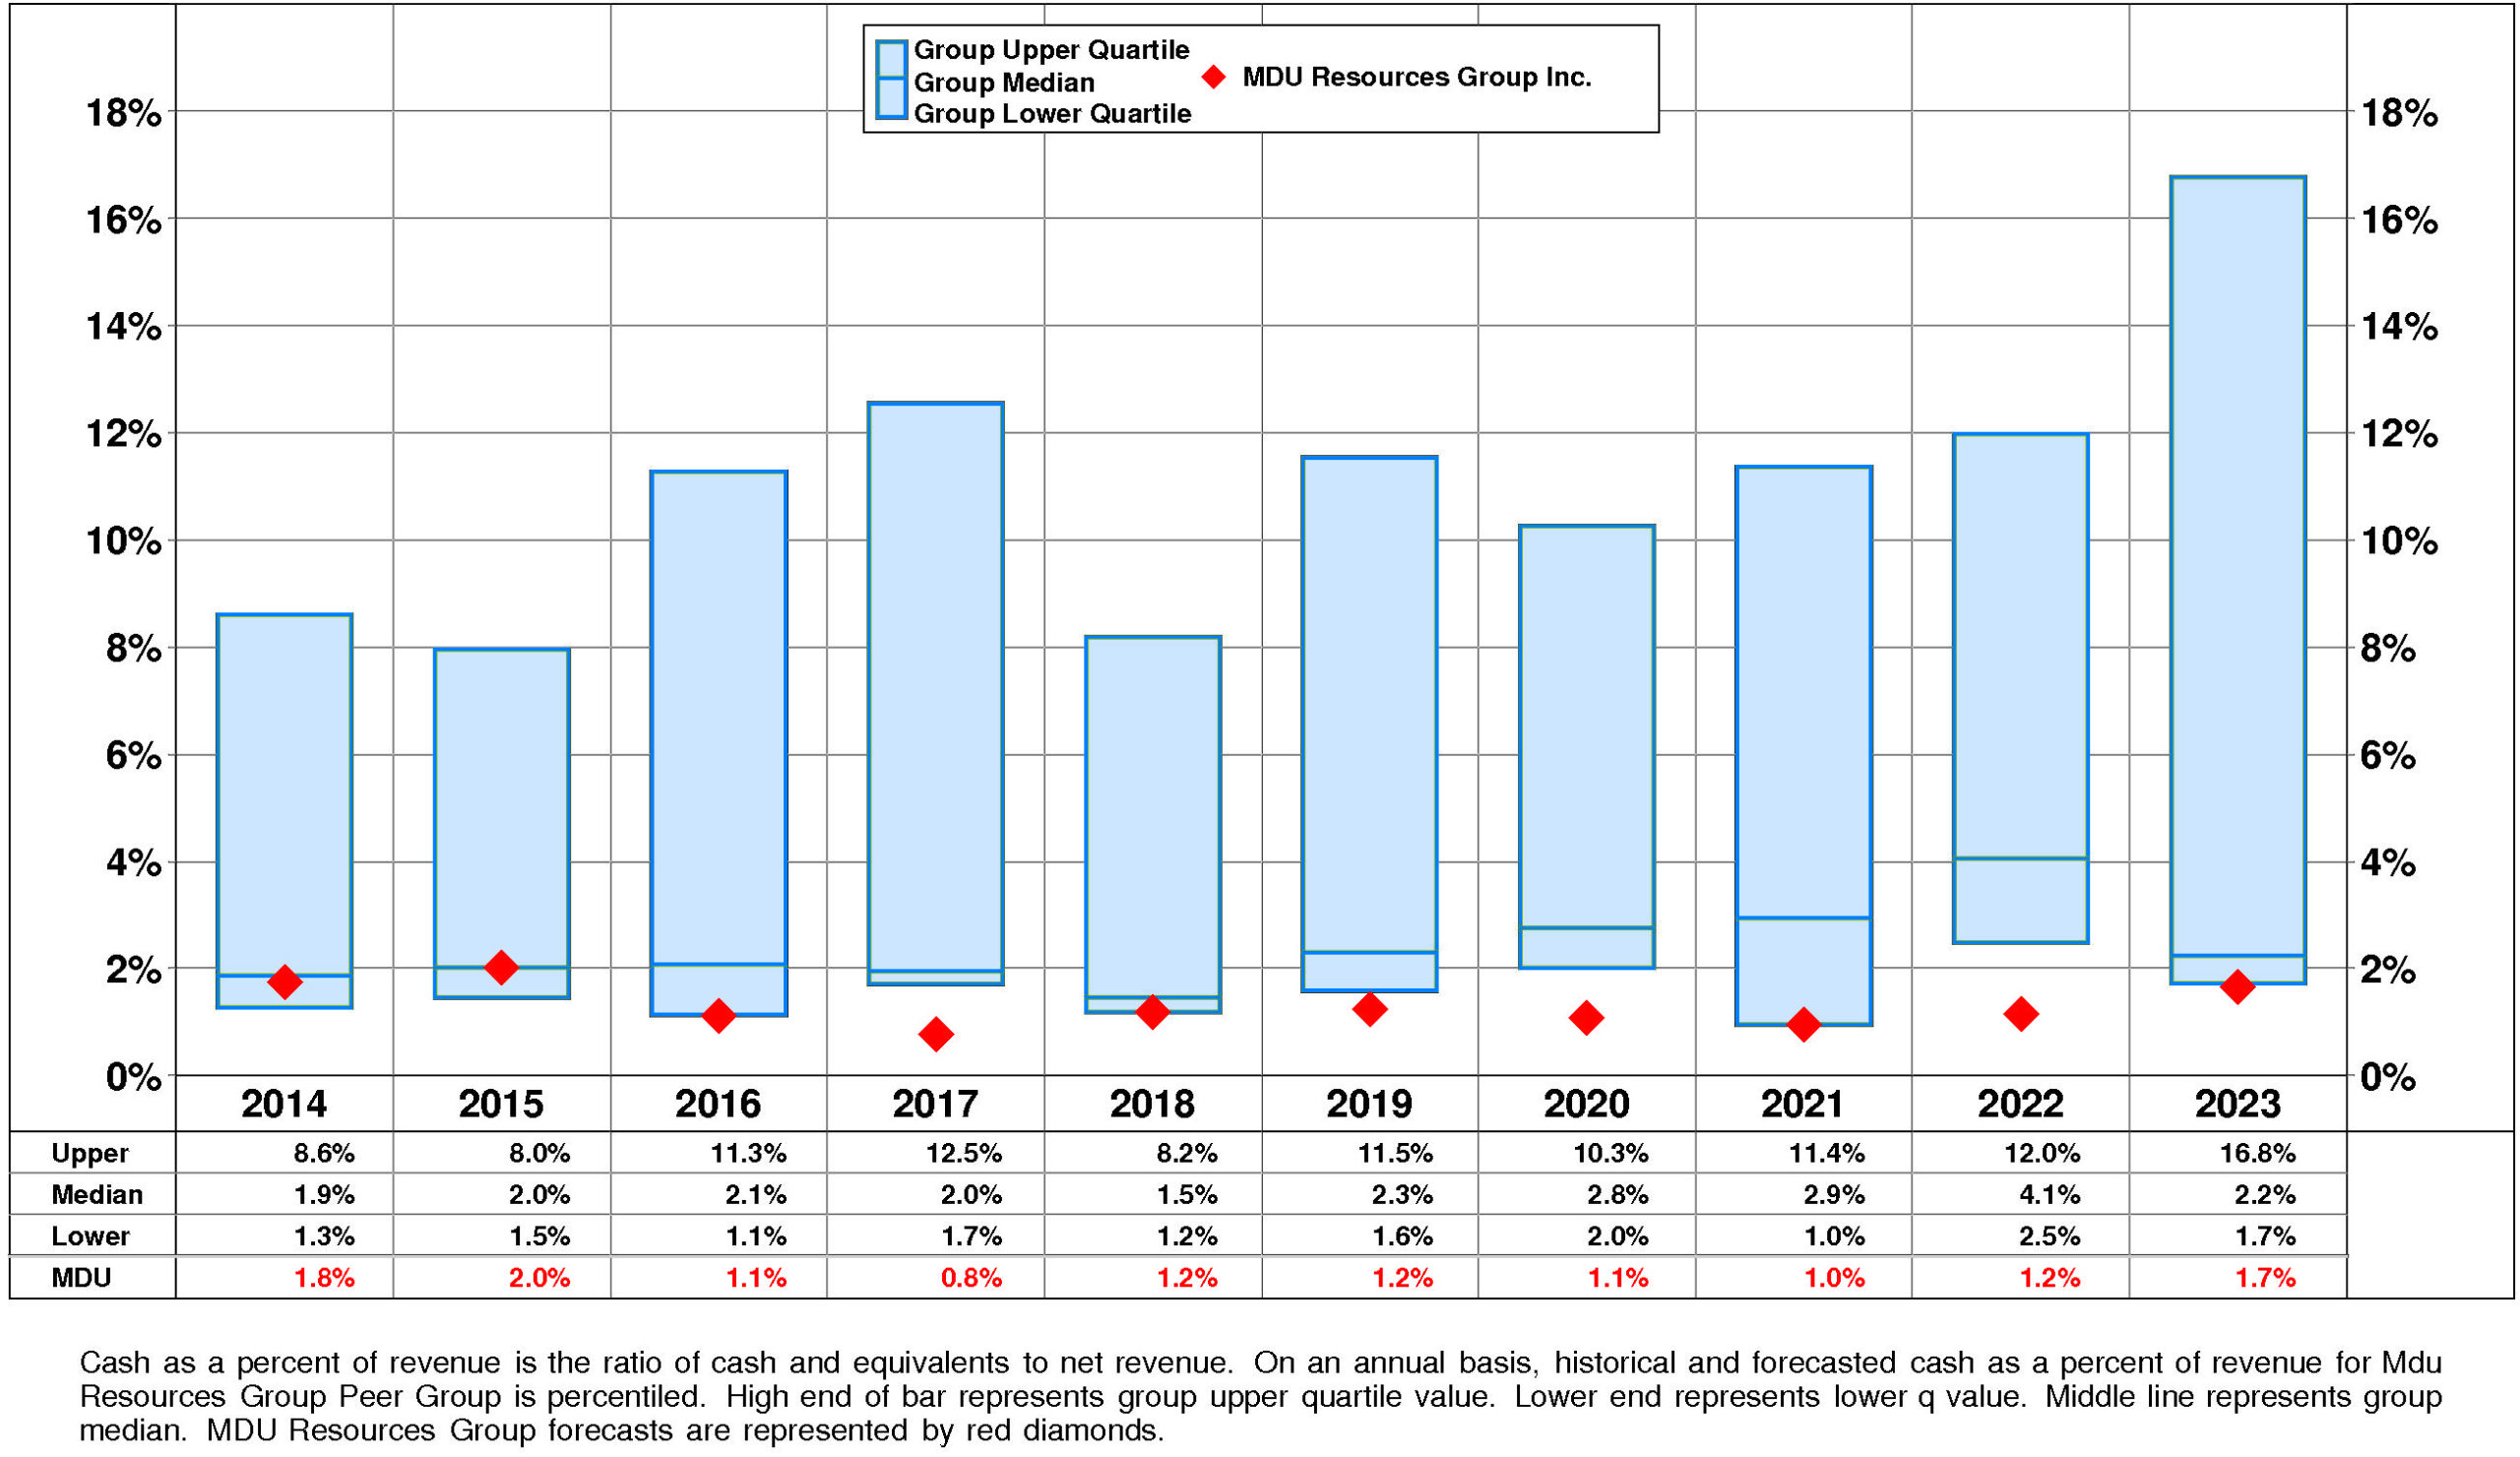
MDU Resources Group’s Cash, %Revenue has exhibited little to no overall change over the period. This stability was accompanied by stability for the Mdu Resources Group Peer Group as well. In most years, MDU Resources Group was in the lower quartile and third quartile. Currently, MDU Resources Group is lower quartile at +2%.
PROFITABILITY
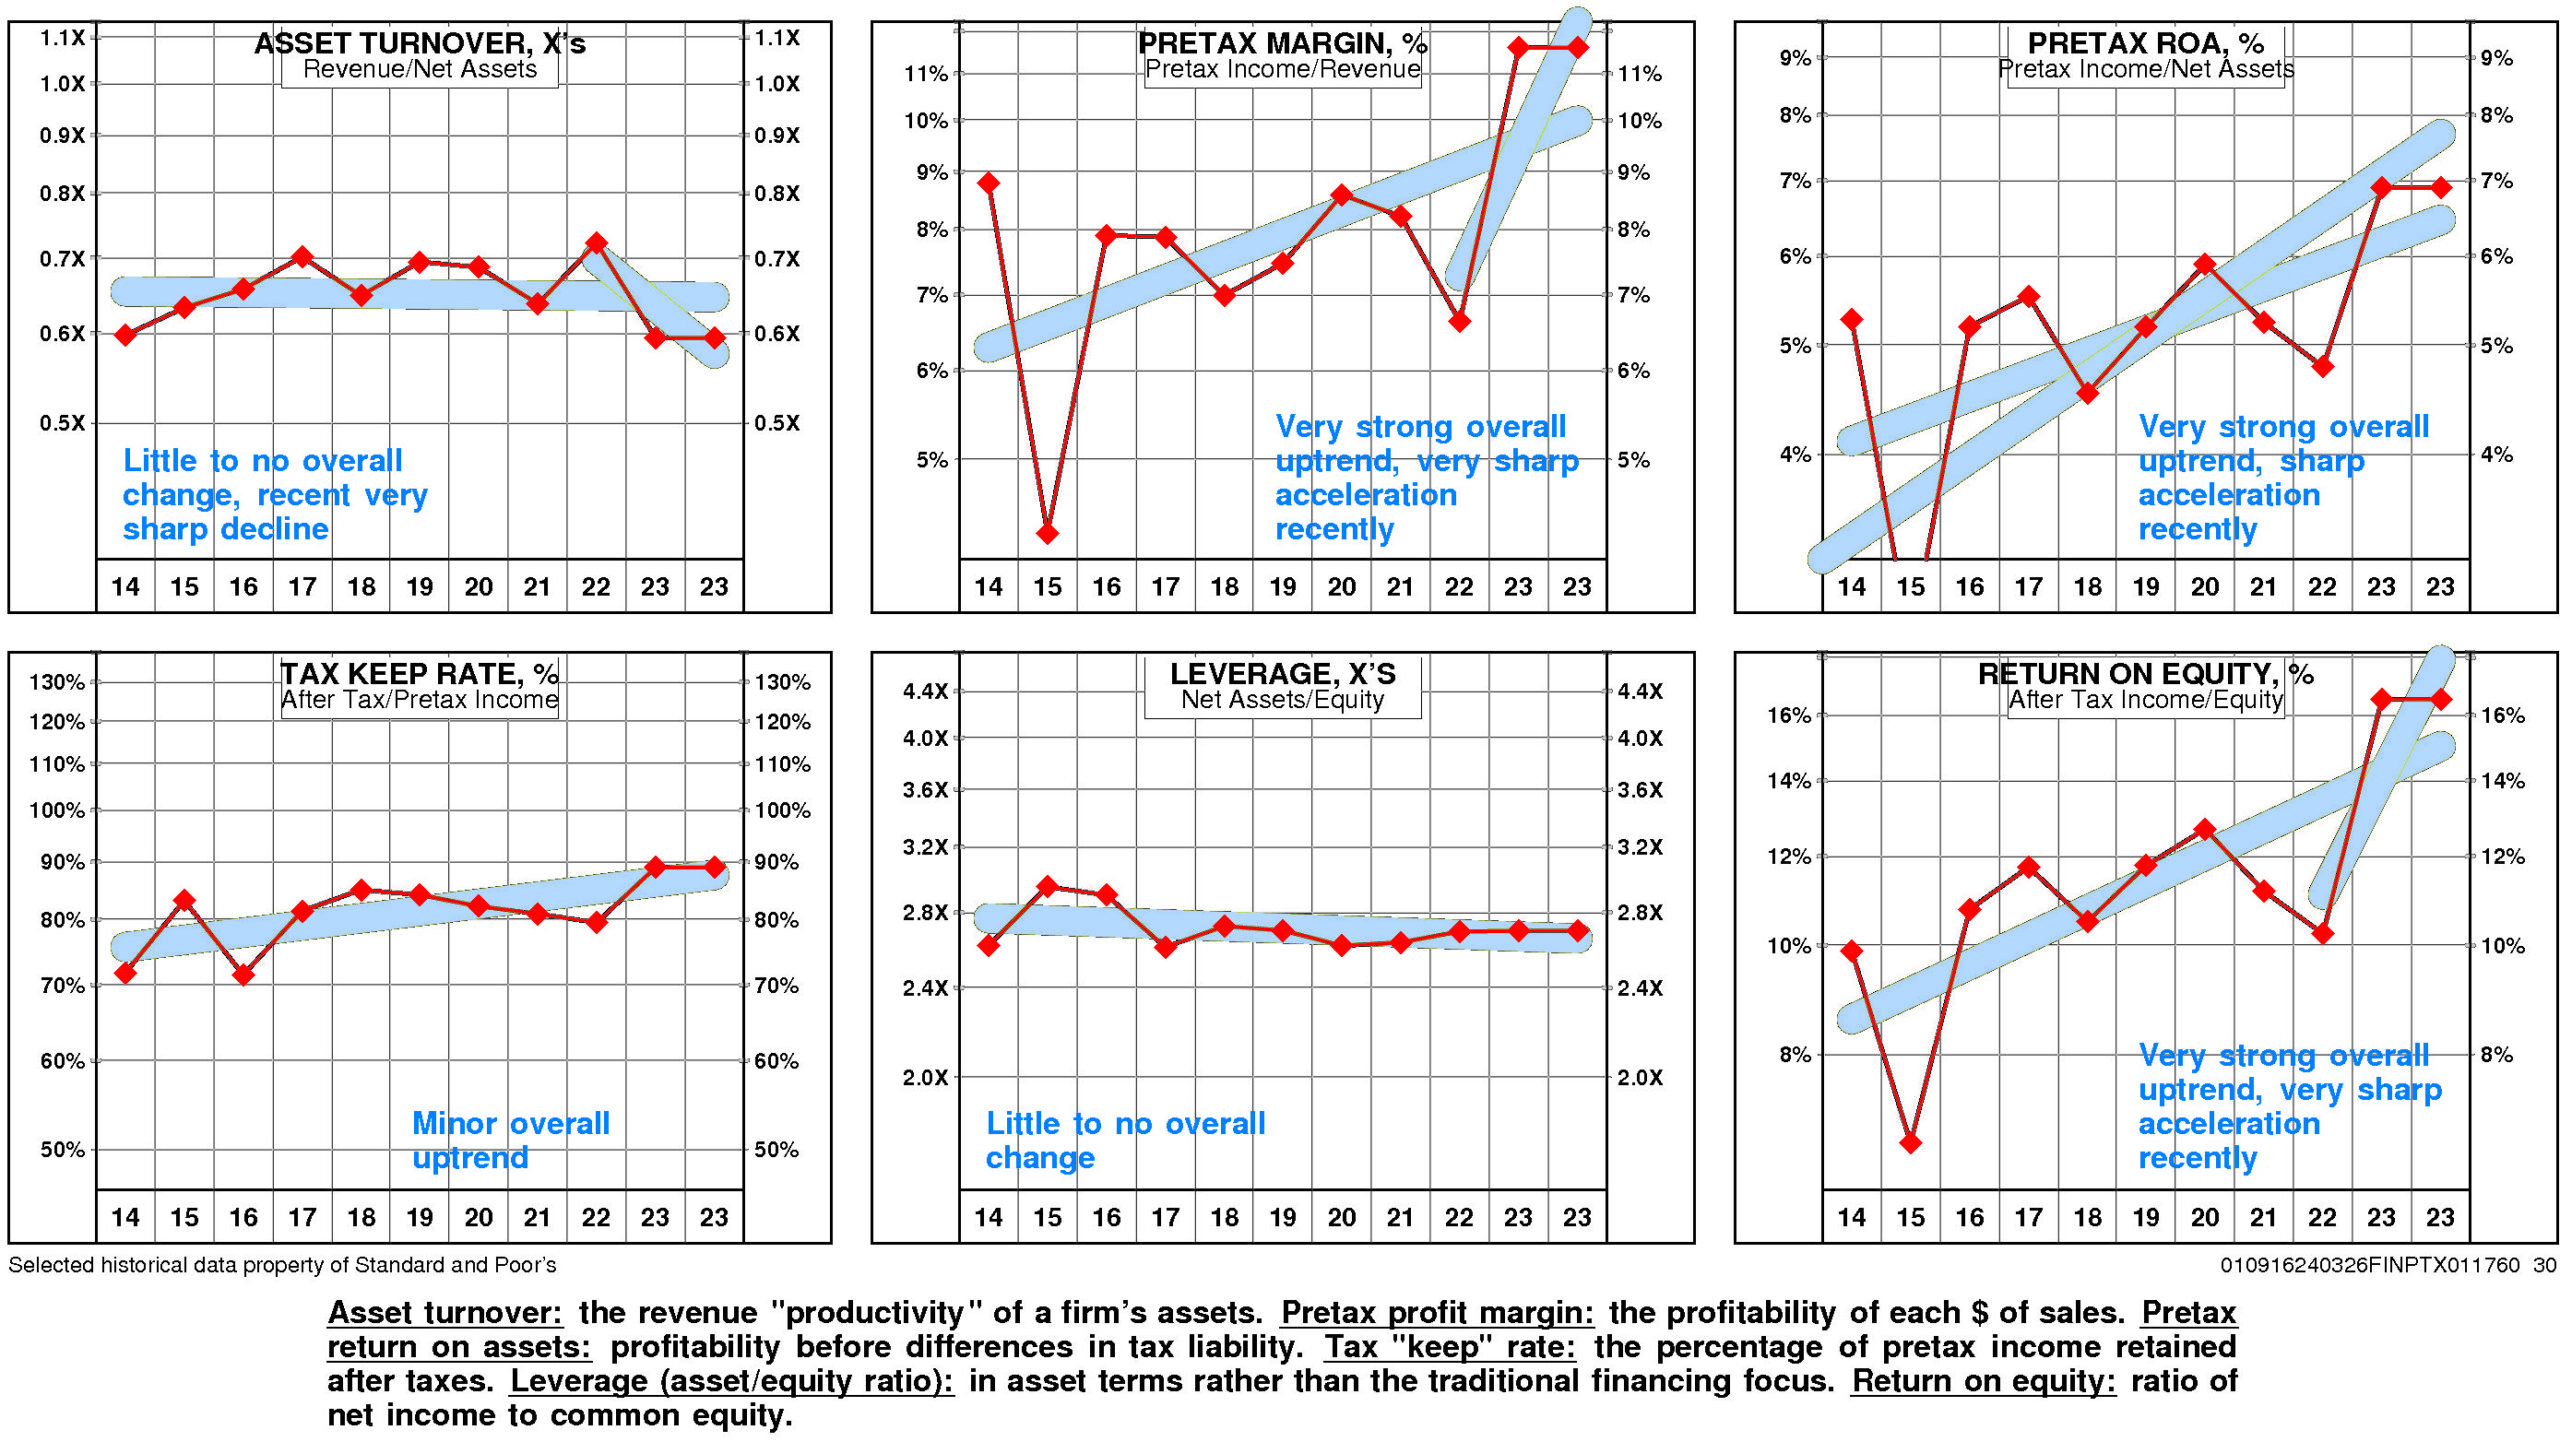
MDU Resources Group’s return on equity has improved very significantly since 2014. The current level of 16.5% is 1.67X the low for the period and is at the high.
This very significant improvement was due to very strong positive trend in pretax operating return and very minor positive trend in non-operating factors.
The productivity of MDU Resources Group’s assets remained stable over the full period 2014-2023: asset turnover has exhibited little to no overall change although it experienced a very sharp decline from the 2022 level.
Additionally, pretax margin enjoyed a very strong overall uptrend that accelerated very sharply from the 2022 level.
Non-operating factors (income taxes and financial leverage) had a very small positive influence on return on equity.
MDU Resources Group’s return on equity is above median (16.5%) for the four quarters ended December, 2023.
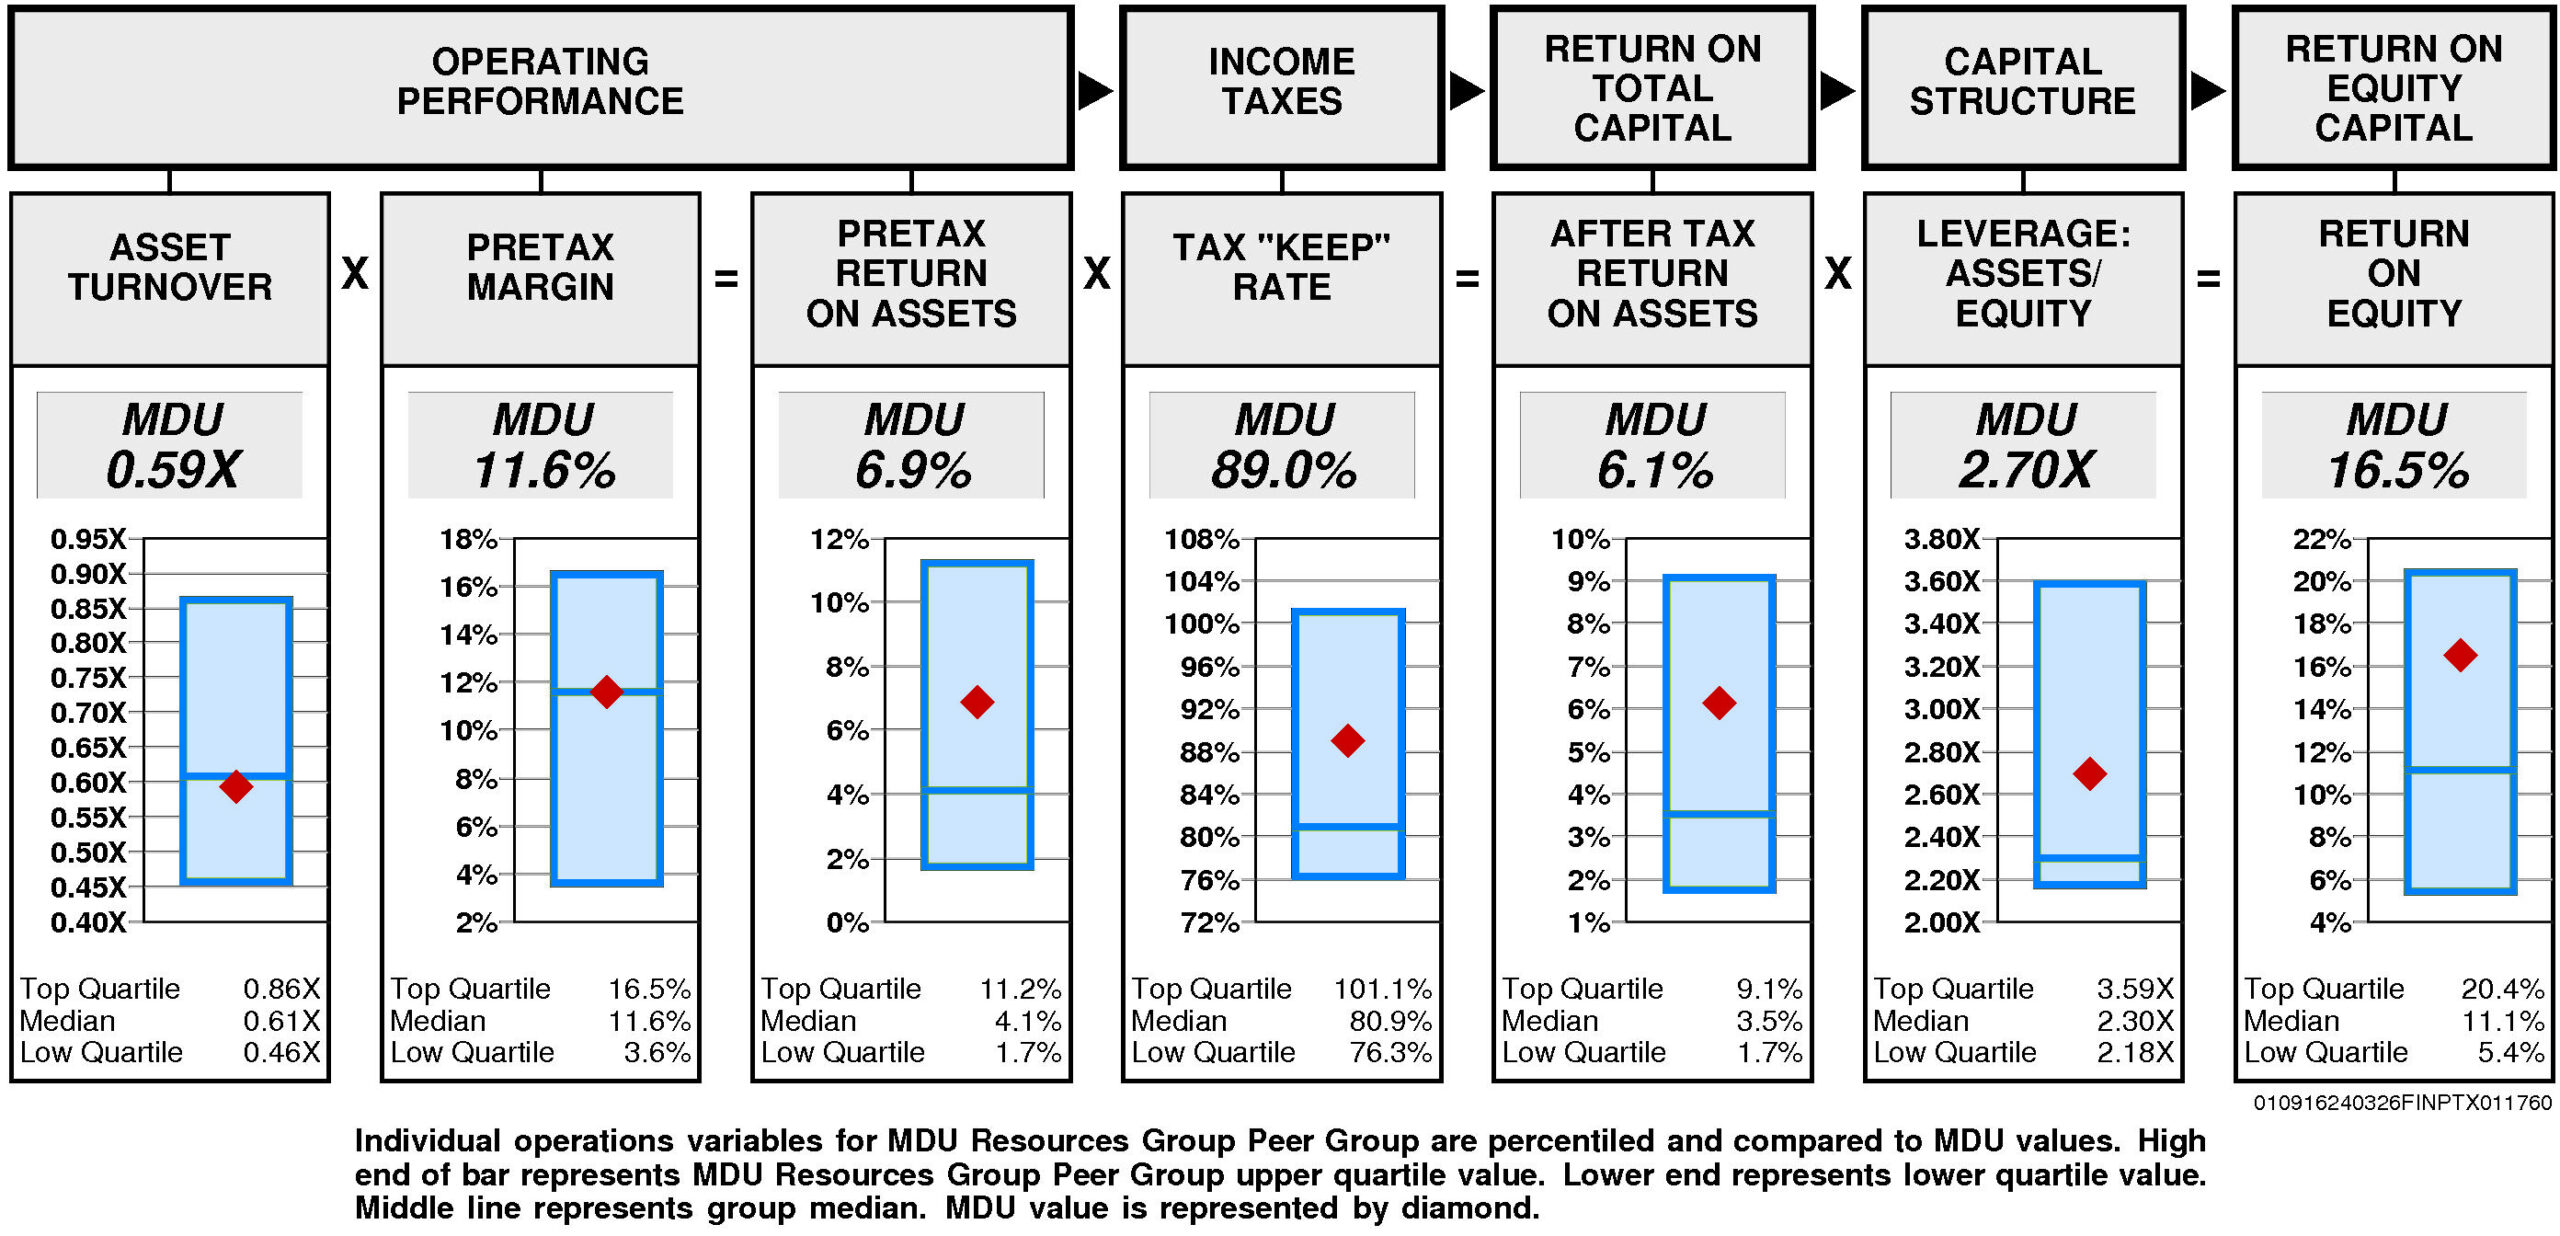
Operating performance (pretax return on assets) is above median (6.9%) reflecting asset turnover that is slightly below median (0.59X) and at median pretax margin (11.6%).
Tax “keep” rate (income tax management) is above median (89.0%) resulting in after tax return on assets that is above median.
Financial leverage (leverage) is above median (2.70X).
GROWTH RATES
There are no significant differences between MDU Resources Group’s longer term growth and growth in recent years.
MDU Resources Group’s historical income statement growth has been in line with balance sheet growth. Revenue growth has paralleled asset growth; earnings growth has paralleled equity growth.
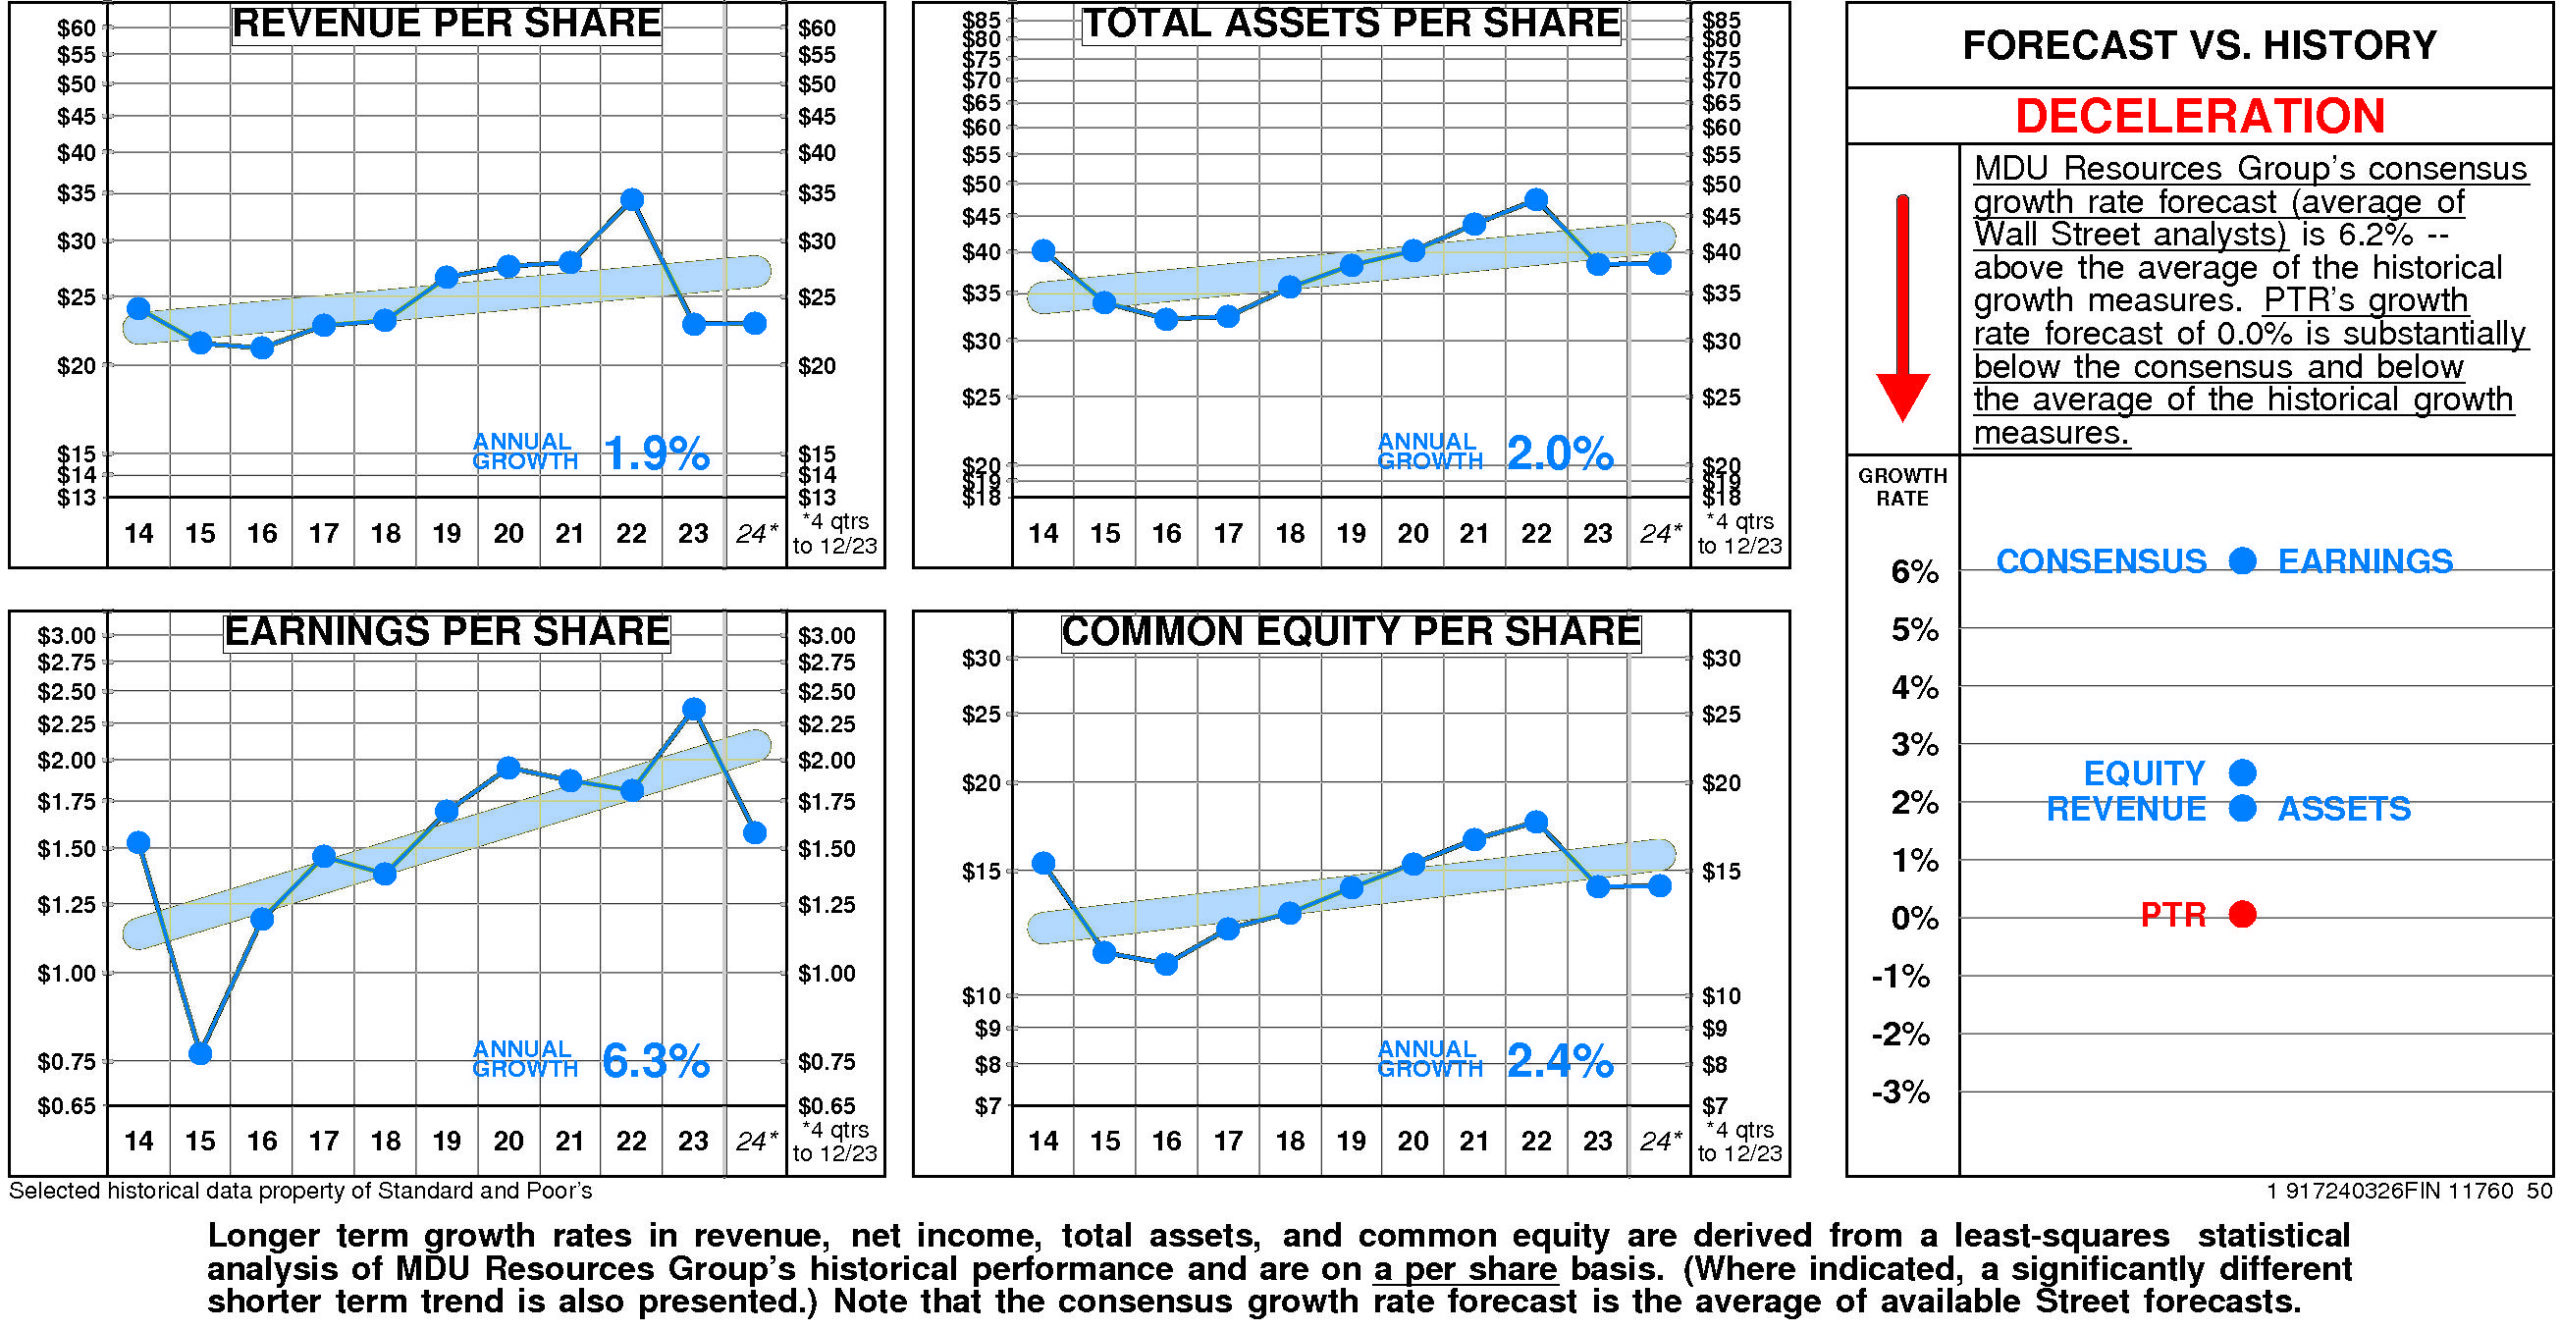
Annual revenue growth has been 1.9% per year.
Total asset growth has been 2.0% per year.
Annual E.P.S. growth has been 6.3% per year.
Equity growth has been 2.4% per year.
MDU Resources Group’s consensus growth rate forecast (average of Wall Street analysts) is 6.2% — above the average of the historical growth measures.
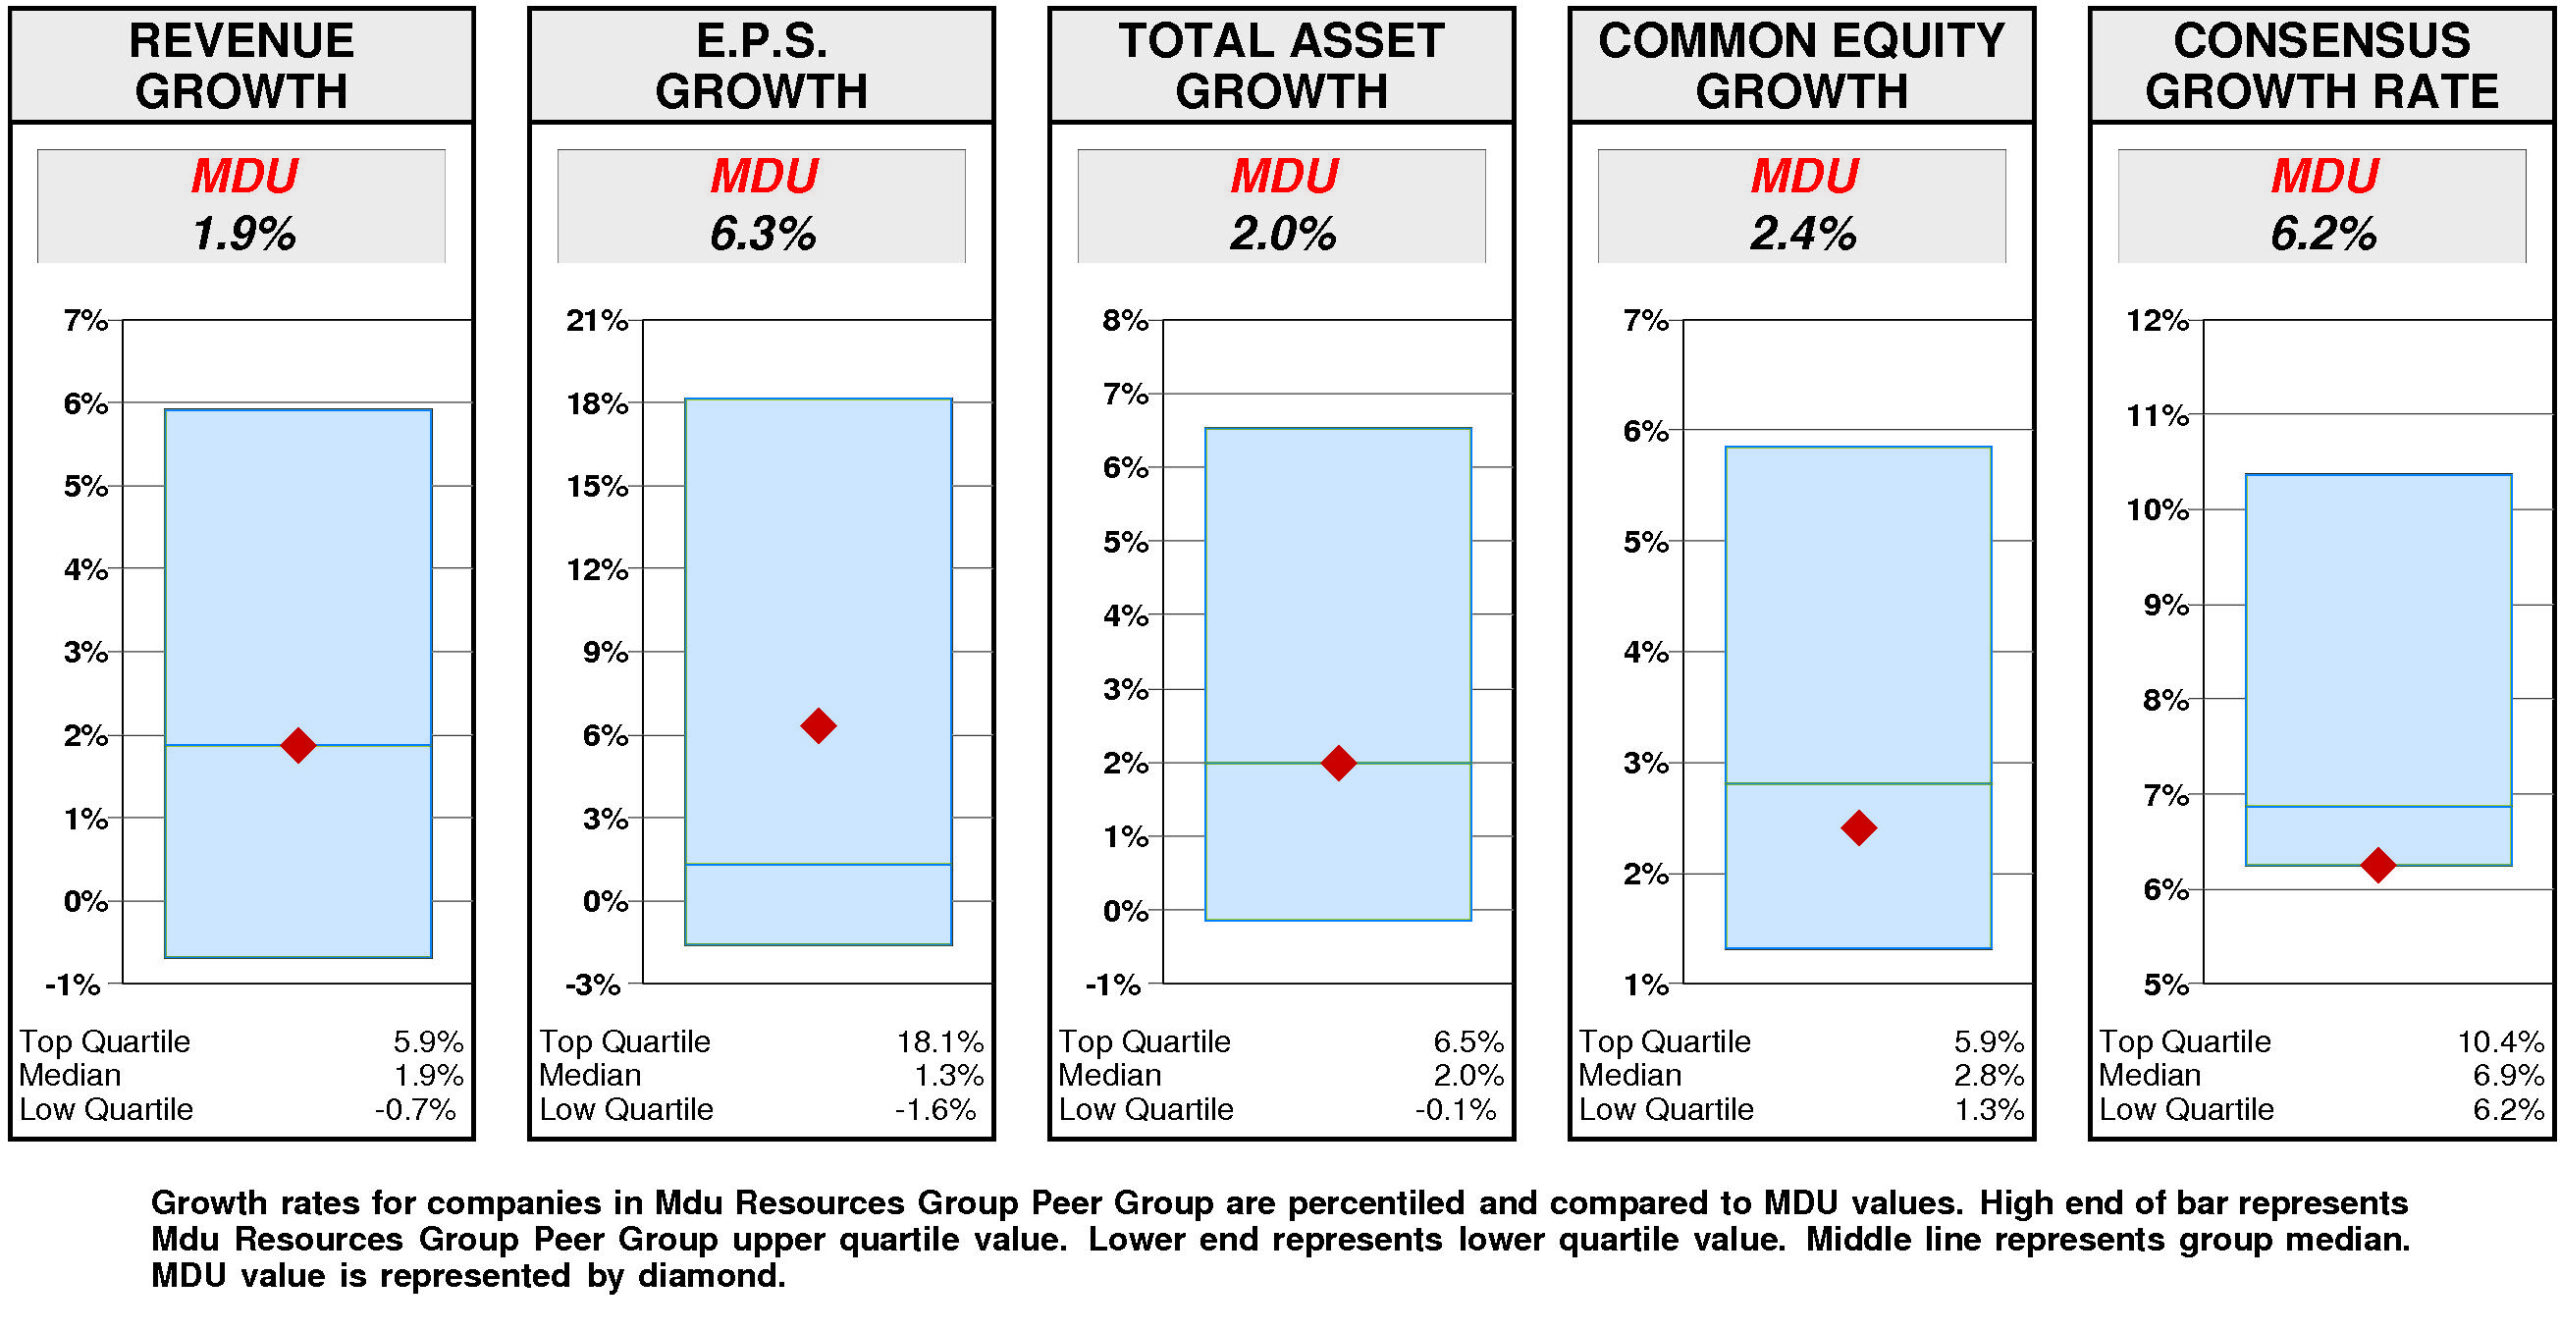
Relative to the Mdu Resources Group Peer Group, MDU Resources Group’s historical growth measures are generally second quartile. E.P.S. growth (6.3%) has been above median. Total asset growth (2.0%) has been at median. Revenue growth (1.9%) has been at median. Equity growth (2.4%) has been below median.
Consistent with this pattern, consensus growth forecast (6.2%) is also at the lower quartile.
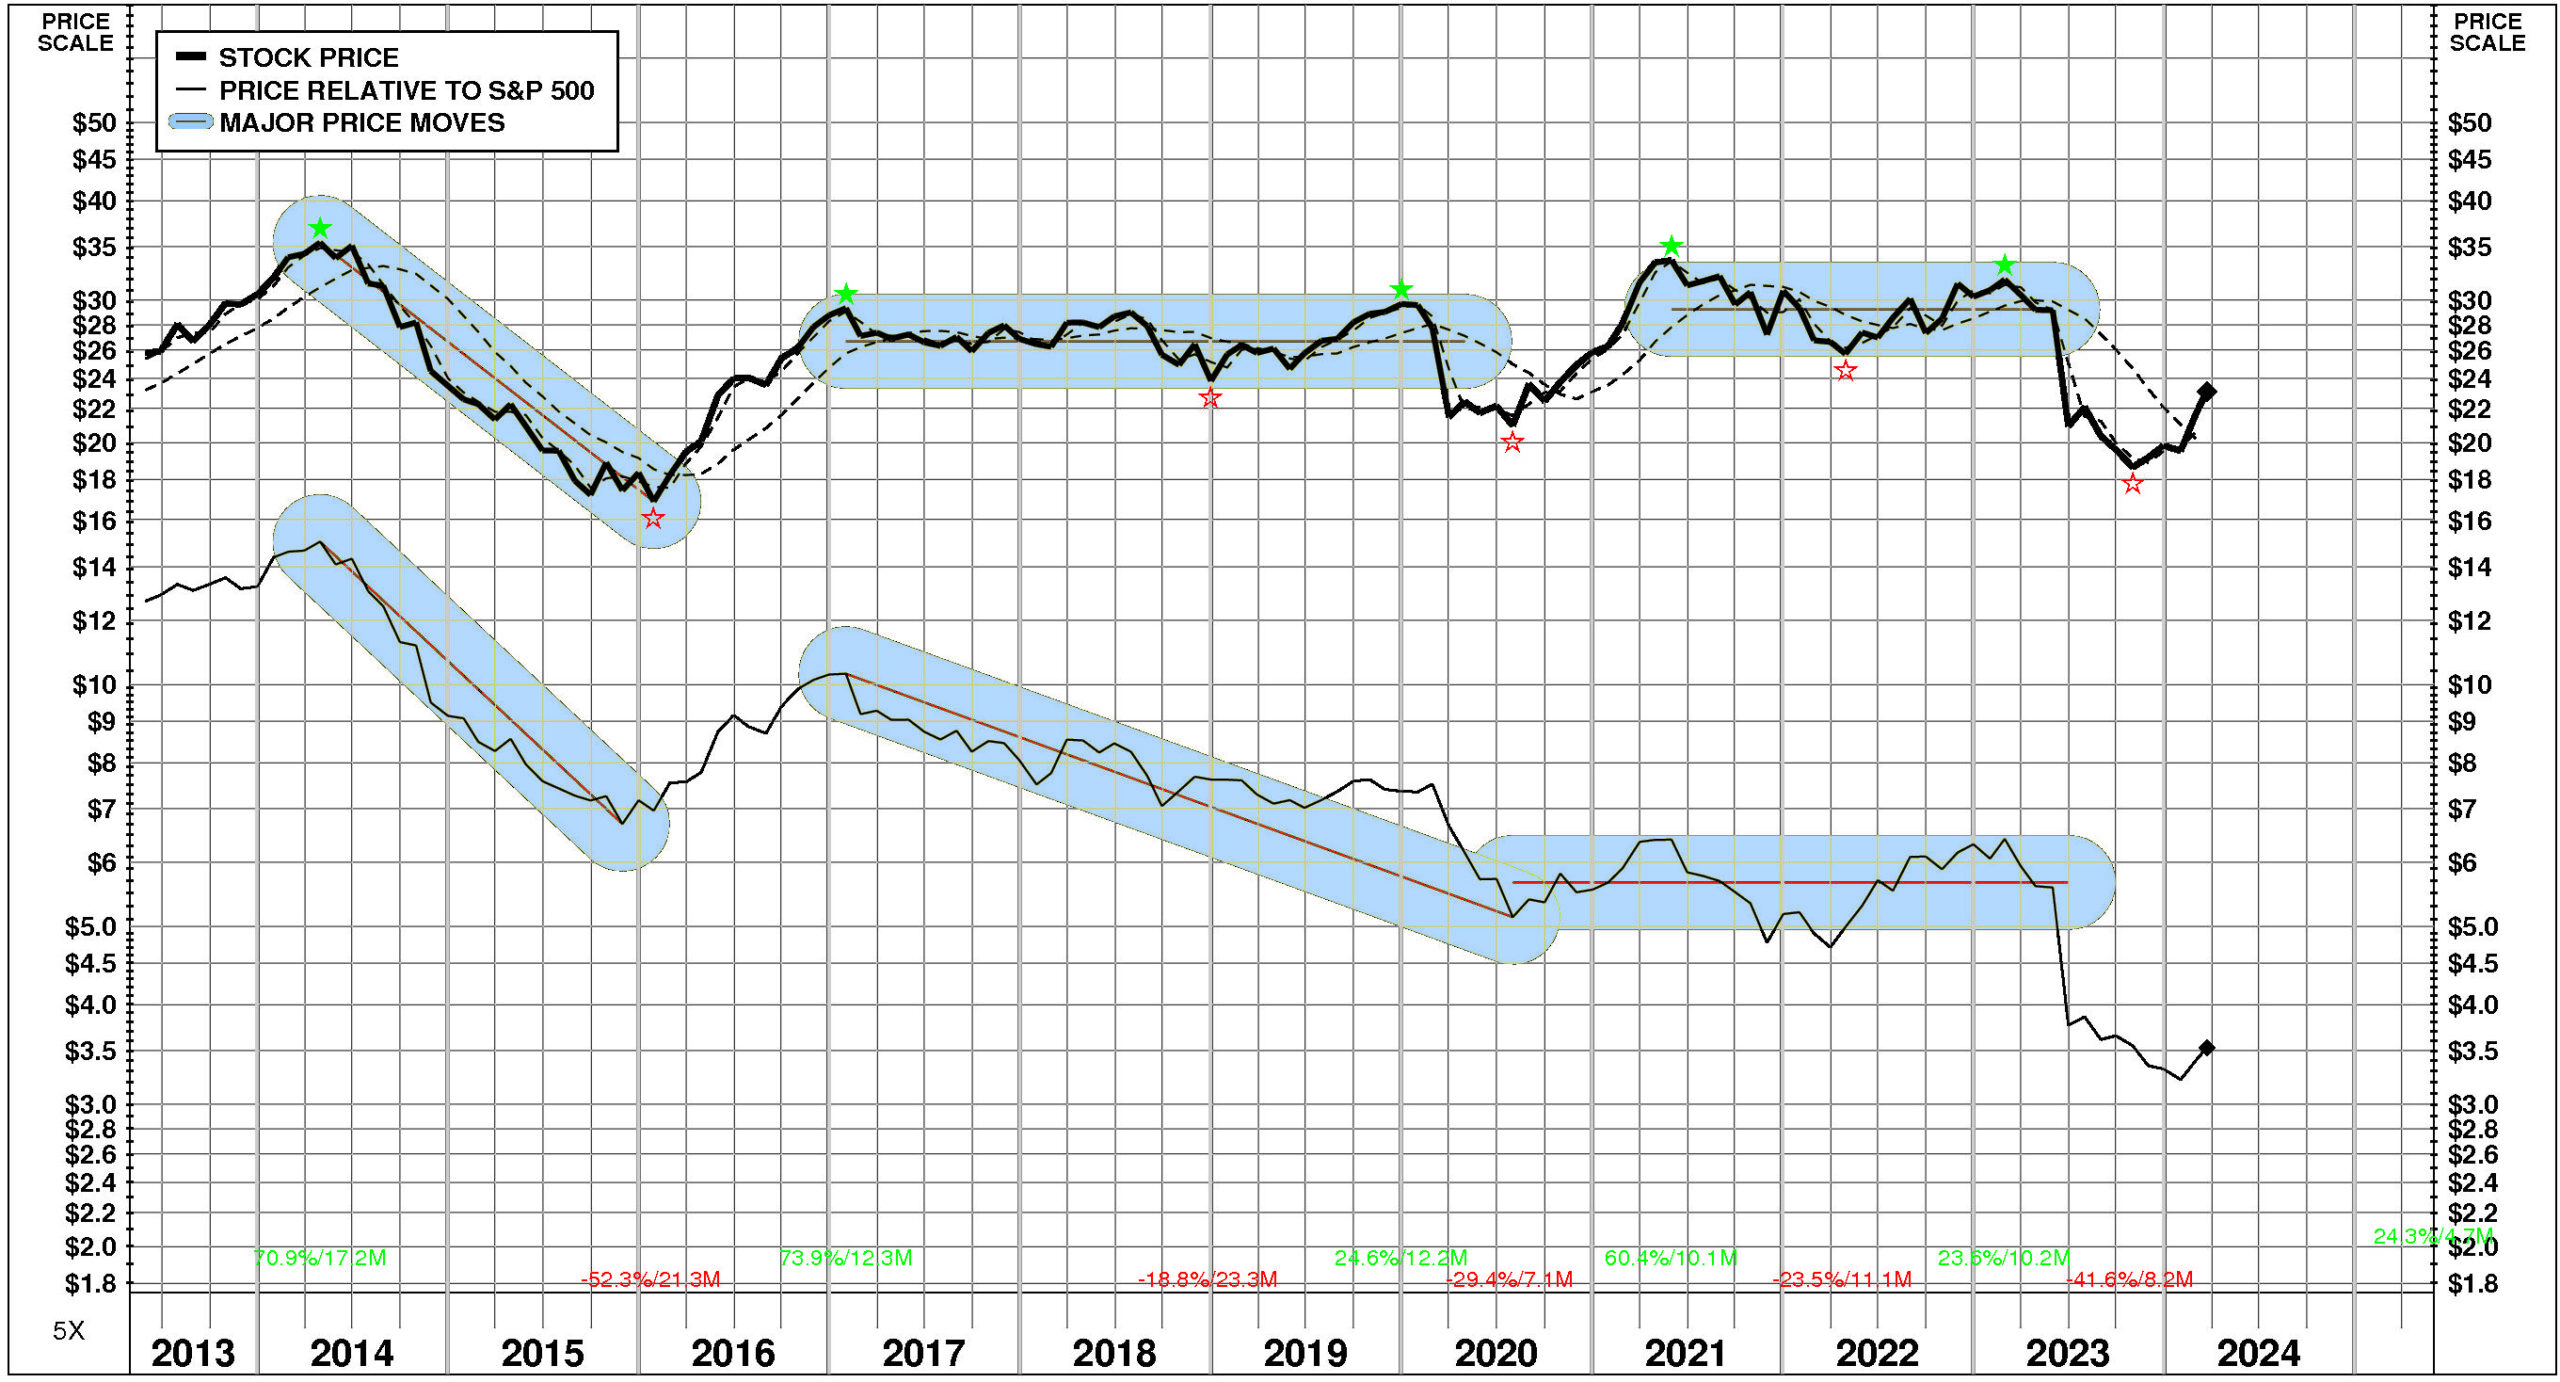
PRICE HISTORY
Over the full time period, MDU Resources Group’s stock price performance has been variable and significantly below market. Between May, 2013 and March, 2024, MDU Resources Group’s stock price fell -11%; relative to the market, this was a -72% loss. Significant price move during the period: 1) April, 2014 – January, 2016: -52%.
TOTAL INVESTMENT RETURNS
Current annual total return performance of 0.0% is below median relative to the S&P 500 Composite.
In addition to being below median relative to S&P 500 Composite, current annual total return performance through February, 2024 of 0.0% is at the lower quartile relative to MDU Resources Group Inc. Peer Group.
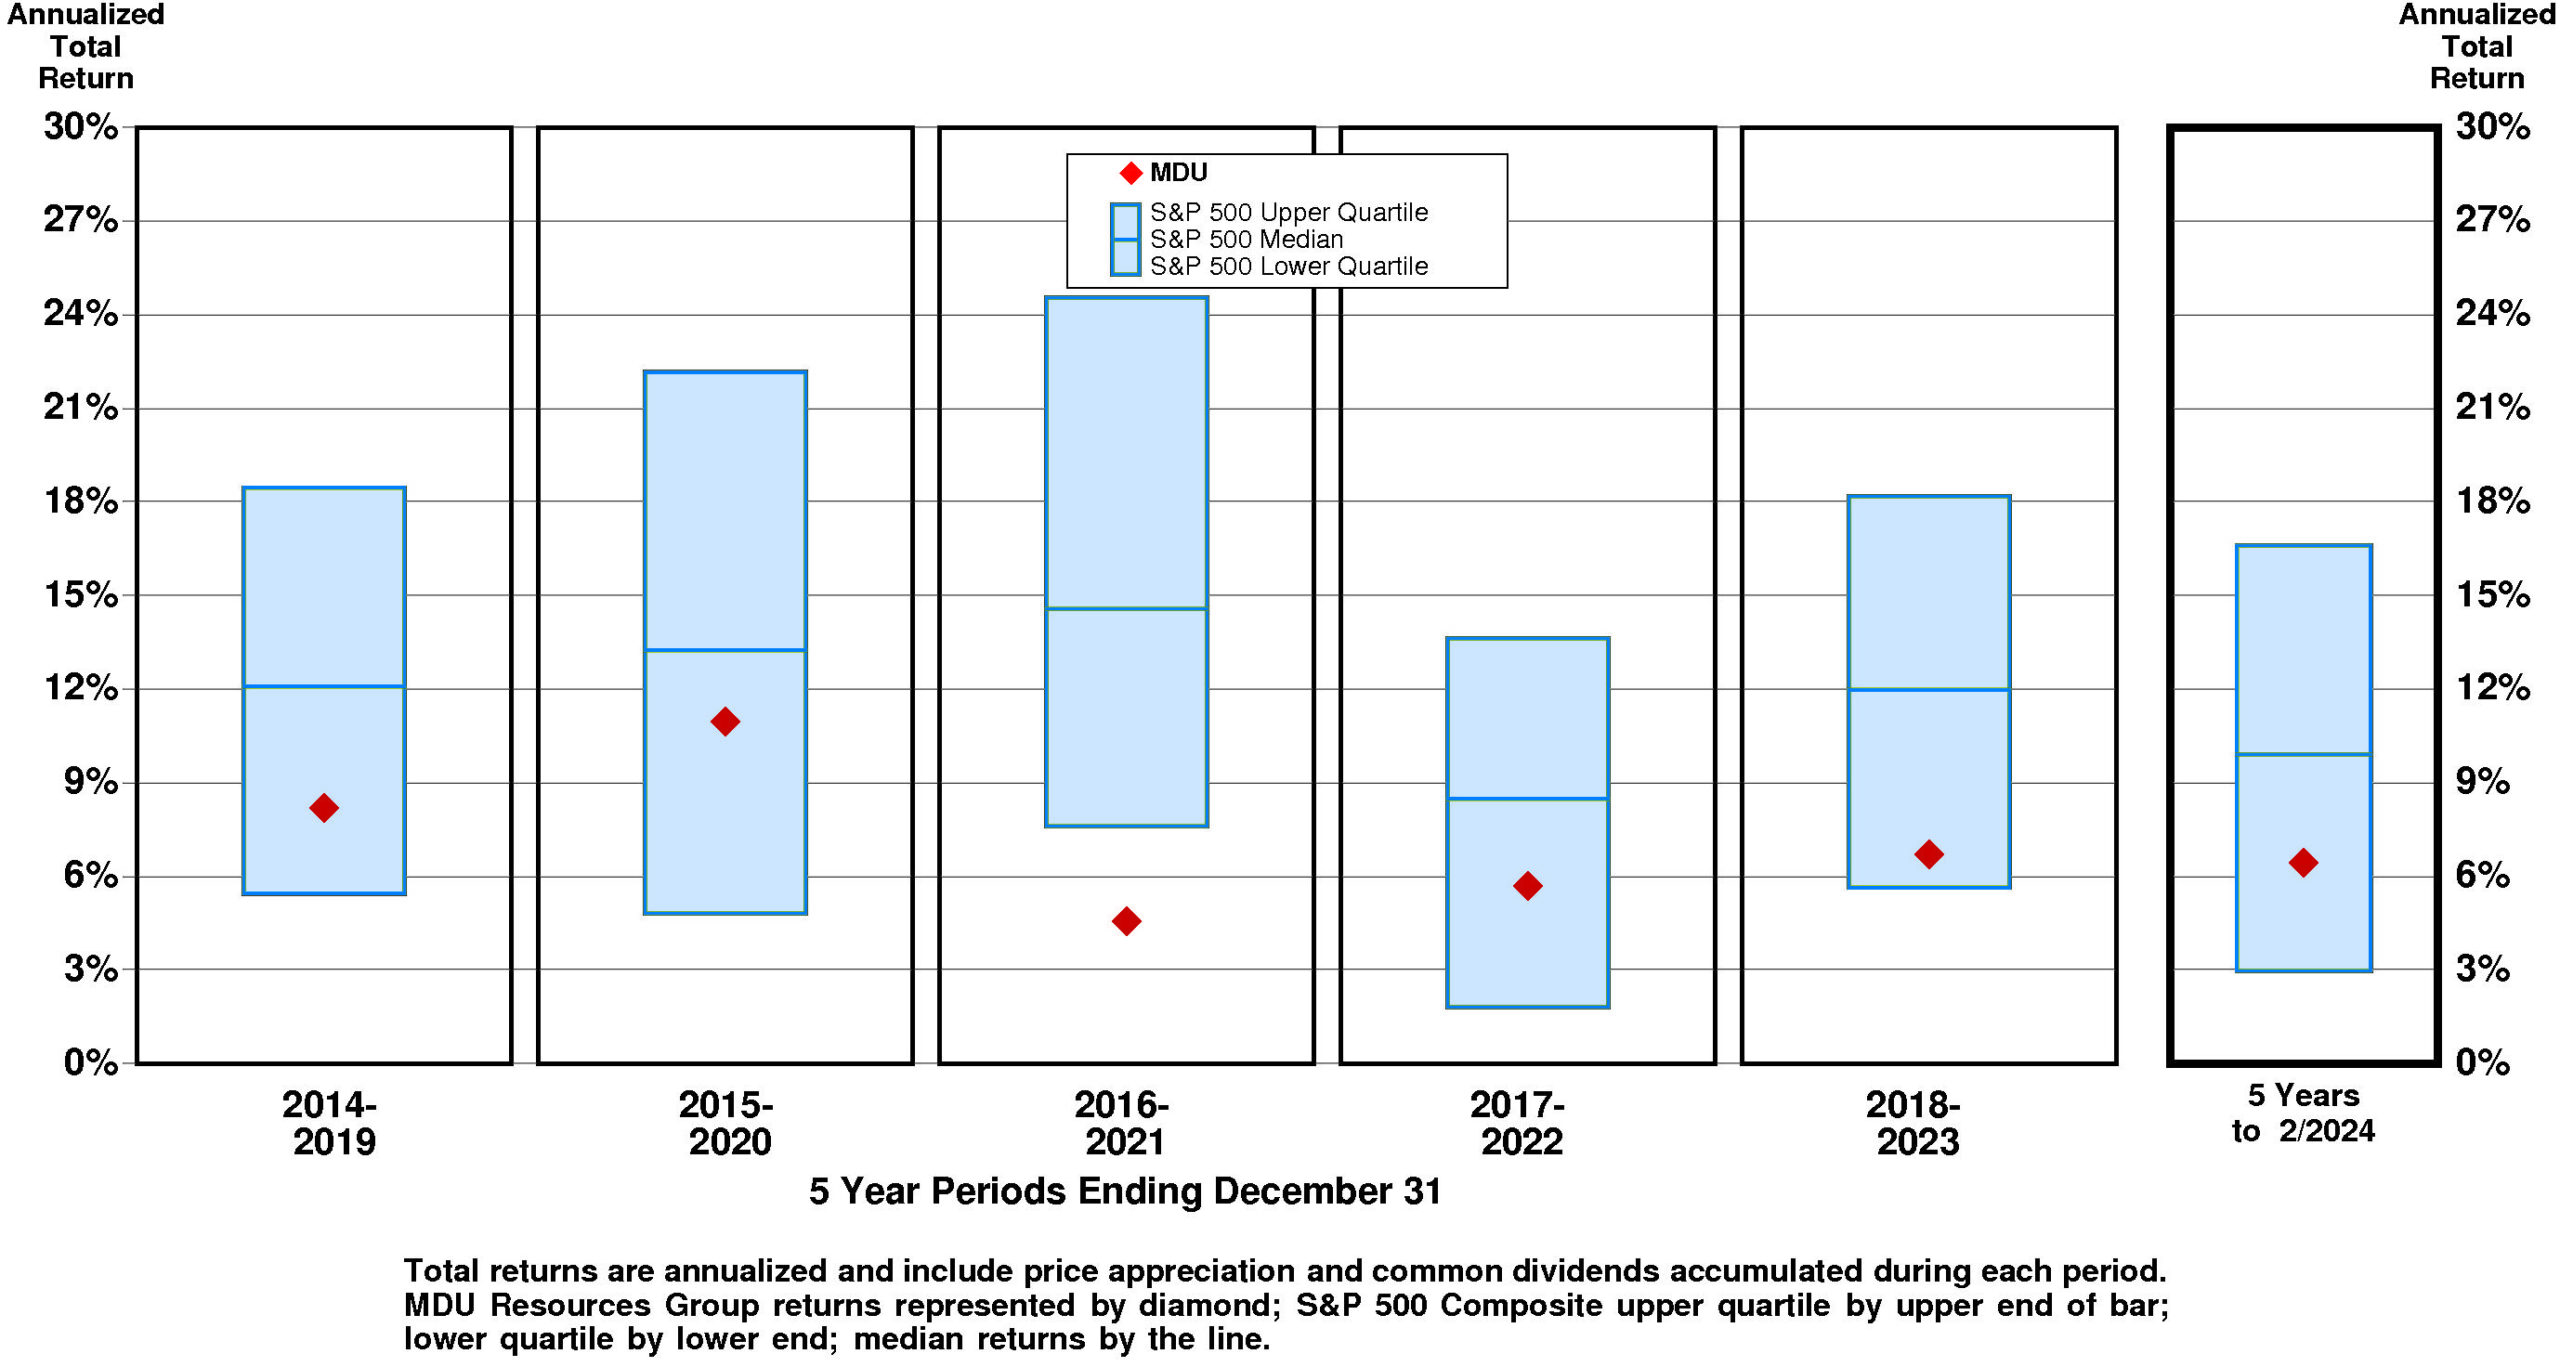
Current 5-year total return performance of 6.4% is below median relative to the S&P 500 Composite.
Through February, 2024, with below median current 5-year total return of 6.4% relative to S&P 500 Composite, MDU Resources Group’s total return performance is slightly above median relative to MDU Resources Group Inc. Peer Group.
VALUATION BENCHMARKS
Relative to S&P 500 Composite, MDU’s overall valuation is quite low. Four of five factors are lower quartile. The highest factor is the ratio of enterprise value/earnings before interest and taxes, followed by the ratio of enterprise value/assets, then by the price/equity ratio, then by the ratio of enterprise value/revenue. The lowest factor, price/earnings ratio, is lower quartile.
Relative to MDU Resources Group Peer Group, MDU’s overall valuation is low. The highest factor, the ratio of enterprise value/assets, is at median. Ratio of enterprise value/earnings before interest and taxes is at median. Price/equity ratio is at median. Ratio of enterprise value/revenue is below median. The lowest factor, the price/earnings ratio, is lower quartile.

MDU Resources Group has a very large value gap compared to the median valuation. For MDU to rise to median valuation, its current ratio of enterprise value/revenue would have to rise from the current level of 1.54X to 1.83X. If MDU’s ratio of enterprise value/revenue were to rise to 1.83X, its stock price would be lower by $7 to $30.
For MDU to hit lower quartile valuation relative to the MDU Resources Group Peer Group, its current ratio of enterprise value/revenue would have to fall from the current level of 1.54X to 1.19X. If MDU’s ratio of enterprise value/revenue were to fall to 1.19X, its stock price would decline by $-8 from the current level of $23.
VALUE TARGETS
MDU is expected to continue to be an important Value Builder reflecting capital returns that are forecasted to be above the cost of capital.
MDU Resources Group’s current Price Target of $25 represents a +7% change from the current price of $23.14.
This moderately low appreciation potential results in an appreciation score of 39 (61% of the universe has greater appreciation potential.)
Reinforcing this moderately low Appreciation Score of 39, the neutral Power Rating of 50 contributes to an Value Trend Rating of C.

MDU Resources Group’s current Price Target is $25 (-32% from the 2023 Target of $36 but +7% from the 03/21/24 price of $23.14). This dramatic fall in the Target is the result of a -14% decrease in the equity base and a -20% decrease in the price/equity multiple. The forecasted decline in growth has a very large negative impact on the price/equity multiple and the forecasted increase in cost of equity has a very large negative impact as well. Partially offsetting these Drivers, the forecasted increase in return on equity has a very large positive impact.
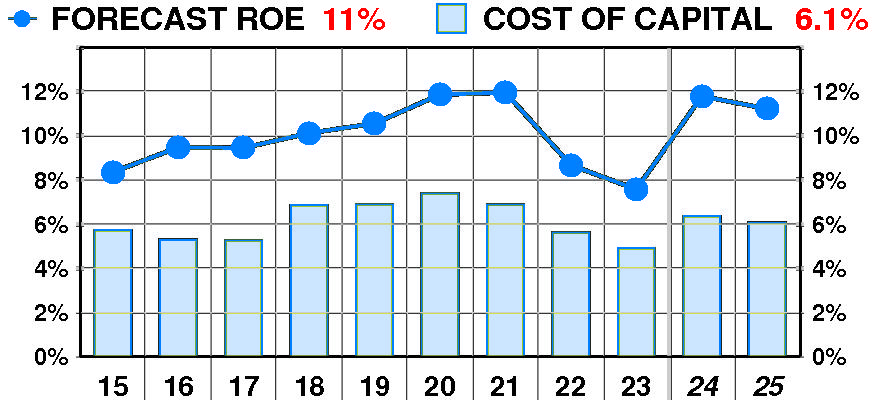
PTR’s return on equity forecast is 11.2% — slightly above our recent forecasts. Forecasted return on equity erratic but little changed between 2015 and 2023. The current forecast is above the 2015 low of 8%.
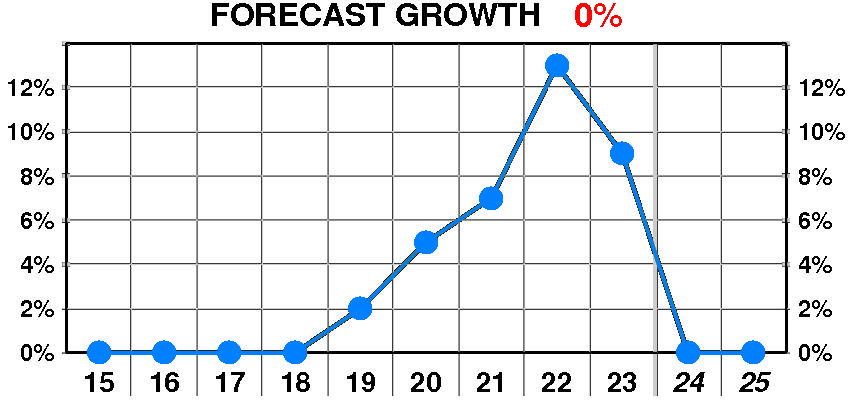
PTR’s growth forecast is 0.0% — below our recent forecasts. Forecasted growth enjoyed a dramatic, variable increase between 2019 and 2023. The current forecast is significantly below the 2022 peak of 13%.
PTR’s cost of equity forecast is 6.1% — in line with recent levels. Forecasted cost of equity erratic but little changed between 2015 and 2023. The current forecast is steady at the 2020 peak of 7.4%.
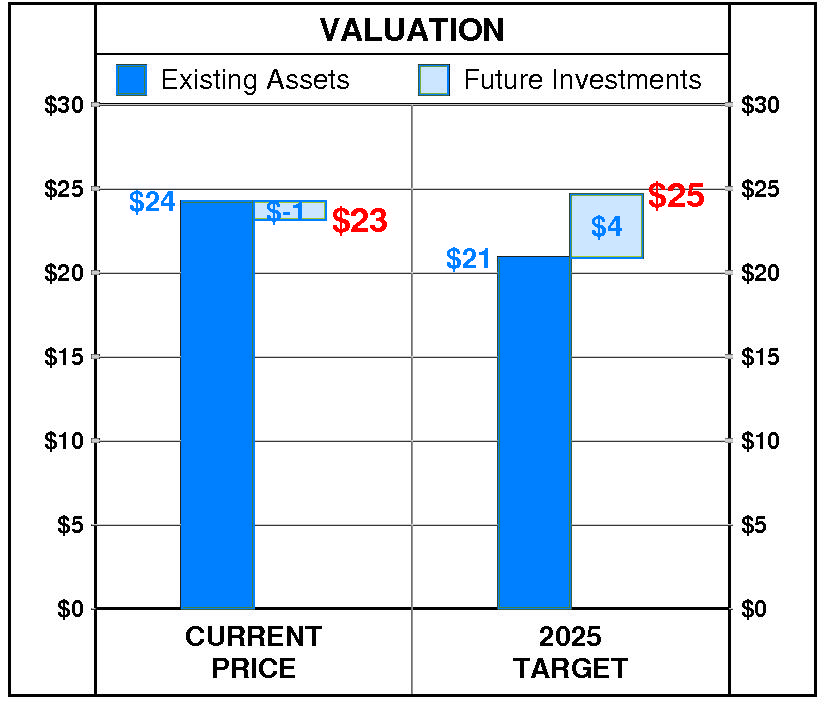
At MDU Resources Group’s current price of $23.14, investors are placing a negative value of $-1 on its future investments. This view is not supported by the company’s most recent performance that reflected a growth rate of 9.0% per year, and a return on equity of 7.6% versus a cost of equity of 4.9%.
PTR’s 2025 Price Target of $25 is based on these forecasts and reflects an estimated value of existing assets of $21 and a value of future investments of $4.
Be the first to comment