![]()
BUSINESS
M.D.C. Holdings, Inc., through its subsidiaries, engages in the homebuilding and financial service businesses. Its homebuilding operations include purchasing finished lots or developing lots for the construction and sale primarily of single-family detached homes to first-time and first-time move-up homebuyers under the Richmond American Homes name. The company conducts its homebuilding operations in Arizona, California, Nevada, New Mexico, Oregon, Texas, Washington, Colorado, Idaho, Utah, Maryland, Pennsylvania, Virginia, Tennessee, and Florida.
INVESTMENT RATING
MDC is expected to continue to be a Value Builder reflecting capital returns that are forecasted to be above the cost of capital.
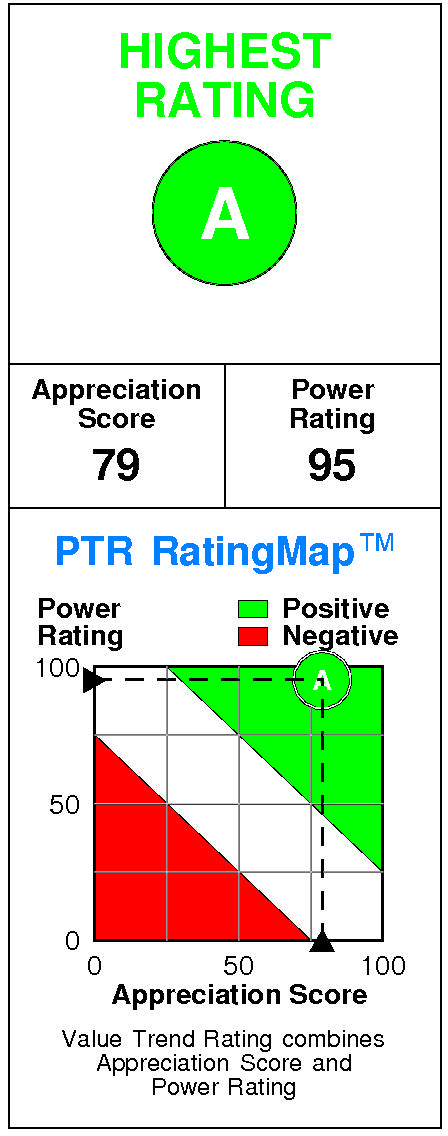
M.D.C. Holdings has a current Value Trend Rating of A (Highest Rating).
This rating combines consistent signals from two proprietary PTR measures of a stock’s attractiveness. M.D.C. Holdings has a good Appreciation Score of 79 and a very high Power Rating of 95, producing the Highest Value Trend Rating.
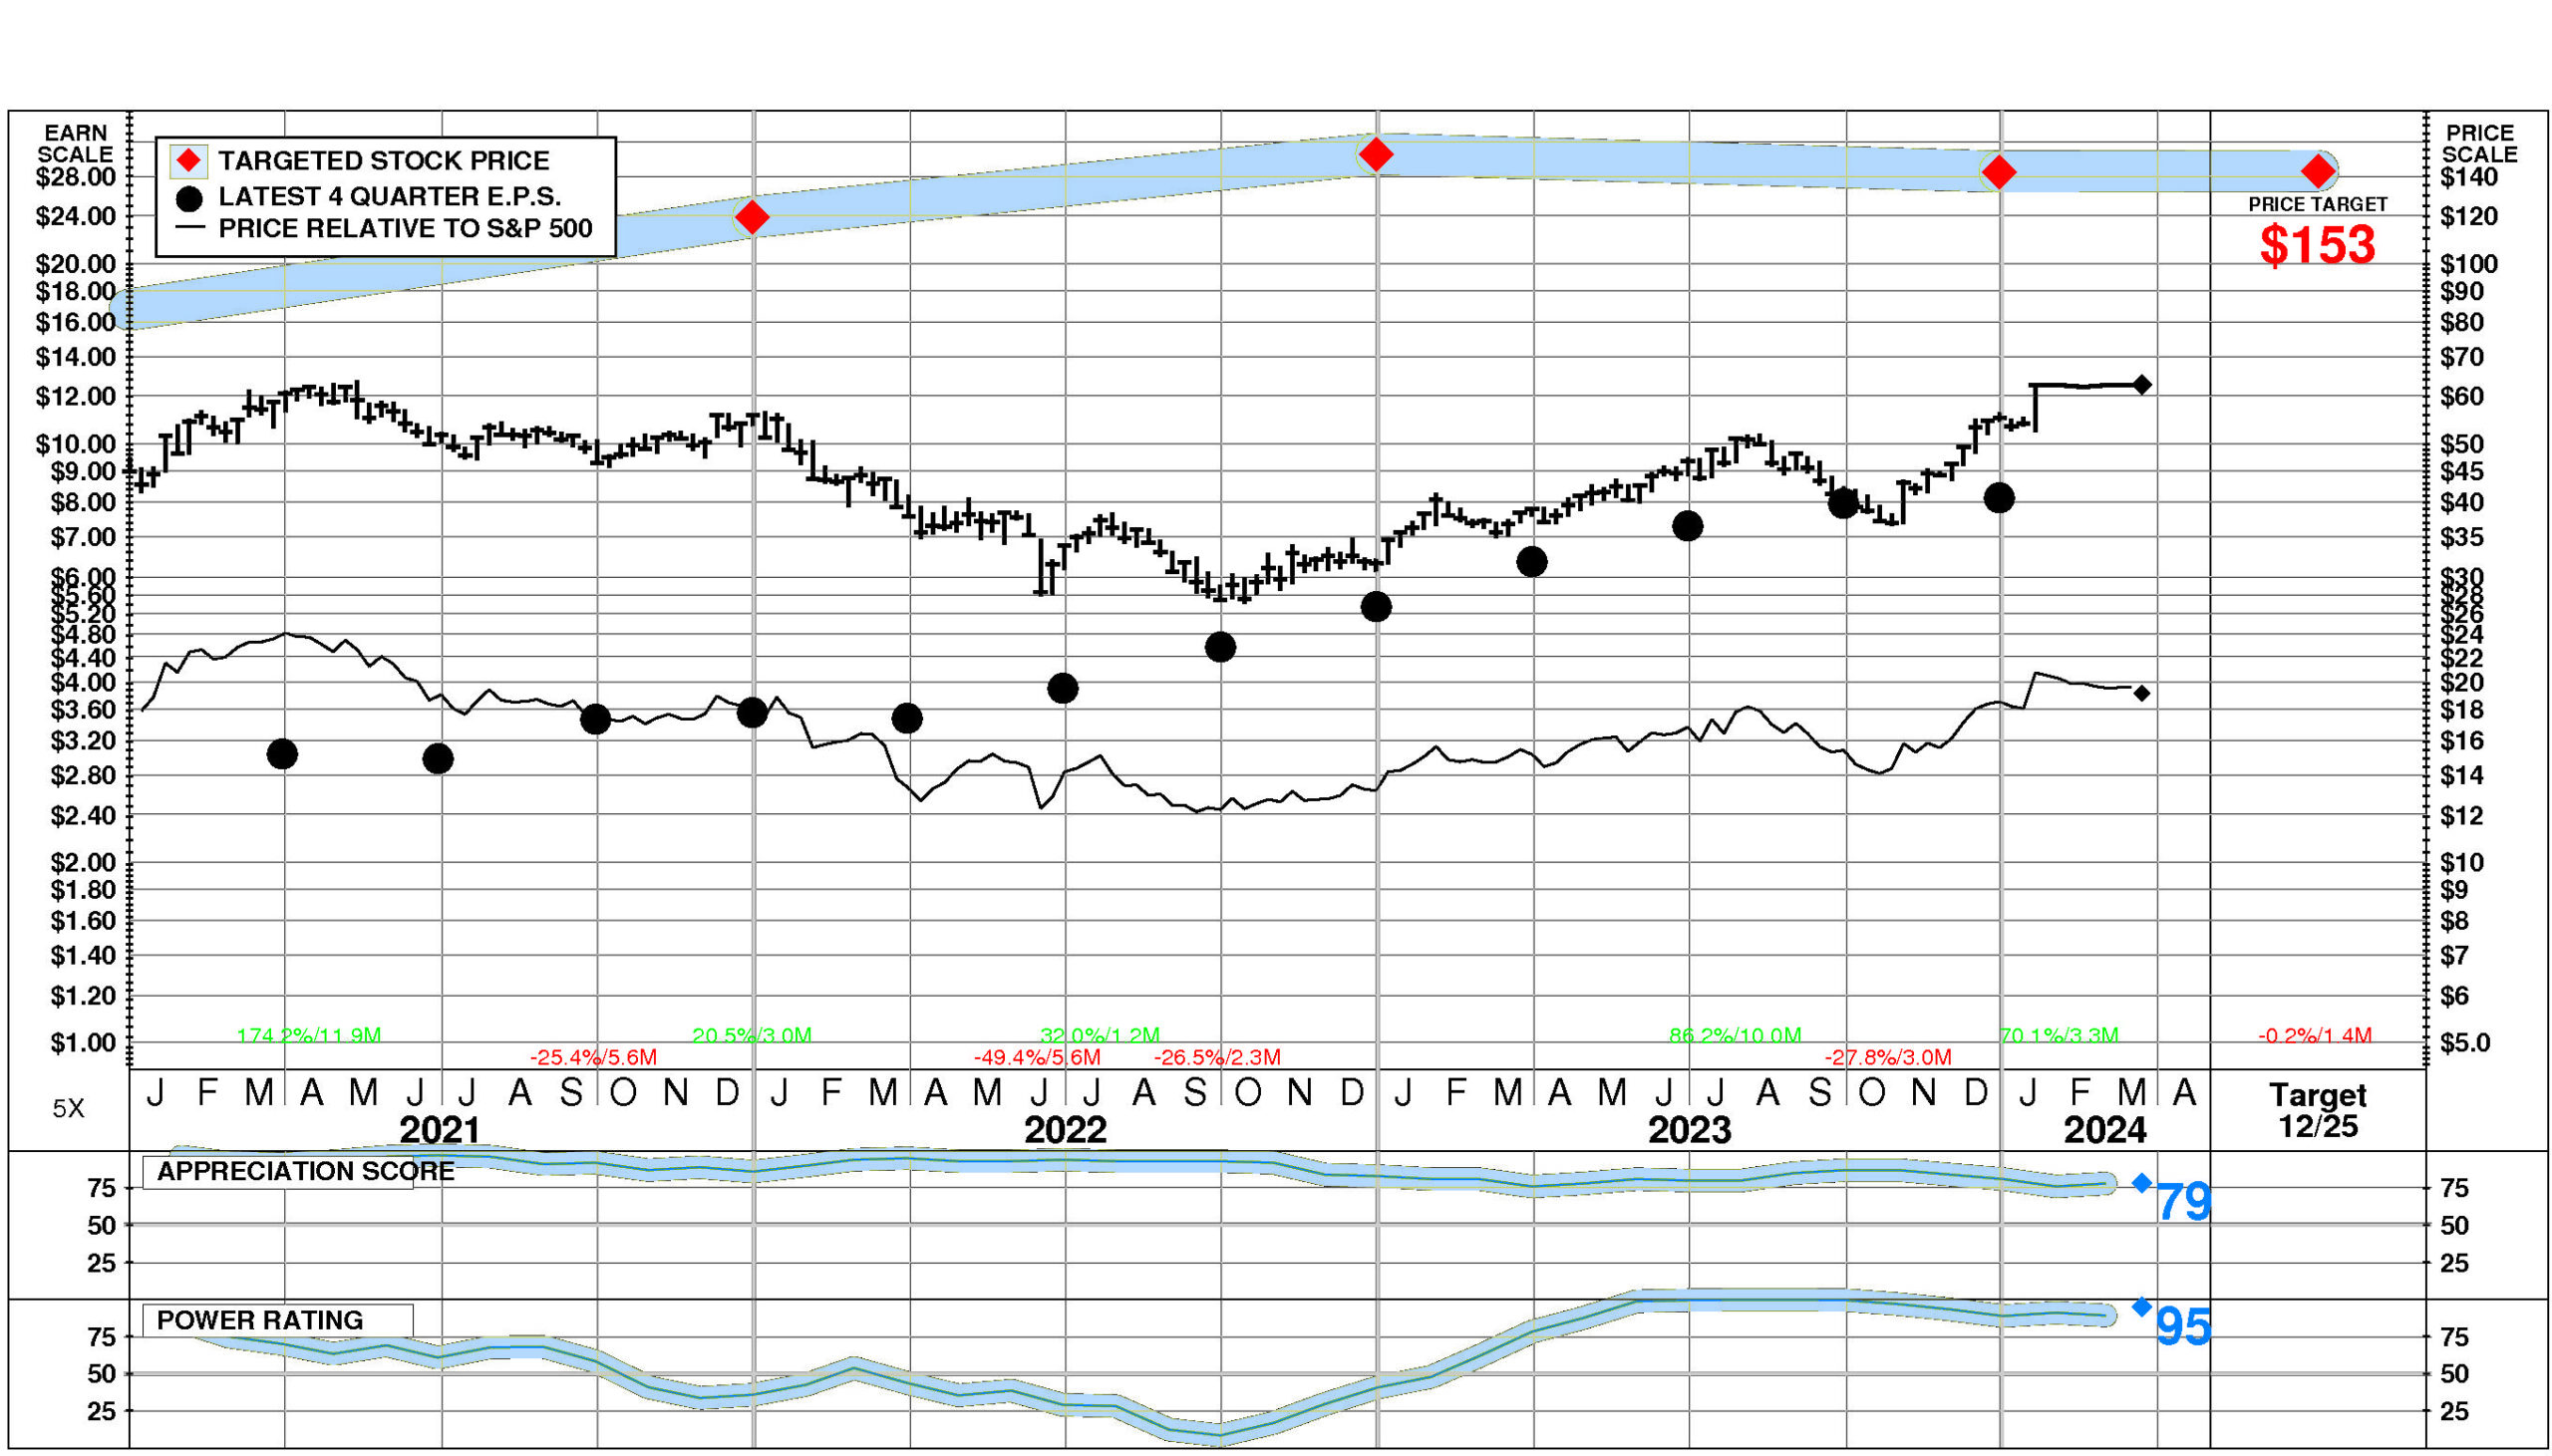
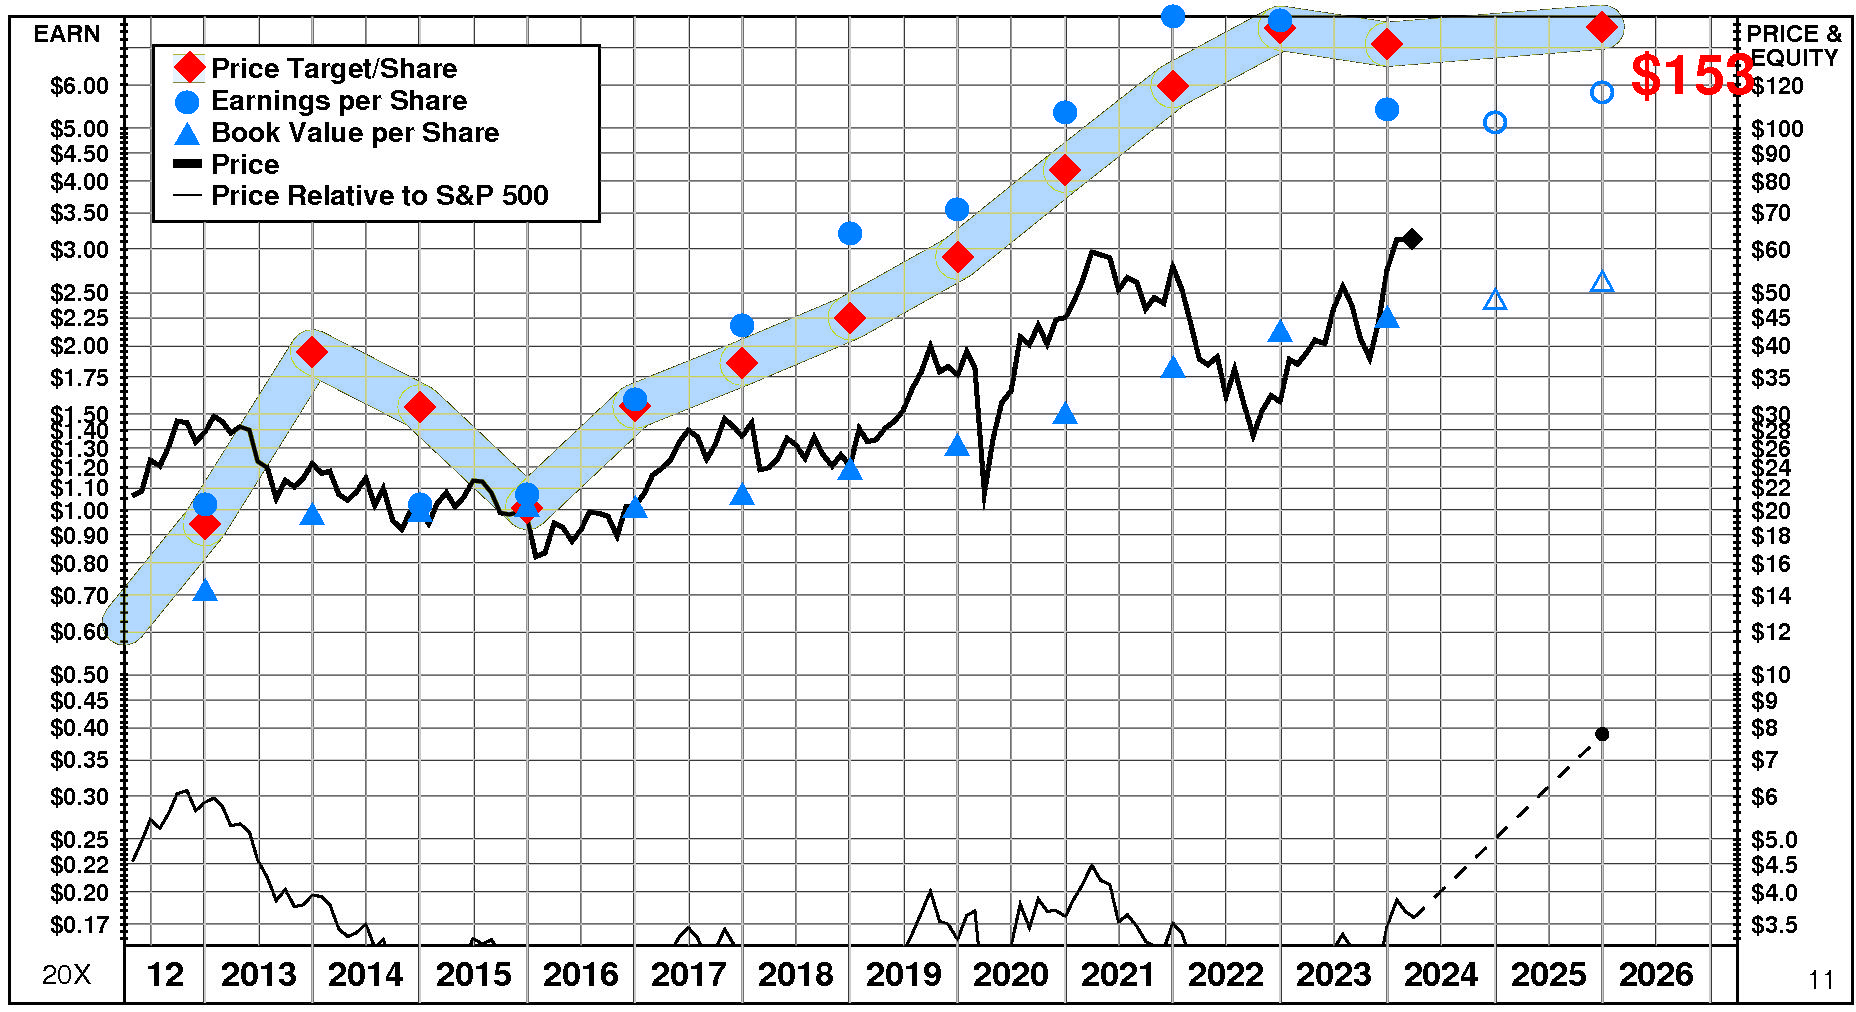
M.D.C. Holdings’ stock is selling well below targeted value. The current stock price of $62.87 compares to targeted value 12 months forward of $143.
M.D.C. Holdings’ high appreciation potential results in an appreciation score of 79 (only 21% of the universe has greater appreciation potential.)
M.D.C. Holdings has a Power Rating of 95. (This very high Power Rating indicates that MDC has a better chance of achieving attractive investment performance over the near to intermediate term than all but 5% of companies in the universe.)
Factors contributing to this very high Power Rating include: recent price action has been extremely favorable; the Operative Builders comparison group is in an extremely strong phase currently; and earnings estimate behavior for MDC has been slightly favorable recently.
INVESTMENT PROFILE
MDC’s financial strength is exceptional. Financial strength rating is 98.
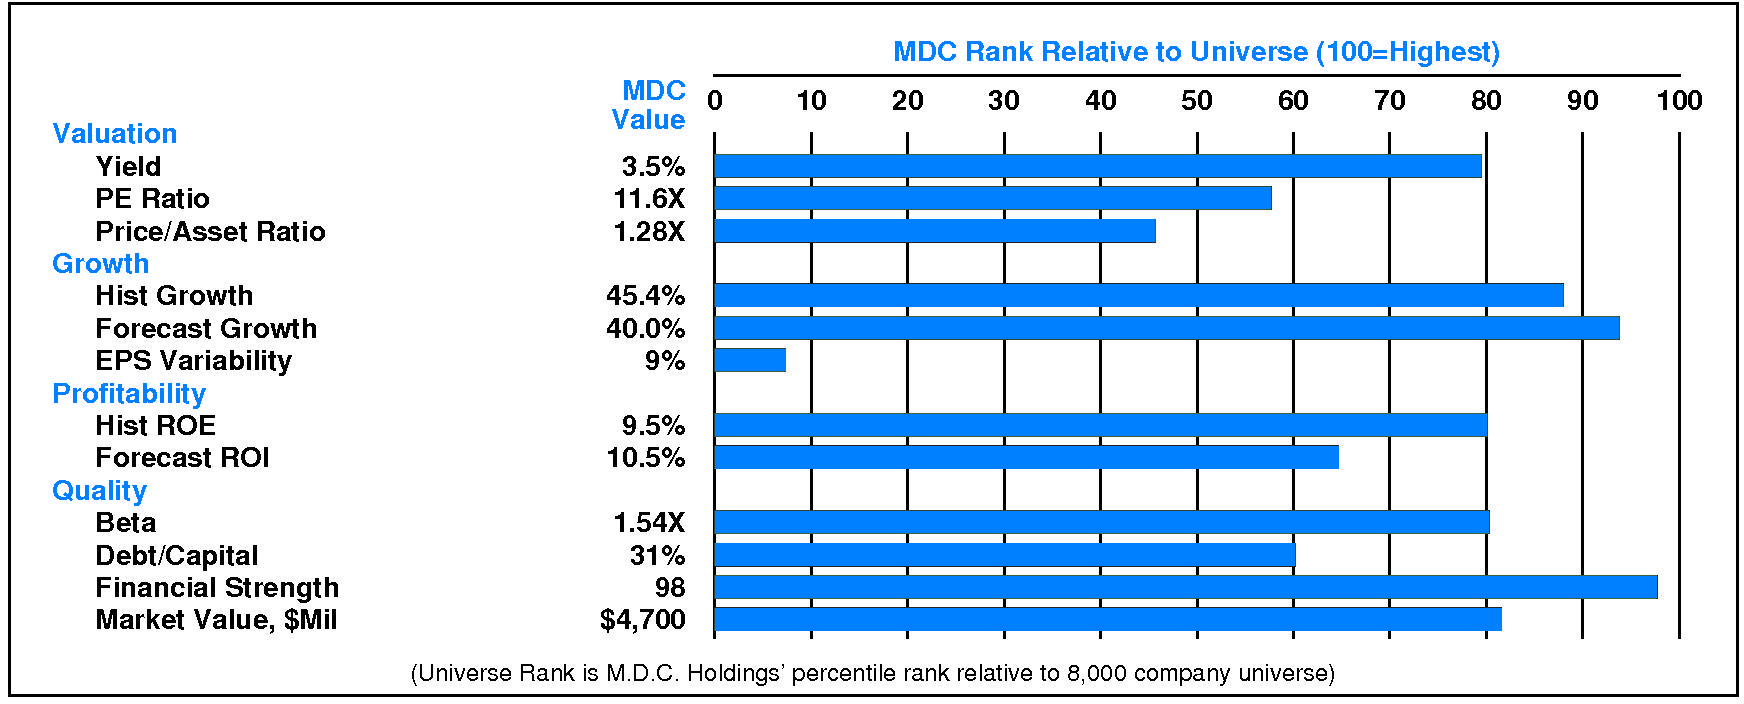
Relative to the S&P 500 Composite, M.D.C. Holdings Inc. has both Growth and Value characteristics; its appeal is likely to be to investors heavily oriented toward Income; the perception is that MDC is lower risk. Relative weaknesses include: low forecasted profitability, and high stock price volatility. MDC’s valuation is low: high dividend yield, low P/E ratio, and low price/book ratio. MDC has unusually low market capitalization.
CURRENT SIGNALS
M.D.C. Holdings’ current operations are eroding. Return on equity is falling, reflecting: falling asset utilization; declining pretax margin; falling tax keep rate; and falling leverage.
M.D.C. Holdings’ current technical position is very strong. The stock price is in a 3.3 month up move. The stock has appreciated 70.1% from its prior low. The stock price is above its 200 day moving average which is in an uptrend.
ALERTS
M.D.C. Holdings Inc. (NYSE: MDC). Marginal negative changes in fundamentals have recently occurred: significant quarterly sales deceleration occurred.
The stock is currently rated A.
M.D.C. Holdings Inc. (NYSE: MDC) stock rose slightly by 0.1% on 3/21/24. The stock closed at $62.87. However, below average trading volume at 74% of normal accompanied the advance. The stock has been exceptionally strong relative to the market over the last nine months and is unchanged during the last week.
CASH FLOW
In 2023, M.D.C. Holdings generated a very significant increase in cash of +$925.8 million (+129%). Sources of cash were much larger than uses. Cash generated from 2023 EBITDA totaled +$461.4 million. Non-operating sources contributed +$160.2 million (+35% of EBITDA). Cash taxes consumed -$125.1 million (-27% of EBITDA). Withdrawal of investment from the business totaled +$587.6 million (+127% of EBITDA). On a net basis, debt investors withdrew -$43.4 million (-9% of EBITDA) while equity investors received -$114.9 million (-25% of EBITDA).
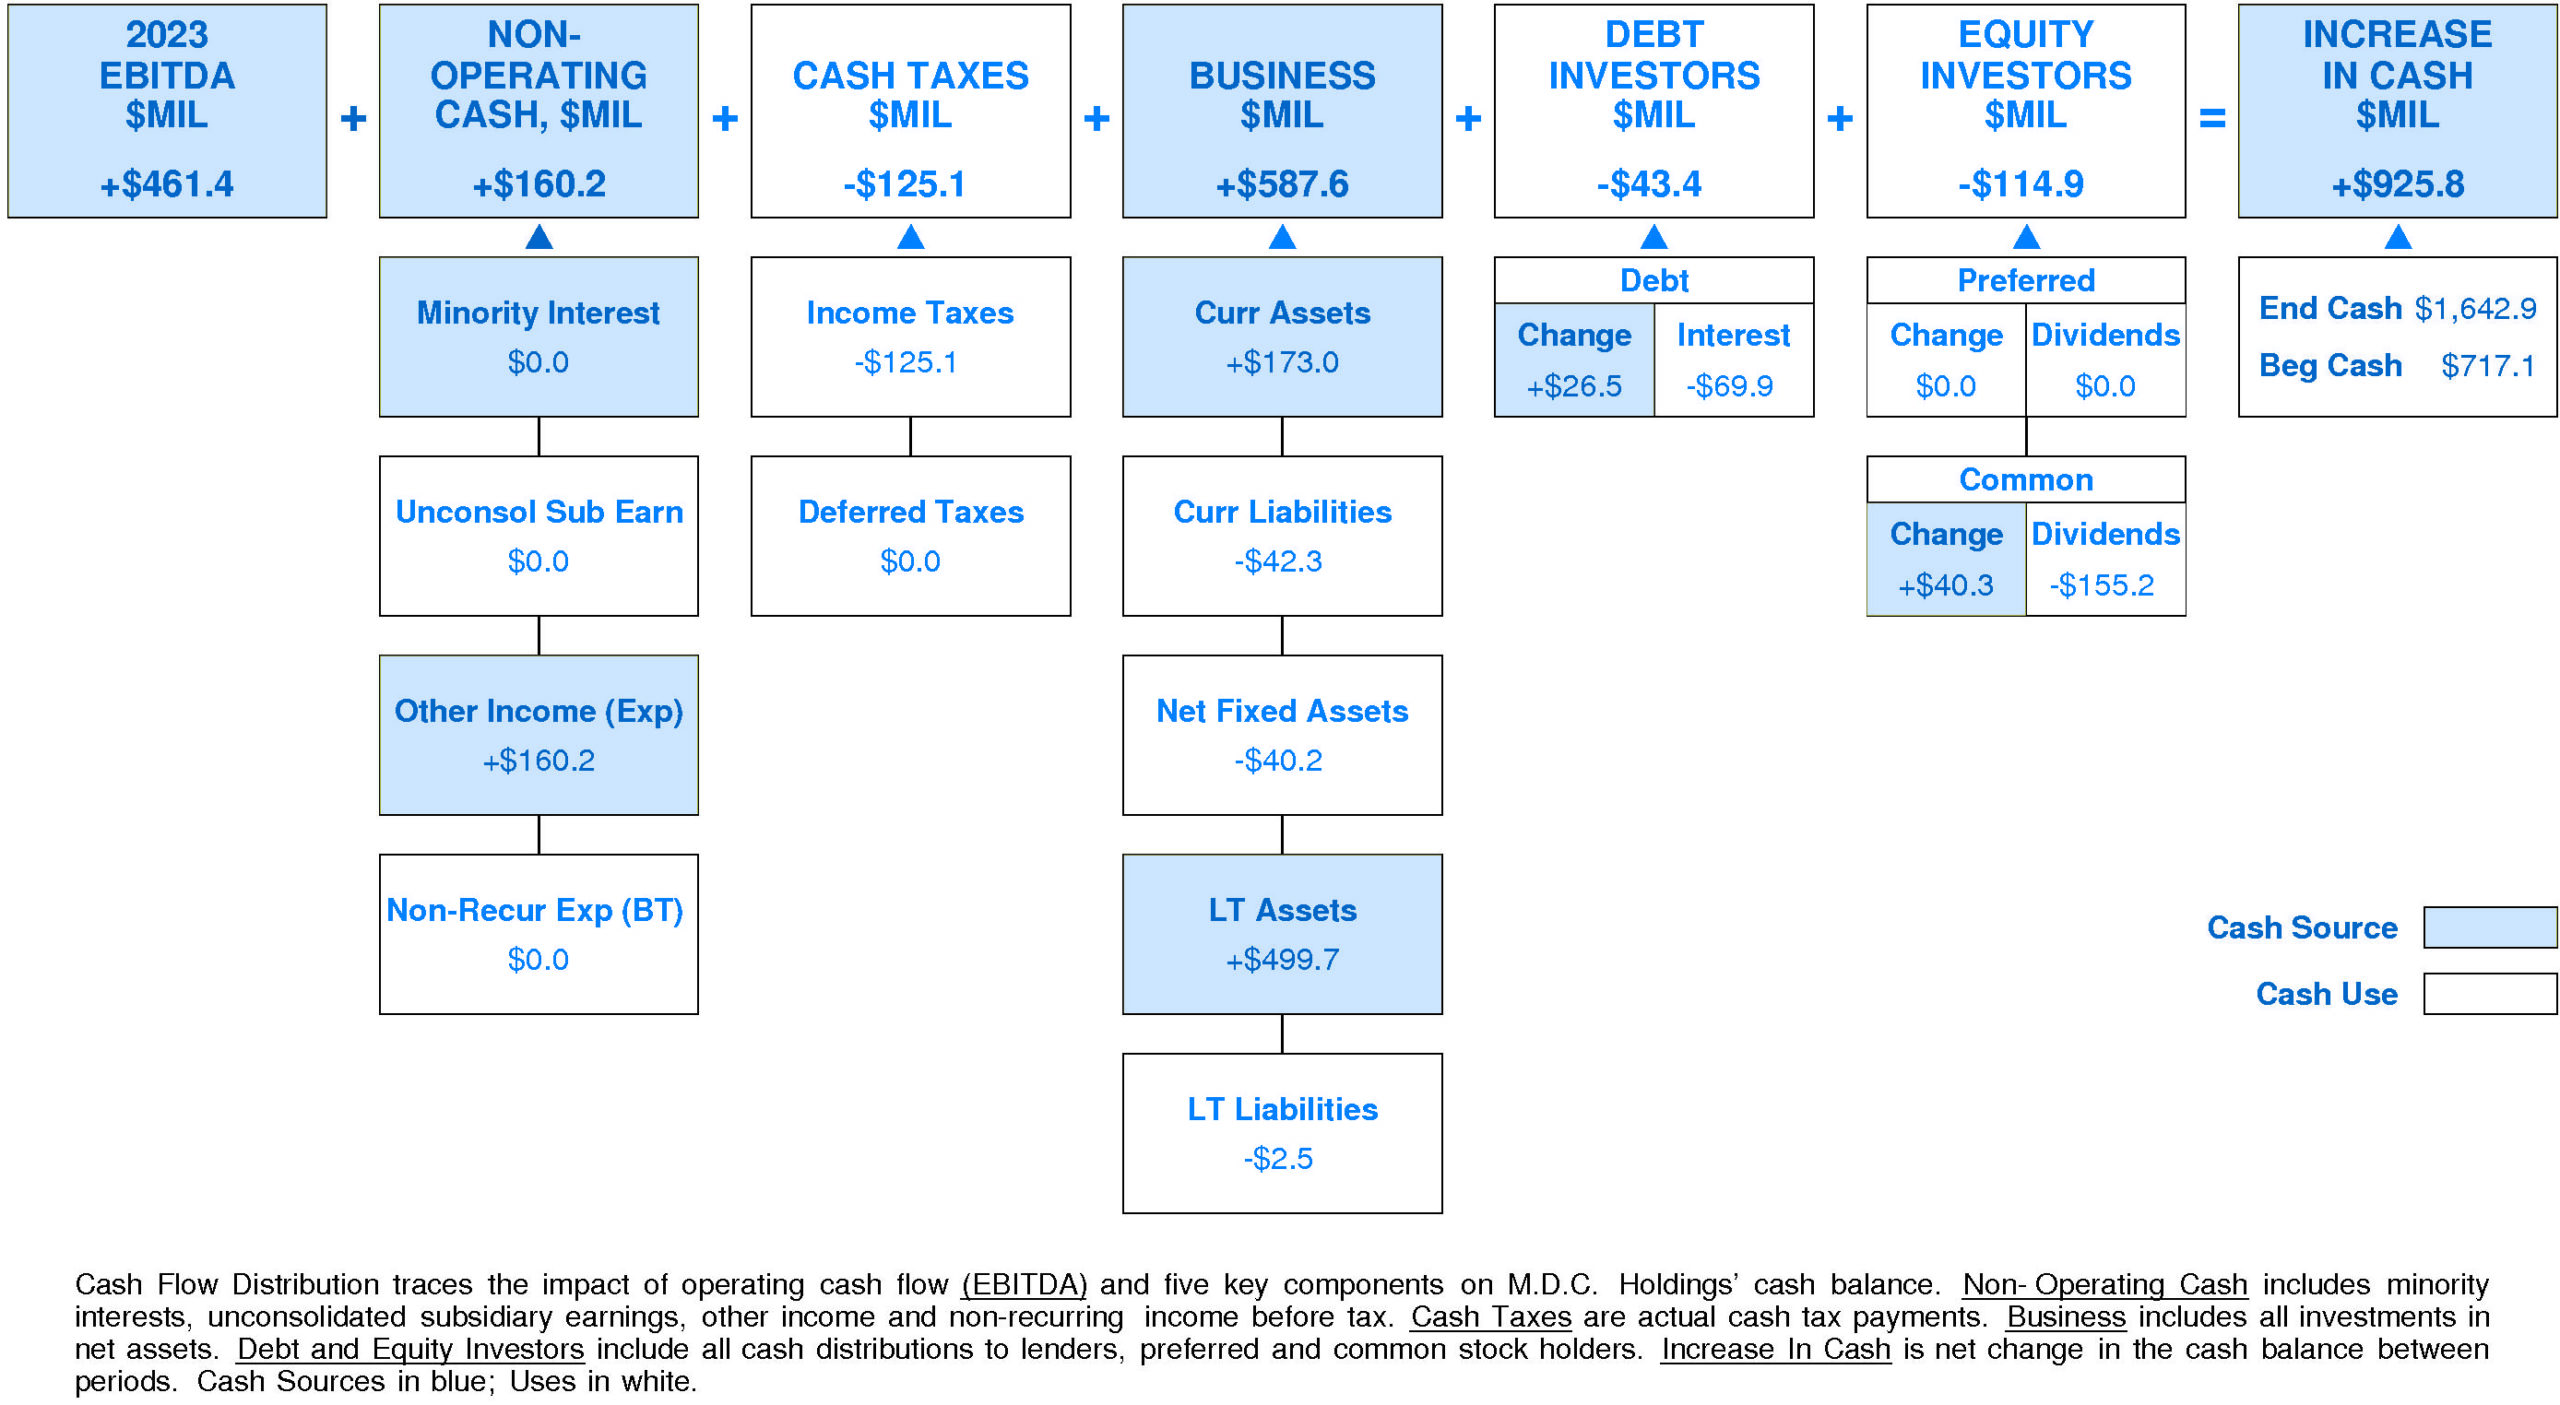
M.D.C. Holdings’ Non-operating Income, %EBITDA has suffered a very strong overall downtrend over the period. This downtrend was accompanied by an opposite trend for the M.D.C. Holdings Peer Group. (Since 2021 Non-operating Income, %EBITDA has experienced a very sharp recovery.) In most years, M.D.C. Holdings was in the top quartile. Currently, M.D.C. Holdings is upper quartile at +35% of EBITDA (+$160.2 million).
M.D.C. Holdings’ Cash Taxes, %EBITDA has exhibited a minor overall uptrend over the period. This improvement was accompanied by a similar trend for the M.D.C. Holdings Peer Group. (Since 2020 Cash Taxes, %EBITDA has experienced a sharp decline.) In most years, M.D.C. Holdings was in the lower quartile. Currently, M.D.C. Holdings is lower quartile at -27% of EBITDA (-$125.1 million).
M.D.C. Holdings’ Business Re-investment, %EBITDA has suffered a volatile overall downtrend over the period. This downtrend was accompanied by a similar trend for the M.D.C. Holdings Peer Group. (Since 2021 Business Re-investment, %EBITDA has experienced a very sharp recovery.) In most years, M.D.C. Holdings was in the third quartile and second quartile. Currently, M.D.C. Holdings is upper quartile at +127% of EBITDA (+$587.6 million).
M.D.C. Holdings’ Debt Investors, %EBITDA has experienced a very strong overall uptrend over the period. This improvement was accompanied by stability for the M.D.C. Holdings Peer Group. In most years, M.D.C. Holdings was in the lower quartile and second quartile. Currently, M.D.C. Holdings is slightly above median at -9% of EBITDA (-$43.4 million).
M.D.C. Holdings’ Equity Investors, %EBITDA has enjoyed a strong overall uptrend over the period. This improvement was accompanied by stability for the M.D.C. Holdings Peer Group. In most years, M.D.C. Holdings was in the third quartile and second quartile. Currently, M.D.C. Holdings is substantially below median at -25% of EBITDA (-$114.9 million).
M.D.C. Holdings’ Change in Cash, %EBITDA has experienced a volatile overall uptrend over the period. This improvement was accompanied by a similar trend for the M.D.C. Holdings Peer Group. (Since 2018 Change in Cash, %EBITDA has accelerated very sharply.) In most years, M.D.C. Holdings was in the top quartile and second quartile. Currently, M.D.C. Holdings is upper quartile at +201% of EBITDA (+$925.8 million).
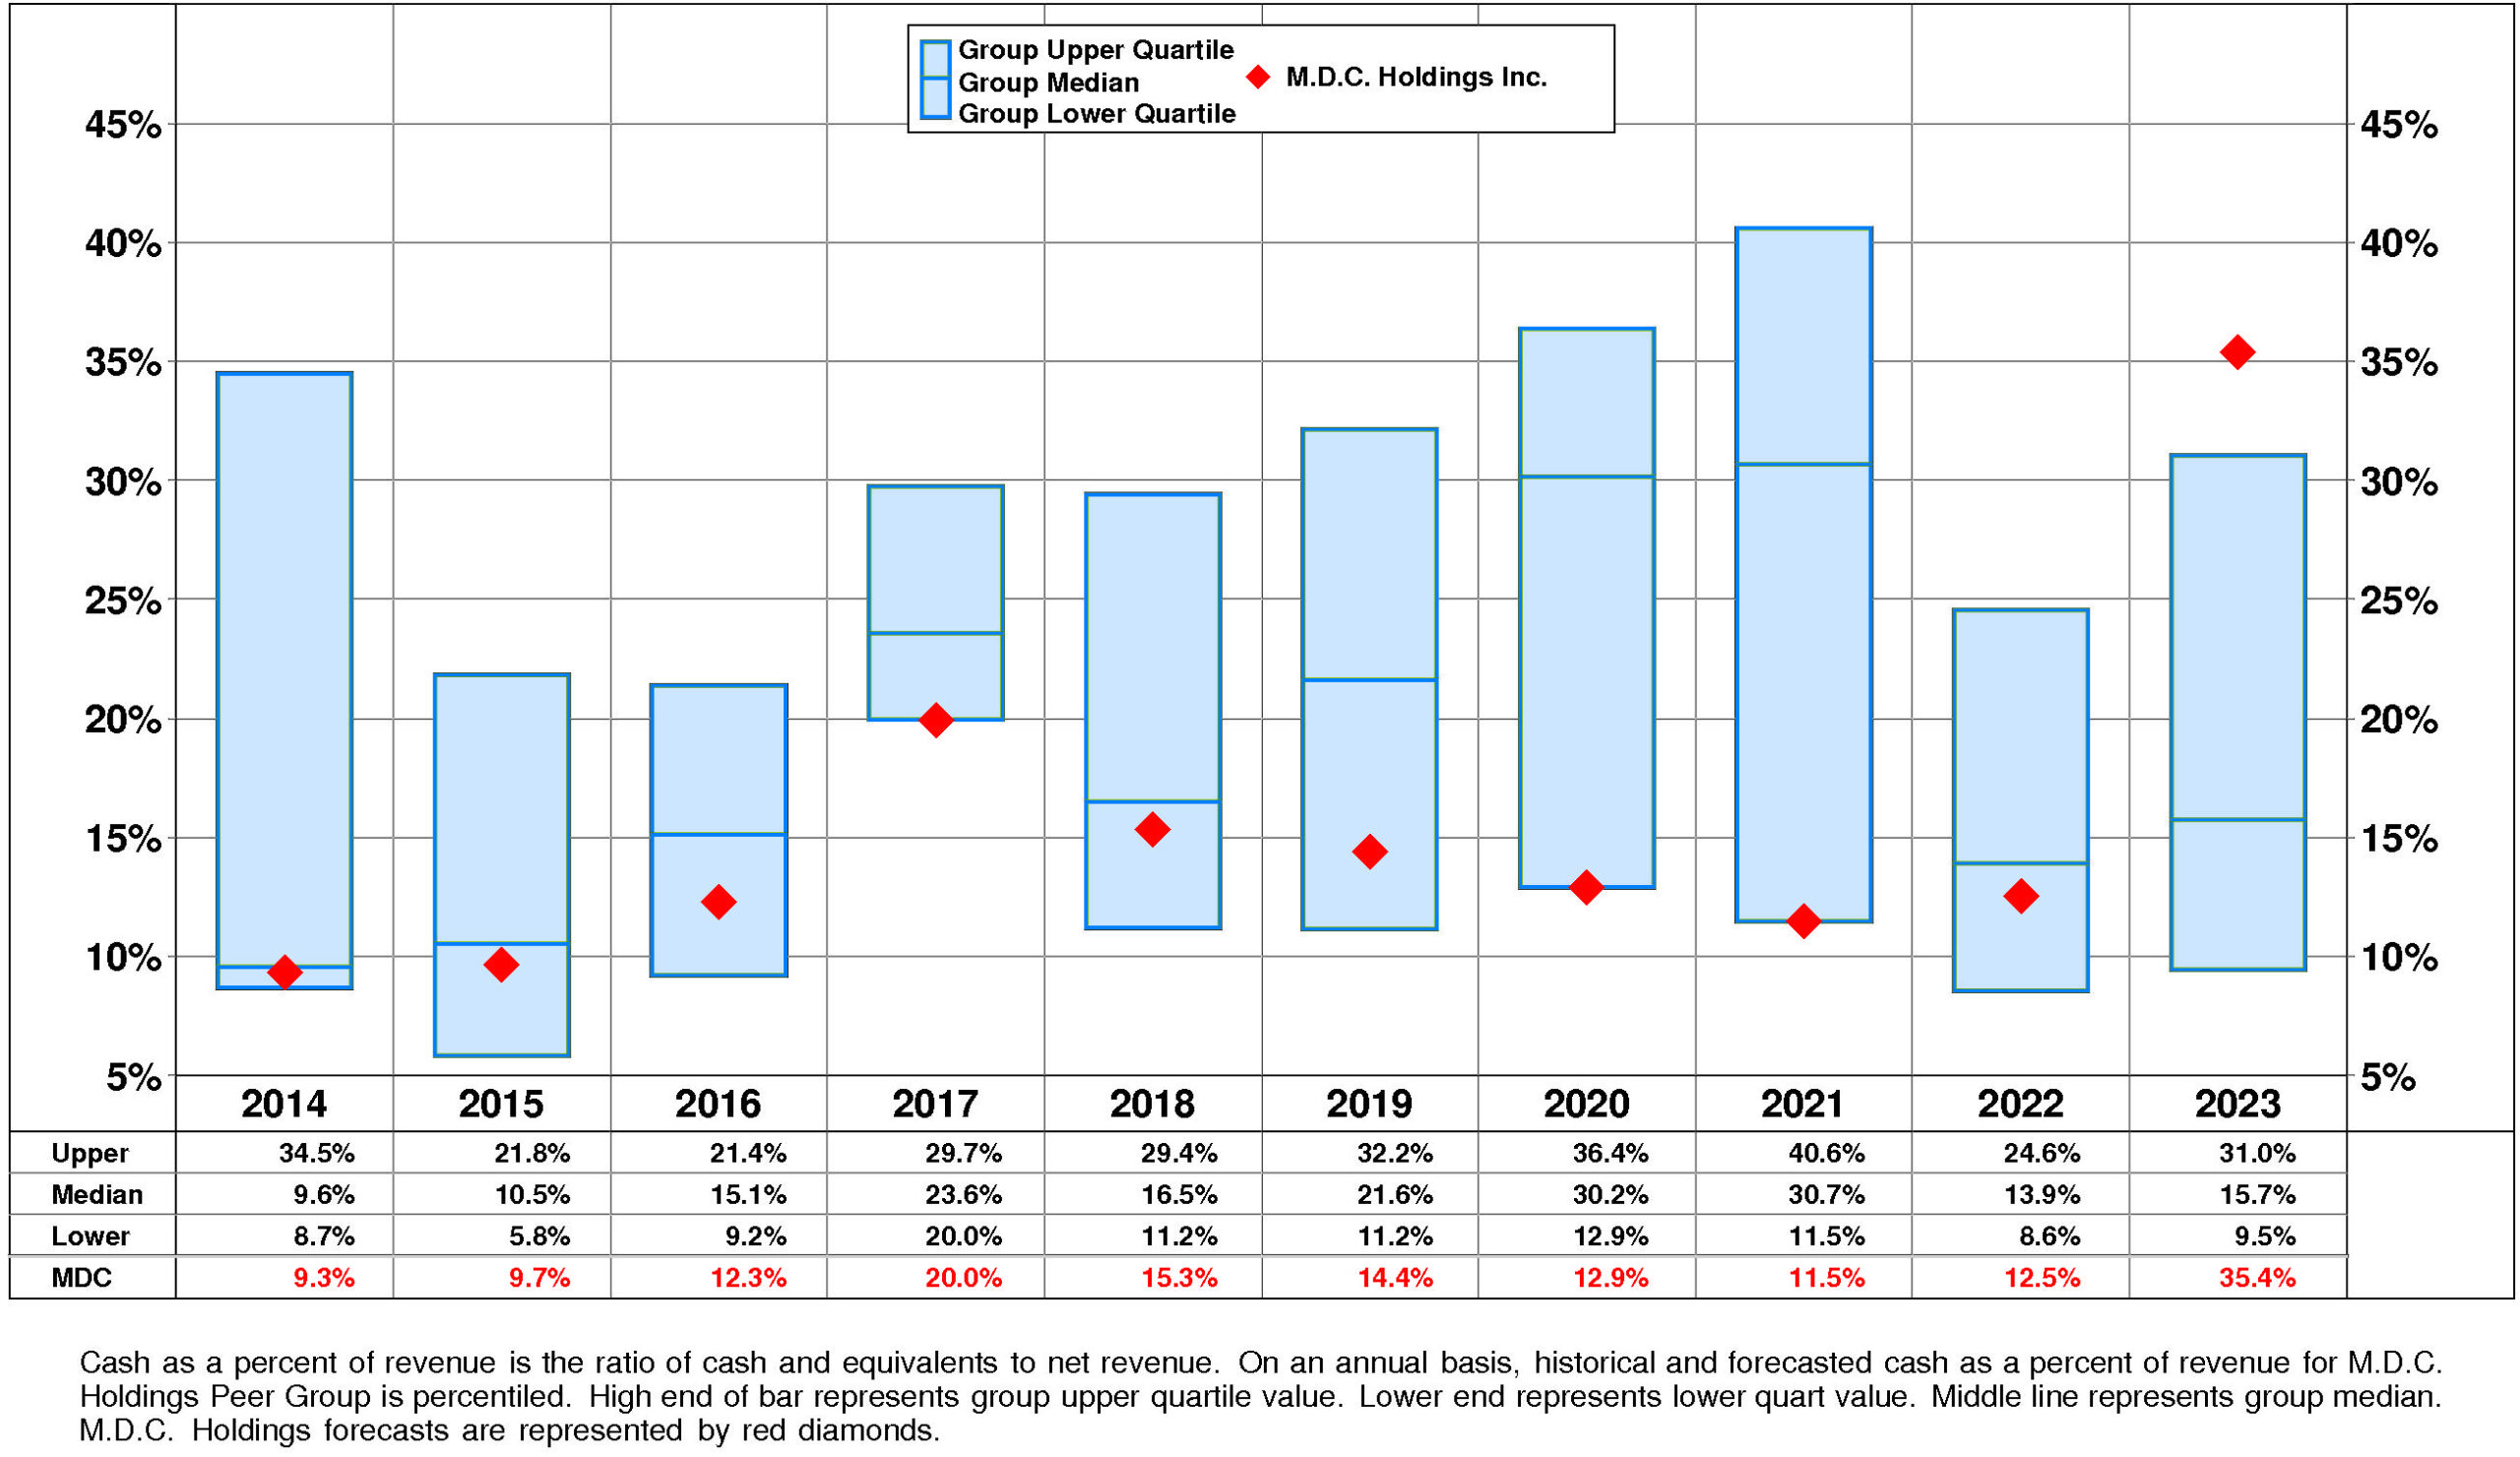
M.D.C. Holdings’ Cash, %Revenue has exhibited a very small overall uptrend over the period. This improvement was accompanied by a similar trend for the M.D.C. Holdings Peer Group. (Since 2021 Cash, %Revenue has accelerated very sharply.) In most years, M.D.C. Holdings was in the third quartile. Currently, M.D.C. Holdings is upper quartile at +35%.
PROFITABILITY
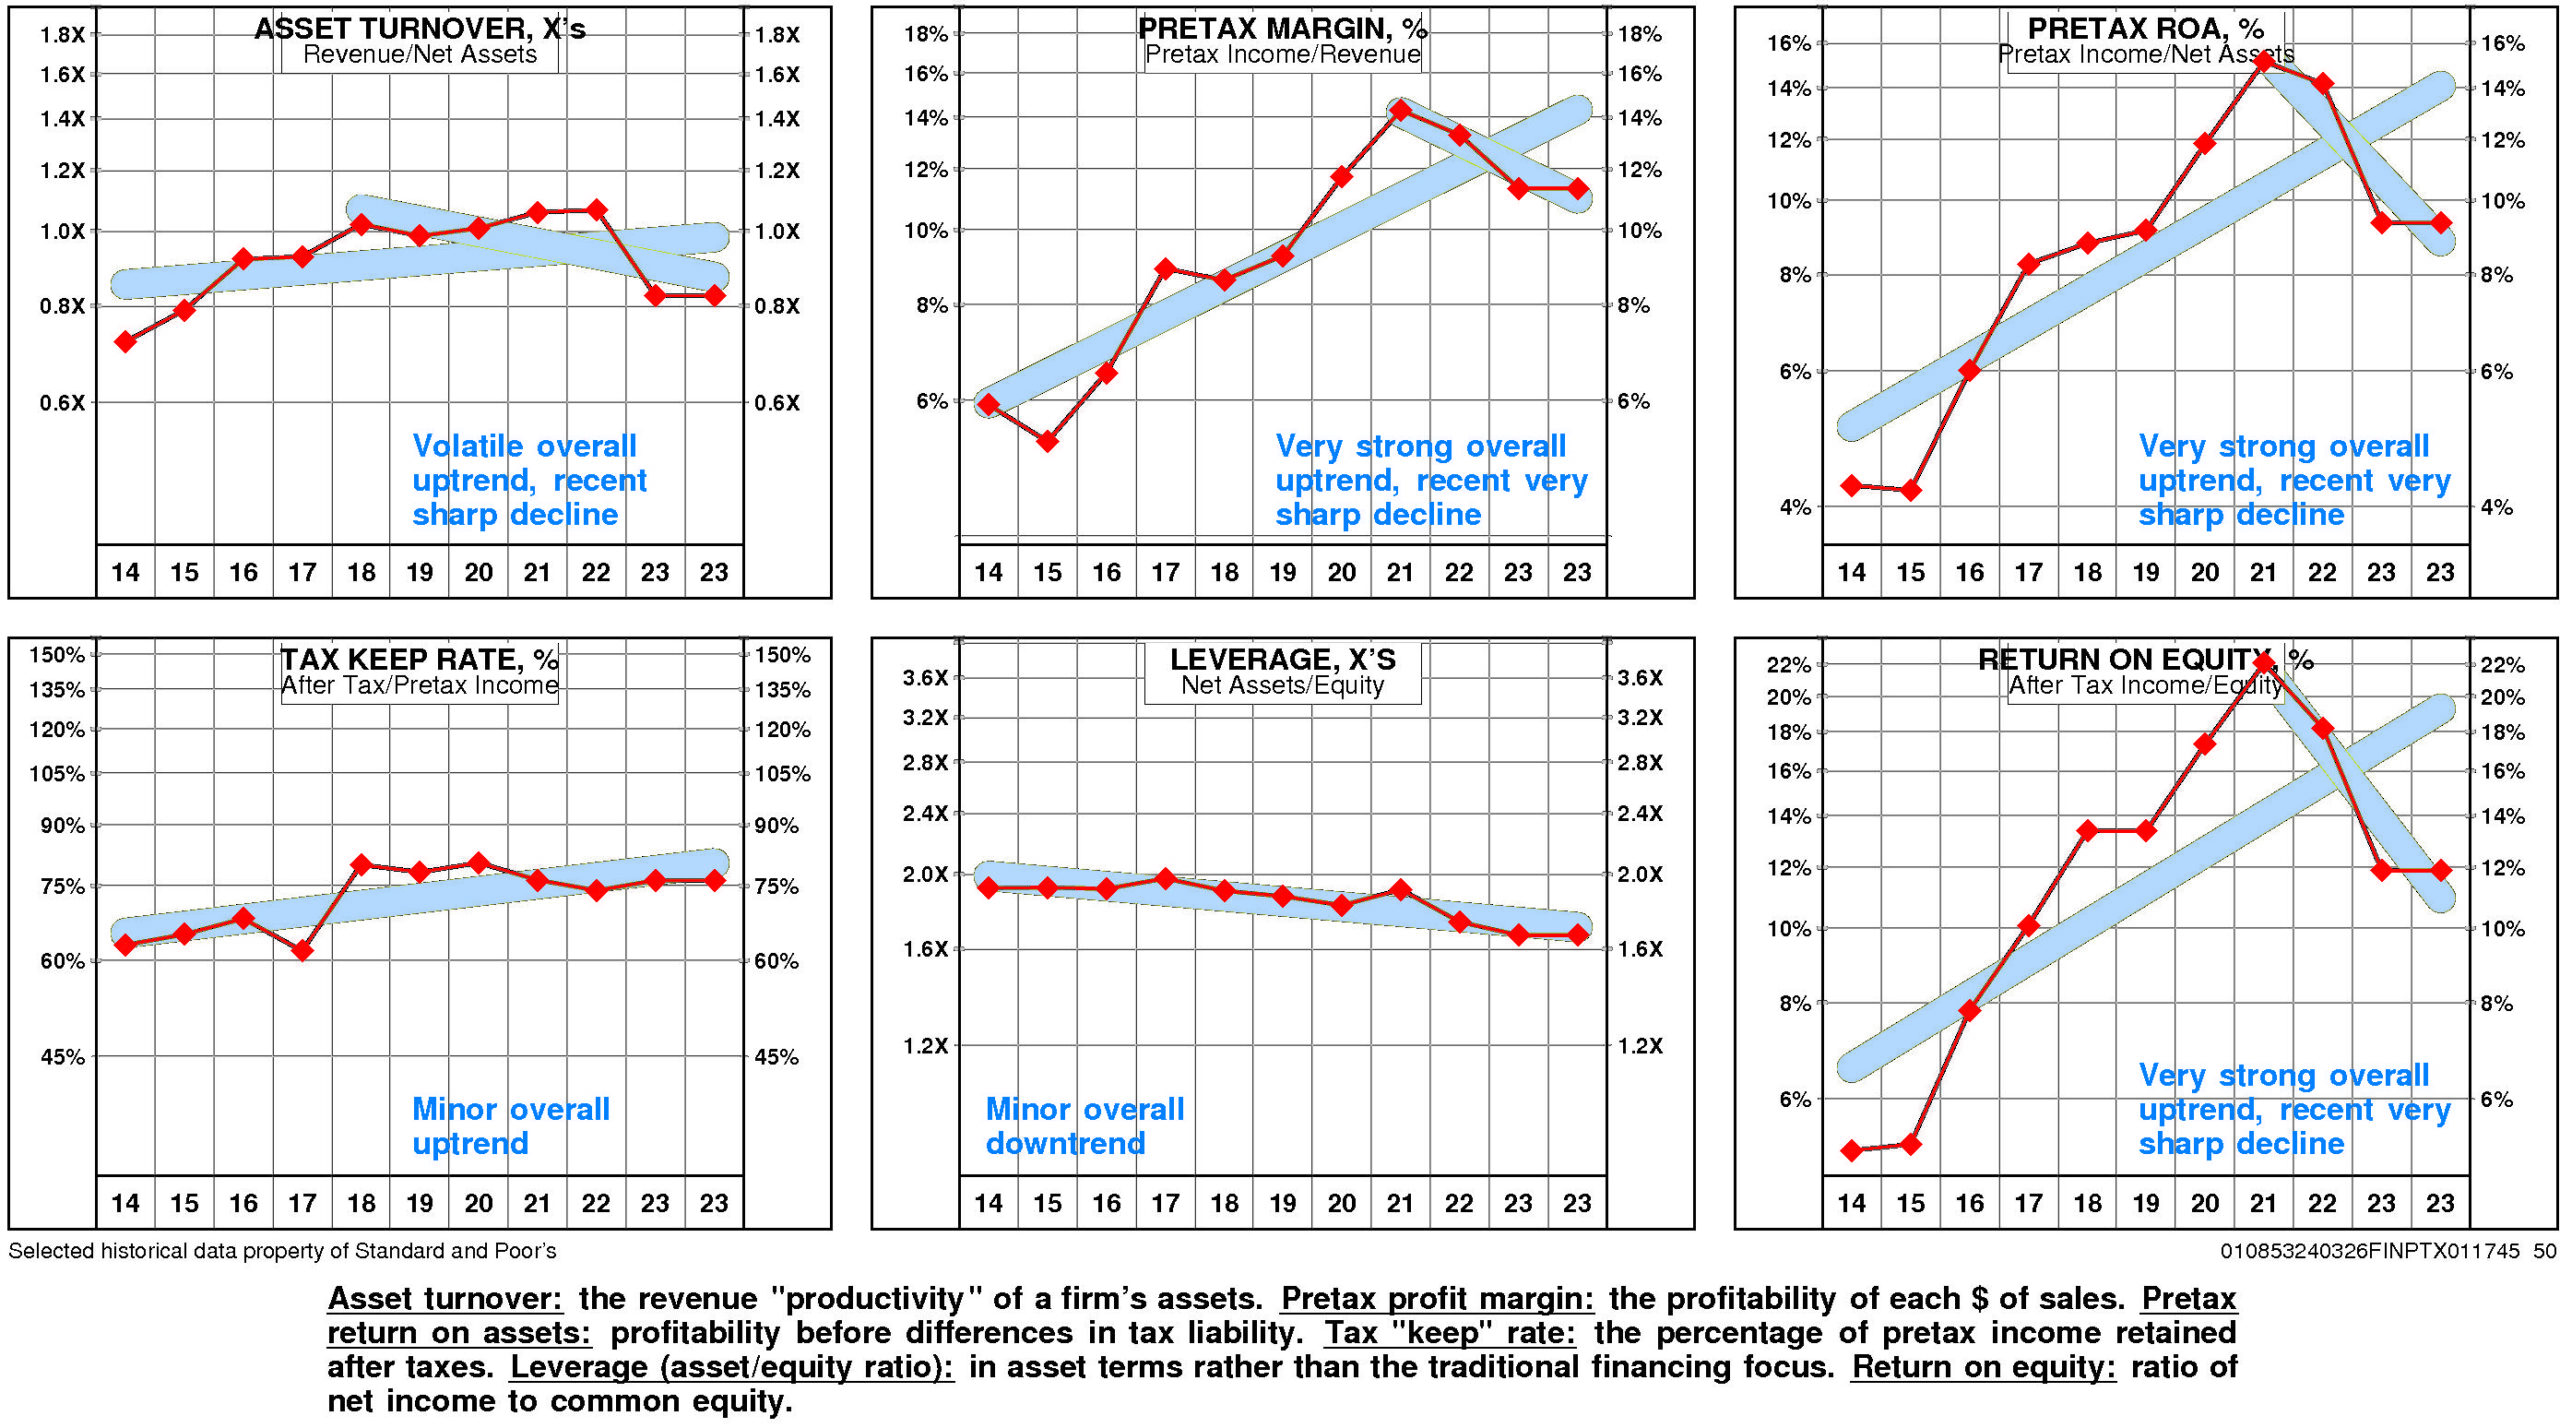
M.D.C. Holdings’ return on equity has improved very significantly since 2014. The current level of 11.9% is 2.31X the low for the period and is -11.2% from the high.
This very significant improvement was due to very strong positive trend in pretax operating return and very minor positive trend in non-operating factors.
The productivity of M.D.C. Holdings’ assets rose over the full period 2014-2023: asset turnover has exhibited a volatile overall uptrend although it experienced a sharp decline after the 2022 high.
Reinforcing this trend, pretax margin enjoyed a very strong overall uptrend even as it experienced a very sharp decline after the 2021 high.
Non-operating factors (income taxes and financial leverage) had a very small positive influence on return on equity.
M.D.C. Holdings’ return on equity is at median (11.9%) for the four quarters ended December, 2023.
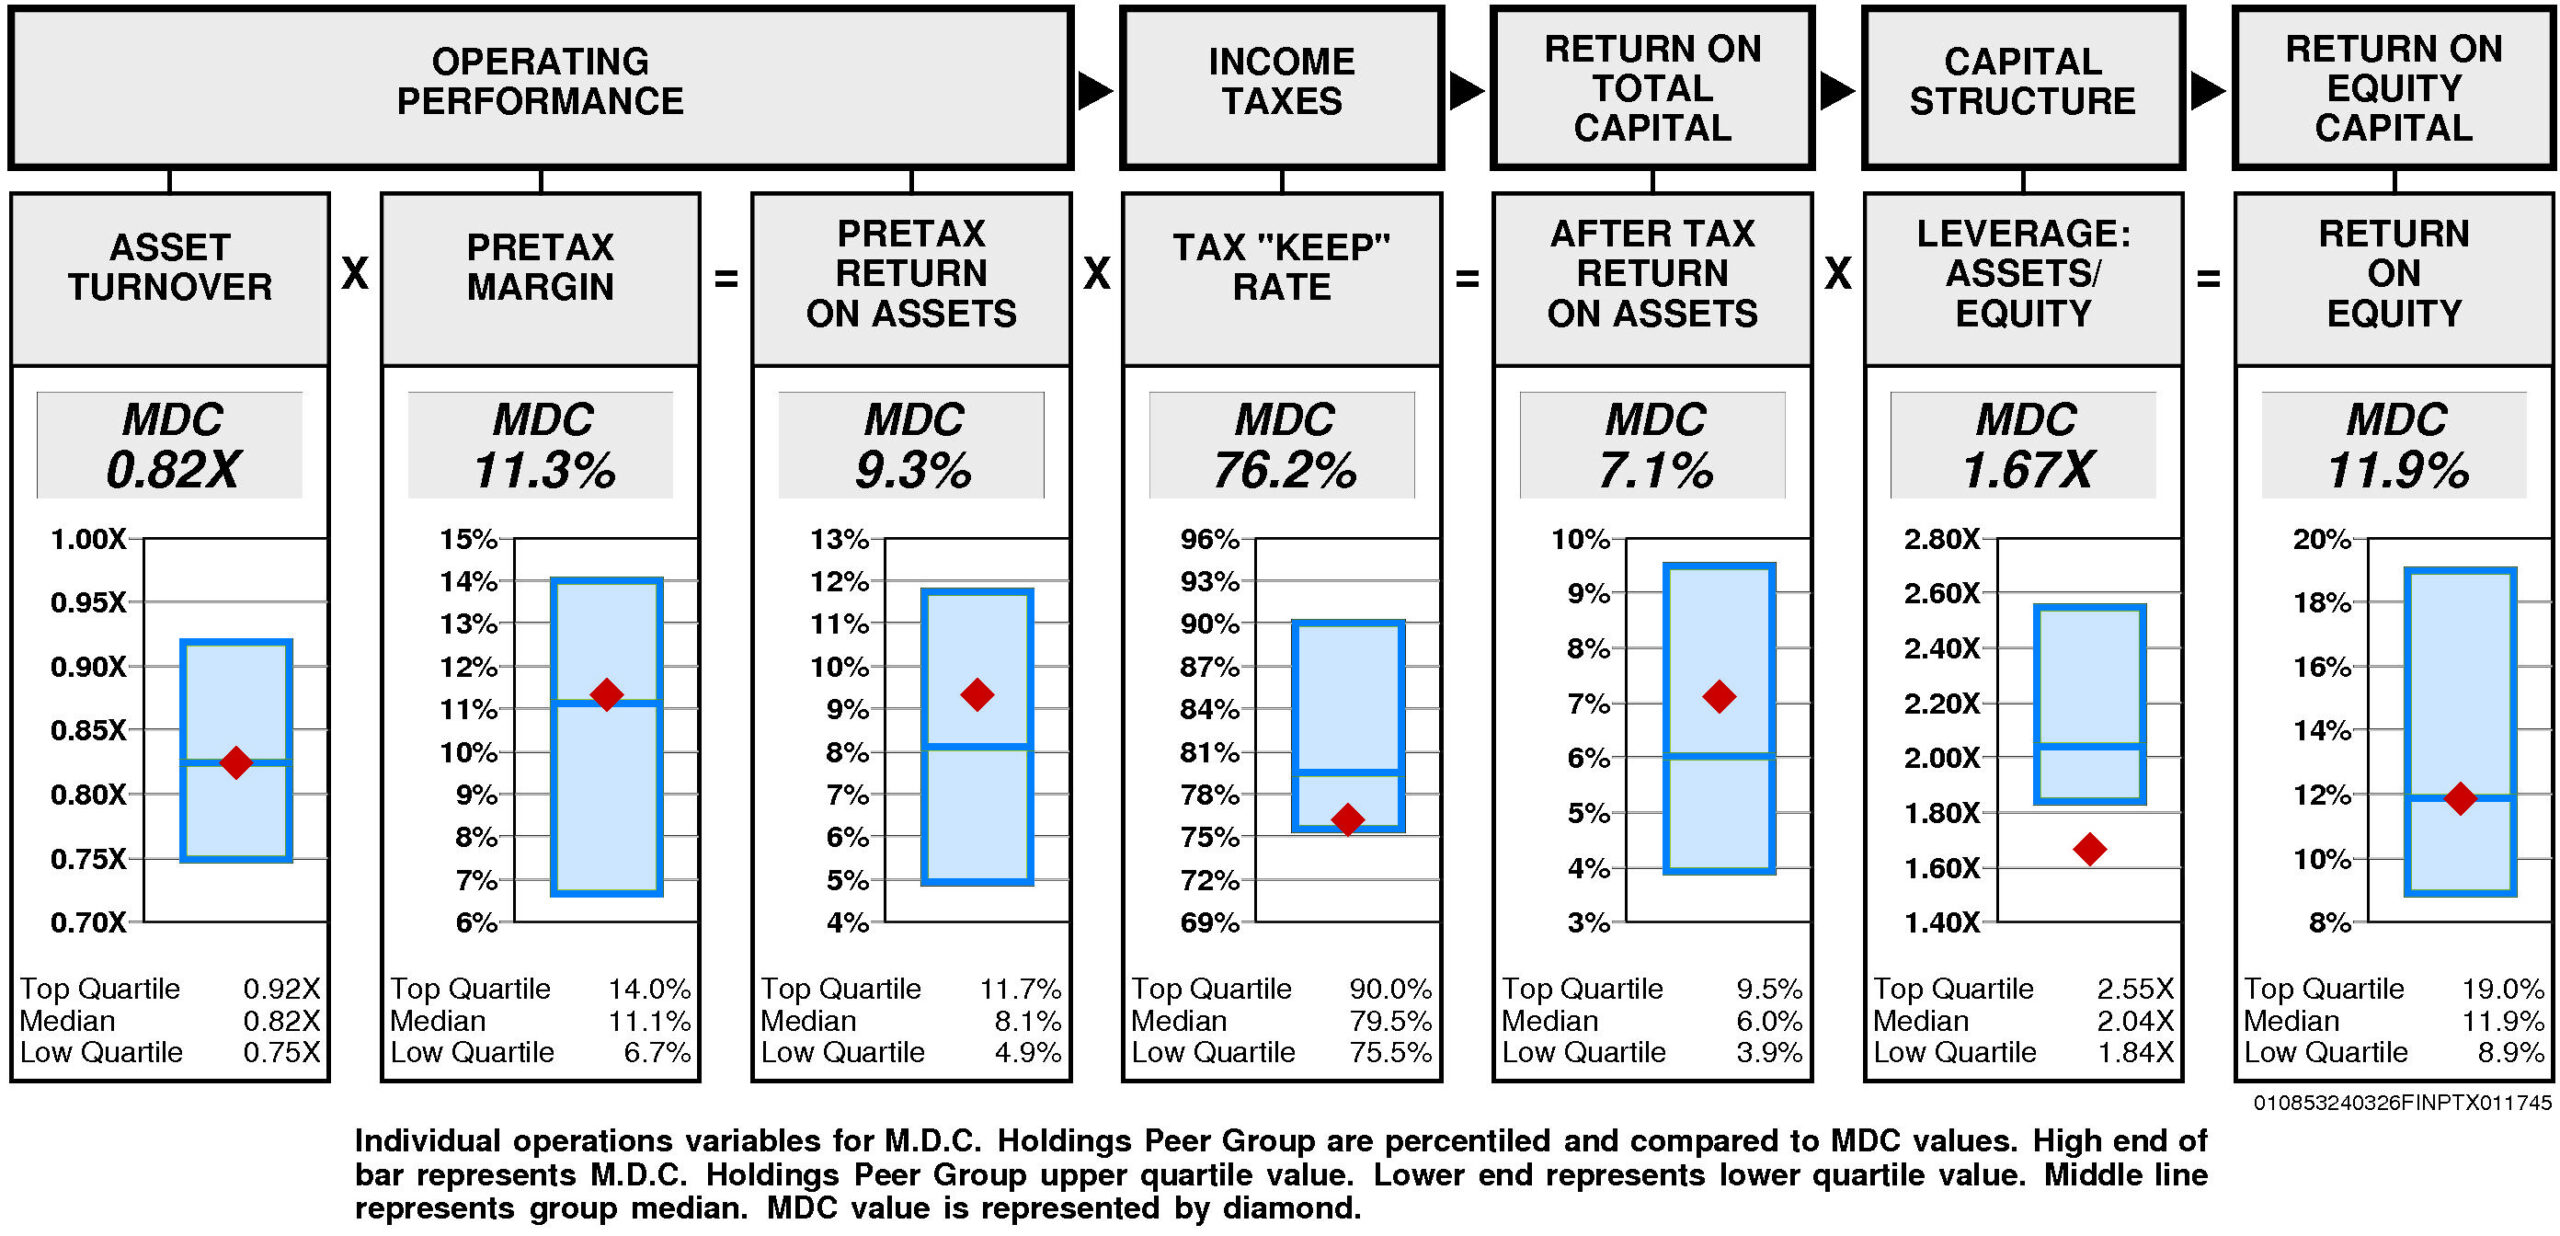
Operating performance (pretax return on assets) is above median (9.3%) reflecting asset turnover that is at median (0.82X) and at median pretax margin (11.3%).
Tax “keep” rate (income tax management) is at the lower quartile (76.2%) resulting in after tax return on assets that is above median.
Financial leverage (leverage) is lower quartile (1.67X).
GROWTH RATES
Overall, M.D.C. Holdings’ growth rate has slowed considerably in recent years.
M.D.C. Holdings’ historical income statement growth and balance sheet growth have diverged. Revenue growth has paralleled asset growth; earnings growth has exceeded equity growth.
Annual revenue growth has been 10.5% per year. (More recently it has been -5.9%.)
Total asset growth has been 8.9% per year.
Annual E.P.S. growth has been 22.7% per year. (More recently it has been -16.2%.)
Equity growth has been 10.6% per year.
No consensus growth rate forecast is available for M.D.C. Holdings.
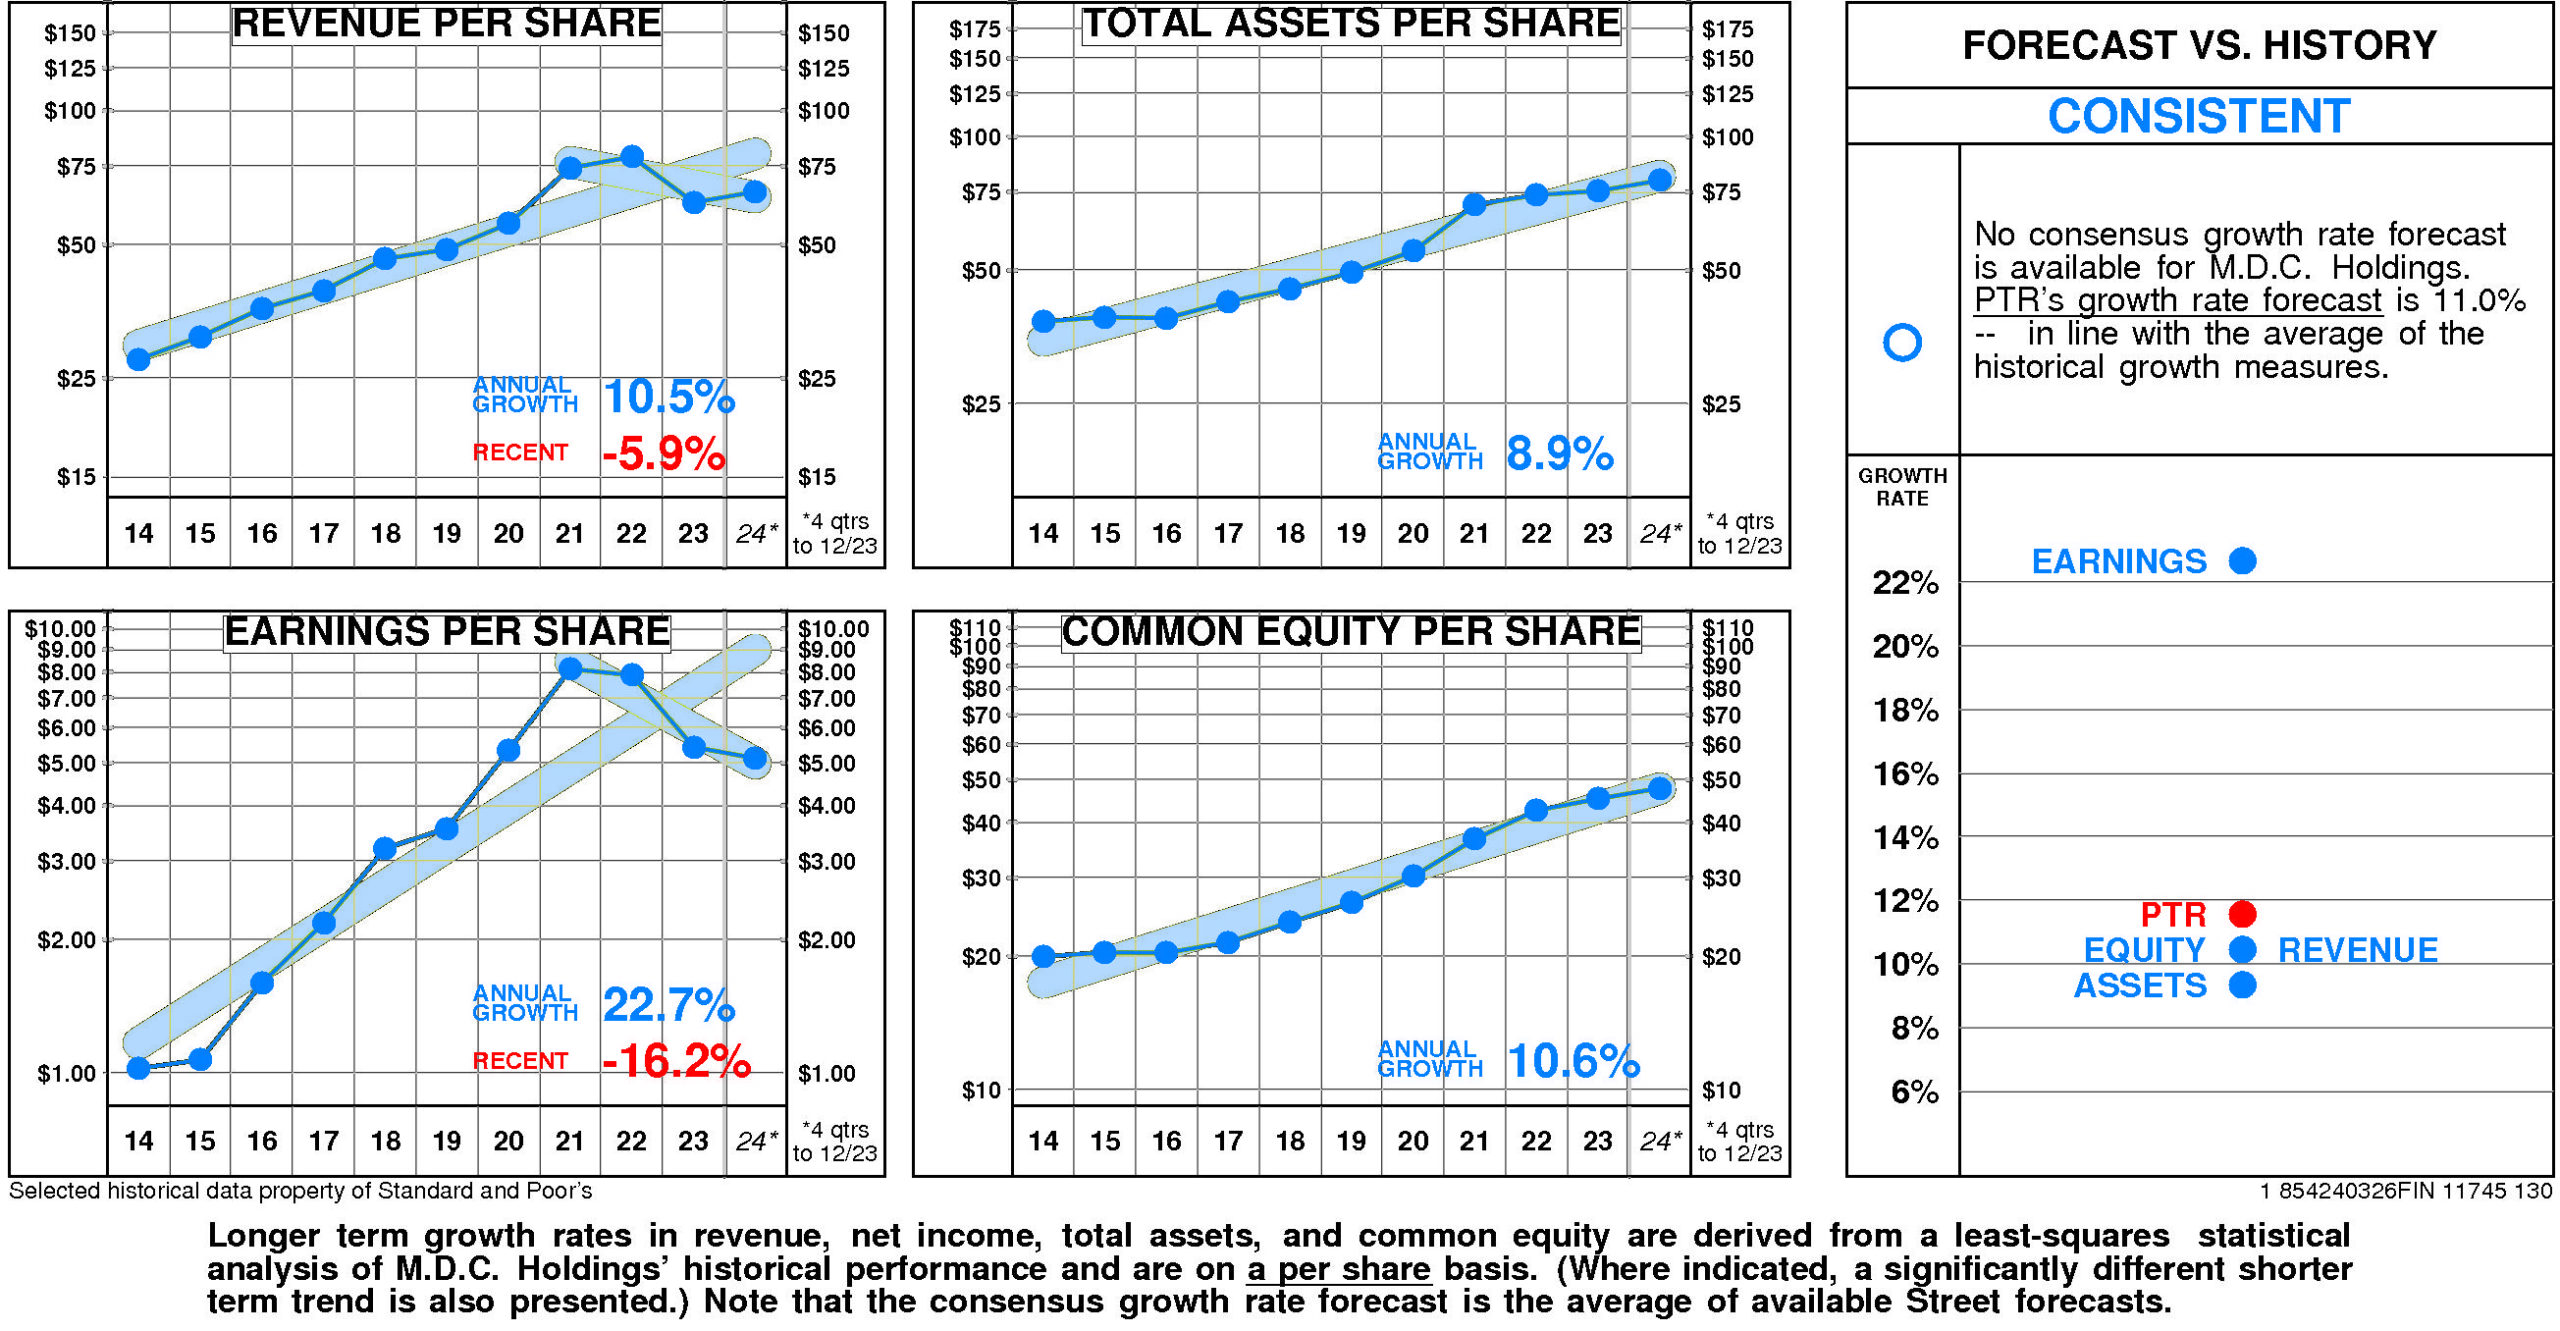
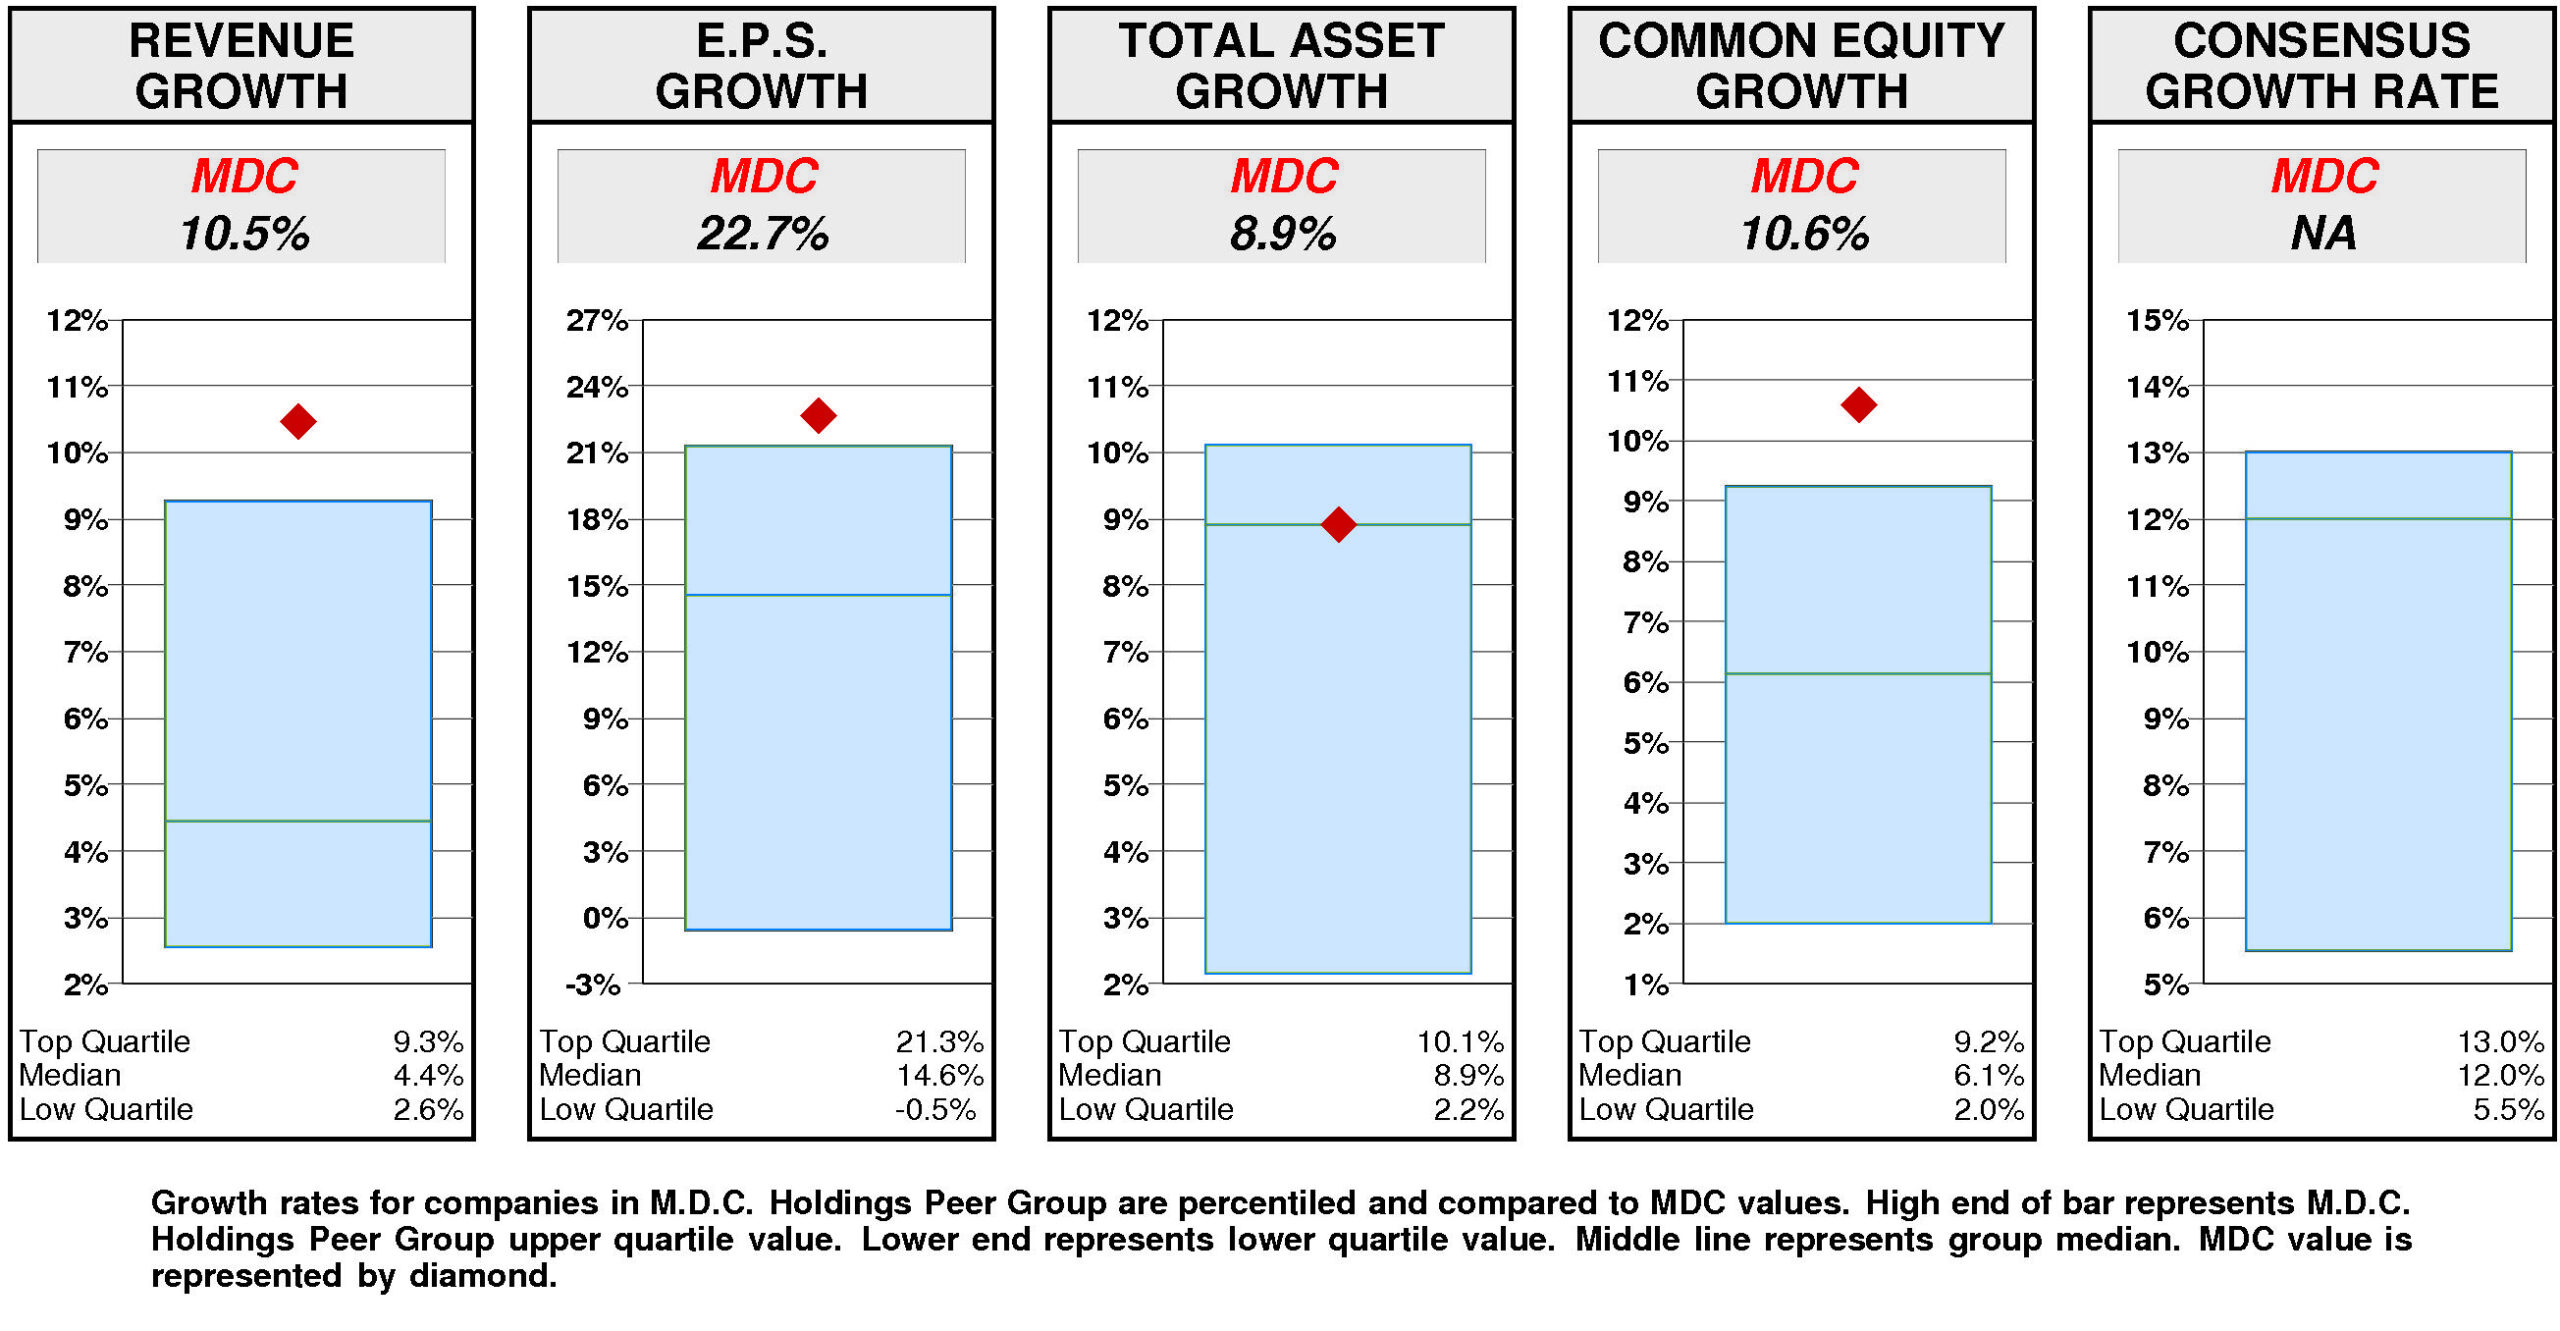
Relative to the M.D.C. Holdings Peer Group, M.D.C. Holdings’ historical growth measures are generally top quartile. Revenue growth (10.5%) has been upper quartile. E.P.S. growth (22.7%) has been upper quartile. Equity growth (10.6%) has been upper quartile. Total asset growth (8.9%) has been at median.
Consensus growth forecast is unavailable.
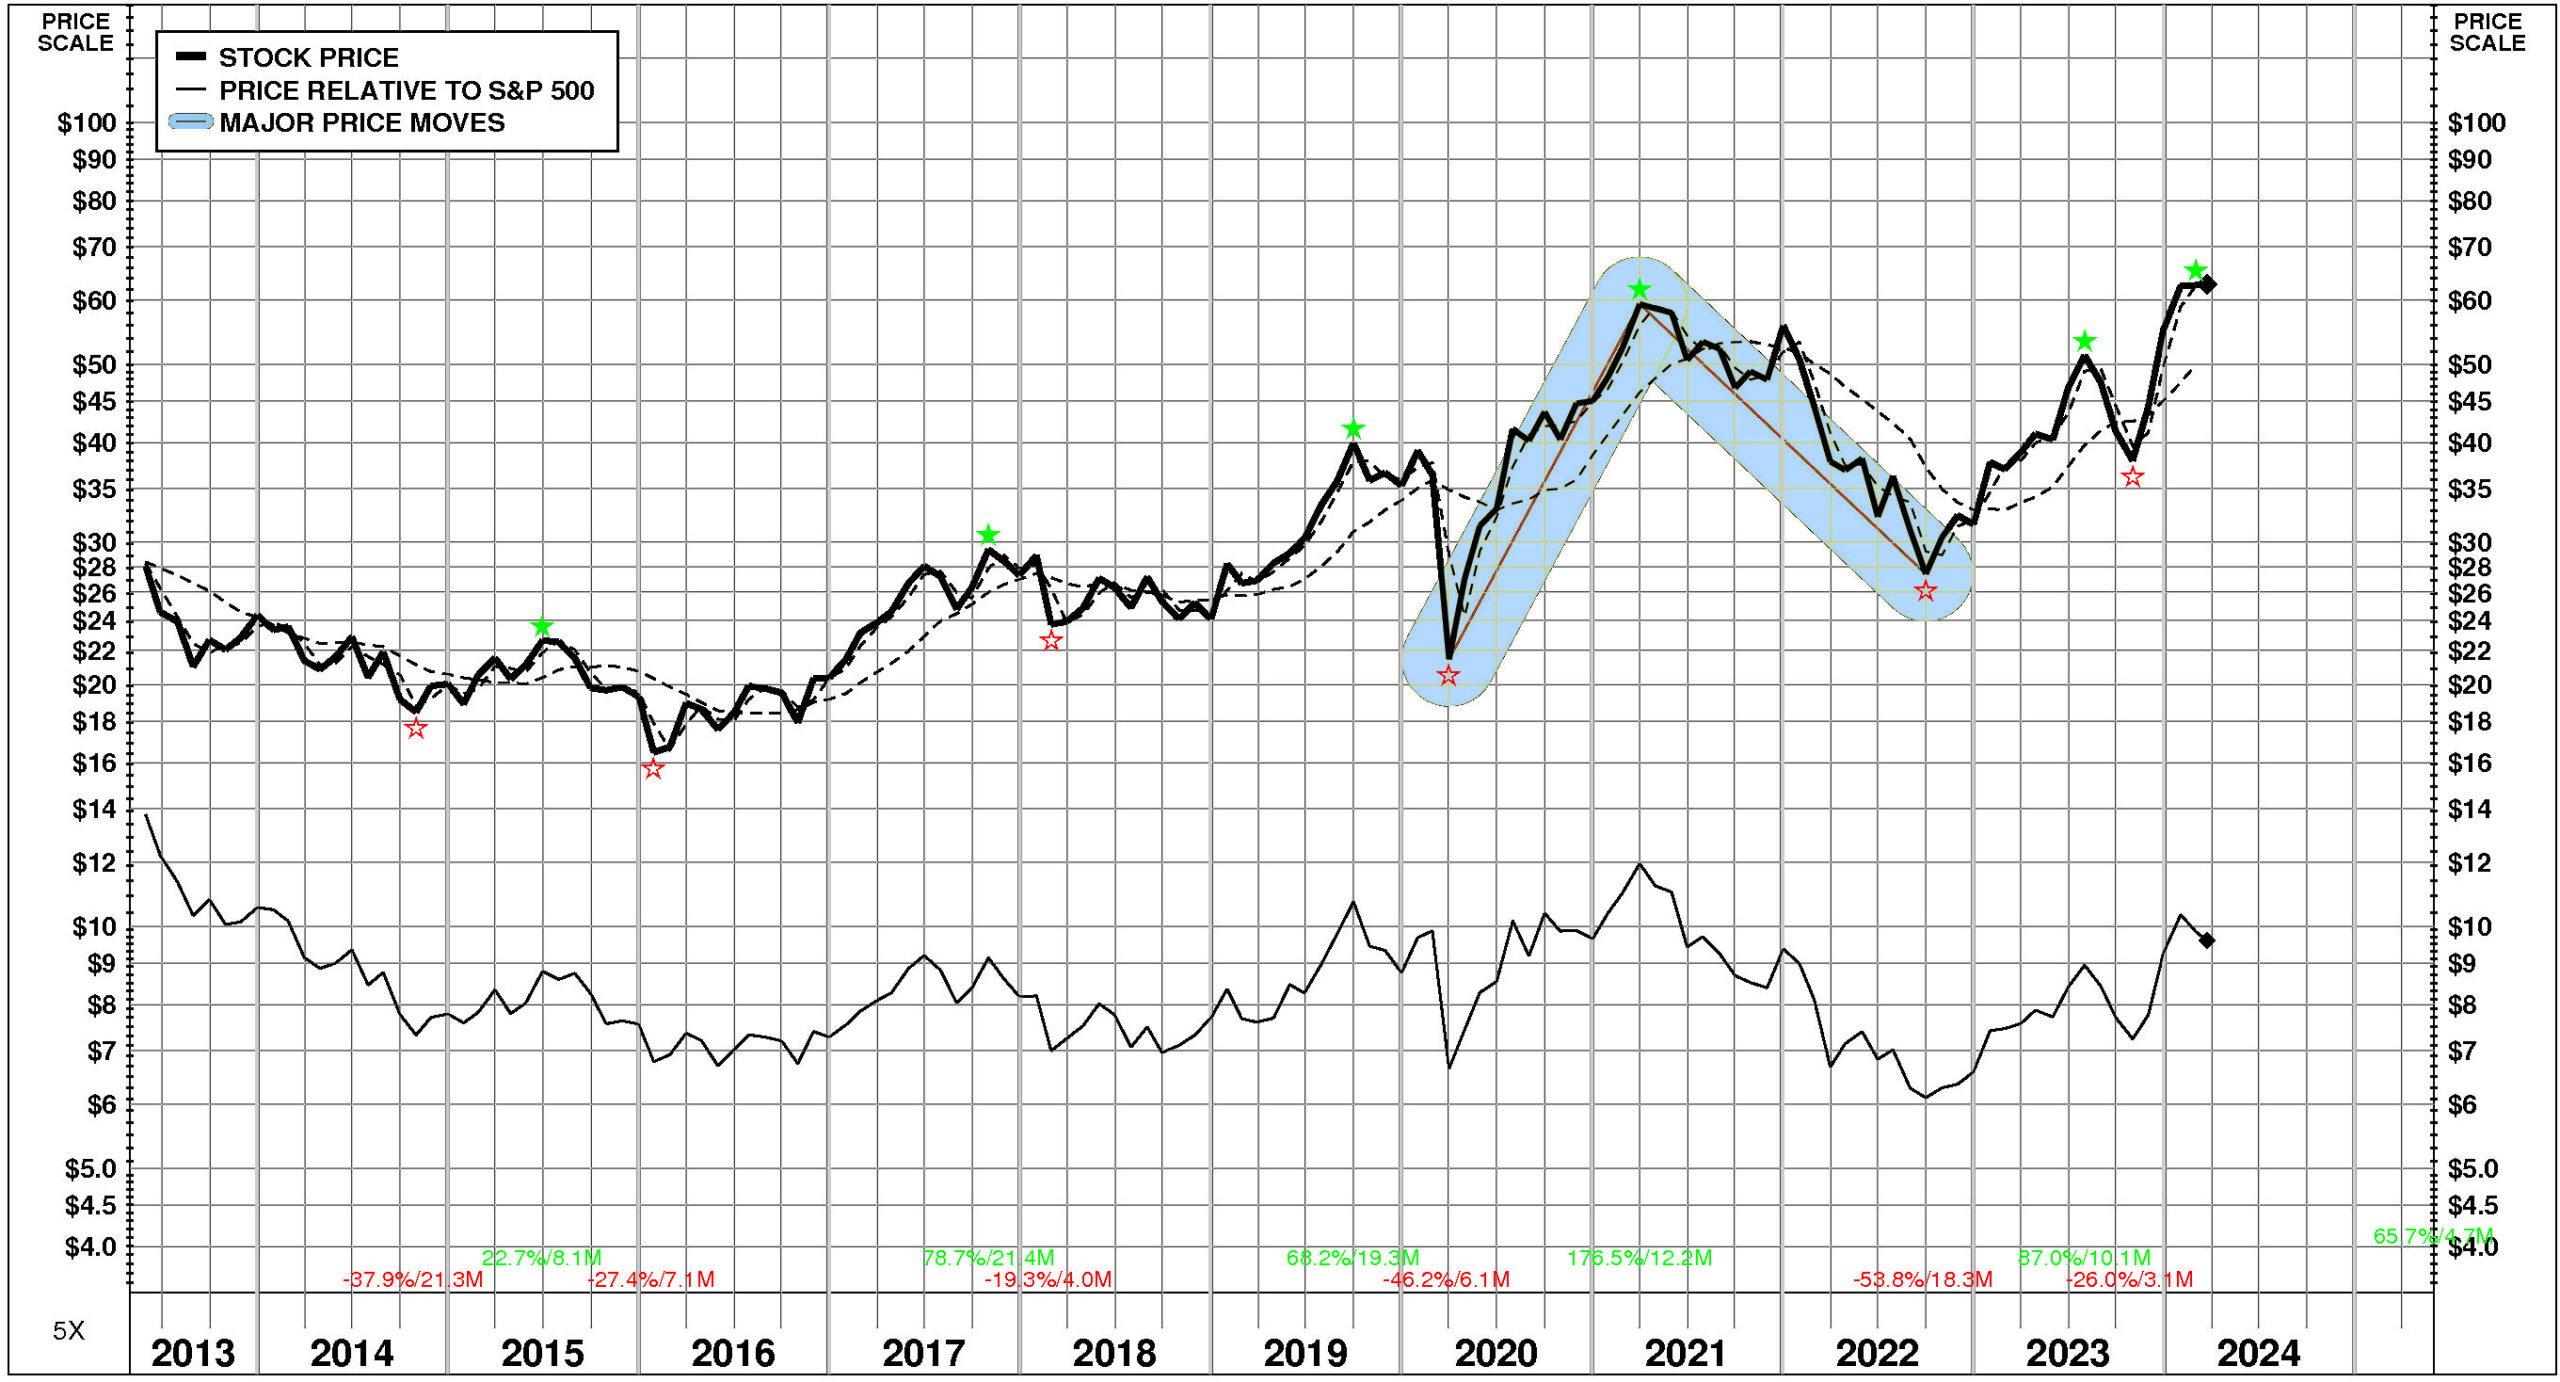
PRICE HISTORY
Over the full time period, M.D.C. Holdings’ stock price performance has been variable and below market. Between May, 2013 and March, 2024, M.D.C. Holdings’ stock price rose +124%; relative to the market, this was a -30% loss. Significant price moves during the period: 1) March, 2021 – September, 2022: -54%; and 2) March, 2020 – March, 2021: +177%.
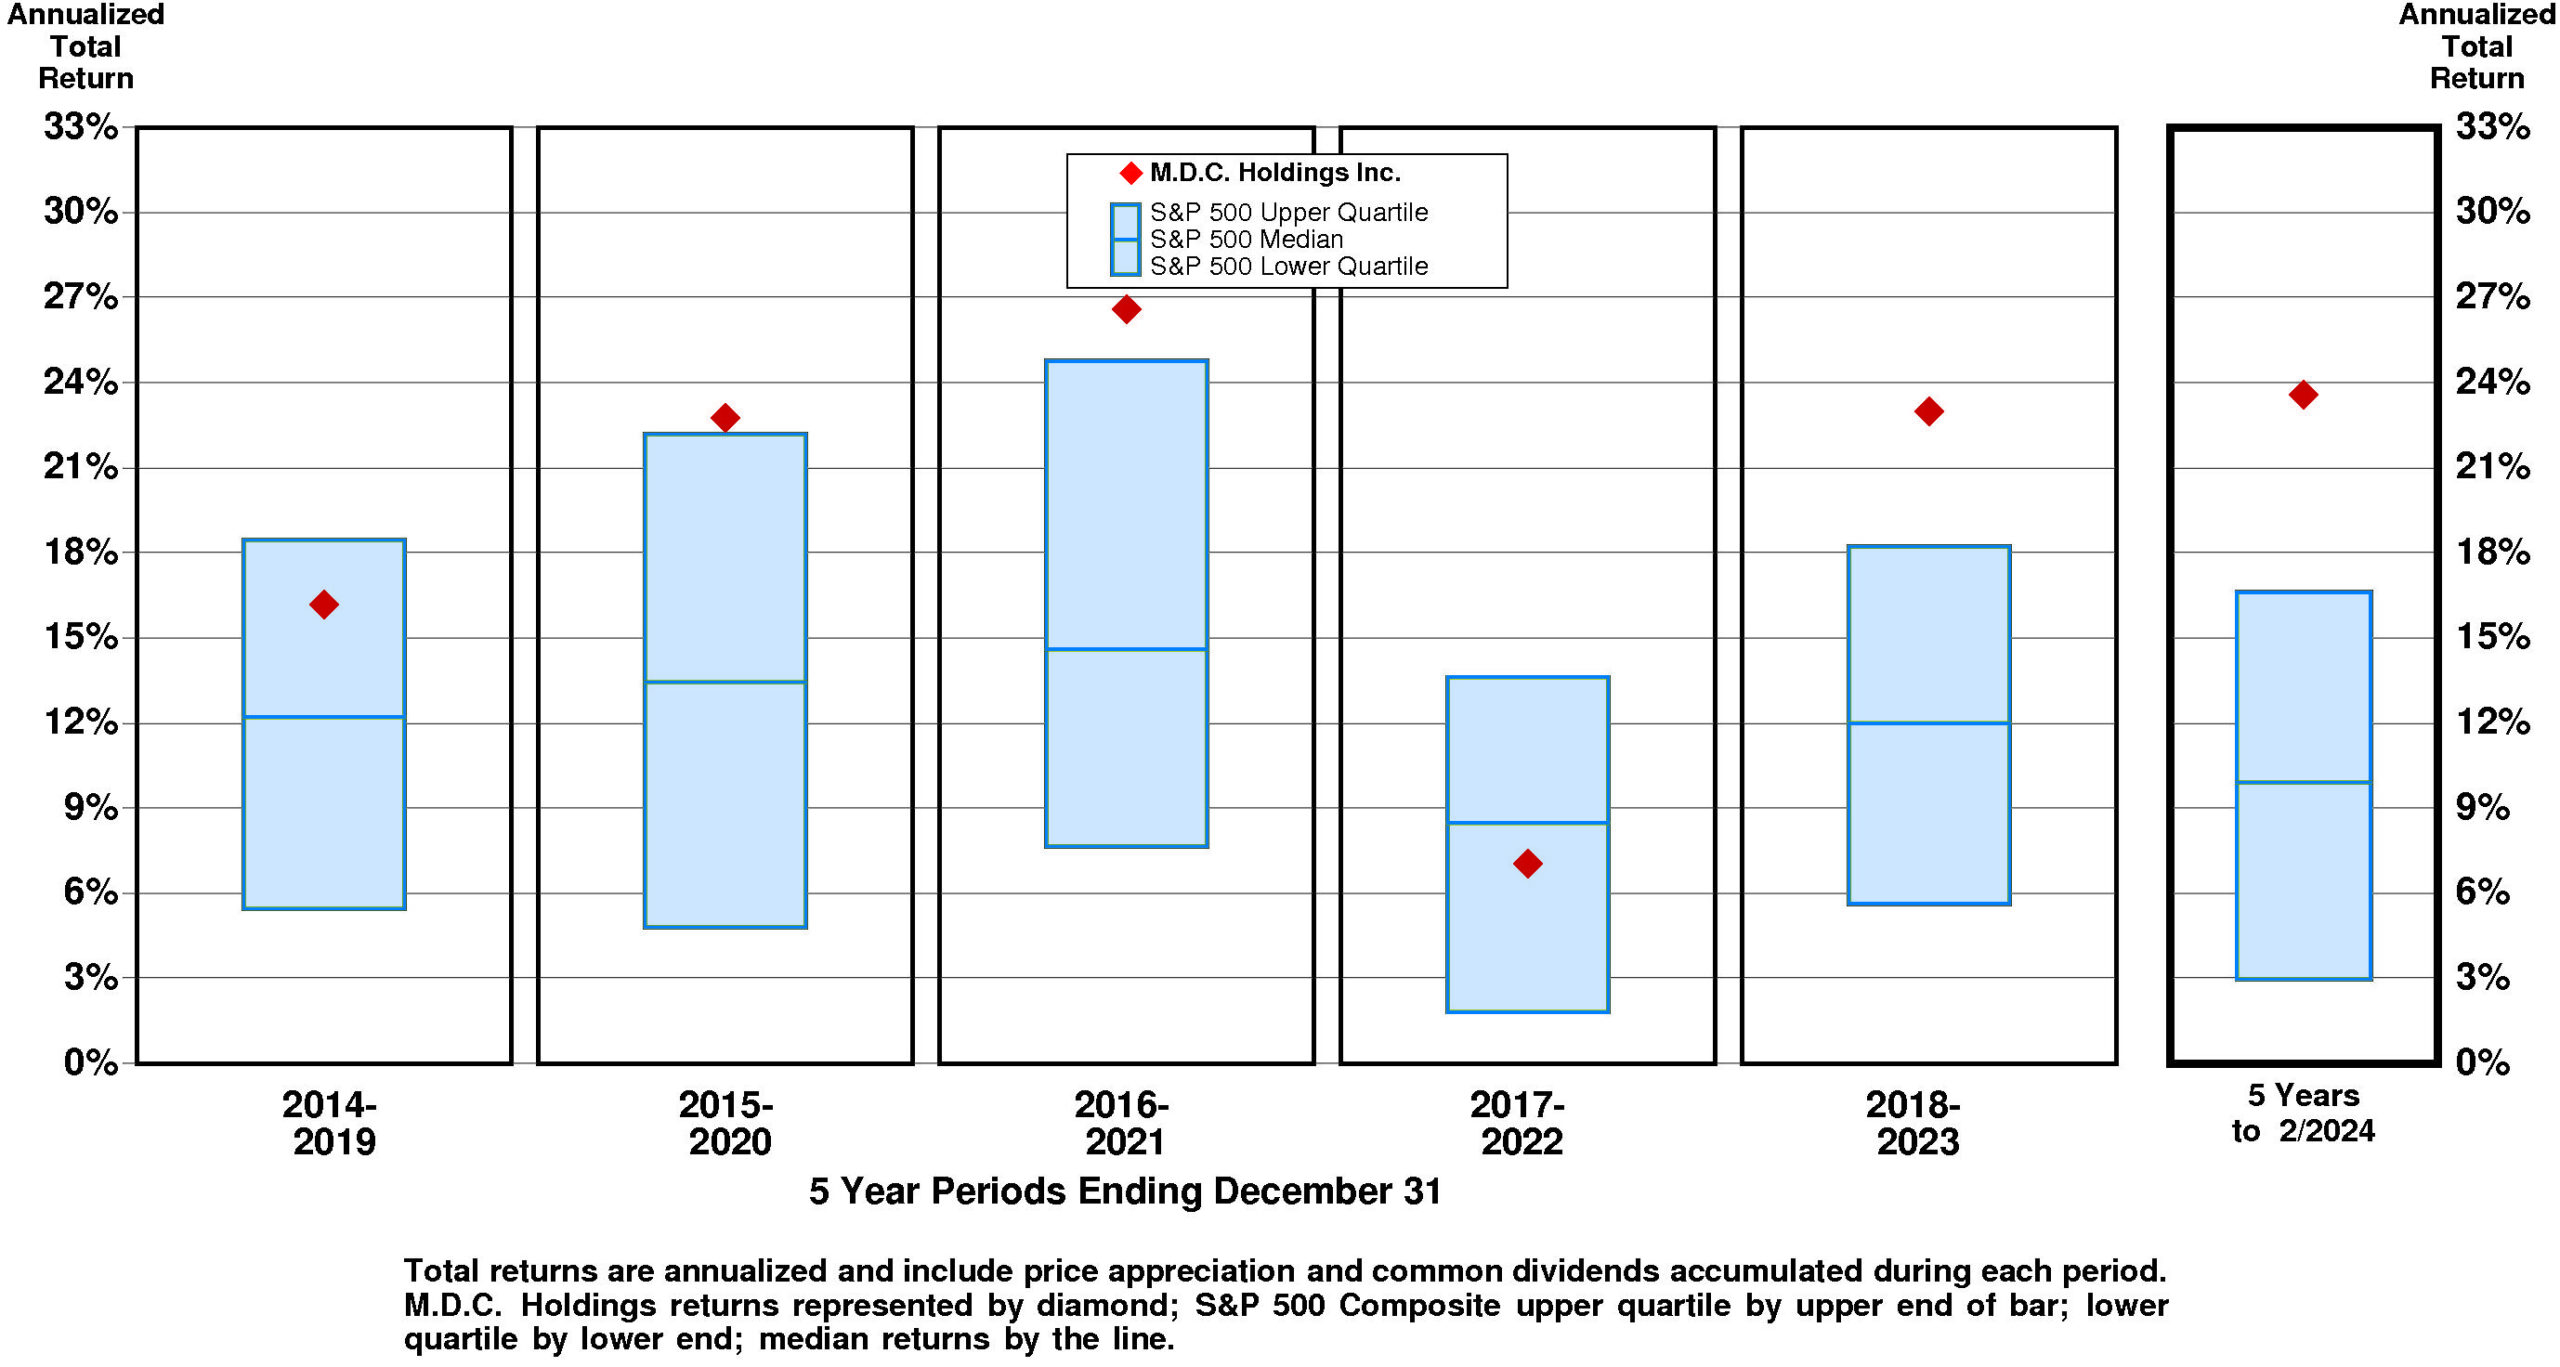
TOTAL INVESTMENT RETURNS
Current annual total return performance of 77.2% is upper quartile relative to the S&P 500 Composite.
In addition to being upper quartile relative to S&P 500 Composite, current annual total return performance through February, 2024 of 77.2% is upper quartile relative to M.D.C. Holdings Inc. Peer Group.
Current 5-year total return performance of 23.6% is upper quartile relative to the S&P 500 Composite.
Through February, 2024, with upper quartile current 5-year total return of 23.6% relative to S&P 500 Composite, M.D.C. Holdings’ total return performance is upper quartile relative to M.D.C. Holdings Inc. Peer Group.
VALUATION BENCHMARKS
Relative to S&P 500 Composite, MDC’s overall valuation is quite low. Four of five factors are lower quartile. The highest factor is the ratio of enterprise value/assets, followed by the ratio of enterprise value/earnings before interest and taxes, then by the price/earnings ratio, then by the price/equity ratio. The lowest factor, ratio of enterprise value/revenue, is lower quartile.
Relative to M.D.C. Holdings Peer Group, MDC’s overall valuation is low. The highest factor, the ratio of enterprise value/revenue, is at median. Ratio of enterprise value/assets is slightly below median. Price/earnings ratio is lower quartile. Ratio of enterprise value/earnings before interest and taxes is lower quartile. The lowest factor, the price/equity ratio, is near the lower quartile.
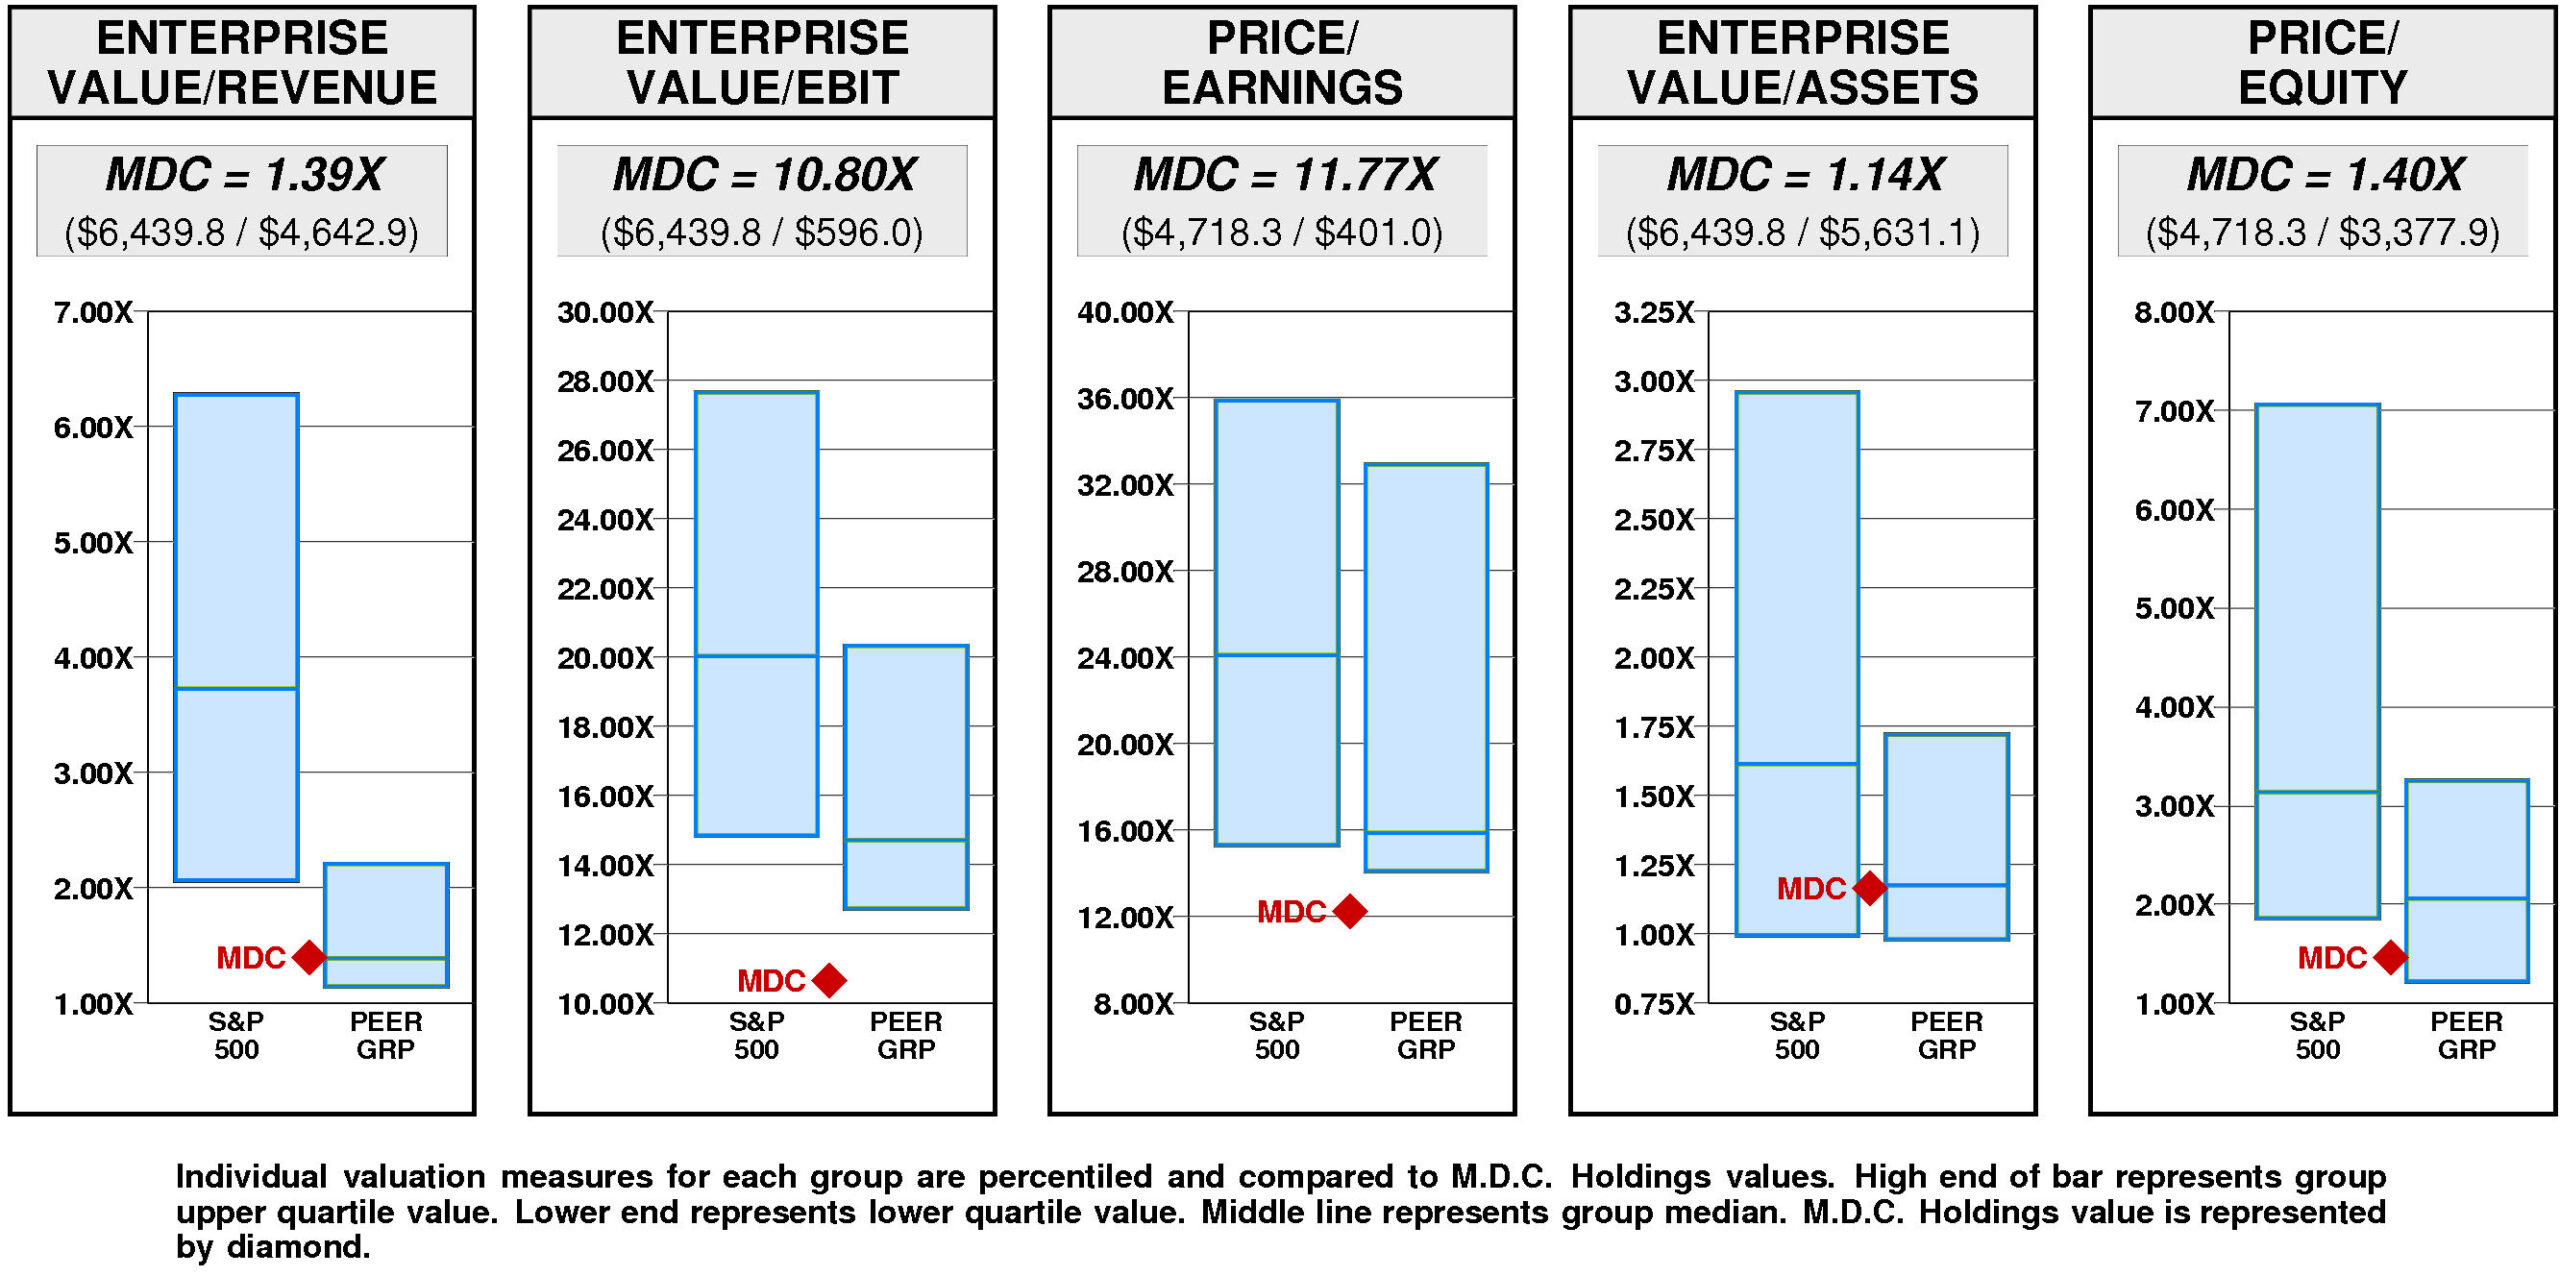
M.D.C. Holdings has no value gap compared to the median valuation. For MDC to rise to median valuation, its current ratio of enterprise value/revenue would have to rise from the current level of 1.39X to 1.39X. If MDC’s ratio of enterprise value/revenue were to rise to 1.39X, its stock price would be lower by $0 to $63.
For MDC to hit lower quartile valuation relative to the M.D.C. Holdings Peer Group, its current ratio of enterprise value/revenue would have to fall from the current level of 1.39X to 1.15X. If MDC’s ratio of enterprise value/revenue were to fall to 1.15X, its stock price would decline by $-15 from the current level of $63.
VALUE TARGETS
MDC is expected to continue to be a Value Builder reflecting capital returns that are forecasted to be above the cost of capital.
M.D.C. Holdings’ current Price Target of $153 represents a +144% change from the current price of $62.87.
This high appreciation potential results in an appreciation score of 79 (only 21% of the universe has greater appreciation potential.)
Reinforcing this high Appreciation Score of 79, the high Power Rating of 95 contributes to an Value Trend Rating of A.
M.D.C. Holdings’ current Price Target is $153 (+8% from the 2023 Target of $142 and +144% from the 03/21/24 price of $62.87). This slight rise in the Target is the result of a +14% increase in the equity base and a -5% decrease in the price/equity multiple. The forecasted decline in growth has a large negative impact on the price/equity multiple and the forecasted decline in return on equity has a slight negative impact as well. Partially offsetting these Drivers, the forecasted decline in cost of equity has a large positive impact.
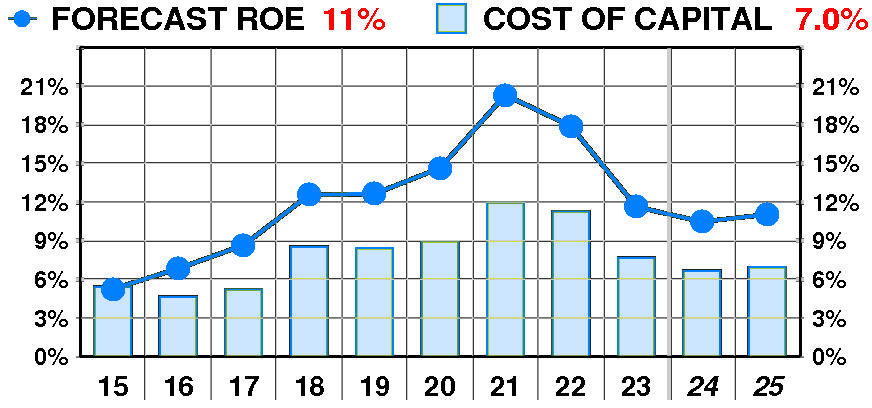
PTR’s return on equity forecast is 11.0% — in line with our recent forecasts. Forecasted return on equity enjoyed a dramatic, variable increase between 2015 and 2023. The current forecast is well below the 2021 peak of 20%.
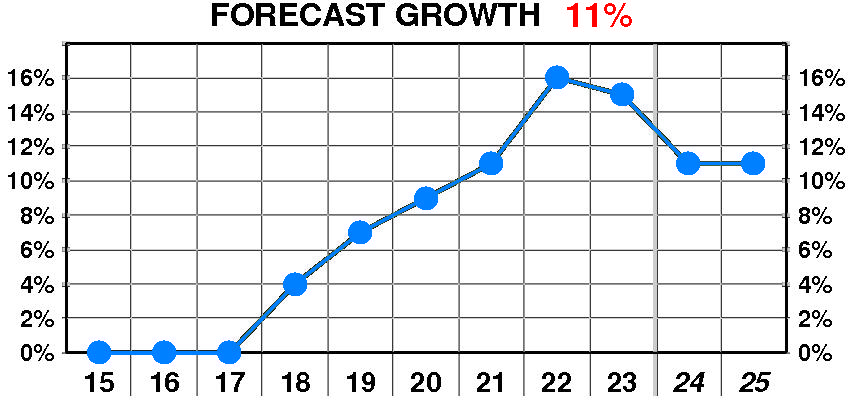
PTR’s growth forecast is 11.0% — below our recent forecasts. Forecasted growth enjoyed a dramatic, steady increase between 2018 and 2023. The current forecast is well above the 2018 low of 4%.
PTR’s cost of equity forecast is 7.0% — in line with recent levels. Forecasted cost of equity suffered a dramatic, variable increase between 2015 and 2023. The current forecast is below the 2021 peak of 11.9%.
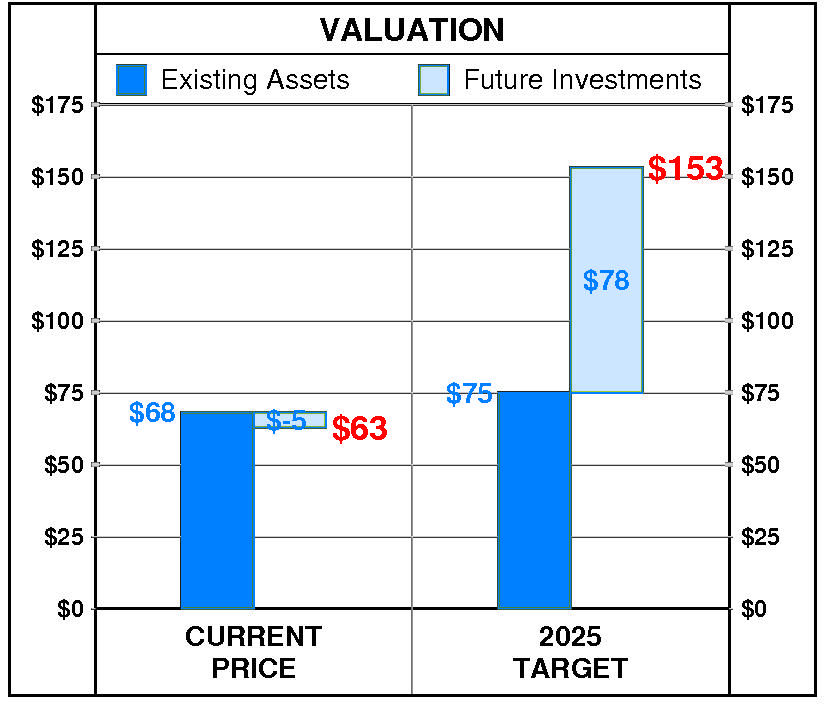
At M.D.C. Holdings’ current price of $62.87, investors are placing a negative value of $-5 on its future investments. This view is not supported by the company’s most recent performance that reflected a growth rate of 15.0% per year, and a return on equity of 11.6% versus a cost of equity of 7.7%.
PTR’s 2025 Price Target of $153 is based on these forecasts and reflects an estimated value of existing assets of $75 and a value of future investments of $78.
Be the first to comment