![]()
BUSINESS
Sally Beauty Holdings, Inc. operates as a specialty retailer and distributor of professional beauty supplies. The company operates through two segments, Sally Beauty Supply (SBS) and Beauty Systems Group (BSG). The SBS segment offers beauty products, including hair color and care products, styling tools, skin and nail care products, cosmetics, and other beauty products for retail customers and salon professionals through retail stores and digital platforms. This segment sells its products under third-party brands, as well as exclusive-label brands. As of November 10, 2022, it operated 3,439 stores.
INVESTMENT RATING
With future capital returns forecasted to exceed the cost of capital, SBH is expected to continue to be a major Value Builder.
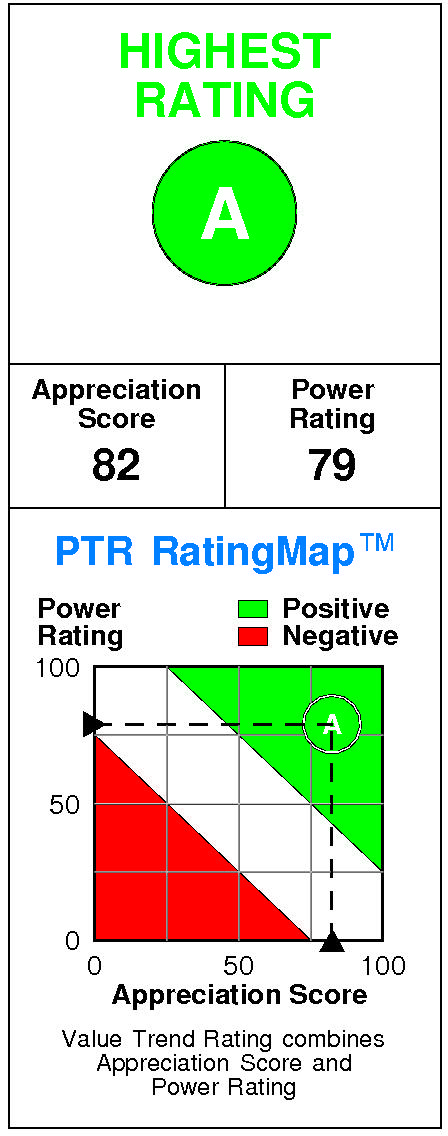
Sally Beauty Holdings has a current Value Trend Rating of A (Highest Rating).
The Value Trend Rating reflects highly consistent signals from PTR’s two proprietary measures of a stock’s attractiveness. Sally Beauty Holdings has a good Power Rating of 79 and a good Appreciation Score of 82, and the Highest Value Trend Rating results.
Sally Beauty Holdings’ stock is selling well below targeted value. The current stock price of $12.33 compares to targeted value 12 months forward of $33.
Sally Beauty Holdings’ high appreciation potential results in an appreciation score of 82 (only 18% of the universe has greater appreciation potential.)
Sally Beauty Holdings has a Power Rating of 79. (SBH’s good Power Rating indicates that it has a higher likelihood of achieving favorable investment performance over the near to intermediate term than all but 21% of companies in the universe.)
Factors contributing to this good Power Rating include: recent price action has been favorable; and earnings estimate behavior for SBH has been slightly favorable recently. An offsetting factor is the Retail Stores, NEC comparison group is in a slightly weakened position currently.
INVESTMENT PROFILE
SBH’s financial strength is average. Financial strength rating is 57.
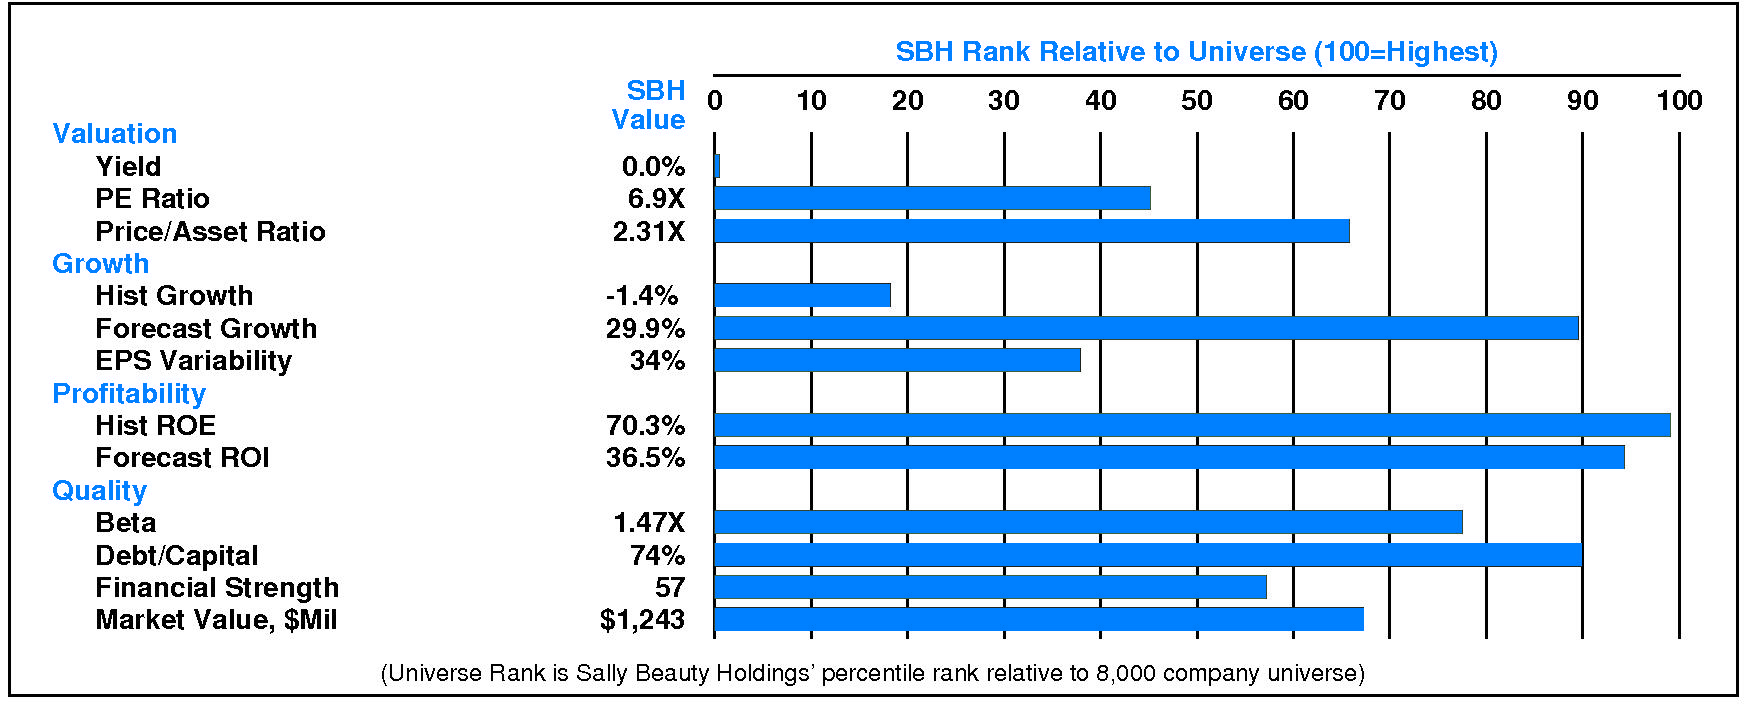
Relative to the S&P 500 Composite, Sally Beauty Holdings Inc has slightly more Growth than Value characteristics; its appeal is likely to be to Capital Gain-oriented investors; the perception is that SBH is higher risk. Relative weaknesses include: high stock price volatility, high financial leverage, and low historical growth. SBH’s valuation is moderate: low dividend yield, low P/E ratio, and moderate price/book ratio. SBH has unusually low market capitalization.
CURRENT SIGNALS
Sally Beauty Holdings’ current operations are eroding. Return on equity is falling, reflecting: falling asset utilization; and falling tax keep rate.
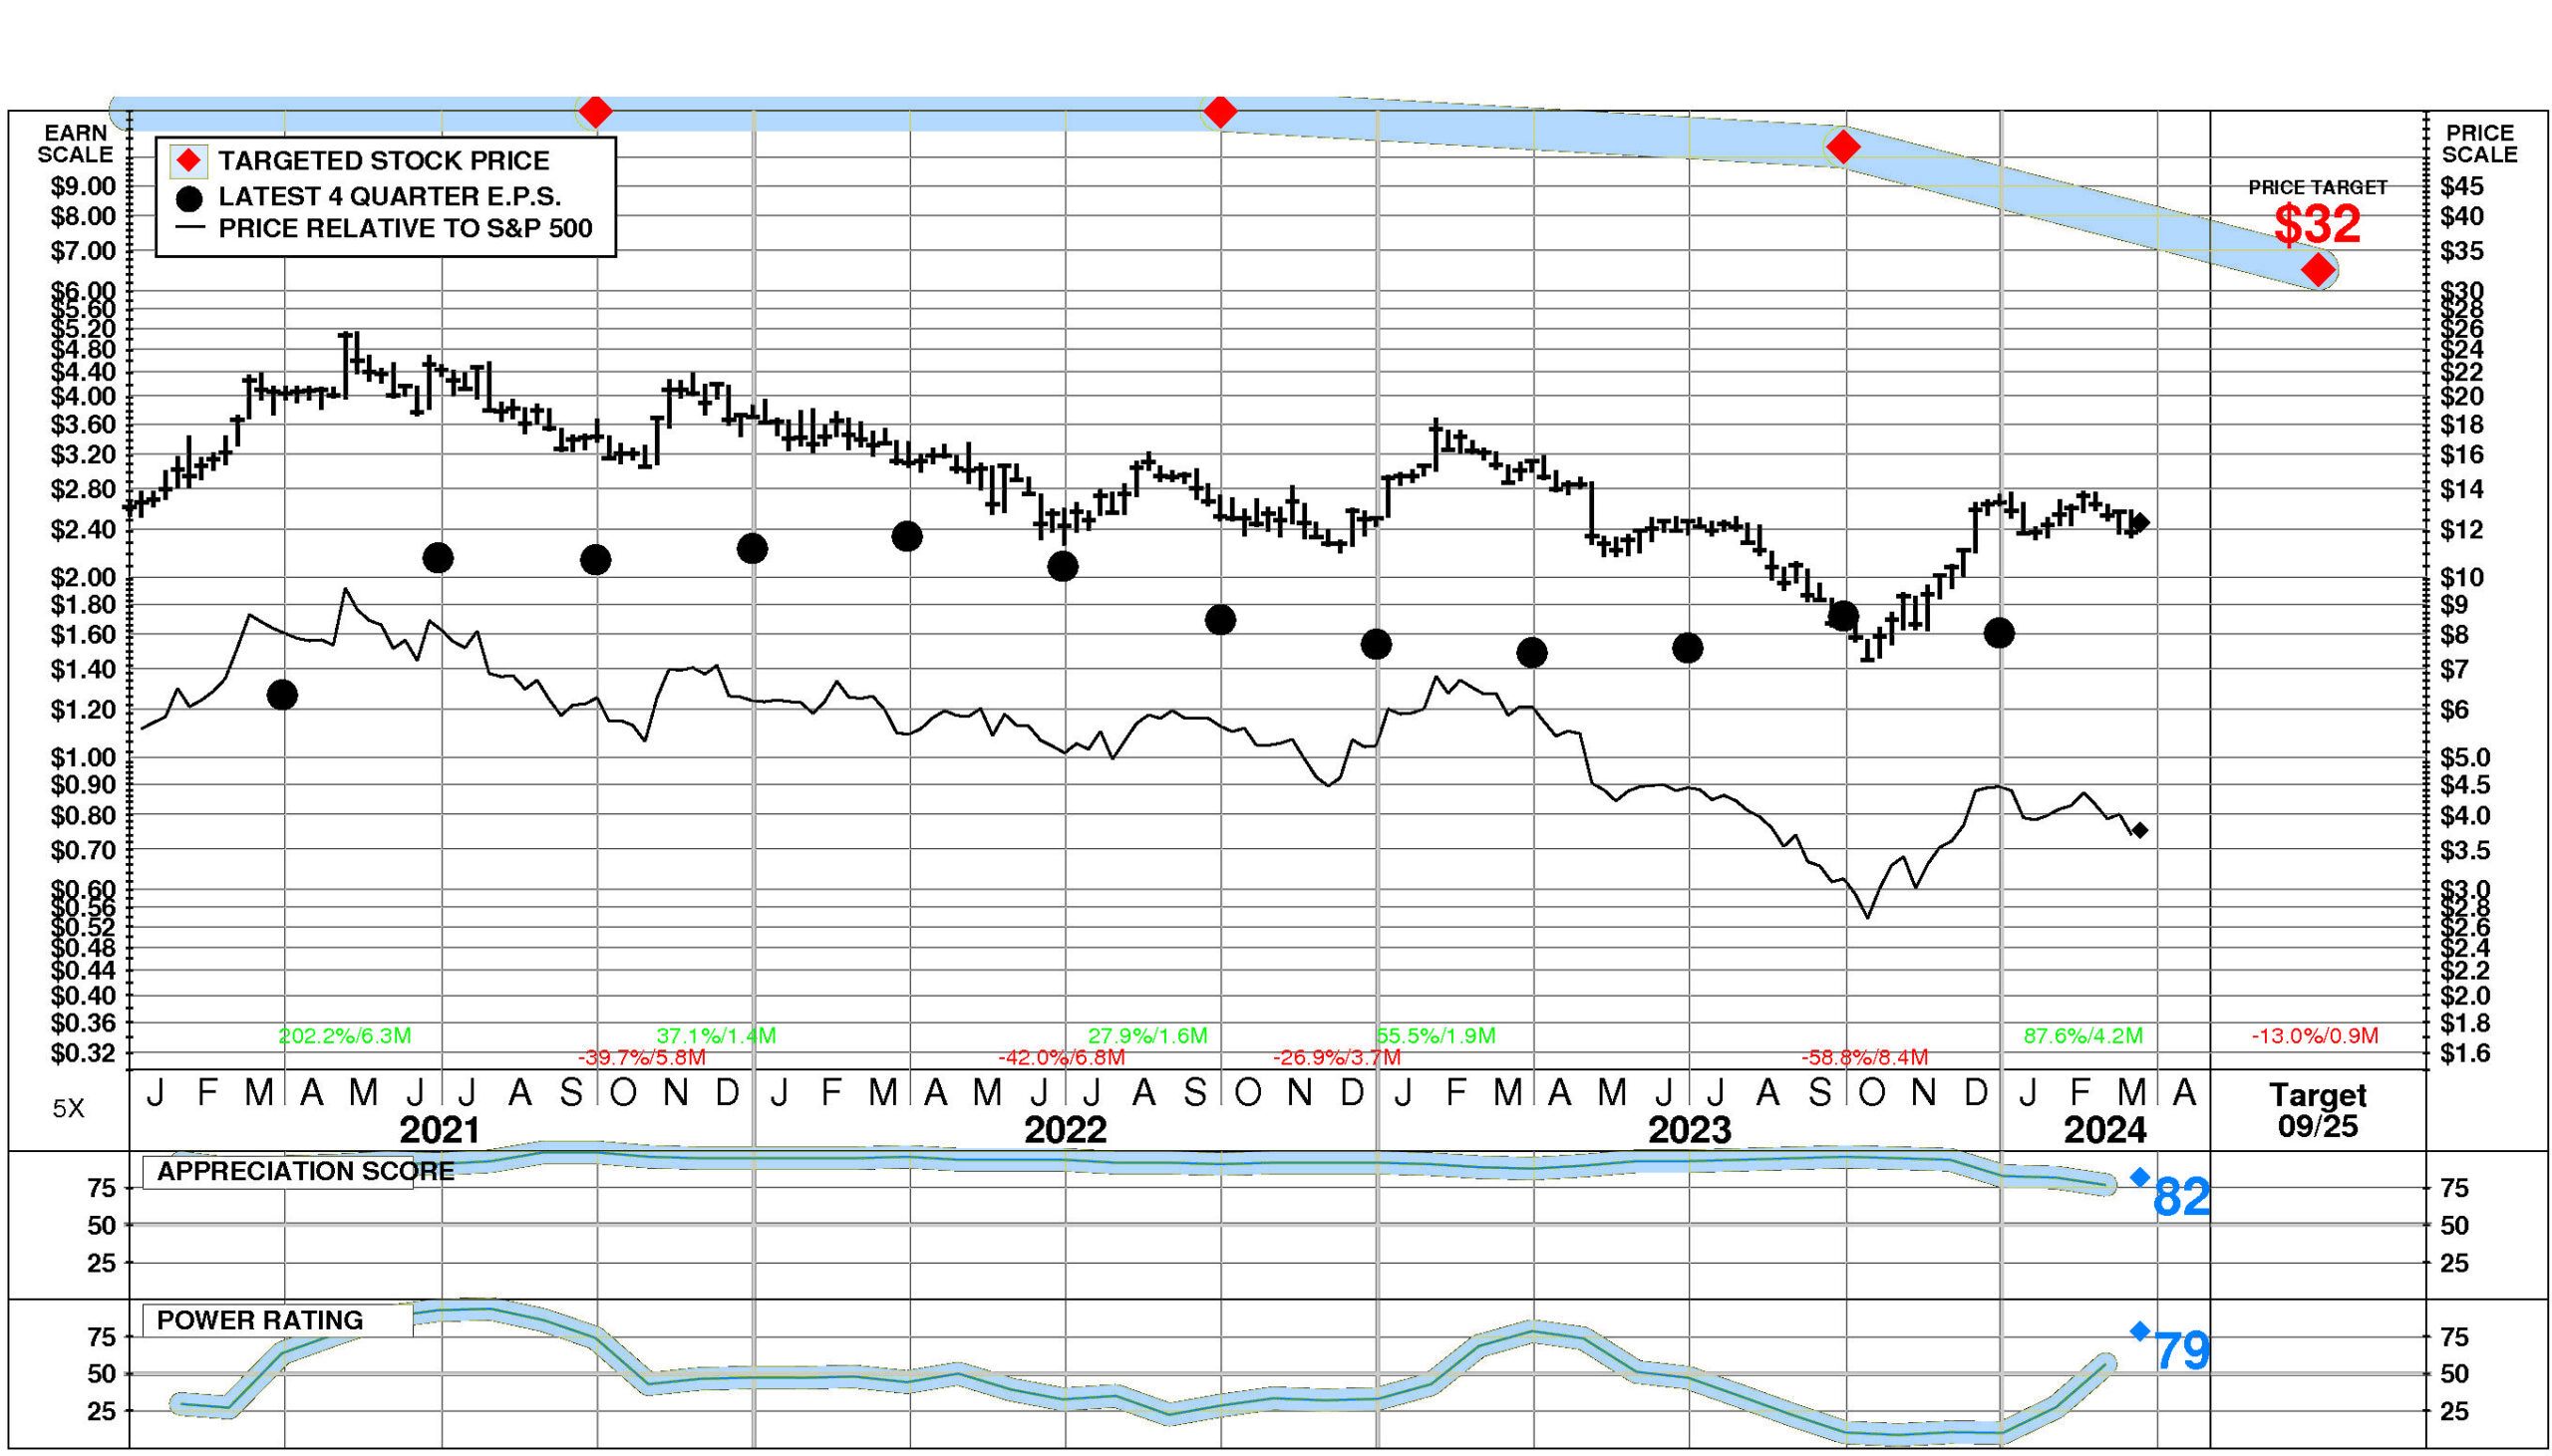
Sally Beauty Holdings’ current technical position is moderately positive. The stock price is in a 4.2 month up move. The stock has appreciated 87.6% from its prior low. The stock price is above its 200 day moving average which is in an uptrend.
ALERTS
Sally Beauty Holdings Inc (NYSE: SBH) has recently enjoyed significant positive changes in fundamentals: significant quarterly earnings acceleration occurred, and the stock’s power rating rose above 70.
The stock is currently rated A.
Sally Beauty Holdings Inc (NYSE: SBH) stock enjoyed a large increase of 2.2% on 3/20/24. The stock closed at $12.33. However, trading volume in this advance was unusually low at 64% of normal. The stock has been strong relative to the market over the last nine months and has risen 4.1% during the last week.
CASH FLOW
In 2023, Sally Beauty Holdings generated a very significant increase in cash of +$52.4 million (+74%). Sources of cash were much larger than uses. Cash generated from 2023 EBITDA totaled +$443.2 million. Non-operating uses consumed -$18.1 million (-4% of EBITDA). Cash taxes consumed -$59.3 million (-13% of EBITDA). Re-investment in the business amounted to -$214.6 million (-48% of EBITDA). On a net basis, debt investors pulled out -$129.2 million (-29% of EBITDA) while equity investors furnished +$30.5 million (+7% of EBITDA).
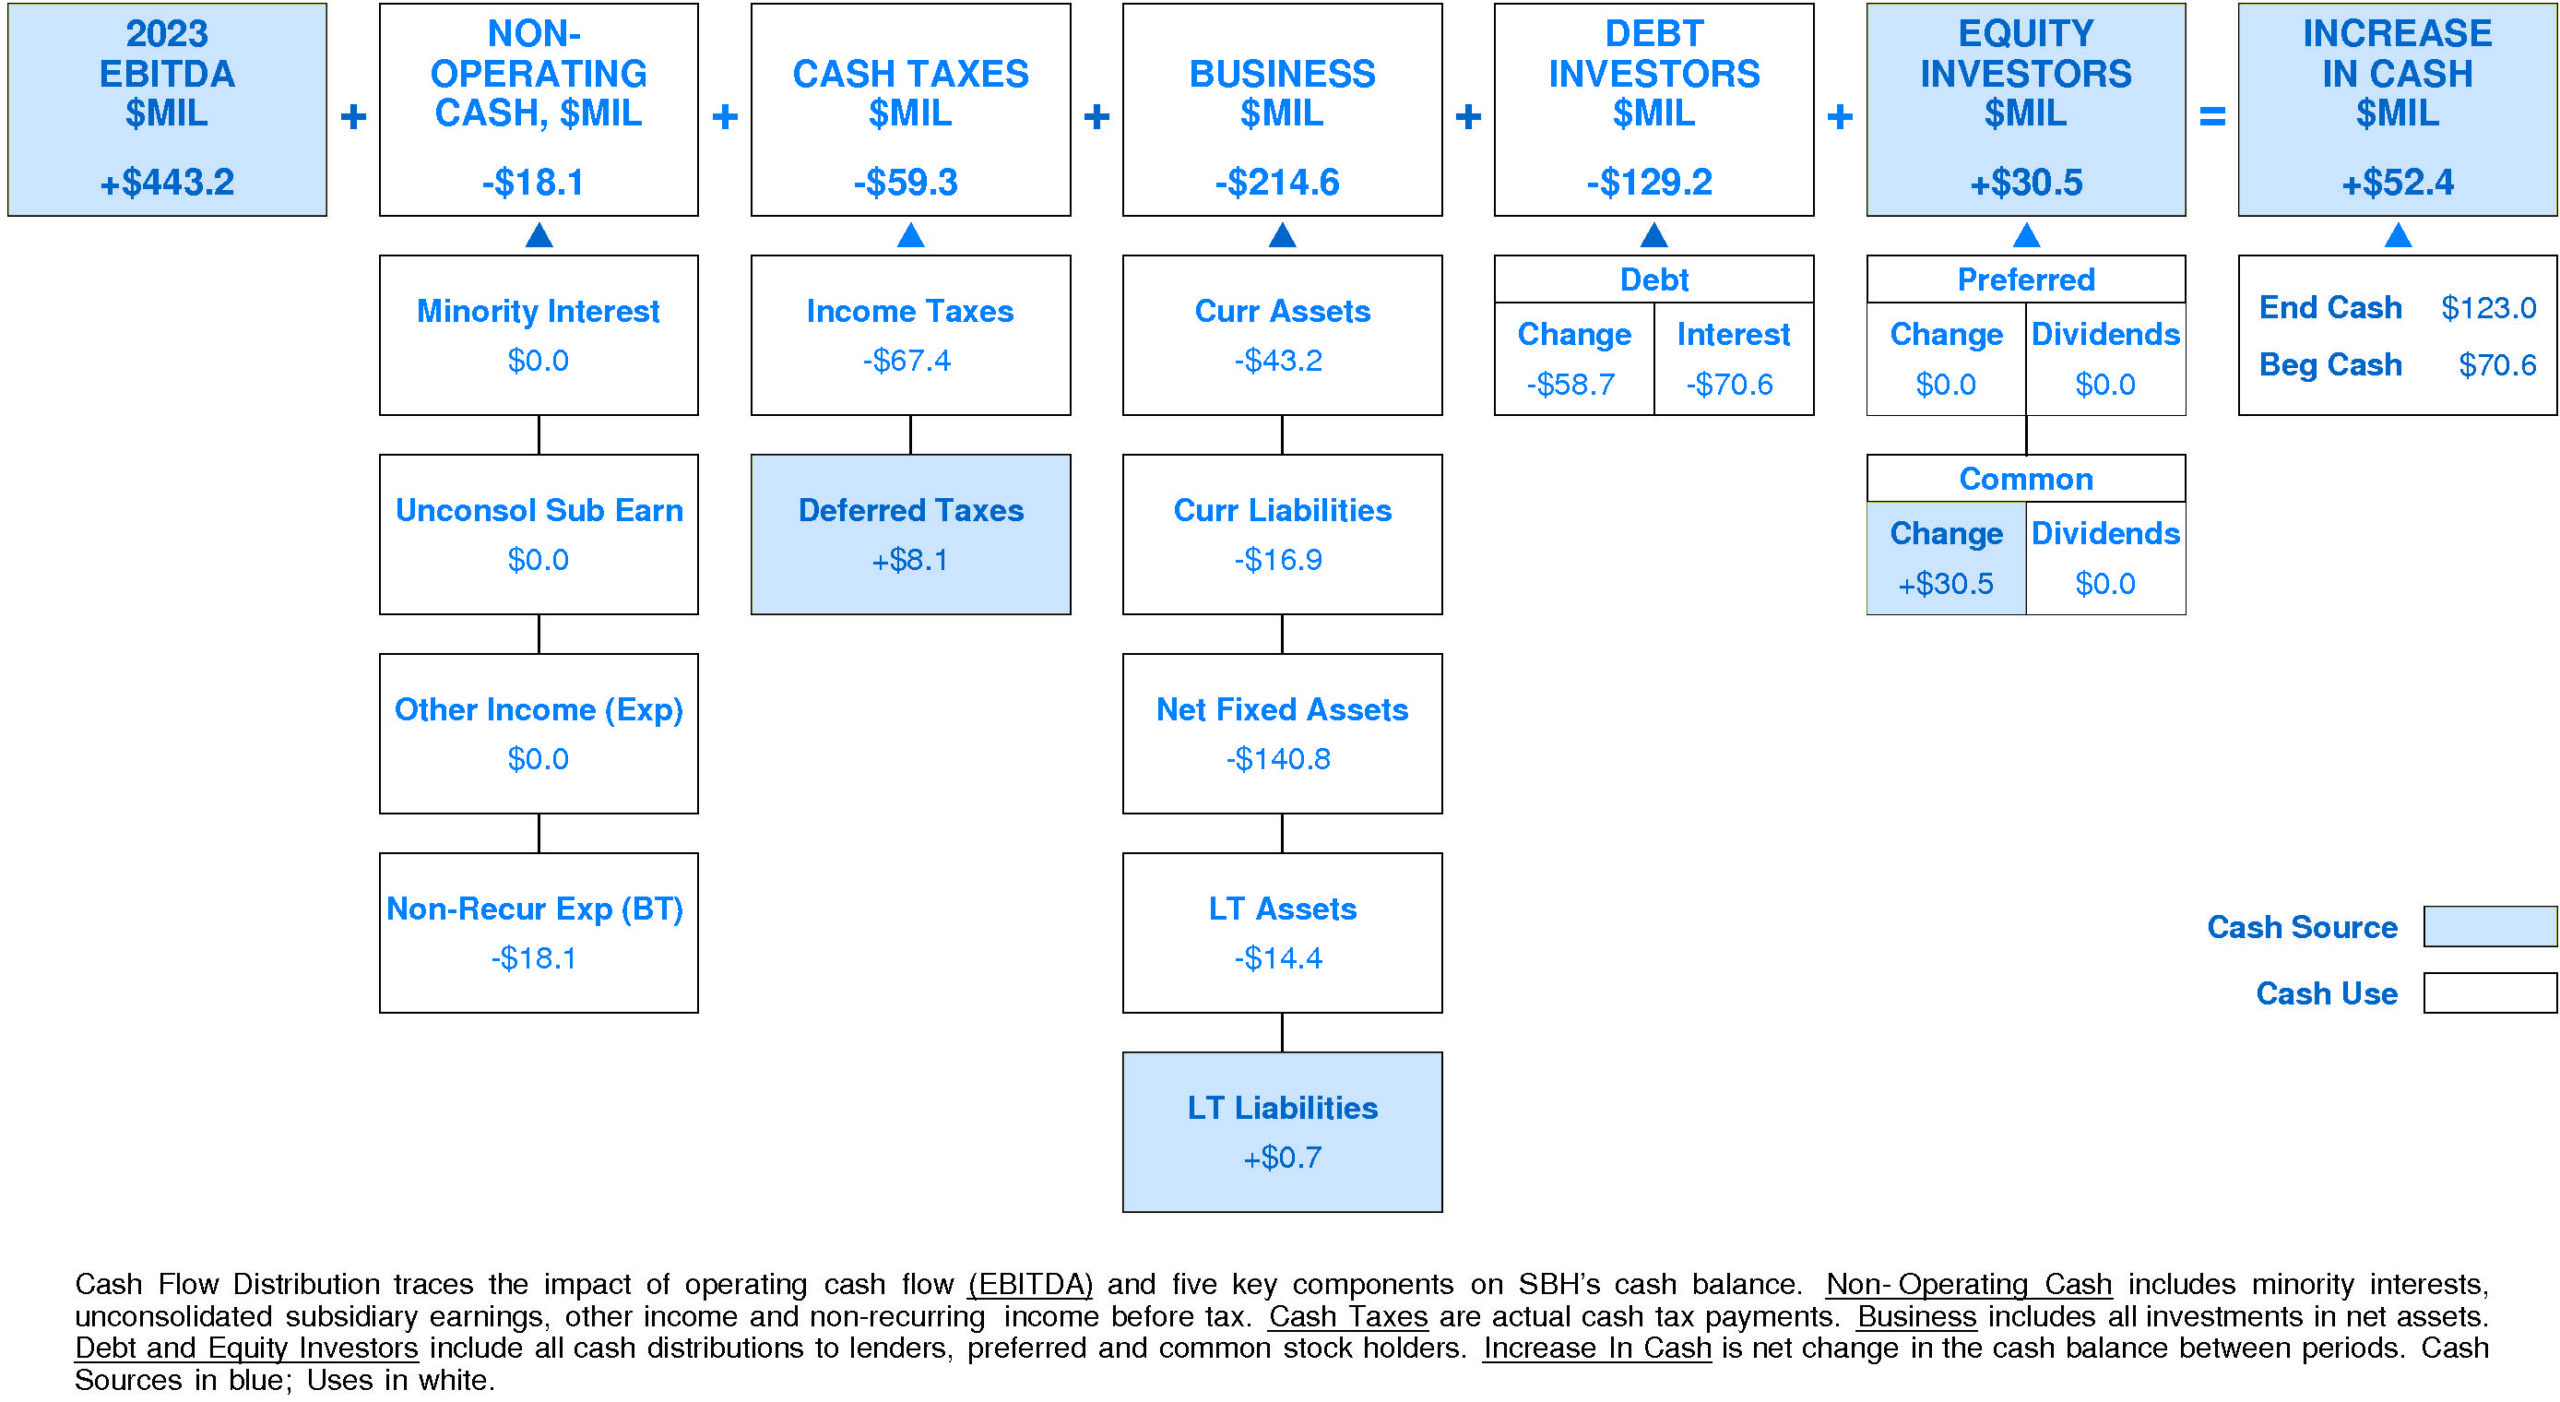
SBH’s Non-operating Income, %EBITDA has experienced a small downtrend over the period. This downtrend was accompanied by stability for the Sally Beauty Holdings Peer Group. In most years, Sally Beauty Holdings was in the third quartile and second quartile. Currently, Sally Beauty Holdings is below median at -4% of EBITDA (-$18.1 million).
SBH’s Cash Taxes, %EBITDA has exhibited a very small overall uptrend over the period. This improvement was accompanied by a similar trend for the Sally Beauty Holdings Peer Group. In most years, Sally Beauty Holdings was in the second quartile and top quartile. Currently, Sally Beauty Holdings is above median at -13% of EBITDA (-$59.3 million).
SBH’s Business Re-investment, %EBITDA has suffered a volatile overall downtrend over the period. This downtrend was accompanied by a similar trend for the Sally Beauty Holdings Peer Group. (Since 2021 Business Re-investment, %EBITDA has accelerated very sharply.) In most years, Sally Beauty Holdings was in the second quartile and top quartile. Currently, Sally Beauty Holdings is slightly above median at -48% of EBITDA (-$214.6 million).
SBH’s Debt Investors, %EBITDA has experienced a downtrend over the period. This downtrend was accompanied by stability for the Sally Beauty Holdings Peer Group. (Since 2021 Debt Investors, %EBITDA has experienced a very sharp recovery.) In most years, Sally Beauty Holdings was in the lower quartile and top quartile. Currently, Sally Beauty Holdings is lower quartile at -29% of EBITDA (-$129.2 million).
SBH’s Equity Investors, %EBITDA has enjoyed a very strong overall uptrend over the period. This improvement was accompanied by a similar trend for the Sally Beauty Holdings Peer Group. In most years, Sally Beauty Holdings was in the third quartile and top quartile. Currently, Sally Beauty Holdings is upper quartile at +7% of EBITDA (+$30.5 million).
SBH’s Change in Cash, %EBITDA has experienced a downtrend over the period. This downtrend was accompanied by a similar trend for the Sally Beauty Holdings Peer Group. In most years, Sally Beauty Holdings was in the top quartile and third quartile. Currently, Sally Beauty Holdings is at the upper quartile at +12% of EBITDA (+$52.4 million).
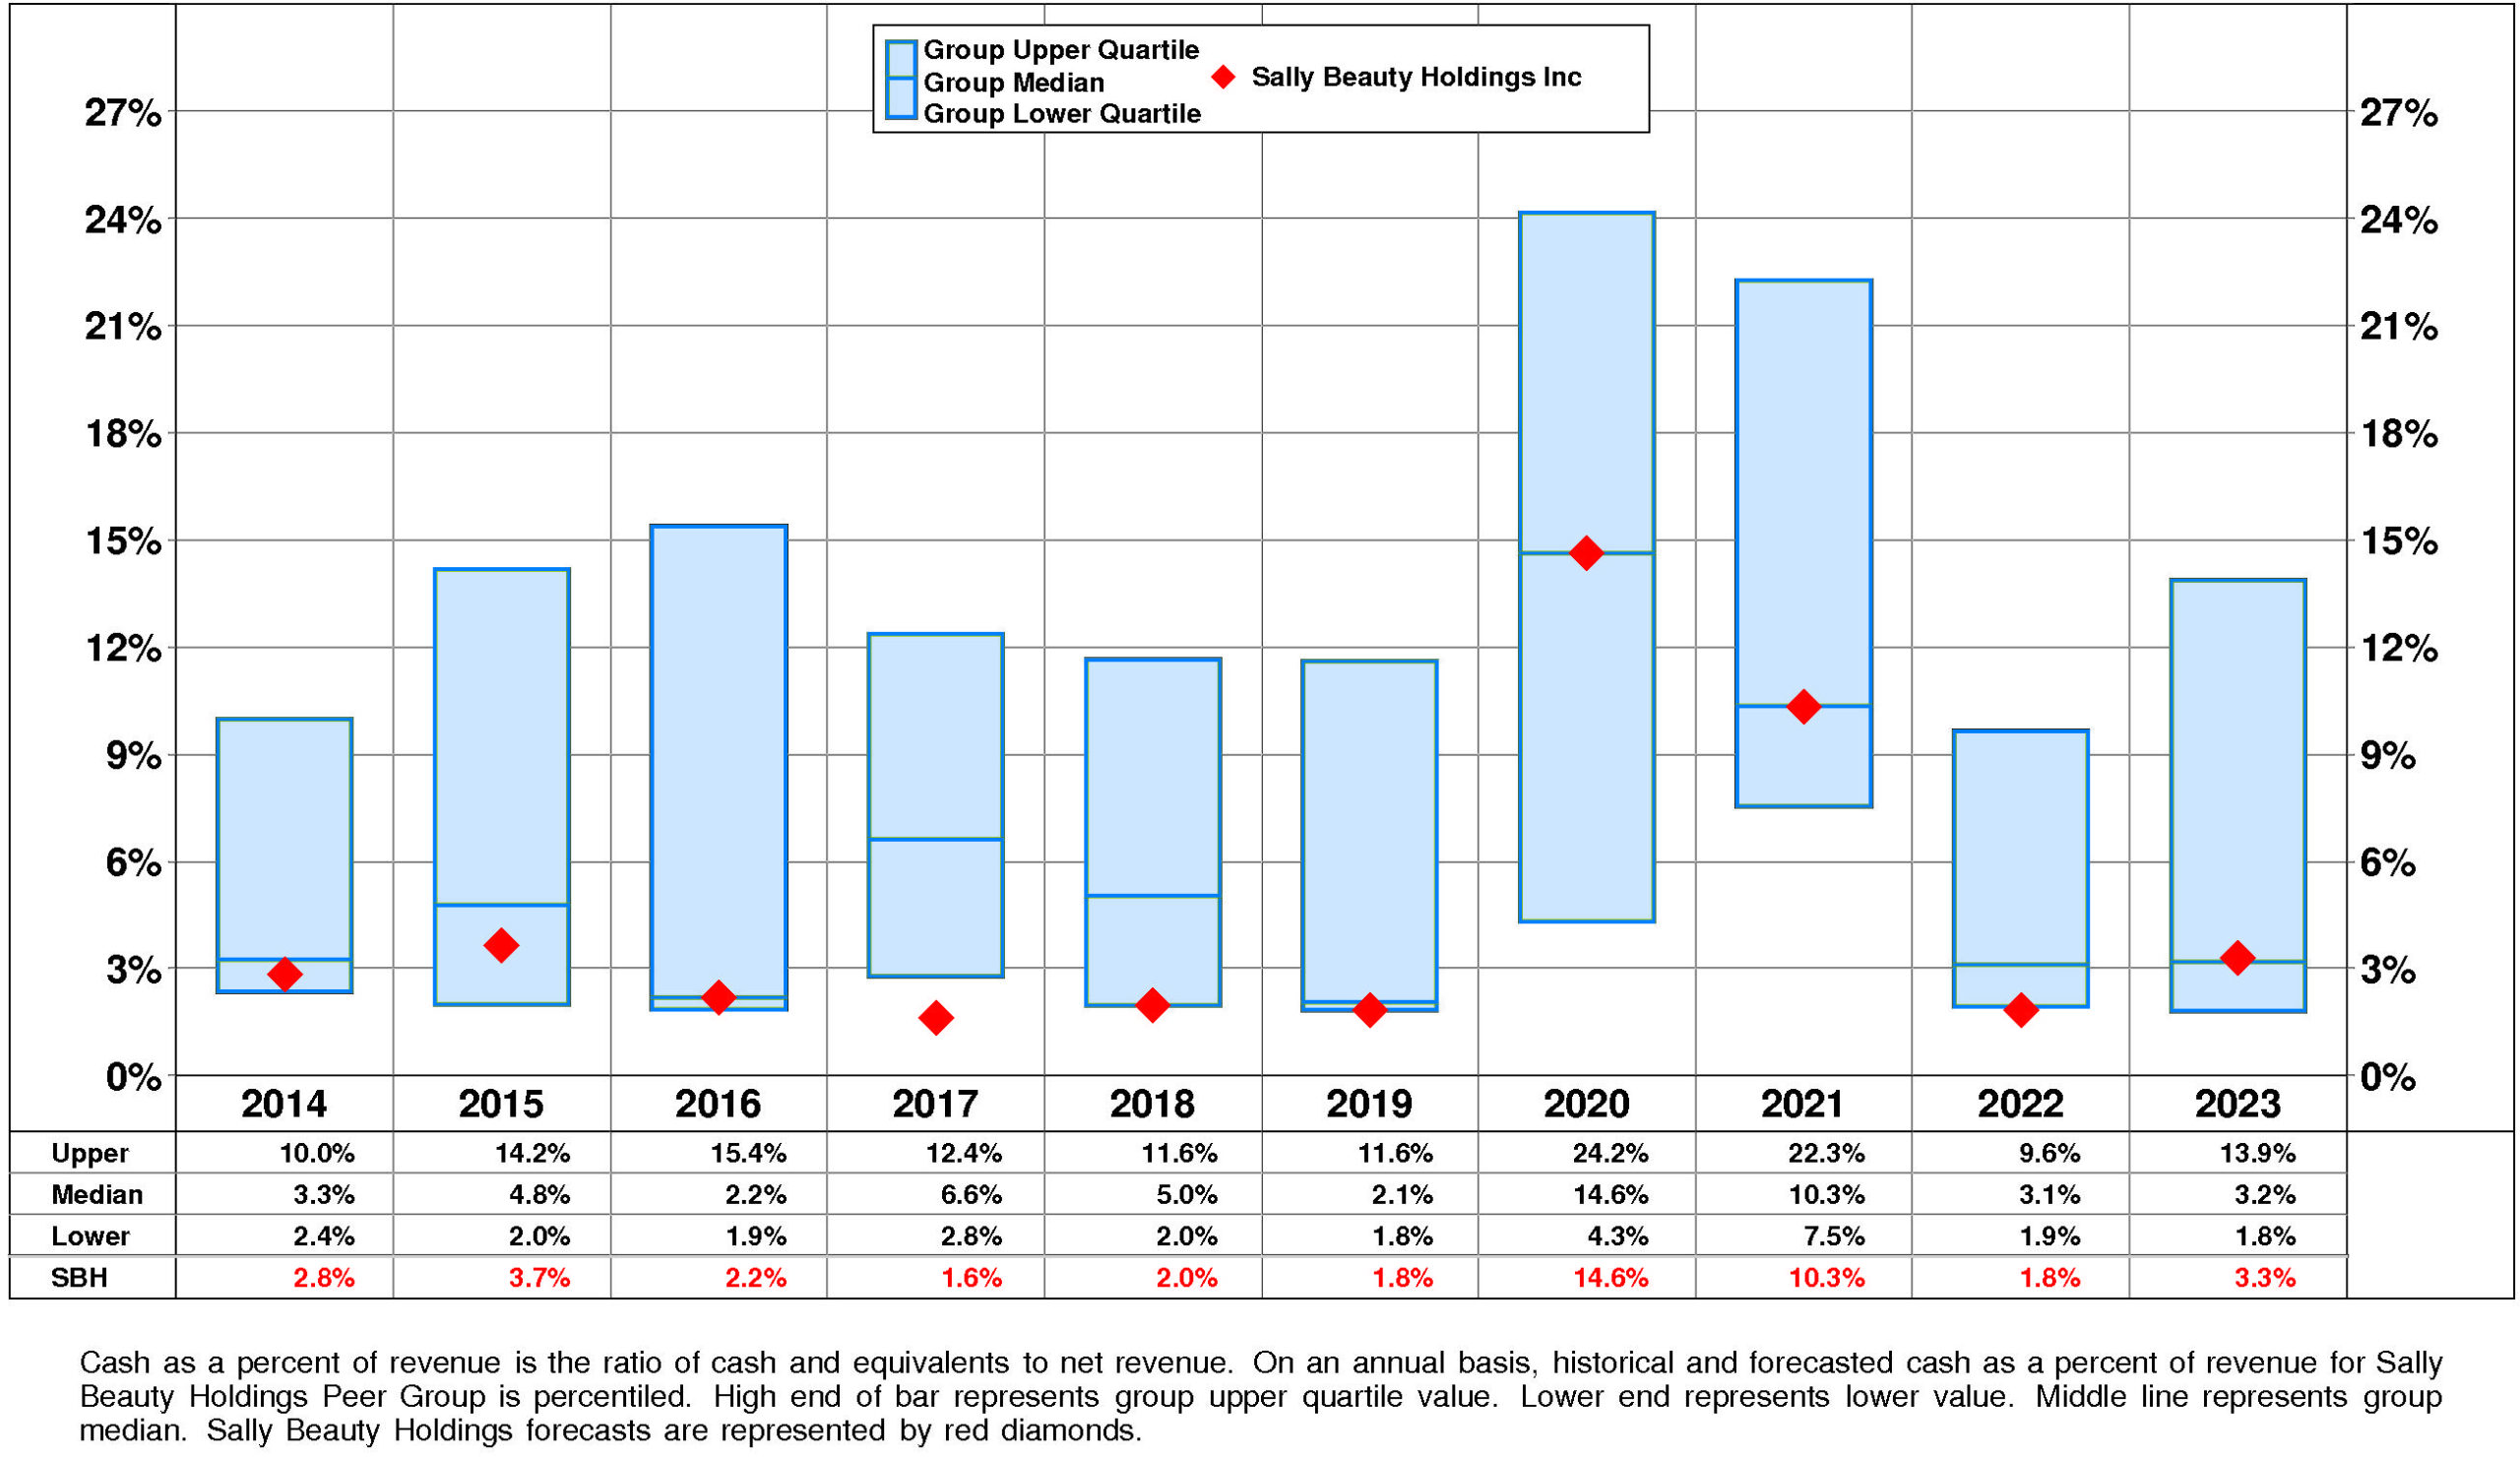
SBH’s Cash, %Revenue has exhibited little to no overall change over the period. This stability was accompanied by stability for the Sally Beauty Holdings Peer Group as well. In most years, Sally Beauty Holdings was in the third quartile and second quartile. Currently, Sally Beauty Holdings is slightly above median at +3%.
PROFITABILITY
SBH’s return on equity has eroded very significantly since 2020. The current level of 31.9% is at the low for the period and is -95.7% from the high.
SBH’s very strong negative trend in pretax operating return significantly augmented by a very strong negative trend in non-operating factors is a significant analytical factor.
The productivity of SBH’s assets declined over the full period 2014-2023: asset turnover has suffered a strong overall downtrend.
SBH’s pretax margin experienced a very strong overall downtrend over the period 2014-2023.
Non-operating factors (income taxes and financial leverage) had a significant negative influence on return on equity.
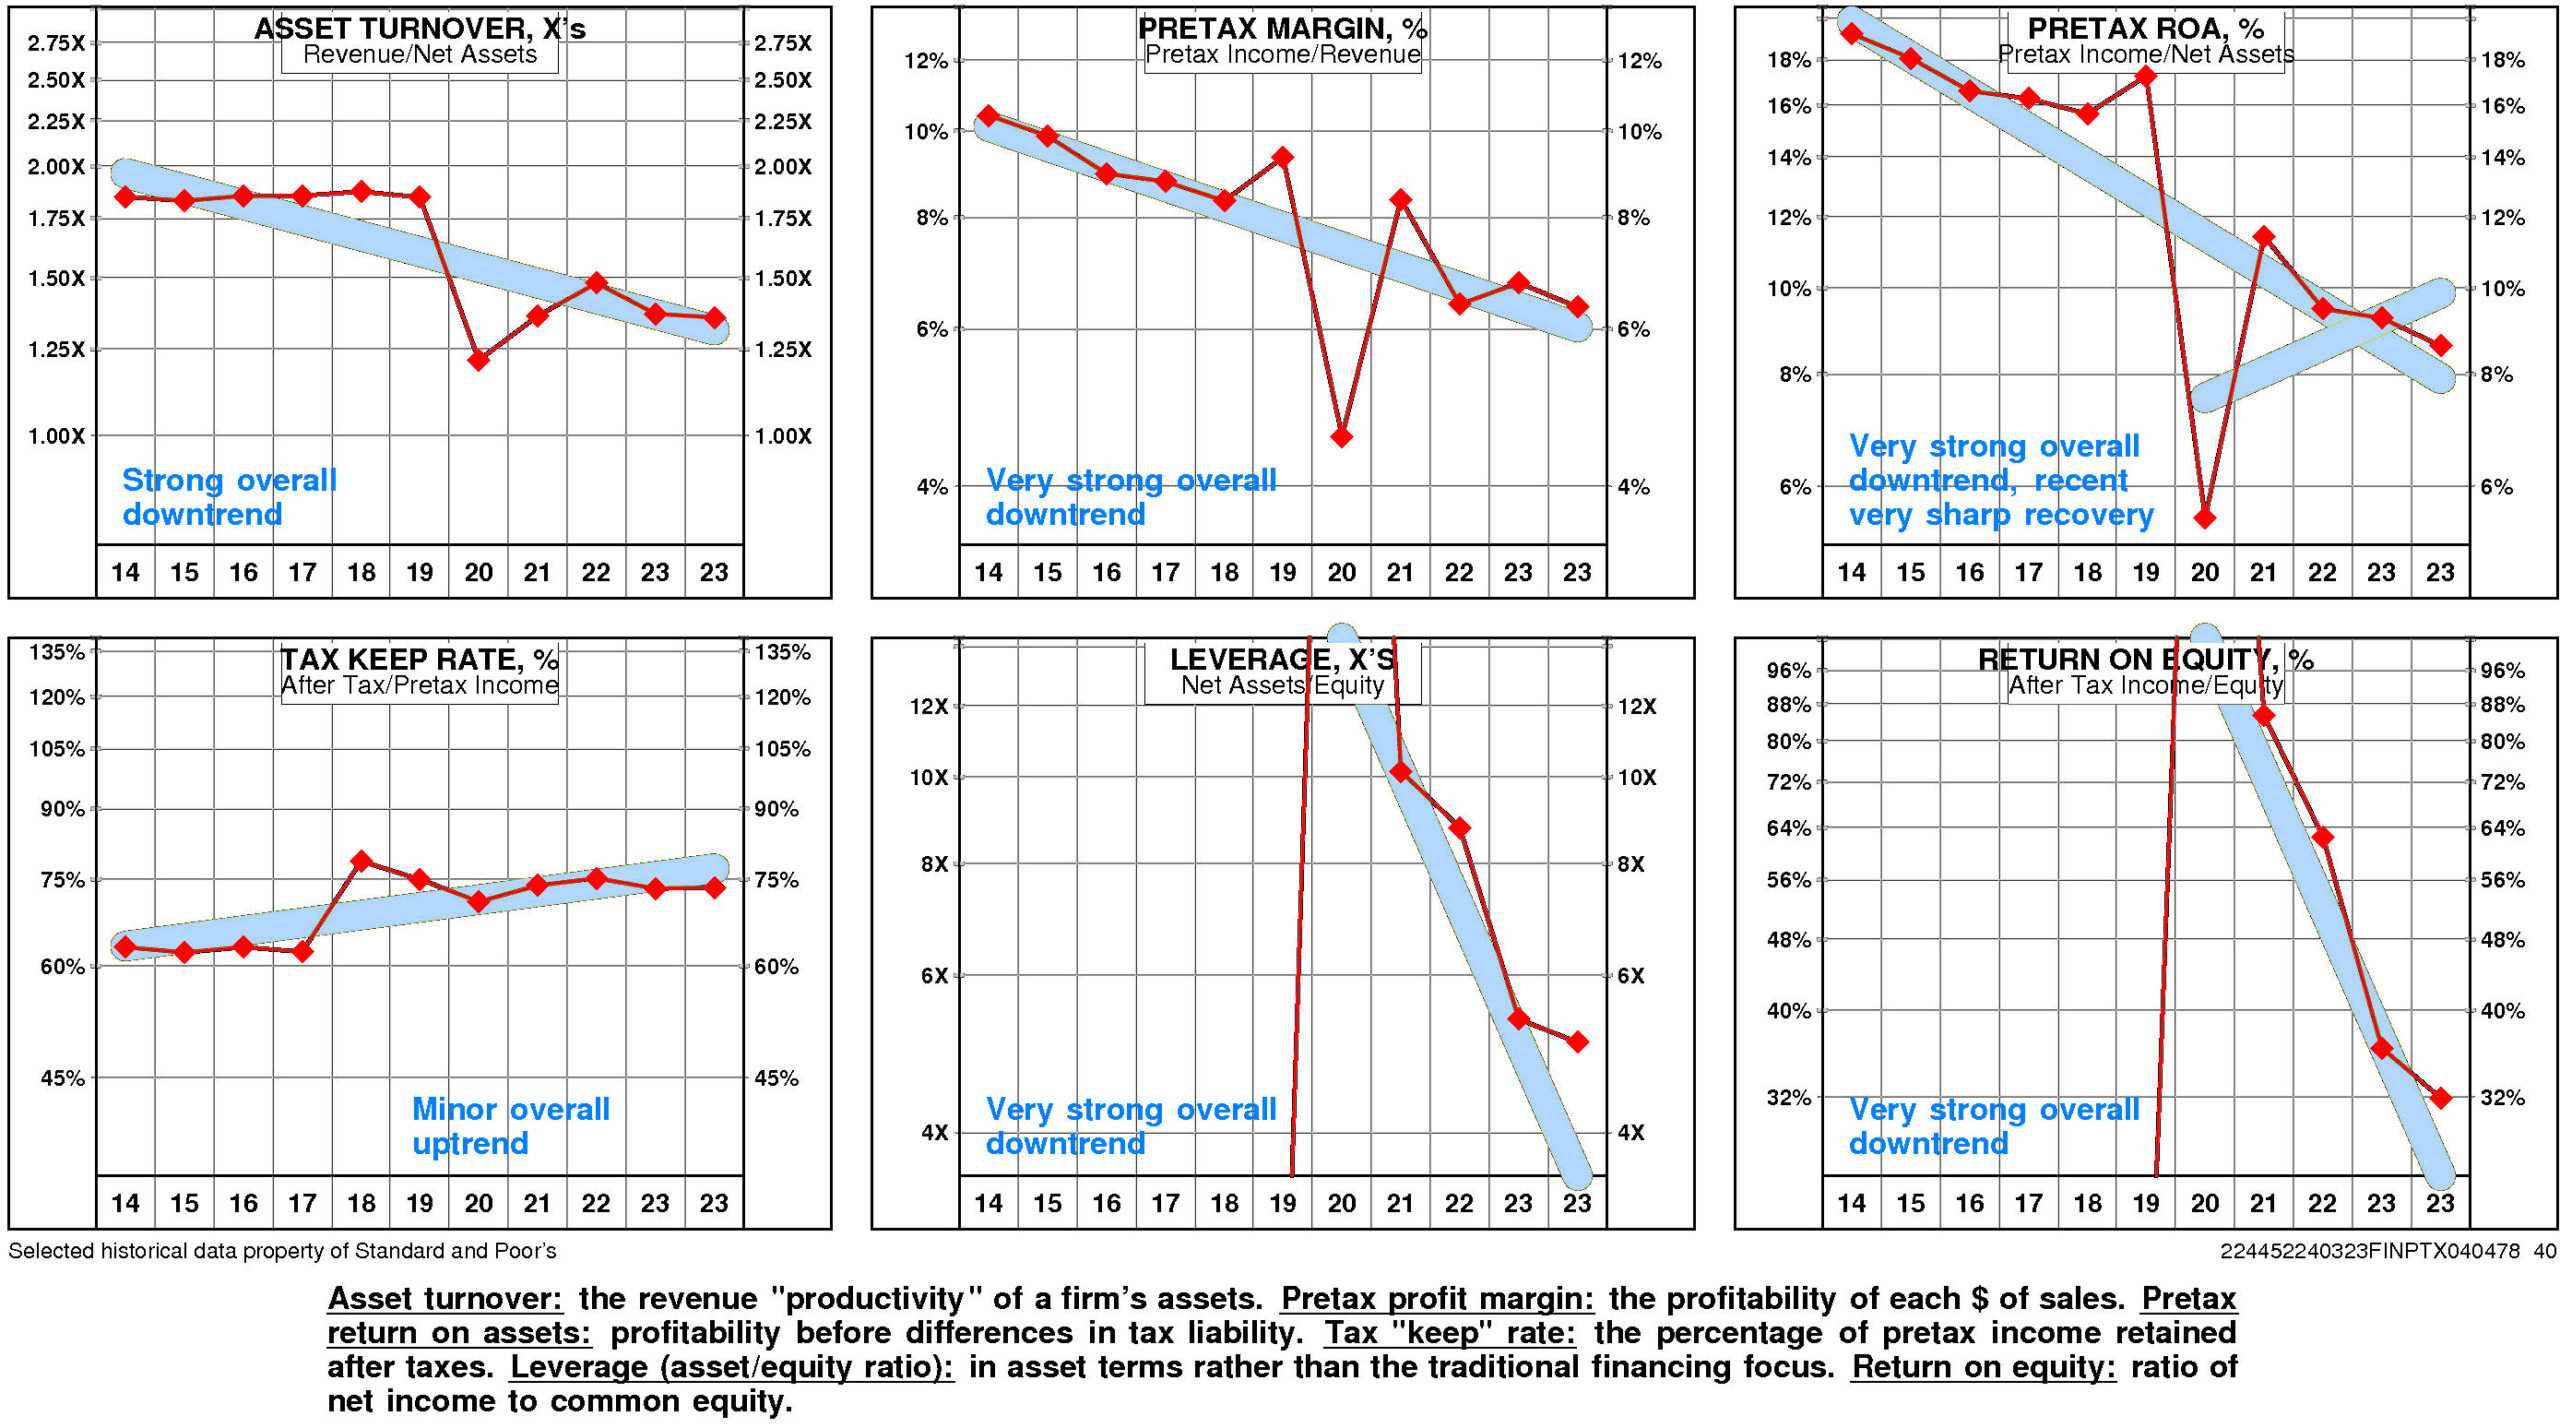
SBH’s return on equity is at the upper quartile (31.9%) for the four quarters ended December, 2023.
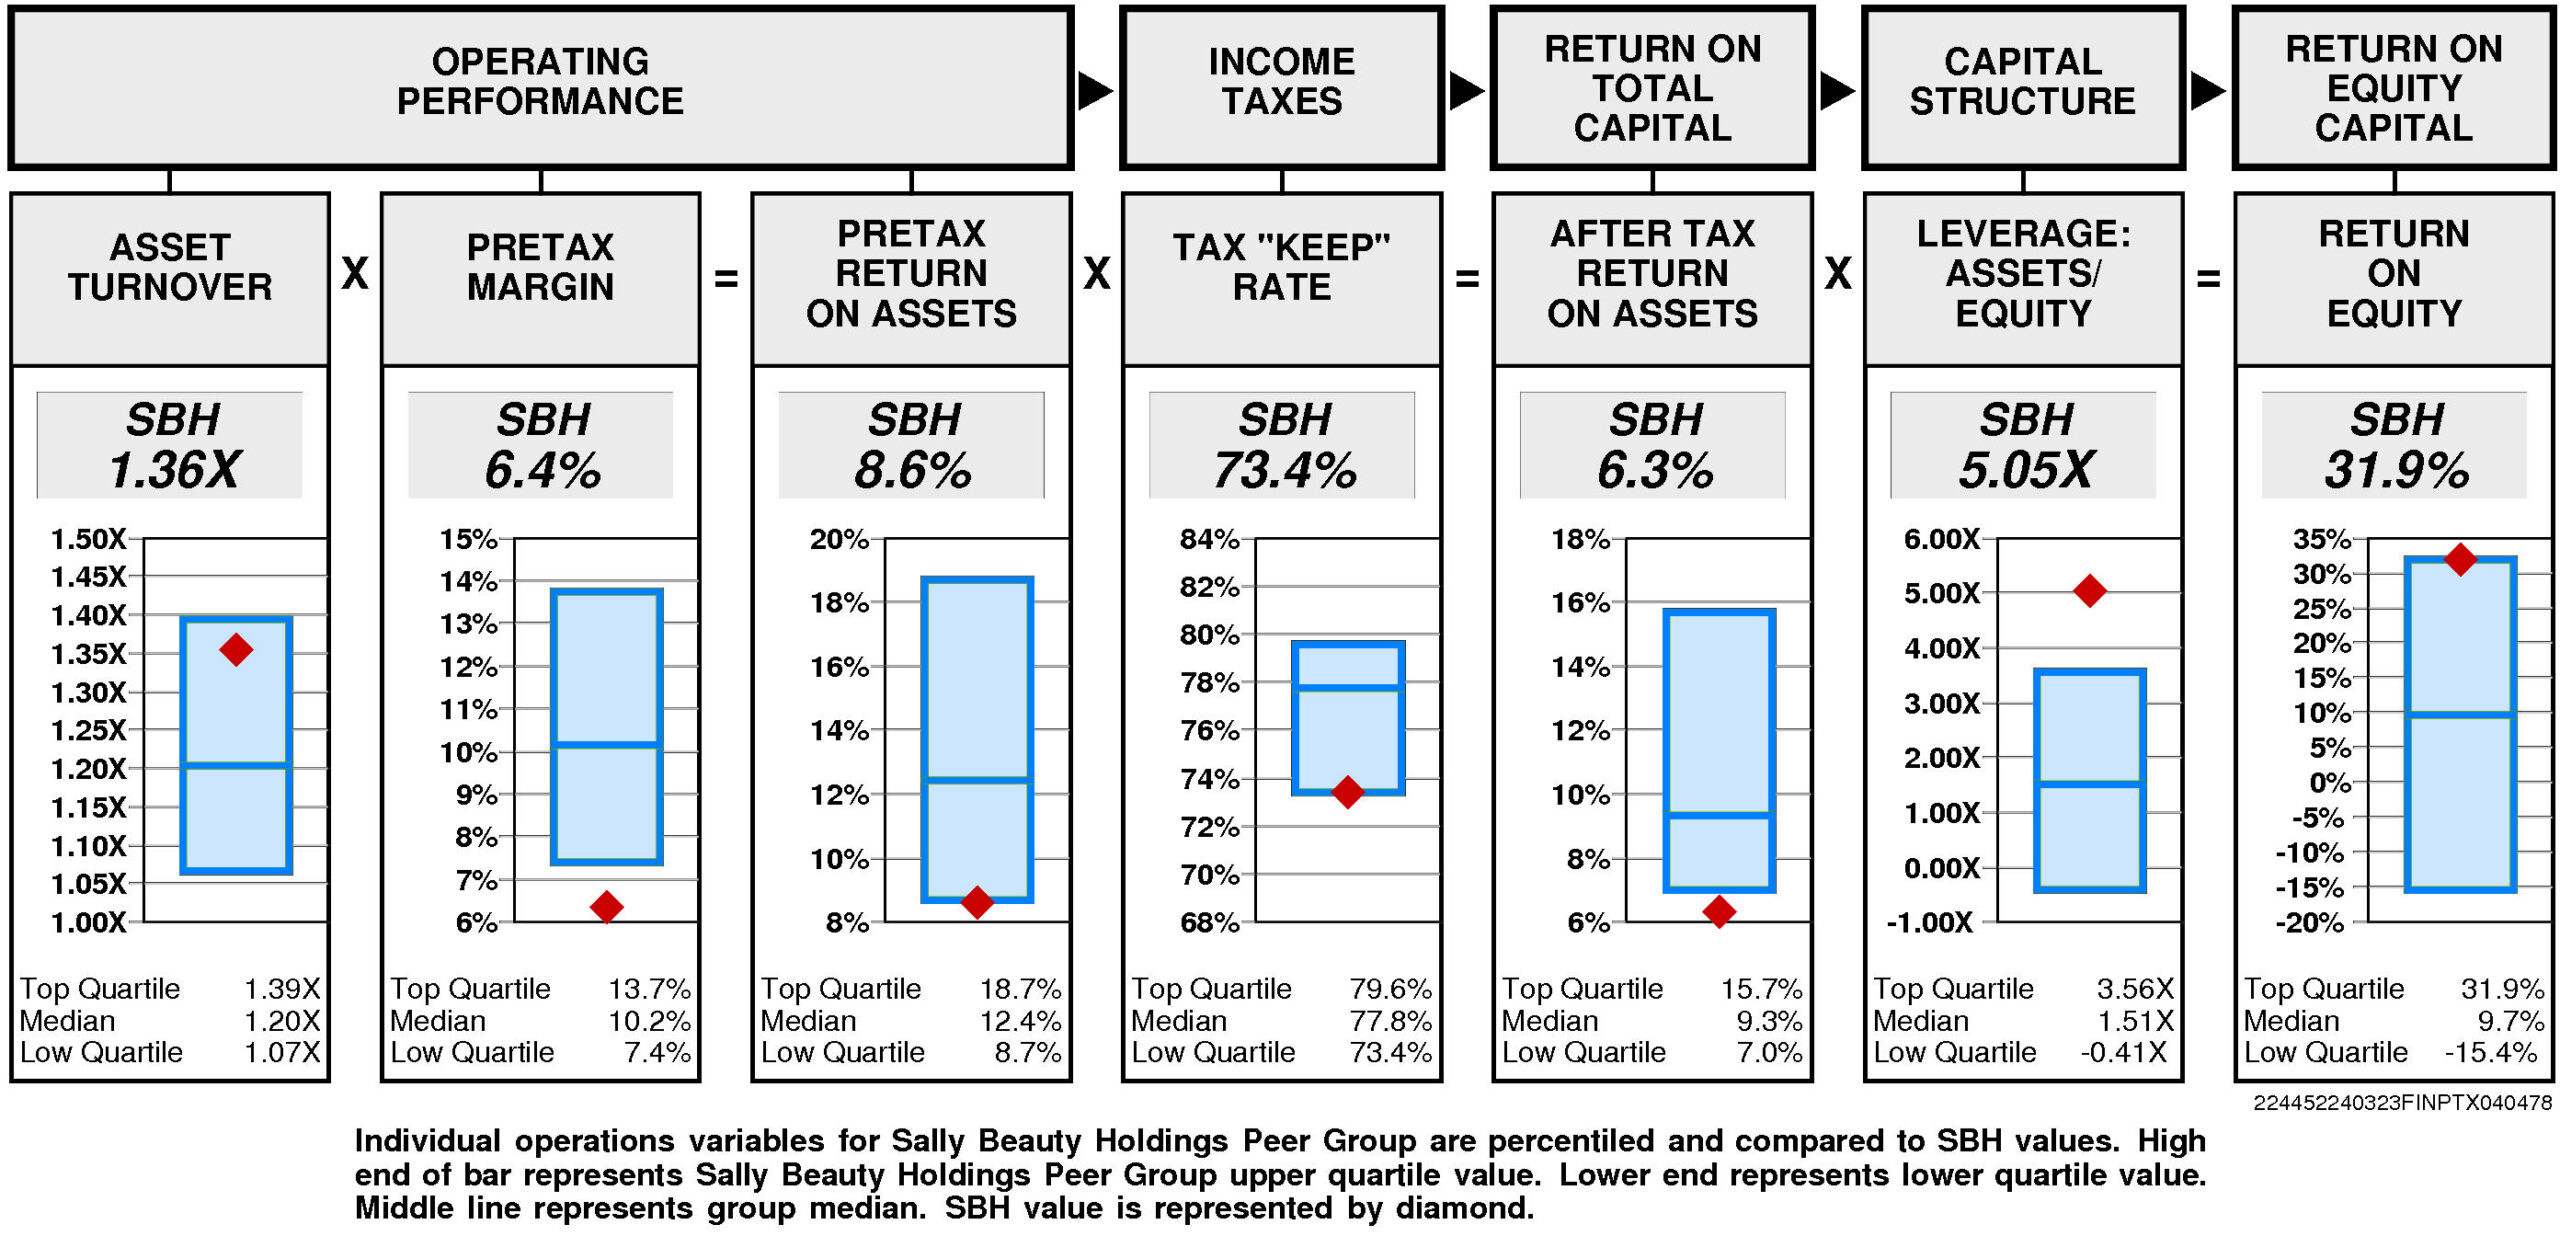
Operating performance (pretax return on assets) is at the lower quartile (8.6%) reflecting asset turnover that is substantially above median (1.36X) and lower quartile pretax margin (6.4%).
Tax “keep” rate (income tax management) is at the lower quartile (73.4%) resulting in after tax return on assets that is lower quartile.
Financial leverage (leverage) is upper quartile (5.05X).
GROWTH RATES
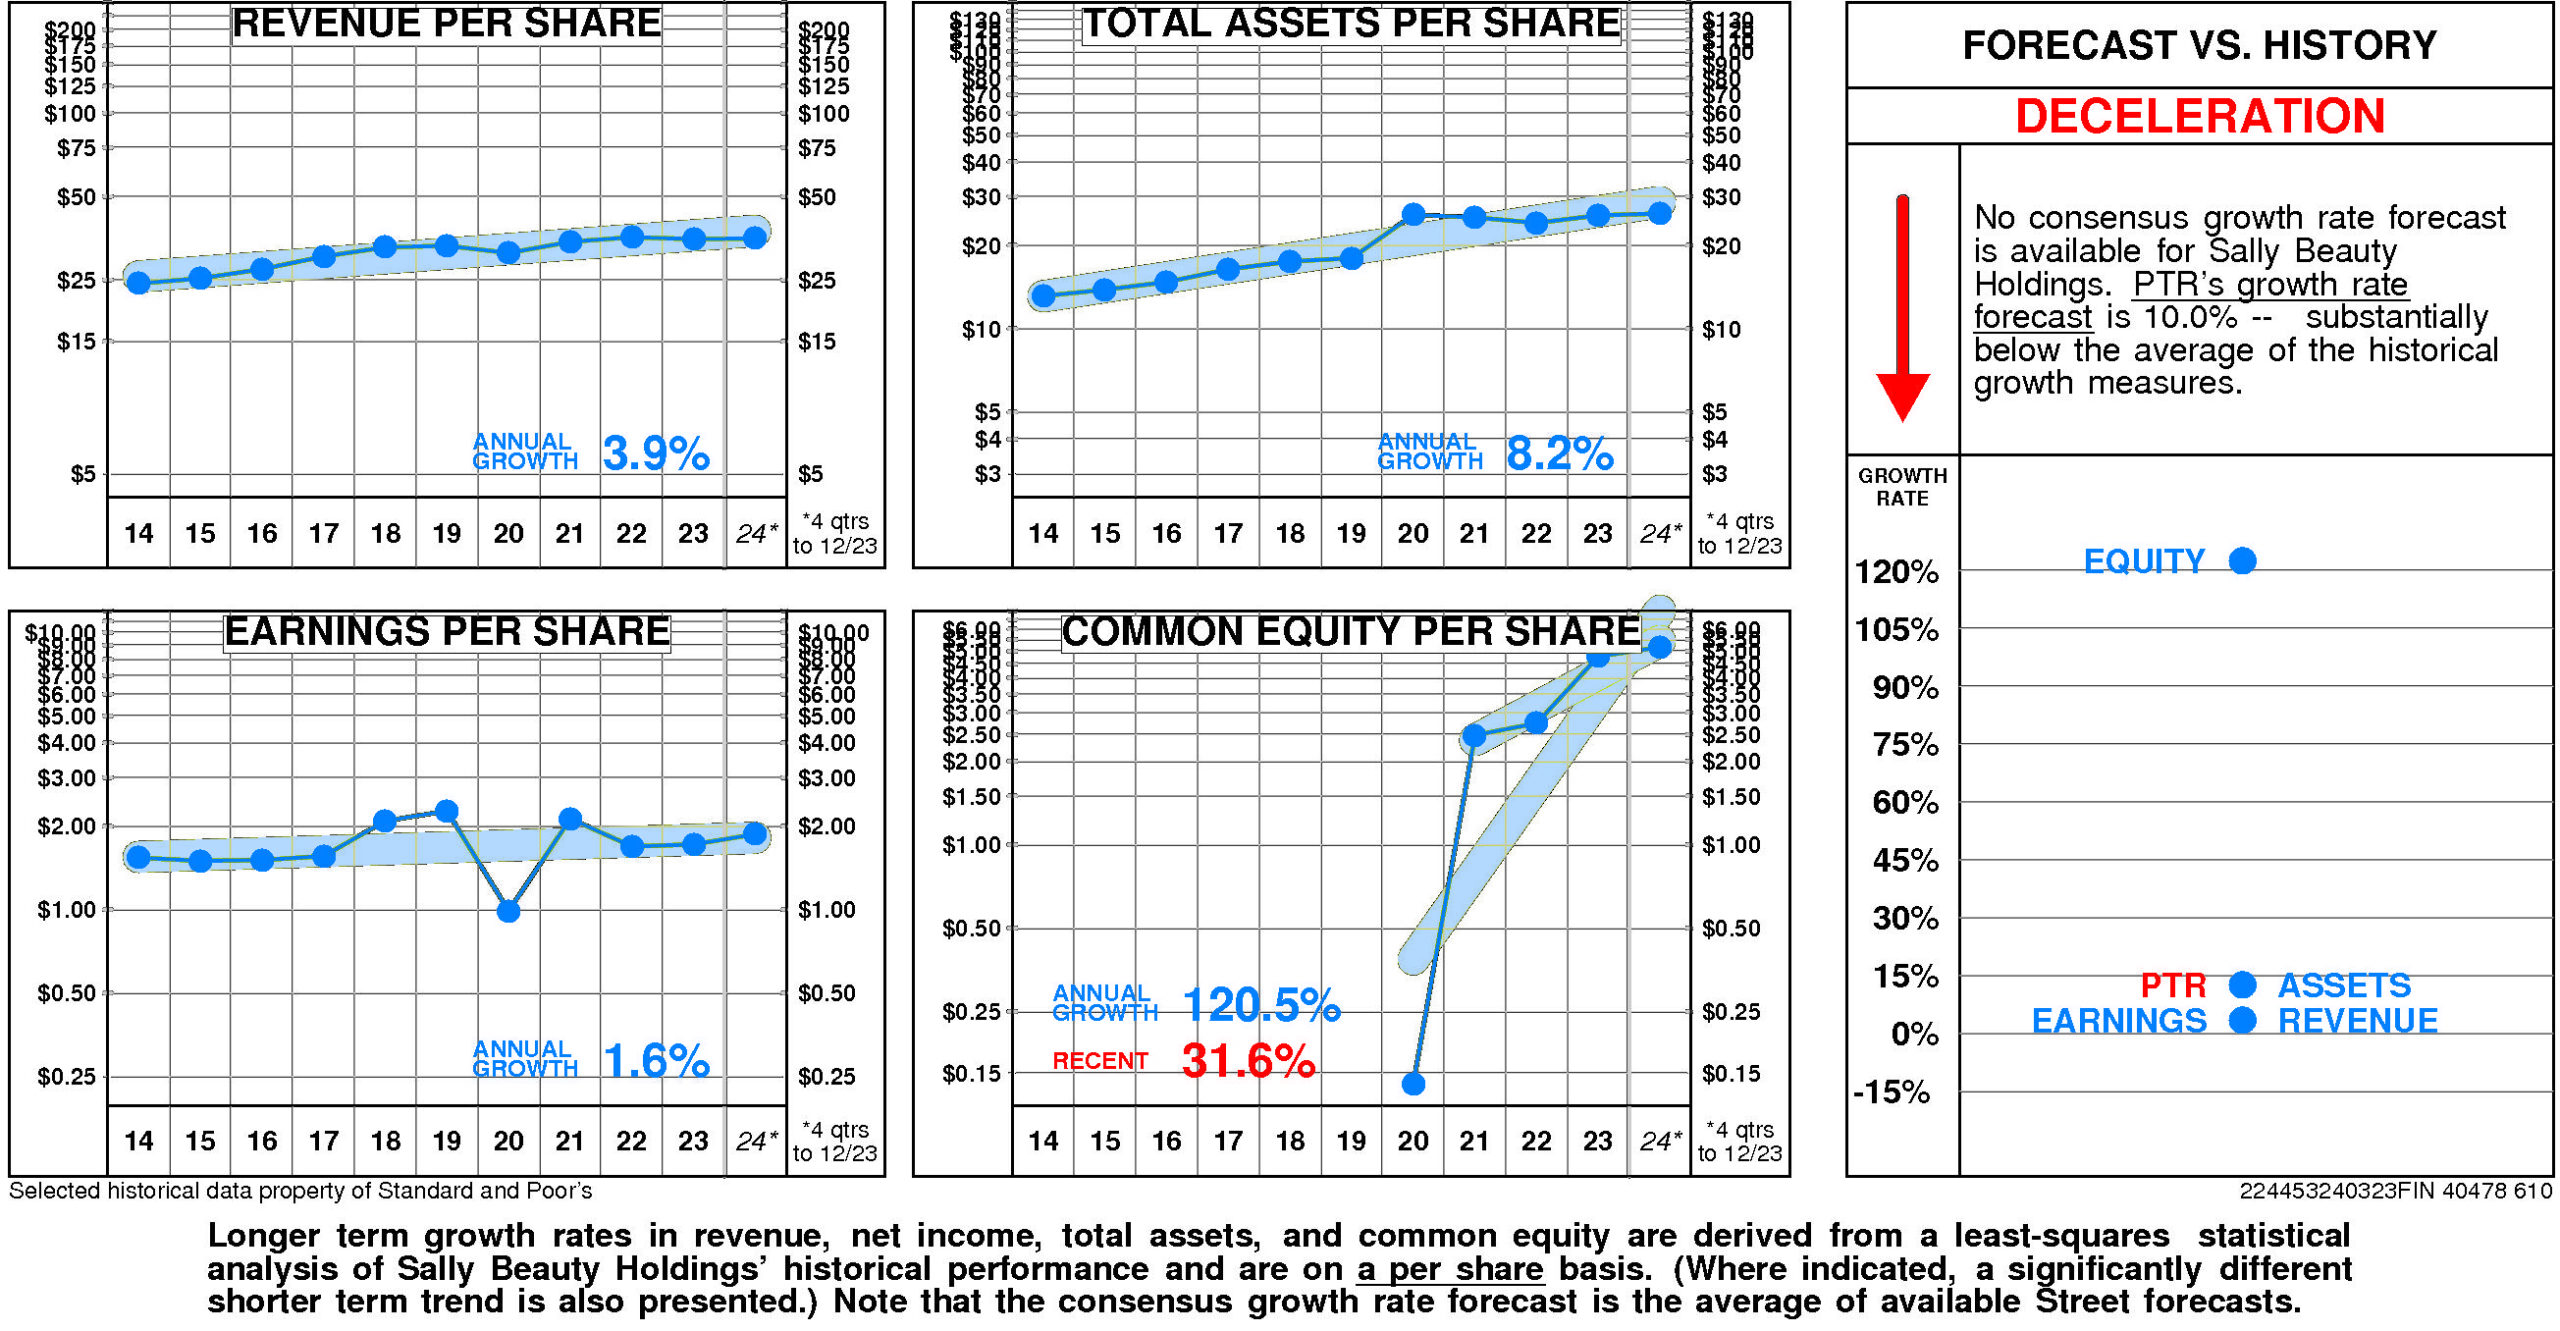
Overall, Sally Beauty Holdings’ growth rate has slowed considerably in recent years.
Sally Beauty Holdings’ historical income statement growth and balance sheet growth have diverged. Revenue growth has paralleled asset growth; earnings growth has fallen short of equity growth.
Annual revenue growth has been 3.9% per year.
Total asset growth has been 8.2% per year.
Annual E.P.S. growth has been 1.6% per year.
Equity growth has been 120.5% per year. (More recently it has been 31.6%.)
No consensus growth rate forecast is available for Sally Beauty Holdings.
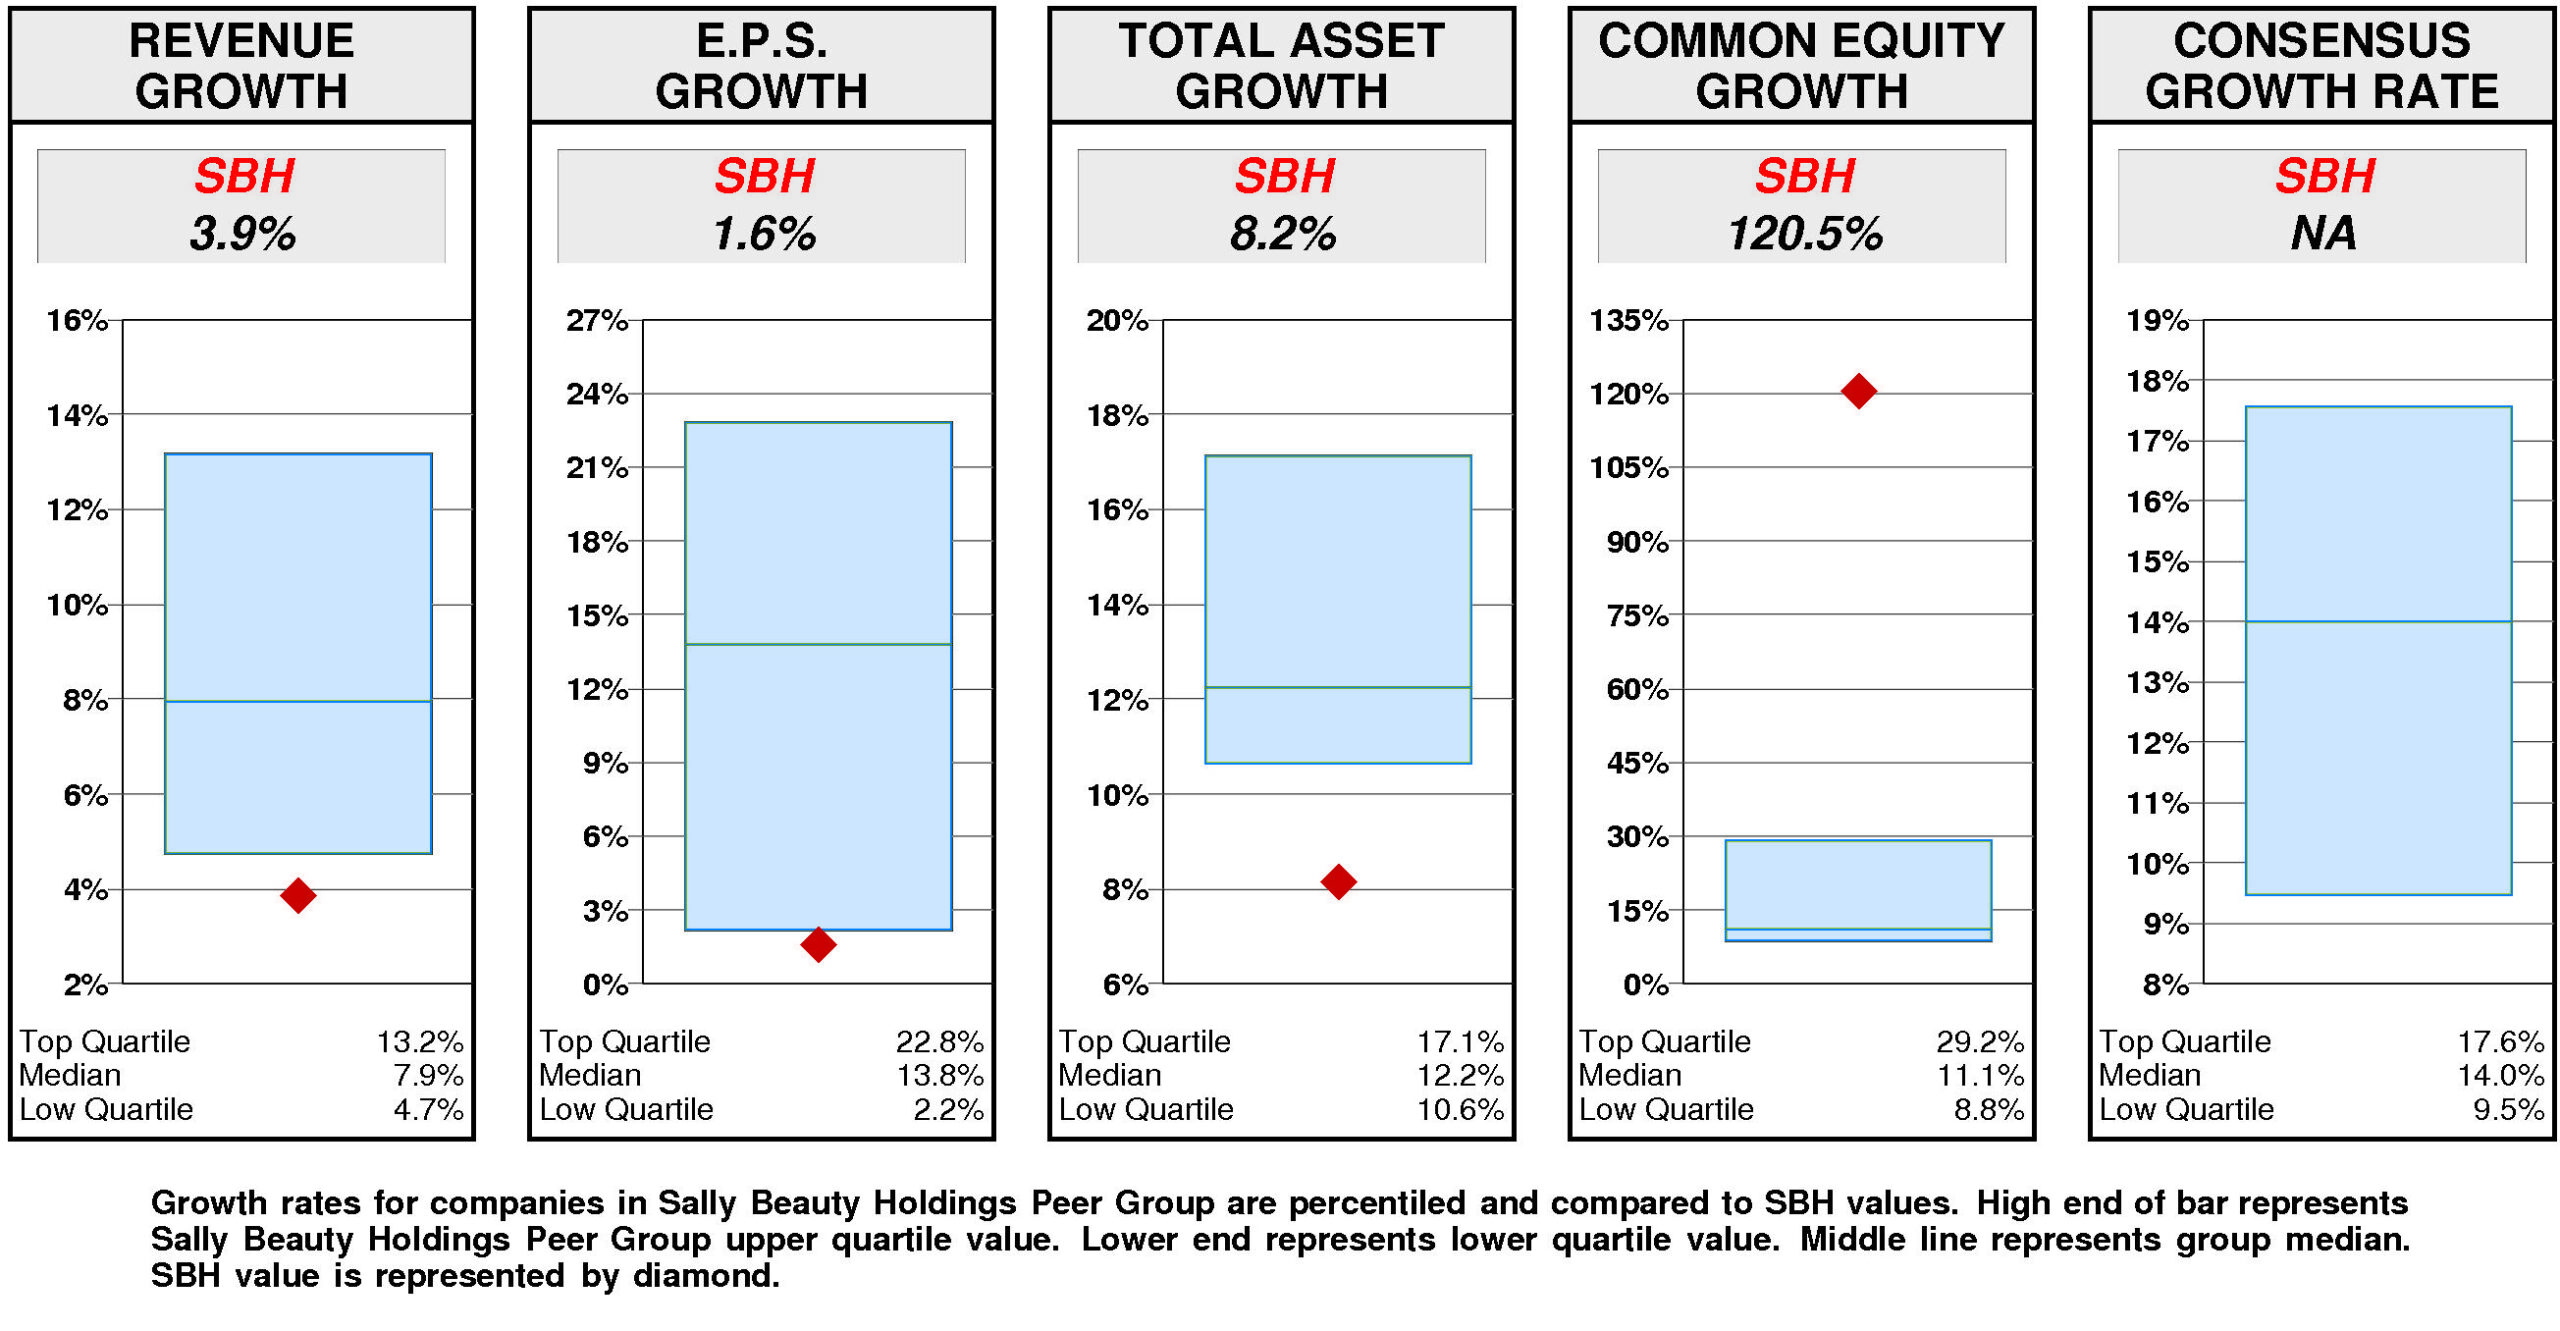
Relative to the Sally Beauty Holdings Peer Group, Sally Beauty Holdings’ historical growth measures are generally lower quartile. Equity growth (120.5%) has been upper quartile. Total asset growth (8.2%) has been lower quartile. Revenue growth (3.9%) has been lower quartile. E.P.S. growth (1.6%) has been lower quartile.
Consensus growth forecast is unavailable.
PRICE HISTORY
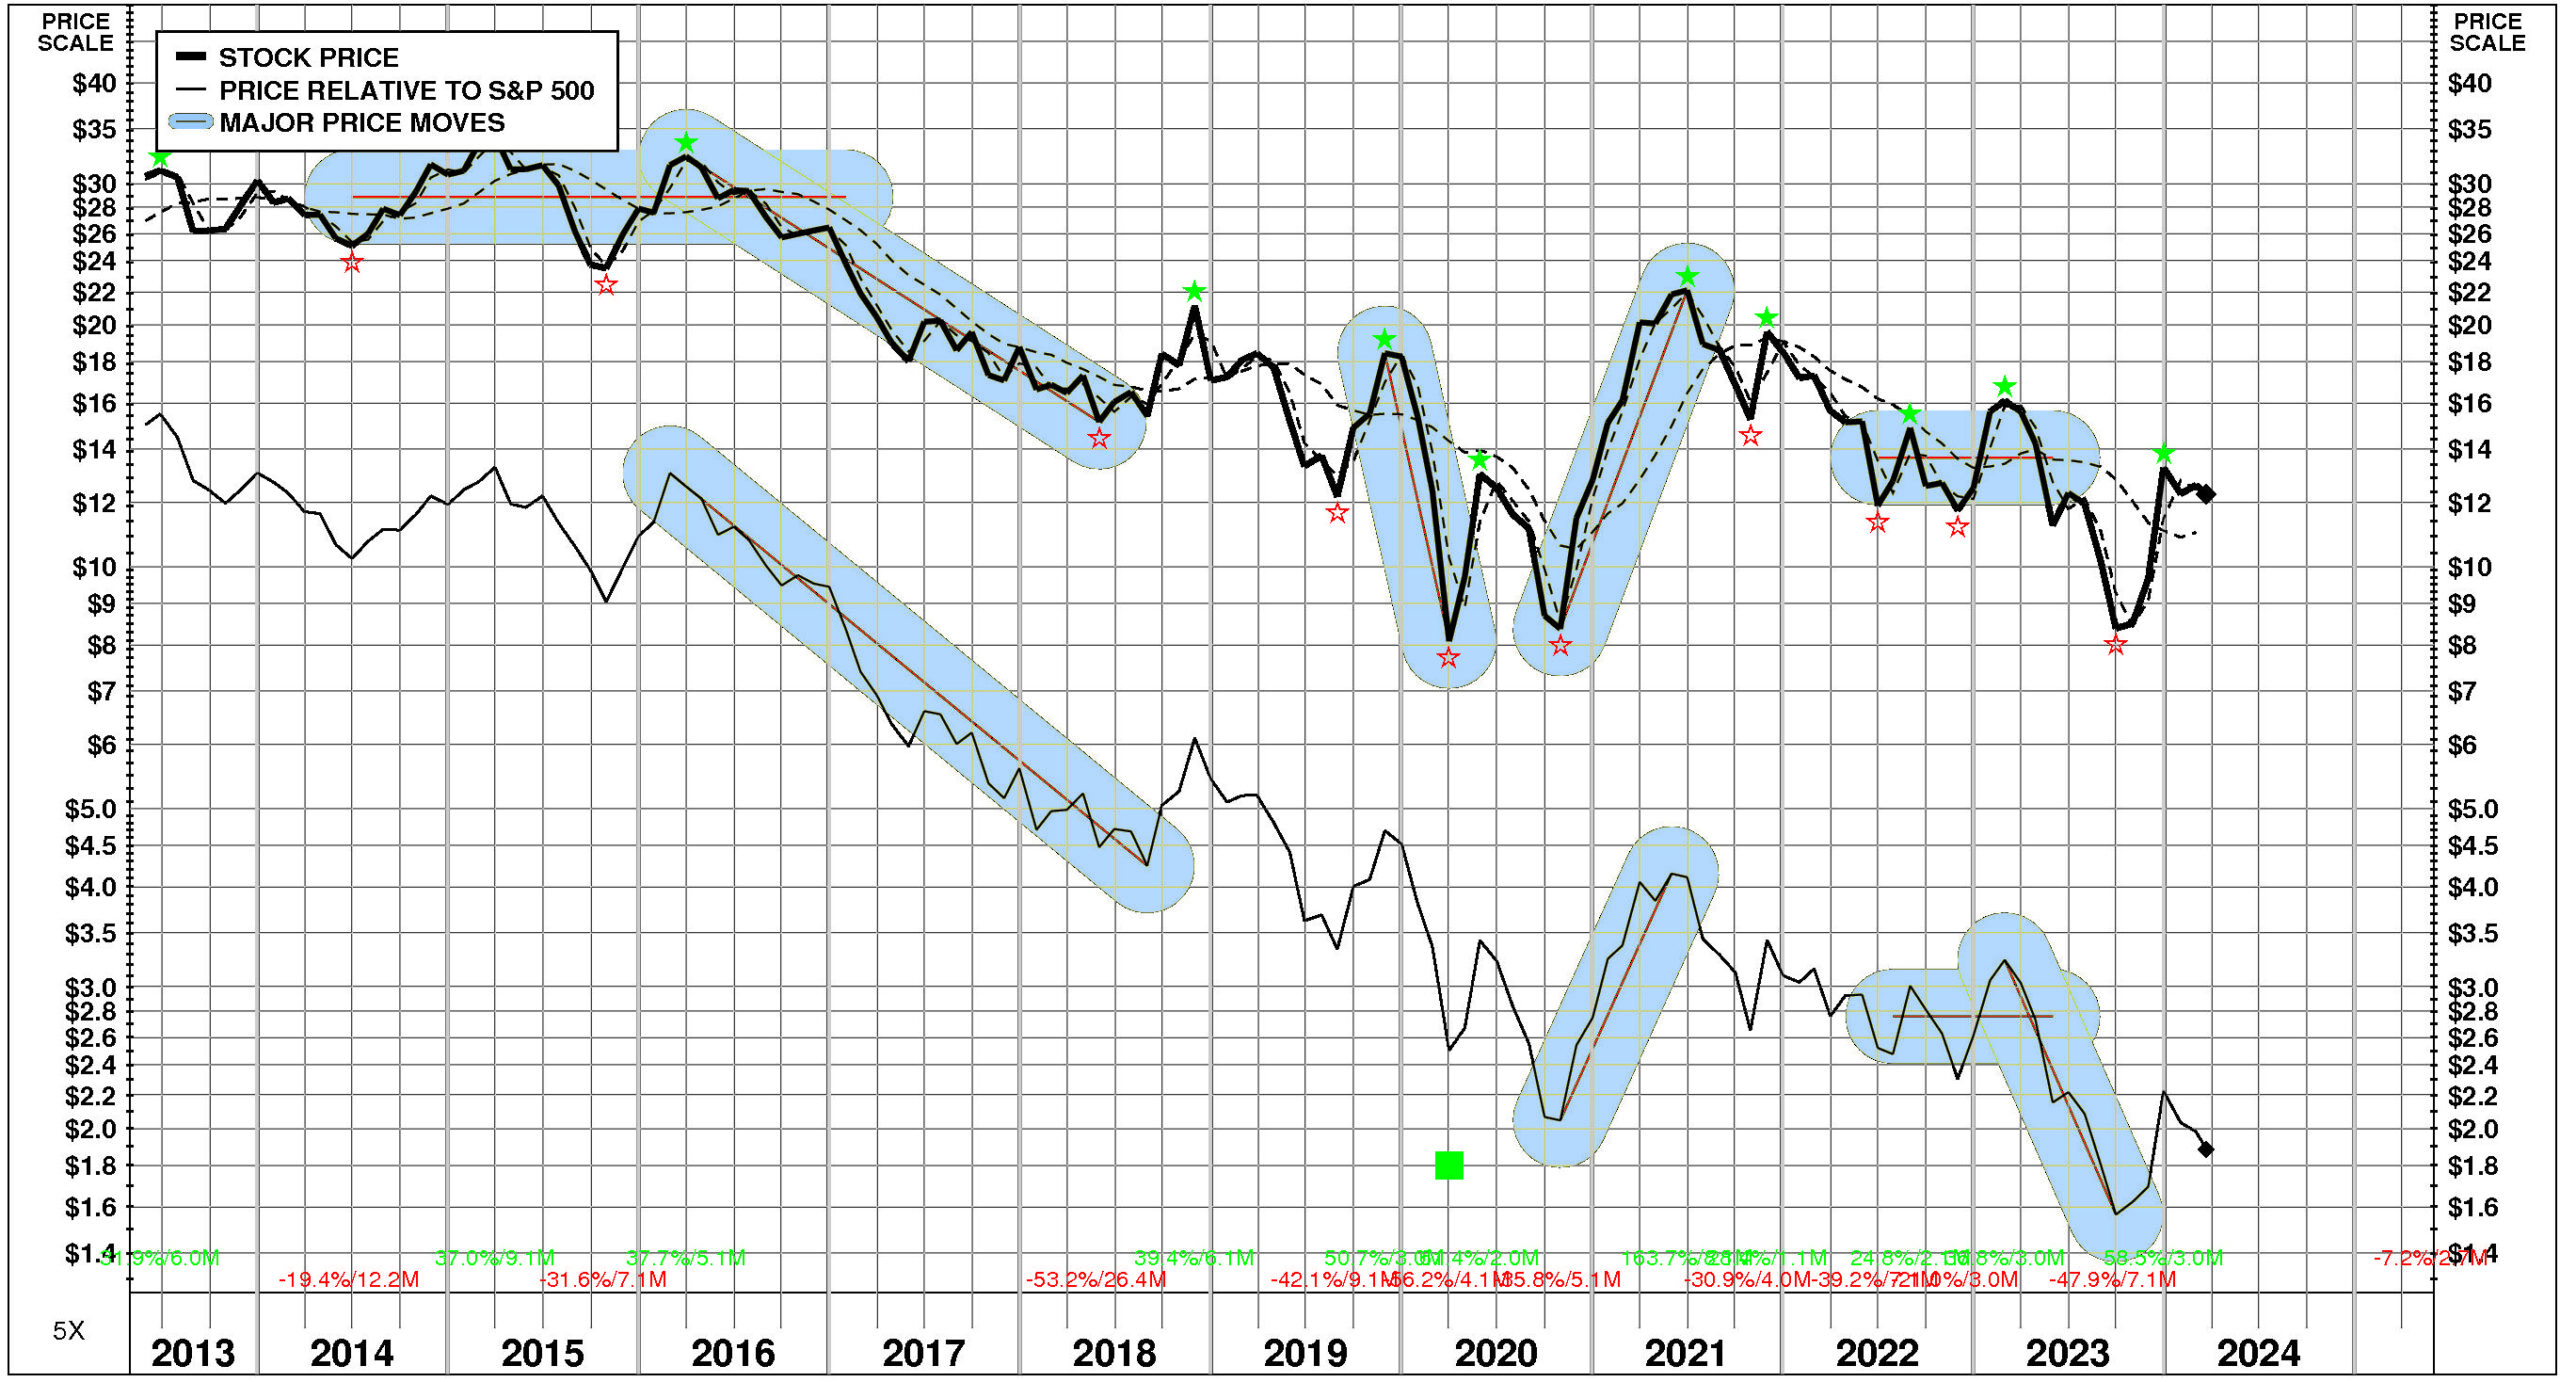
Over the full time period, Sally Beauty Holdings’ stock price performance has been volatile and significantly below market. Between May, 2013 and March, 2024, Sally Beauty Holdings’ stock price fell -60%; relative to the market, this was a -87% loss. Significant price moves during the period: 1) October, 2020 – June, 2021: +164%; 2) November, 2019 – March, 2020: -56%; and 3) March, 2016 – May, 2018: -53%.
TOTAL INVESTMENT RETURNS
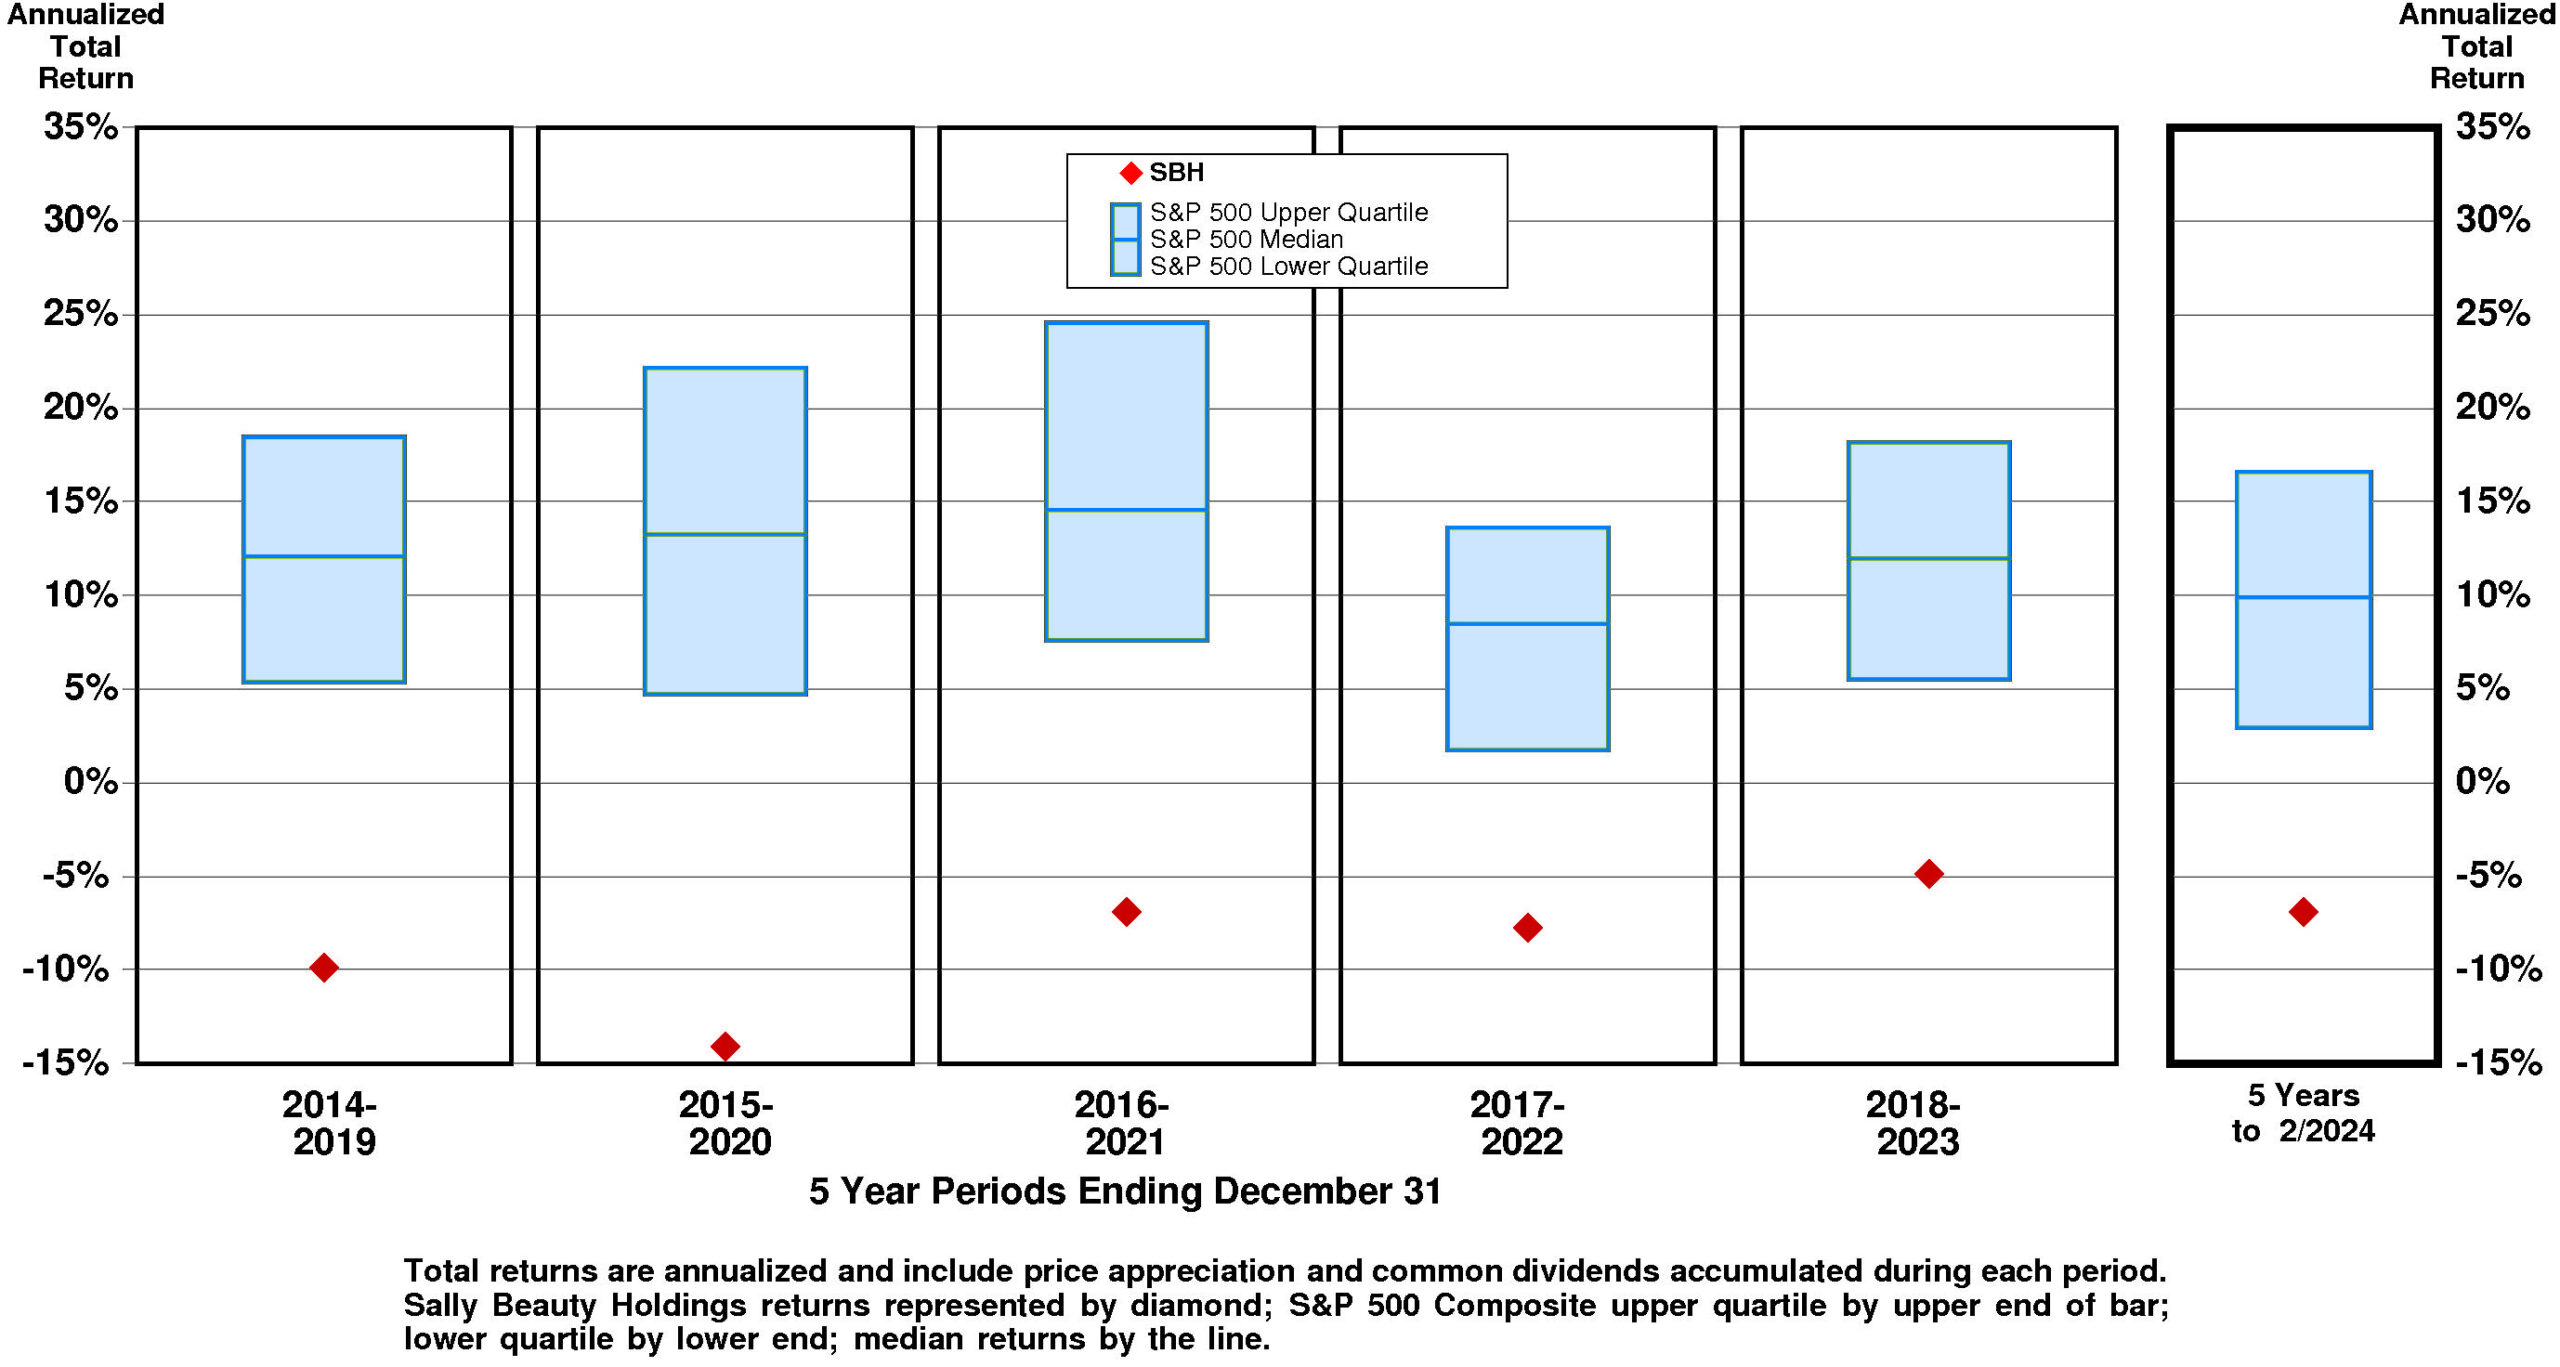
Current annual total return performance of -21.5% is lower quartile relative to the S&P 500 Composite.
In addition to being lower quartile relative to S&P 500 Composite, current annual total return performance through February, 2024 of -21.5% is lower quartile relative to Sally Beauty Holdings Inc Peer Group.
Current 5-year total return performance of -6.9% is lower quartile relative to the S&P 500 Composite.
Through February, 2024, with lower quartile current 5-year total return of -6.9% relative to S&P 500 Composite, Sally Beauty Holdings’ total return performance is lower quartile relative to Sally Beauty Holdings Inc Peer Group.
VALUATION BENCHMARKS
Relative to S&P 500 Composite, SBH’s overall valuation is quite low. The highest factor, the price/equity ratio, is below median. Ratio of enterprise value/assets is near the lower quartile. Ratio of enterprise value/earnings before interest and taxes is lower quartile. Price/earnings ratio is lower quartile. The lowest factor, the ratio of enterprise value/revenue, is lower quartile.
Relative to Sally Beauty Holdings Peer Group, SBH’s overall valuation is quite low. The highest factor, the price/equity ratio, is at median. Ratio of enterprise value/earnings before interest and taxes is lower quartile. Ratio of enterprise value/assets is at the lower quartile. Ratio of enterprise value/revenue is at the lower quartile. The lowest factor, the price/earnings ratio, is lower quartile.
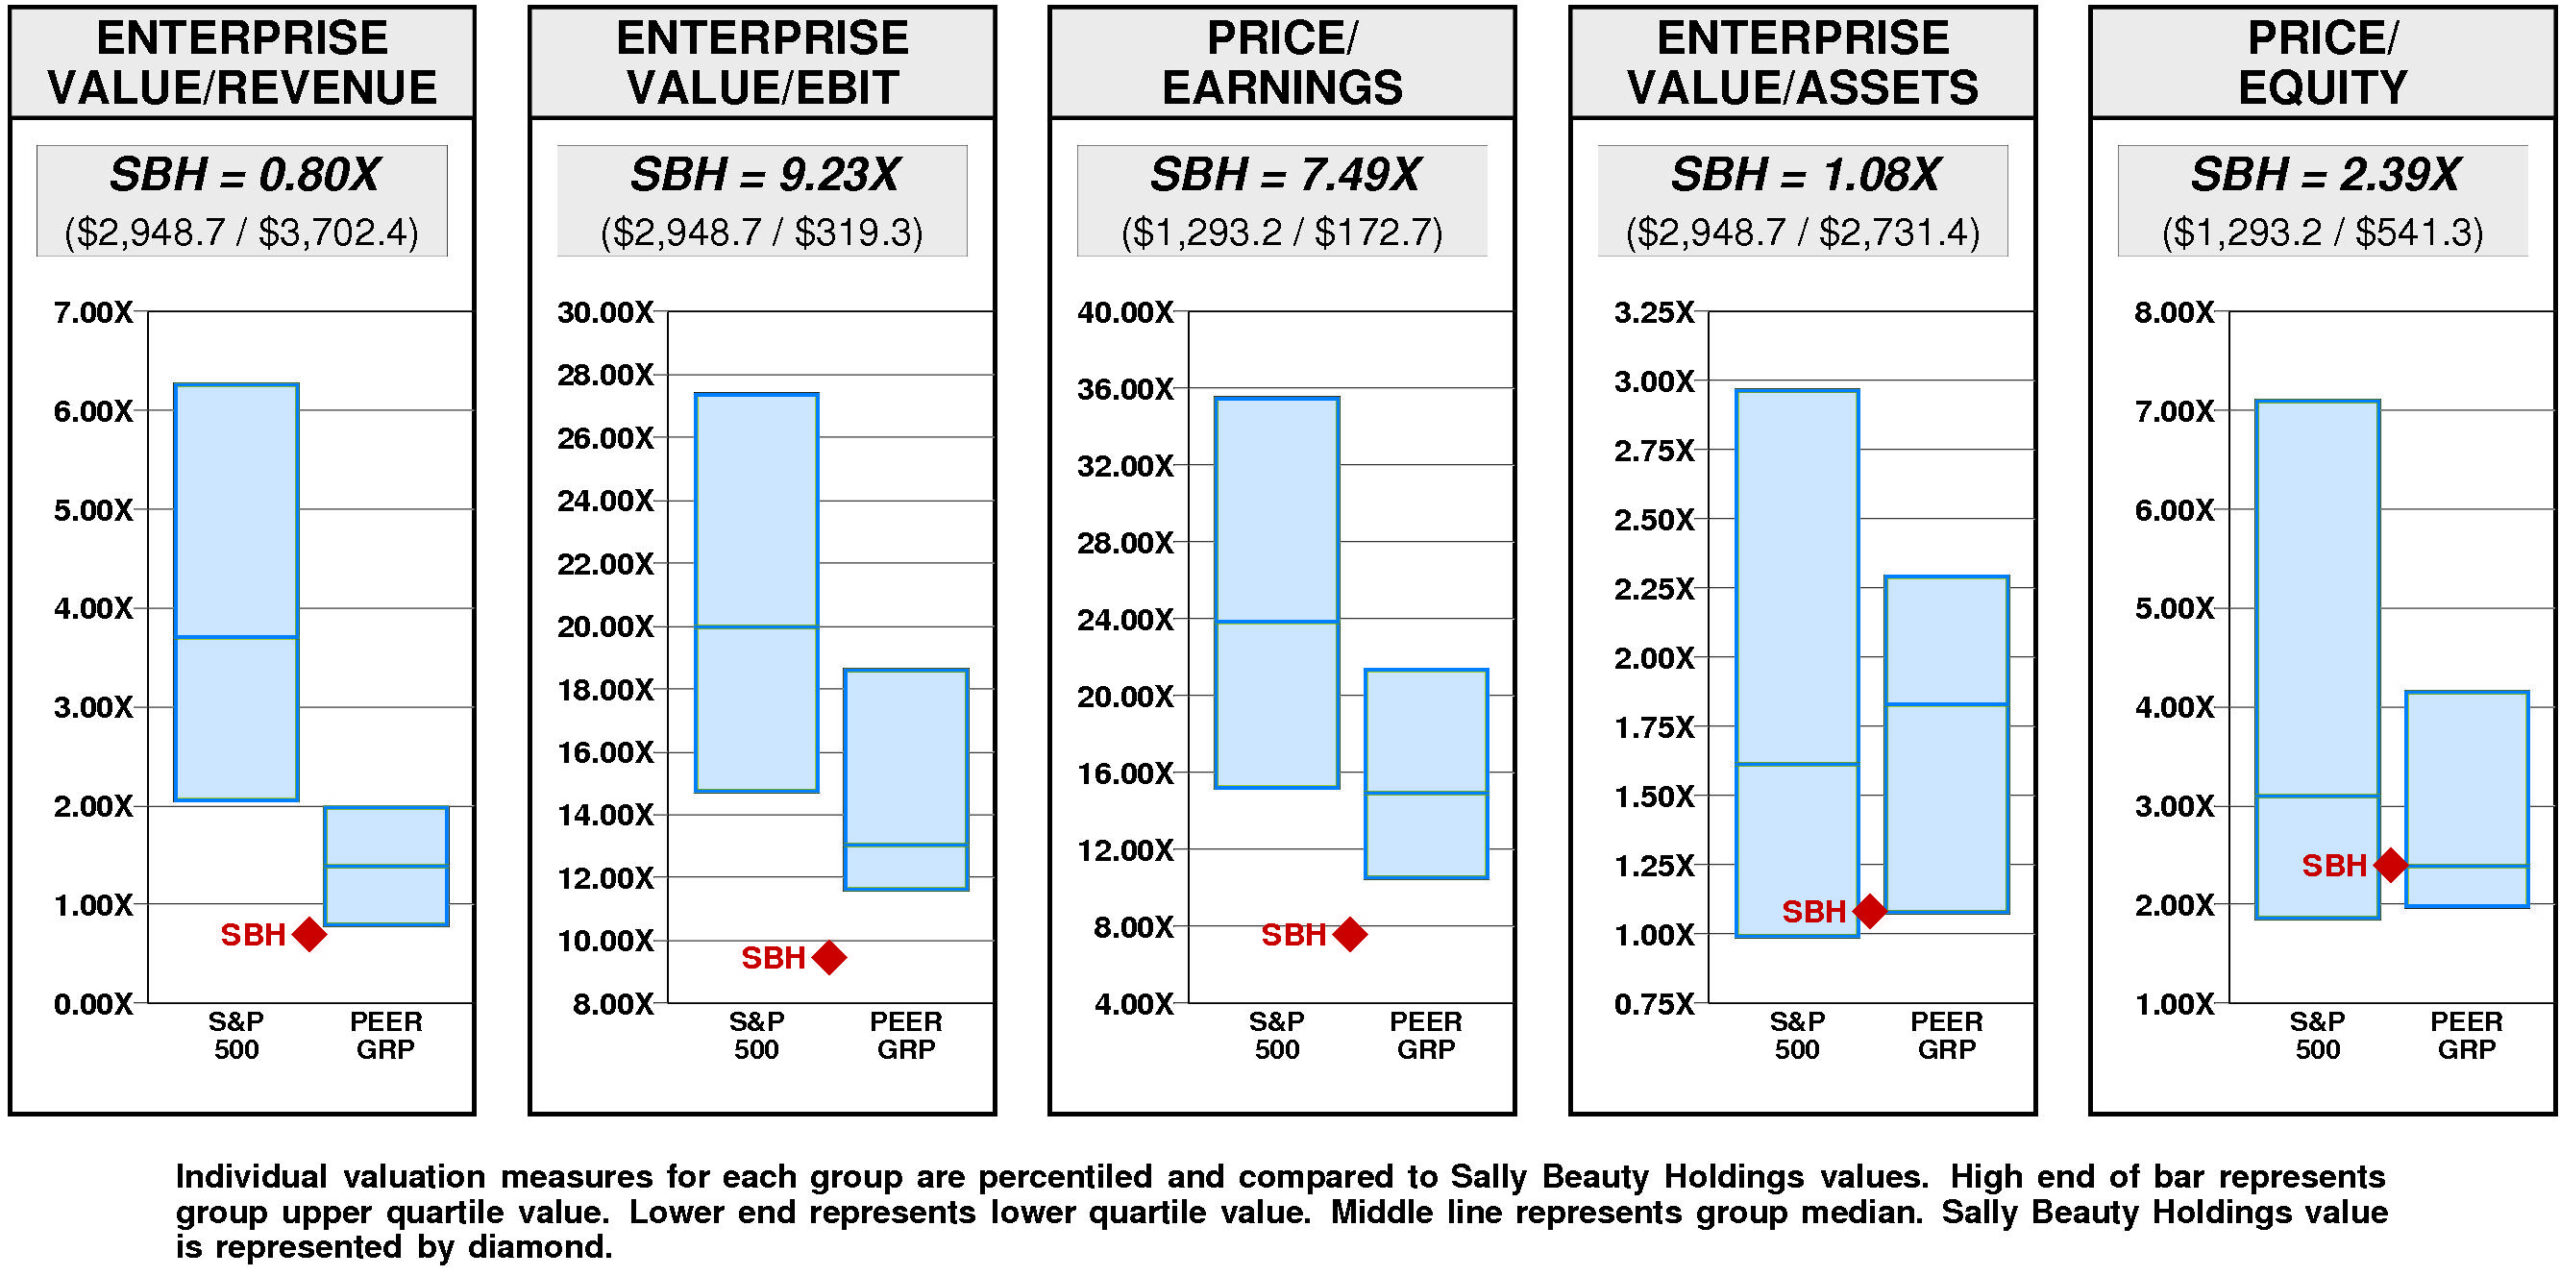
Sally Beauty Holdings has a major value gap compared to the median. For SBH to hit median valuation, its current ratio of enterprise value/revenue would have to rise from the current level of 0.80X to 1.39X. If SBH’s ratio of enterprise value/revenue were to rise to 1.39X, its stock price would be higher by $21 to $33.
For SBH to achieve upper quartile valuation relative to the Sally Beauty Holdings Peer Group, its current ratio of enterprise value/revenue would have to rise from the current level of 0.80X to 1.98X. If SBH’s ratio of enterprise value/revenue were to rise to 1.98X, its stock price would increase by $42 from the current level of $12.
VALUE TARGETS
With future capital returns forecasted to exceed the cost of capital, SBH is expected to continue to be a major Value Builder.
Sally Beauty Holdings’ current Price Target of $32 represents a +157% change from the current price of $12.33.
This high appreciation potential results in an appreciation score of 82 (only 18% of the universe has greater appreciation potential.)
Reinforcing this high Appreciation Score of 82, the high Power Rating of 79 contributes to an Value Trend Rating of A.
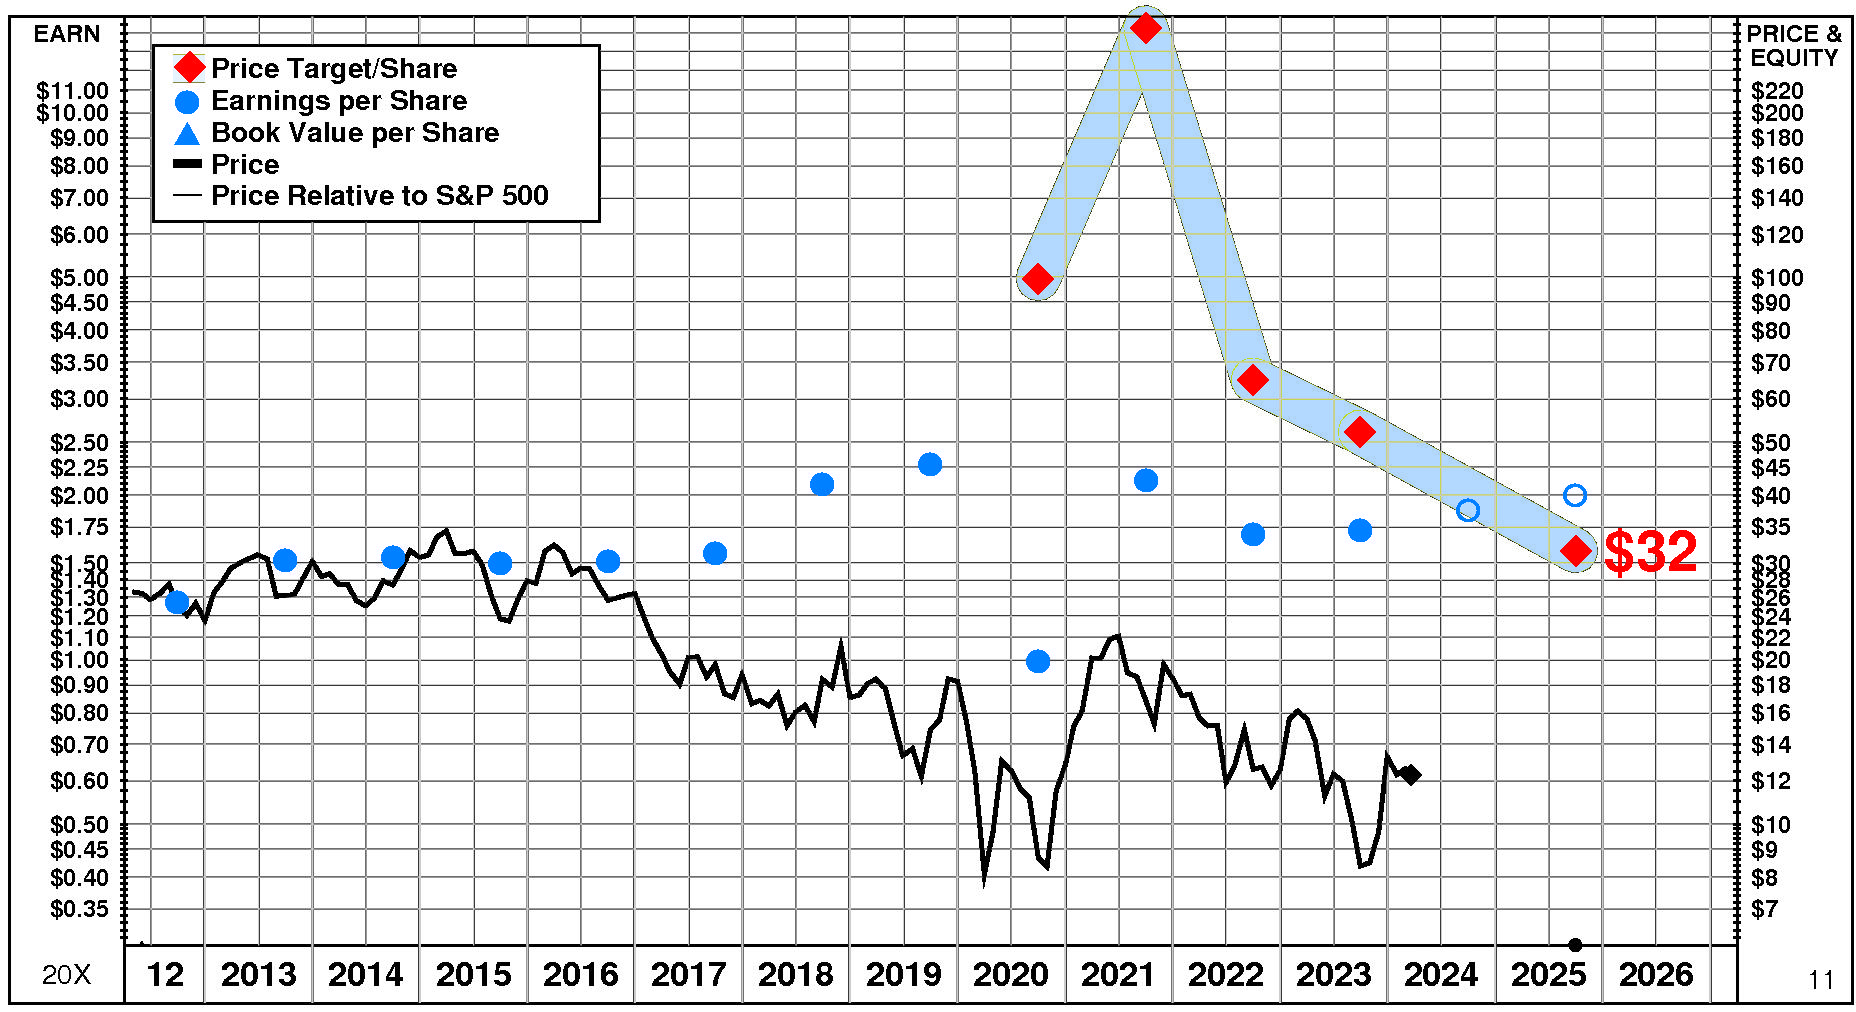
Sally Beauty Holdings’ current Price Target is $32 (-39% from the 2023 Target of $52 but +157% from the 03/20/24 price of $12.33). This dramatic fall in the Target is the result of a +10% increase in the equity base and a -45% decrease in the price/equity multiple. The forecasted decline in growth has a very large negative impact on the price/equity multiple and the forecasted decline in return on equity has a very large negative impact as well. Partially offsetting these Drivers, the forecasted decline in cost of equity has a slight positive impact.
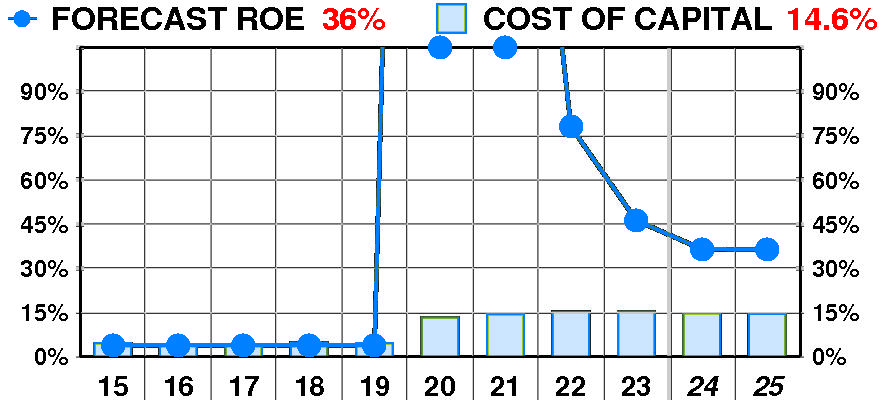
PTR’s return on equity forecast is 36.4% — below our recent forecasts. Forecasted return on equity enjoyed a dramatic, erratic increase between 2015 and 2023. The current forecast is significantly below the 2020 peak of 832%.
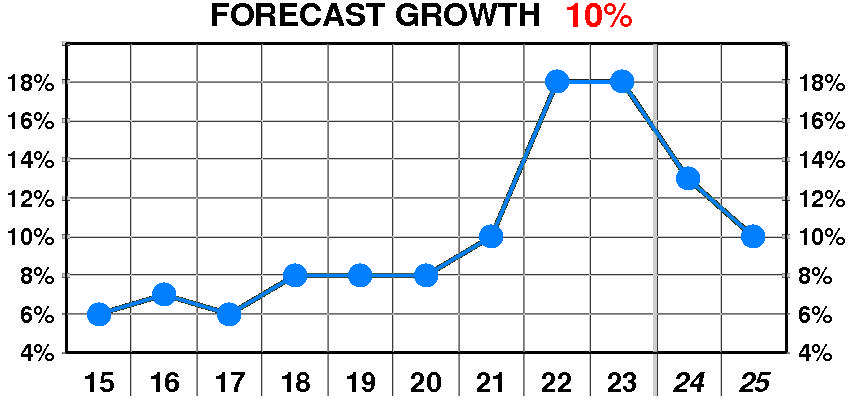
PTR’s growth forecast is 10.0% — below our recent forecasts. Forecasted growth enjoyed a dramatic, steady increase between 2015 and 2023. The current forecast is above the 2015 low of 6%.
PTR’s cost of equity forecast is 14.6% — in line with recent levels. Forecasted cost of equity suffered a dramatic, variable increase between 2015 and 2023. The current forecast is significantly above the 2016 low of 4.0%.
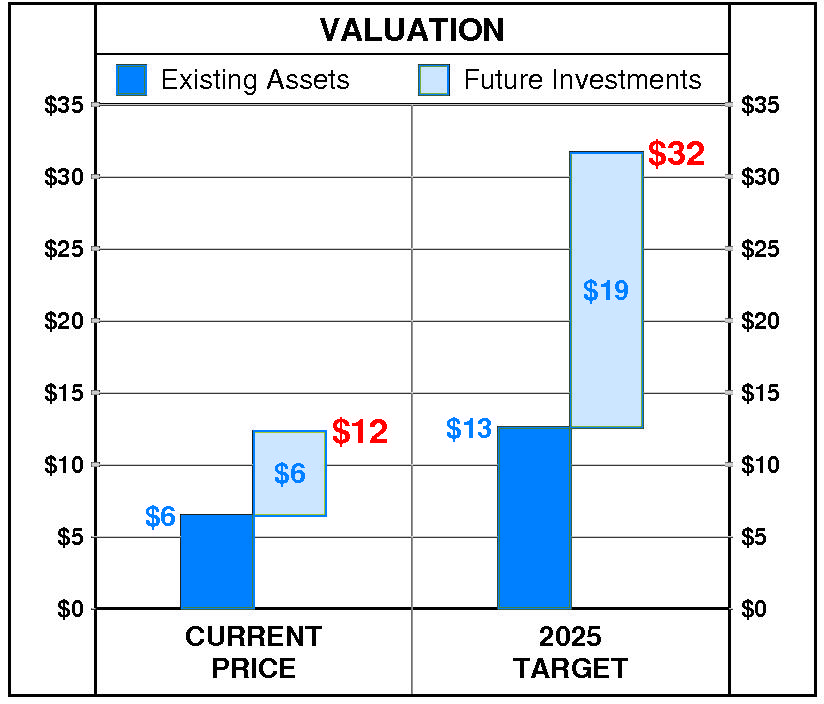
At Sally Beauty Holdings’ current price of $12.33, investors are placing a positive value of $6 on its future investments. This view is consistent with the company’s most recent performance that reflected a growth rate of 18.0% per year, and a return on equity of 46.2% versus a cost of equity of 15.3%.
PTR’s 2025 Price Target of $32 is based on these forecasts and reflects an estimated value of existing assets of $13 and a value of future investments of $19.
Be the first to comment