
BUSINESS
Mizuho Financial Group, Inc., together with its subsidiaries, engages in banking, trust, securities, and other businesses related to financial services in Japan, the Americas, Europe, Asia/Oceania, and internationally. It operates through five segments: Retail & Business Banking Company, Corporate & Institutional Company, Global Corporate Company, Global Markets Company, and Asset Management Company. The company provides deposit products; syndicated, housing, and card loans; business matching services; and advisory services related to overseas expansions, and mergers and acquisitions-related services. It also offers consulting services, including asset management and asset succession; payroll services; and sells lottery tickets issued by prefectures and ordinance-designated cities.
INVESTMENT RATING
MFG is expected to continue to be an important Value Builder reflecting capital returns that are forecasted to be above the cost of capital.
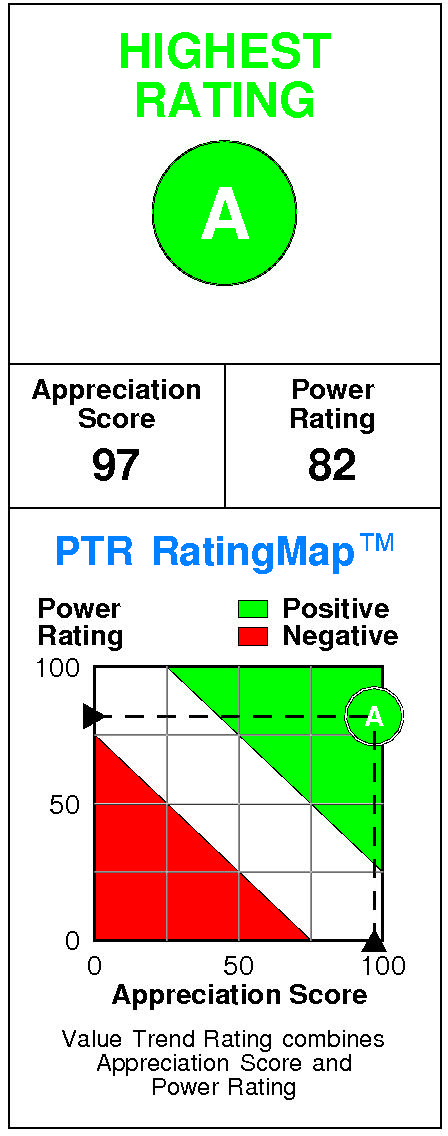
Mizuho Financial Group has a current Value Trend Rating of A (Highest Rating).
This rating combines consistent signals from two proprietary PTR measures of a stock's attractiveness. Mizuho Financial Group has a good Power Rating of 82 and a very high Appreciation Score of 97, triggering the Highest Value Trend Rating.
Mizuho Financial Group's stock is selling well below targeted value.
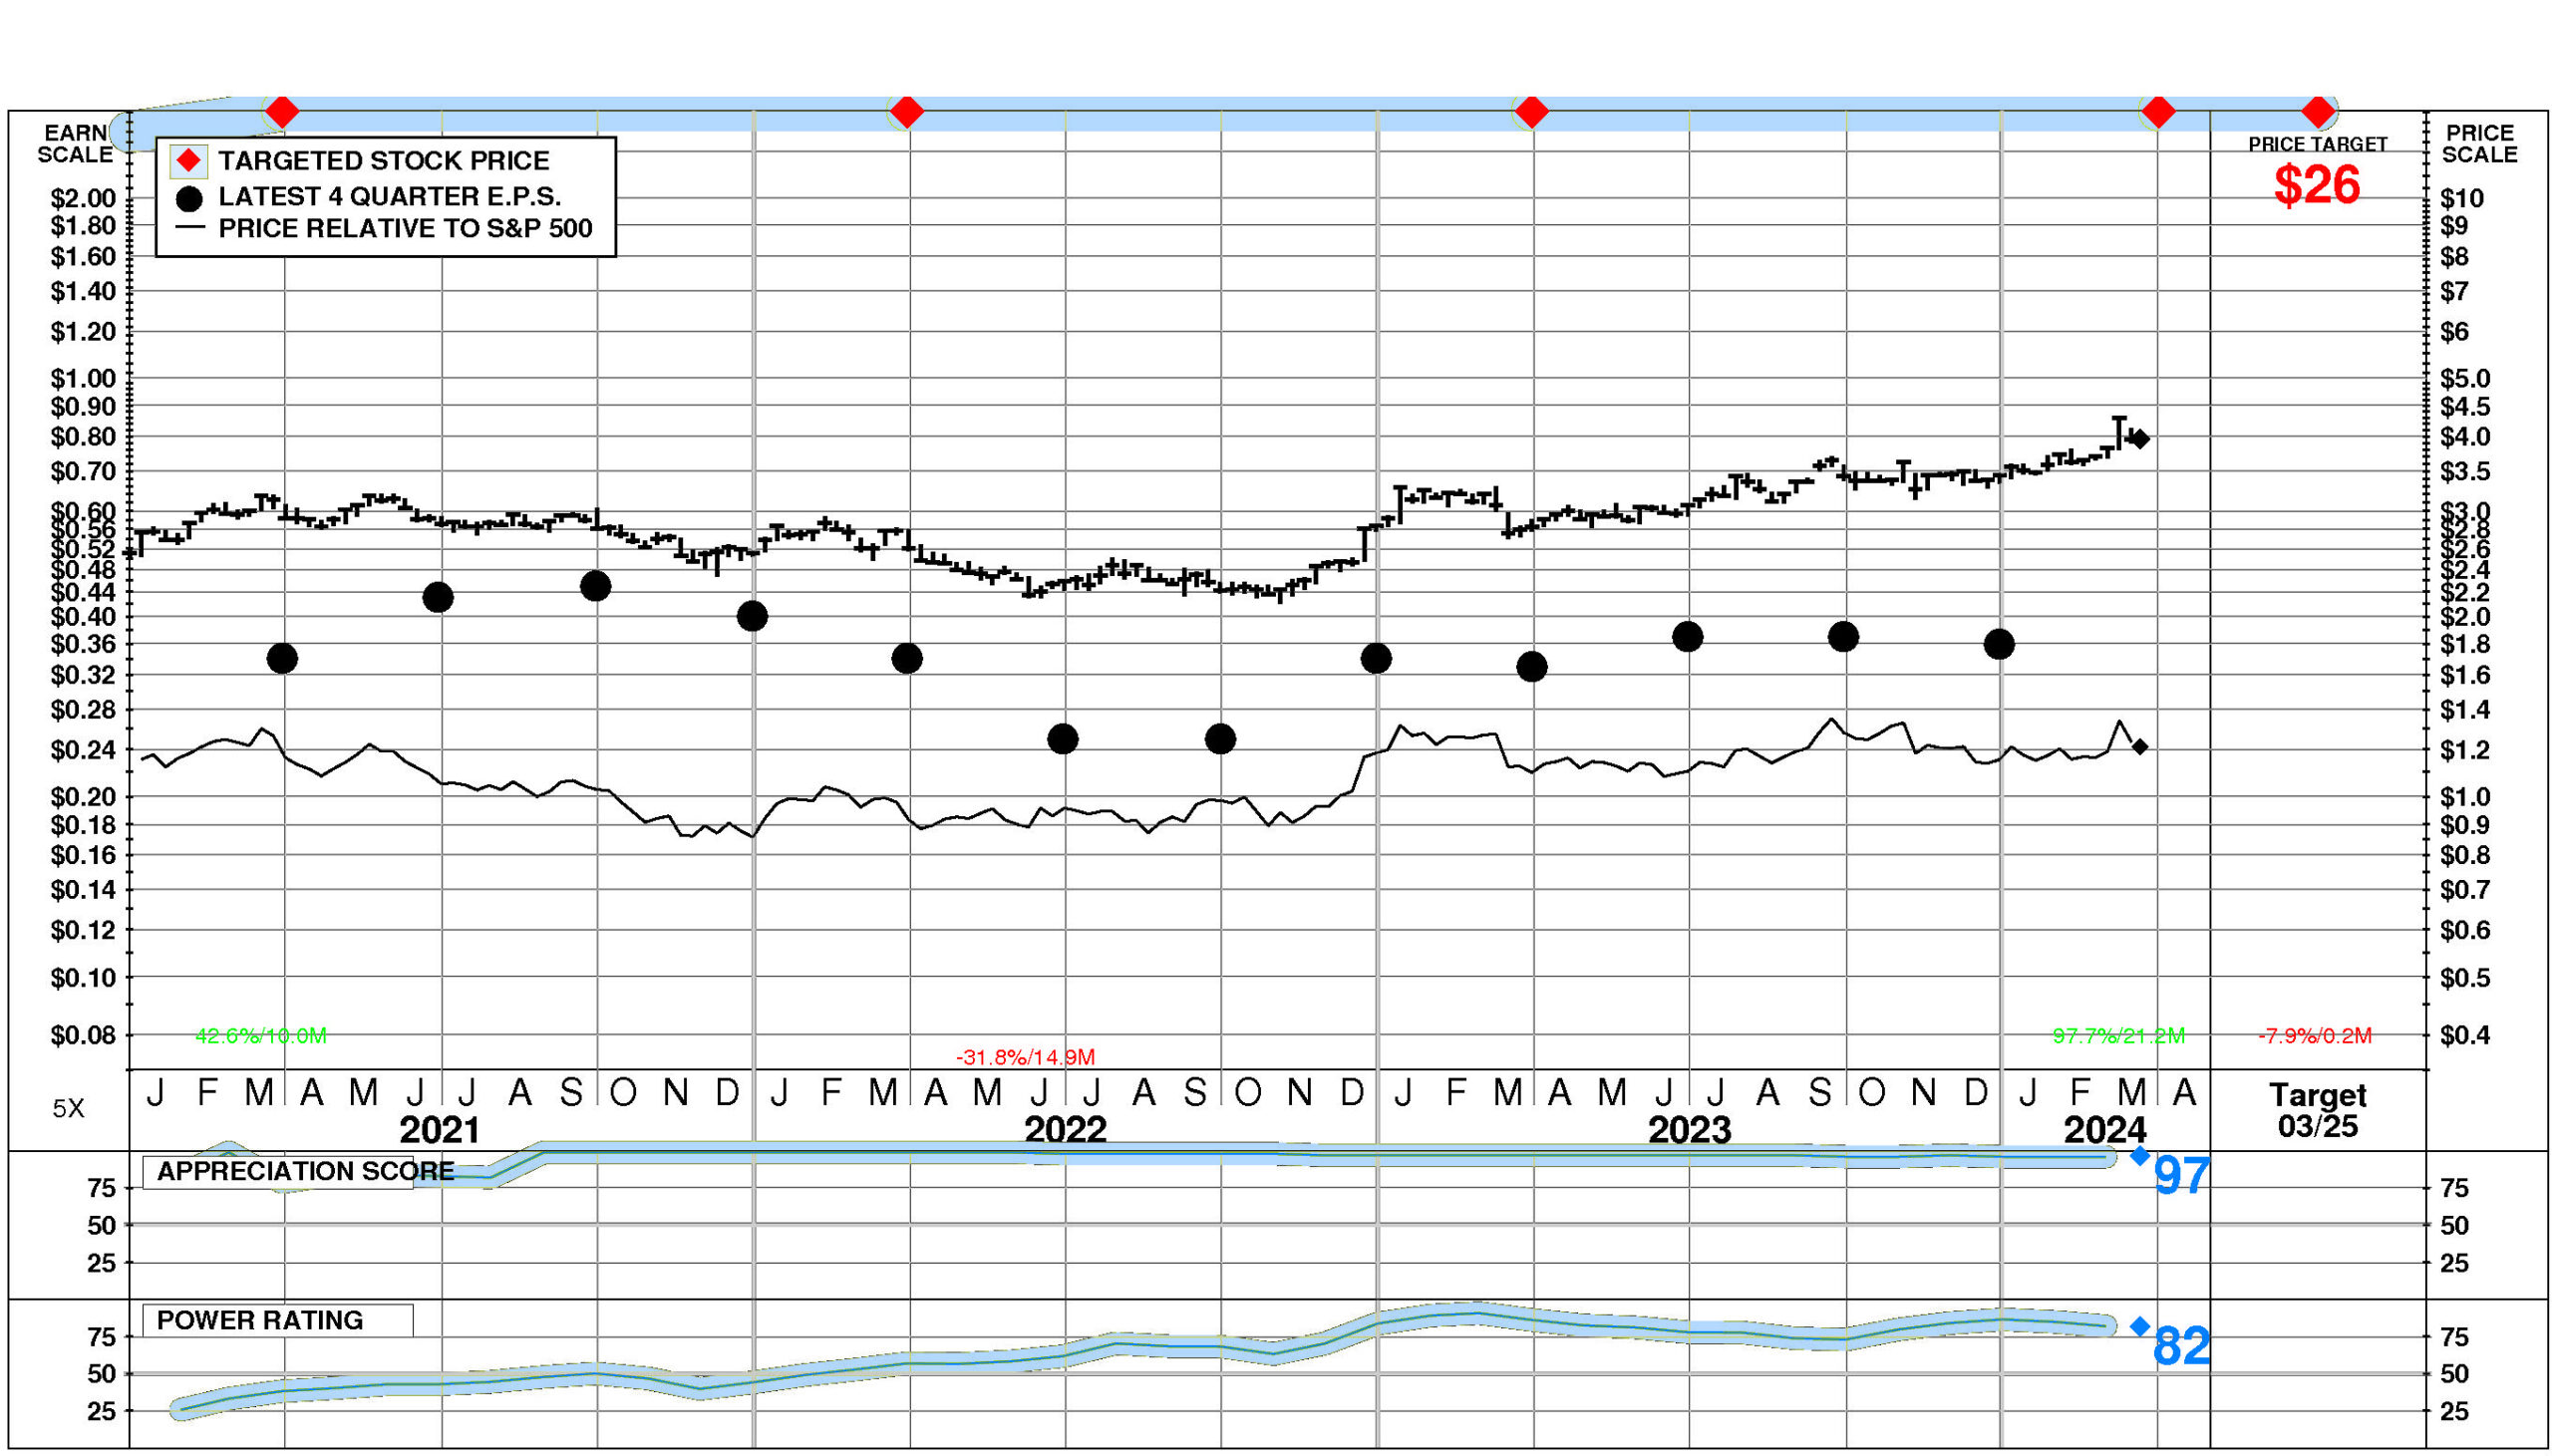
The current stock price of $3.97 compares to targeted value 12 months forward of $26.
Mizuho Financial Group's very high appreciation potential results in an appreciation score of 97 (only 3% of the universe has greater appreciation potential.)
Mizuho Financial Group has a Power Rating of 82.
(MFG's good Power Rating indicates that it has a higher likelihood of achieving favorable investment performance over the near to intermediate term than all but 18% of companies in the universe.)
Factors contributing to this good Power Rating include: recent price action has been favorable; and the Commercial Banks comparison group is in a strong phase currently.
INVESTMENT PROFILE
MFG's financial strength is below average. Financial strength rating is 34.
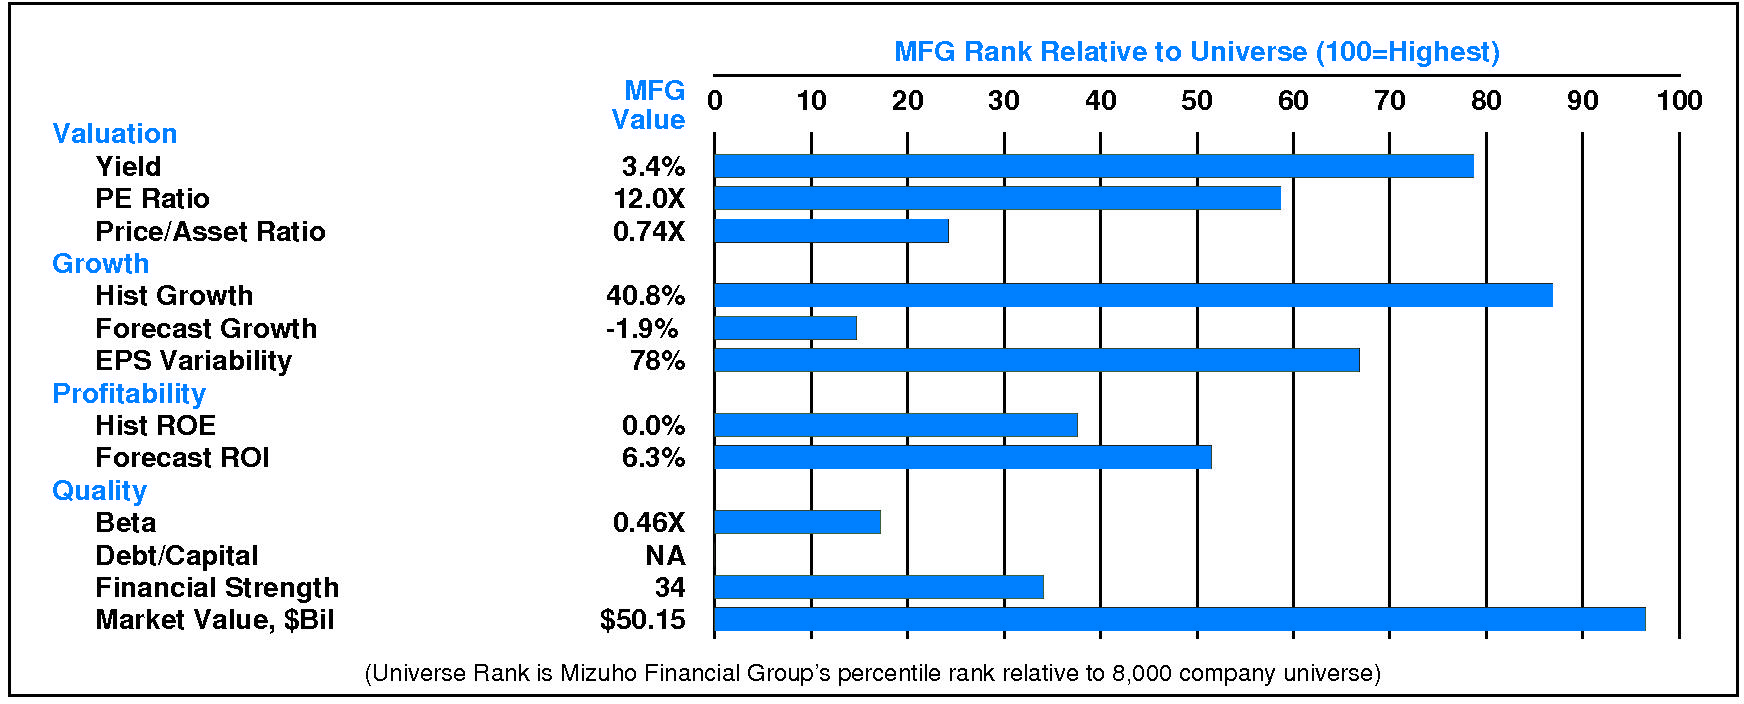
Relative to the S&P 500 Composite, Mizuho Financial Group Inc has significant Value characteristics; its appeal is likely to be to investors heavily oriented toward Income; the perception is that MFG is normal risk.
Relative weaknesses include: low forecasted profitability, low historical profitability, low financial strength, low expected growth, and high earnings variability. MFG's valuation is low: high dividend yield, low P/E ratio, and low price/book ratio. MFG has high market capitalization.
CURRENT SIGNALS
Mizuho Financial Group's current operations are strong.
Return on equity is rising, reflecting: and improving asset utilization.
Mizuho Financial Group's current technical position is very strong.
The stock price is in a 21.2 month up move. The stock has appreciated 97.7% from its prior low. The stock price is above its 200 day moving average which is in an uptrend.
ALERTS
The stock is currently rated A.
Mizuho Financial Group Inc (NYSE: MFG) stock closed at $3.97 on 3/20/24 after a modest gain of 0.5%. NORMAL trading volume accompanied the advance. The stock has declined -1.2% during the last week but has been strong relative to the market over the last nine months.
CASH FLOW
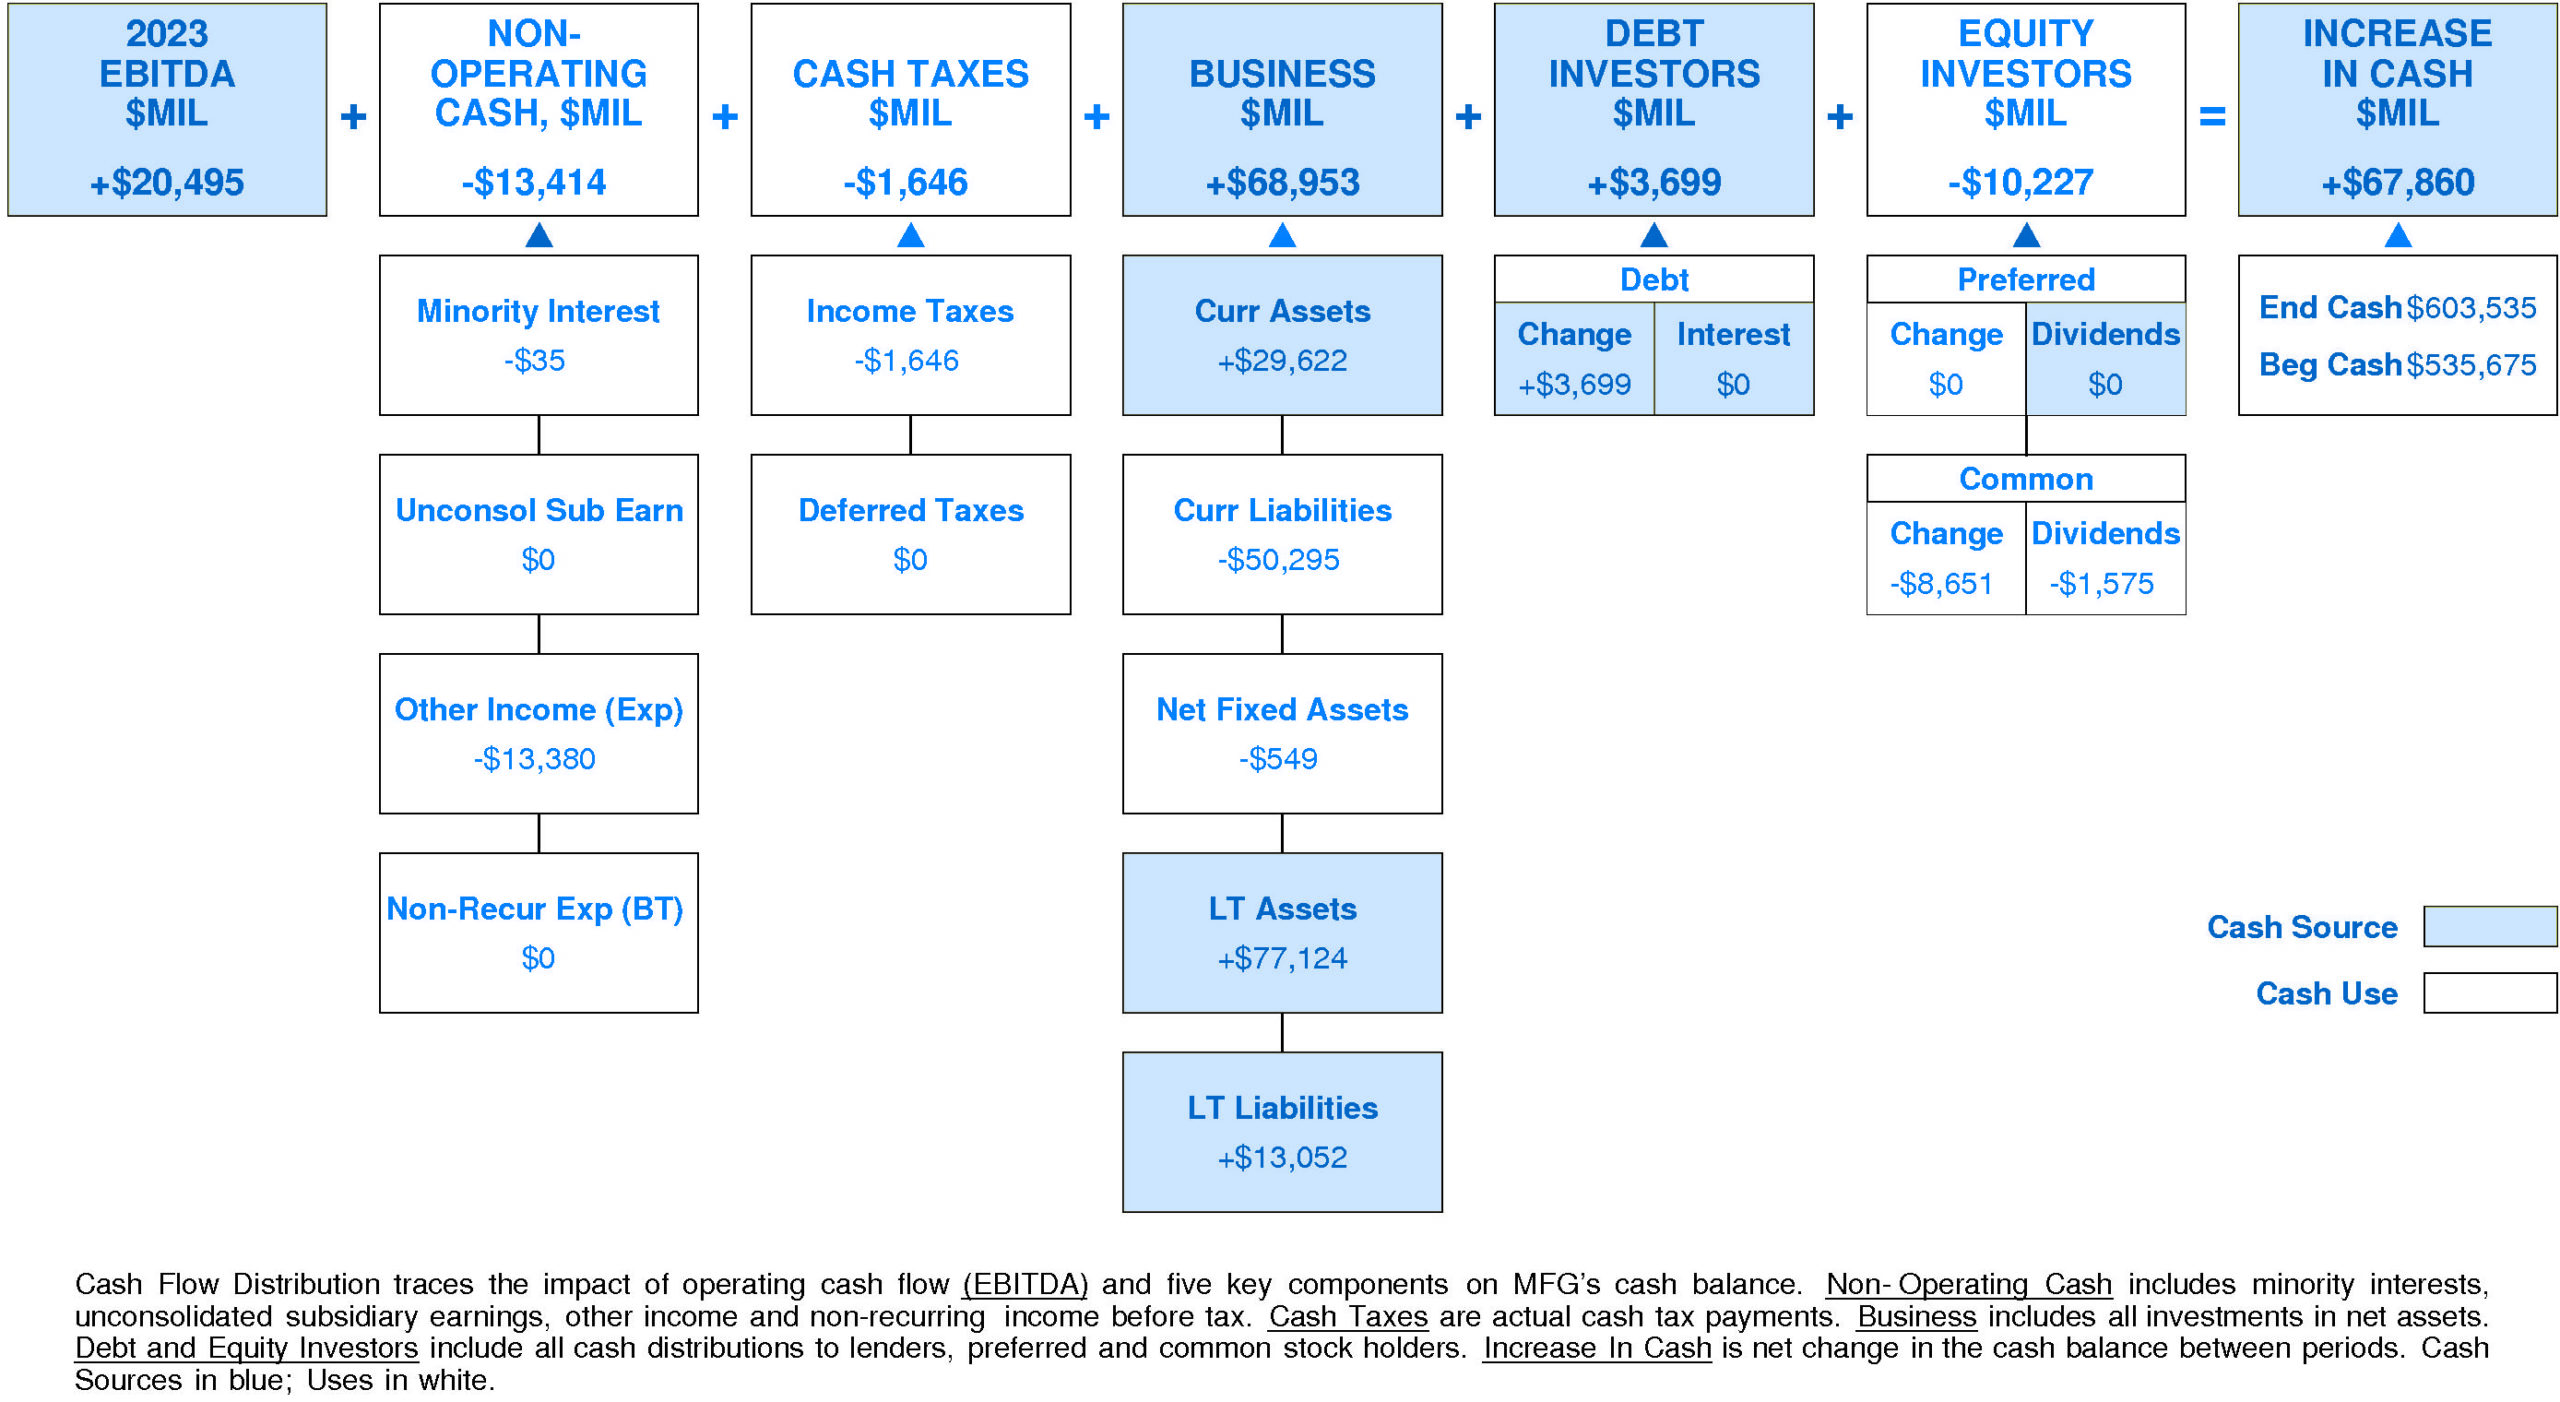
In 2023, Mizuho Financial Group generated a significant increase in cash of +$67,860 million (+13%). Sources of cash were larger than uses.
Cash generated from 2023 EBITDA totaled +$20,495 million. Non-operating uses consumed -$13,414 million (-65% of EBITDA). Cash taxes consumed -$1,646 million (-8% of EBITDA). Withdrawal of investment from the business totaled +$68,953 million (+336% of EBITDA). On a net basis, debt investors supplied +$3,699 million (+18% of EBITDA) while equity investors pulled out -$10,227 million (-50% of EBITDA).
MFG's Non-operating Income, %EBITDA has experienced a minor downtrend over the period.
This downtrend was accompanied by an opposite trend for the Mizuho Financial Group Peer Group. In most years, Mizuho Financial Group was in the third quartile and lower quartile. Currently, Mizuho Financial Group is lower quartile at -65% of EBITDA (-$13,414 million).
MFG's Cash Taxes, %EBITDA has exhibited a volatile overall uptrend over the period.
This improvement was accompanied by stability for the Mizuho Financial Group Peer Group. In most years, Mizuho Financial Group was in the third quartile and second quartile. Currently, Mizuho Financial Group is below median at -8% of EBITDA (-$1,646 million).
MFG's Business Re-investment, %EBITDA has suffered a volatile overall downtrend over the period.
This downtrend was accompanied by a similar trend for the Mizuho Financial Group Peer Group. (Since 2021 Business Re-investment, %EBITDA has experienced a very sharp recovery.) In most years, Mizuho Financial Group was in the top quartile. Currently, Mizuho Financial Group is upper quartile at +336% of EBITDA (+$68,953 million).
MFG's Debt Investors, %EBITDA has experienced a volatile overall uptrend over the period.
This improvement was accompanied by stability for the Mizuho Financial Group Peer Group. In most years, Mizuho Financial Group was in the second quartile and lower quartile. Currently, Mizuho Financial Group is at median at +18% of EBITDA (+$3,699 million).
MFG's Equity Investors, %EBITDA has suffered a strong overall downtrend over the period.
This downtrend was accompanied by an opposite trend for the Mizuho Financial Group Peer Group. In most years, Mizuho Financial Group was in the third quartile and second quartile. Currently, Mizuho Financial Group is lower quartile at -50% of EBITDA (-$10,227 million).
MFG's Change in Cash, %EBITDA has experienced a volatile overall downtrend over the period.
This downtrend was accompanied by a similar trend for the Mizuho Financial Group Peer Group. (Since 2021 Change in Cash, %EBITDA has experienced a very sharp recovery.) In most years, Mizuho Financial Group was in the top quartile. Currently, Mizuho Financial Group is upper quartile at +331% of EBITDA (+$67,860 million).
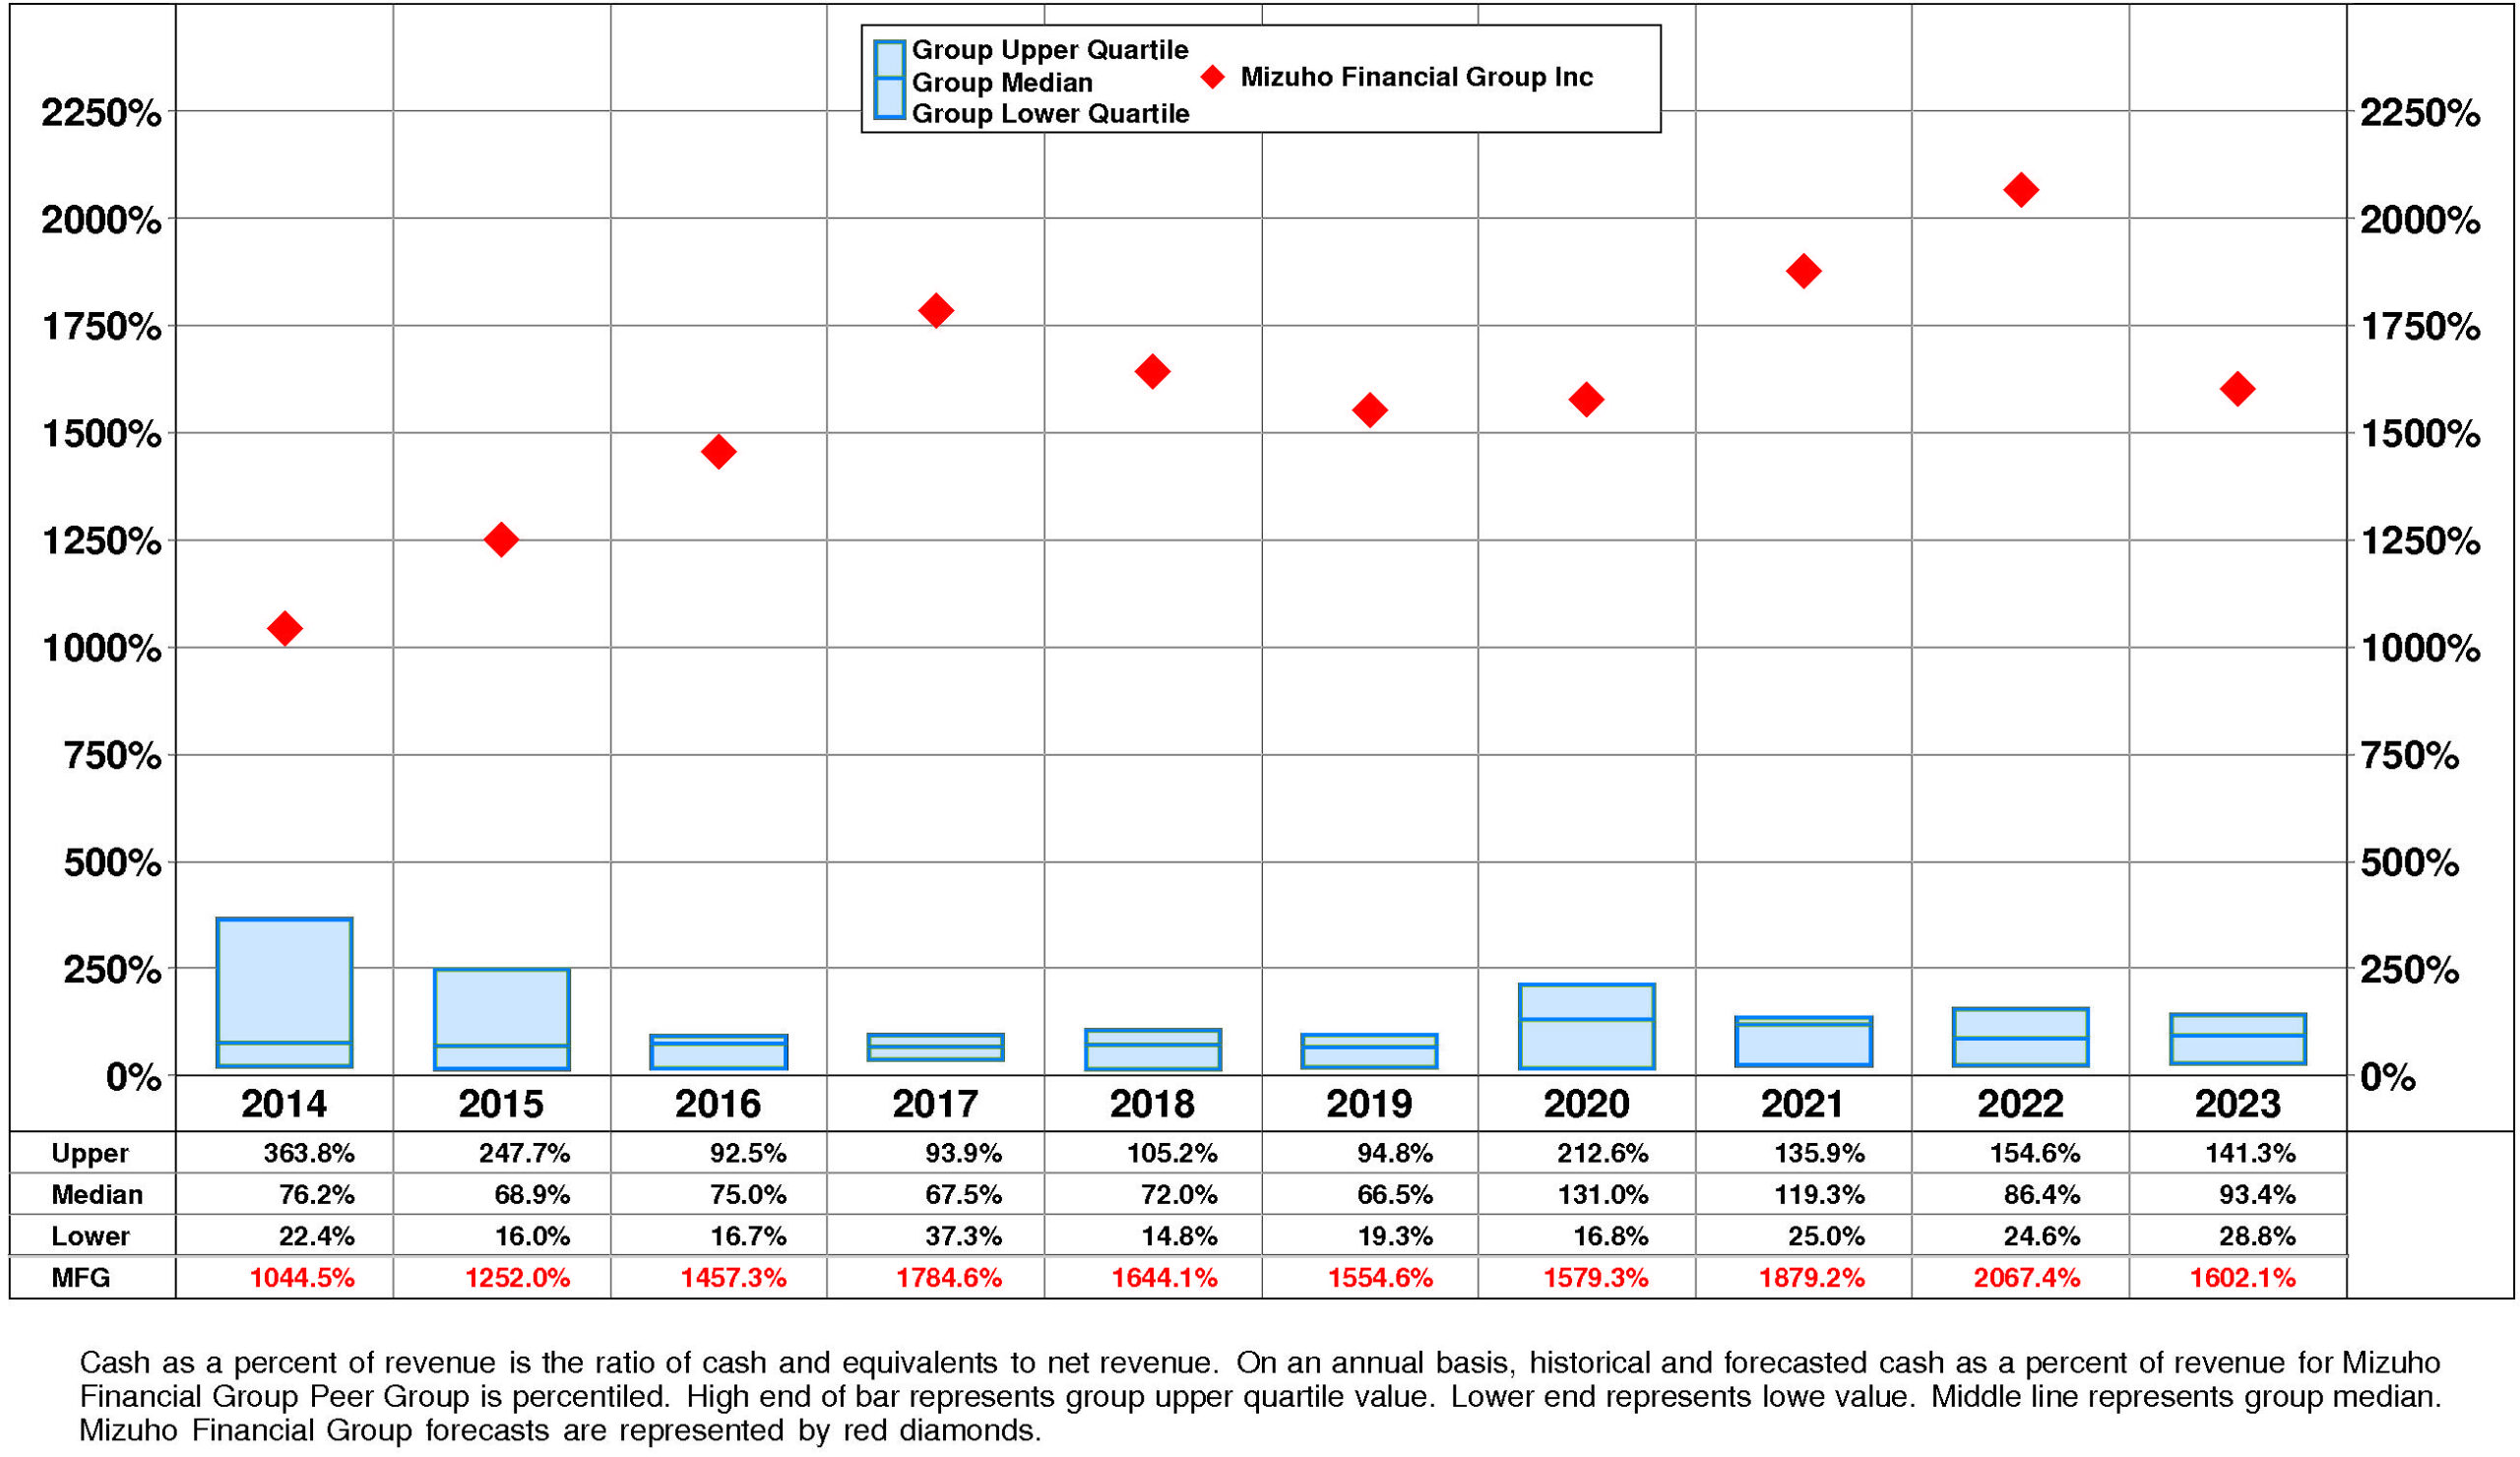
MFG's Cash, %Revenue has enjoyed a very strong overall uptrend over the period.
This improvement was accompanied by a similar trend for the Mizuho Financial Group Peer Group. In most years, Mizuho Financial Group was in the top quartile. Currently, Mizuho Financial Group is upper quartile at +1602%.
PROFITABILITY
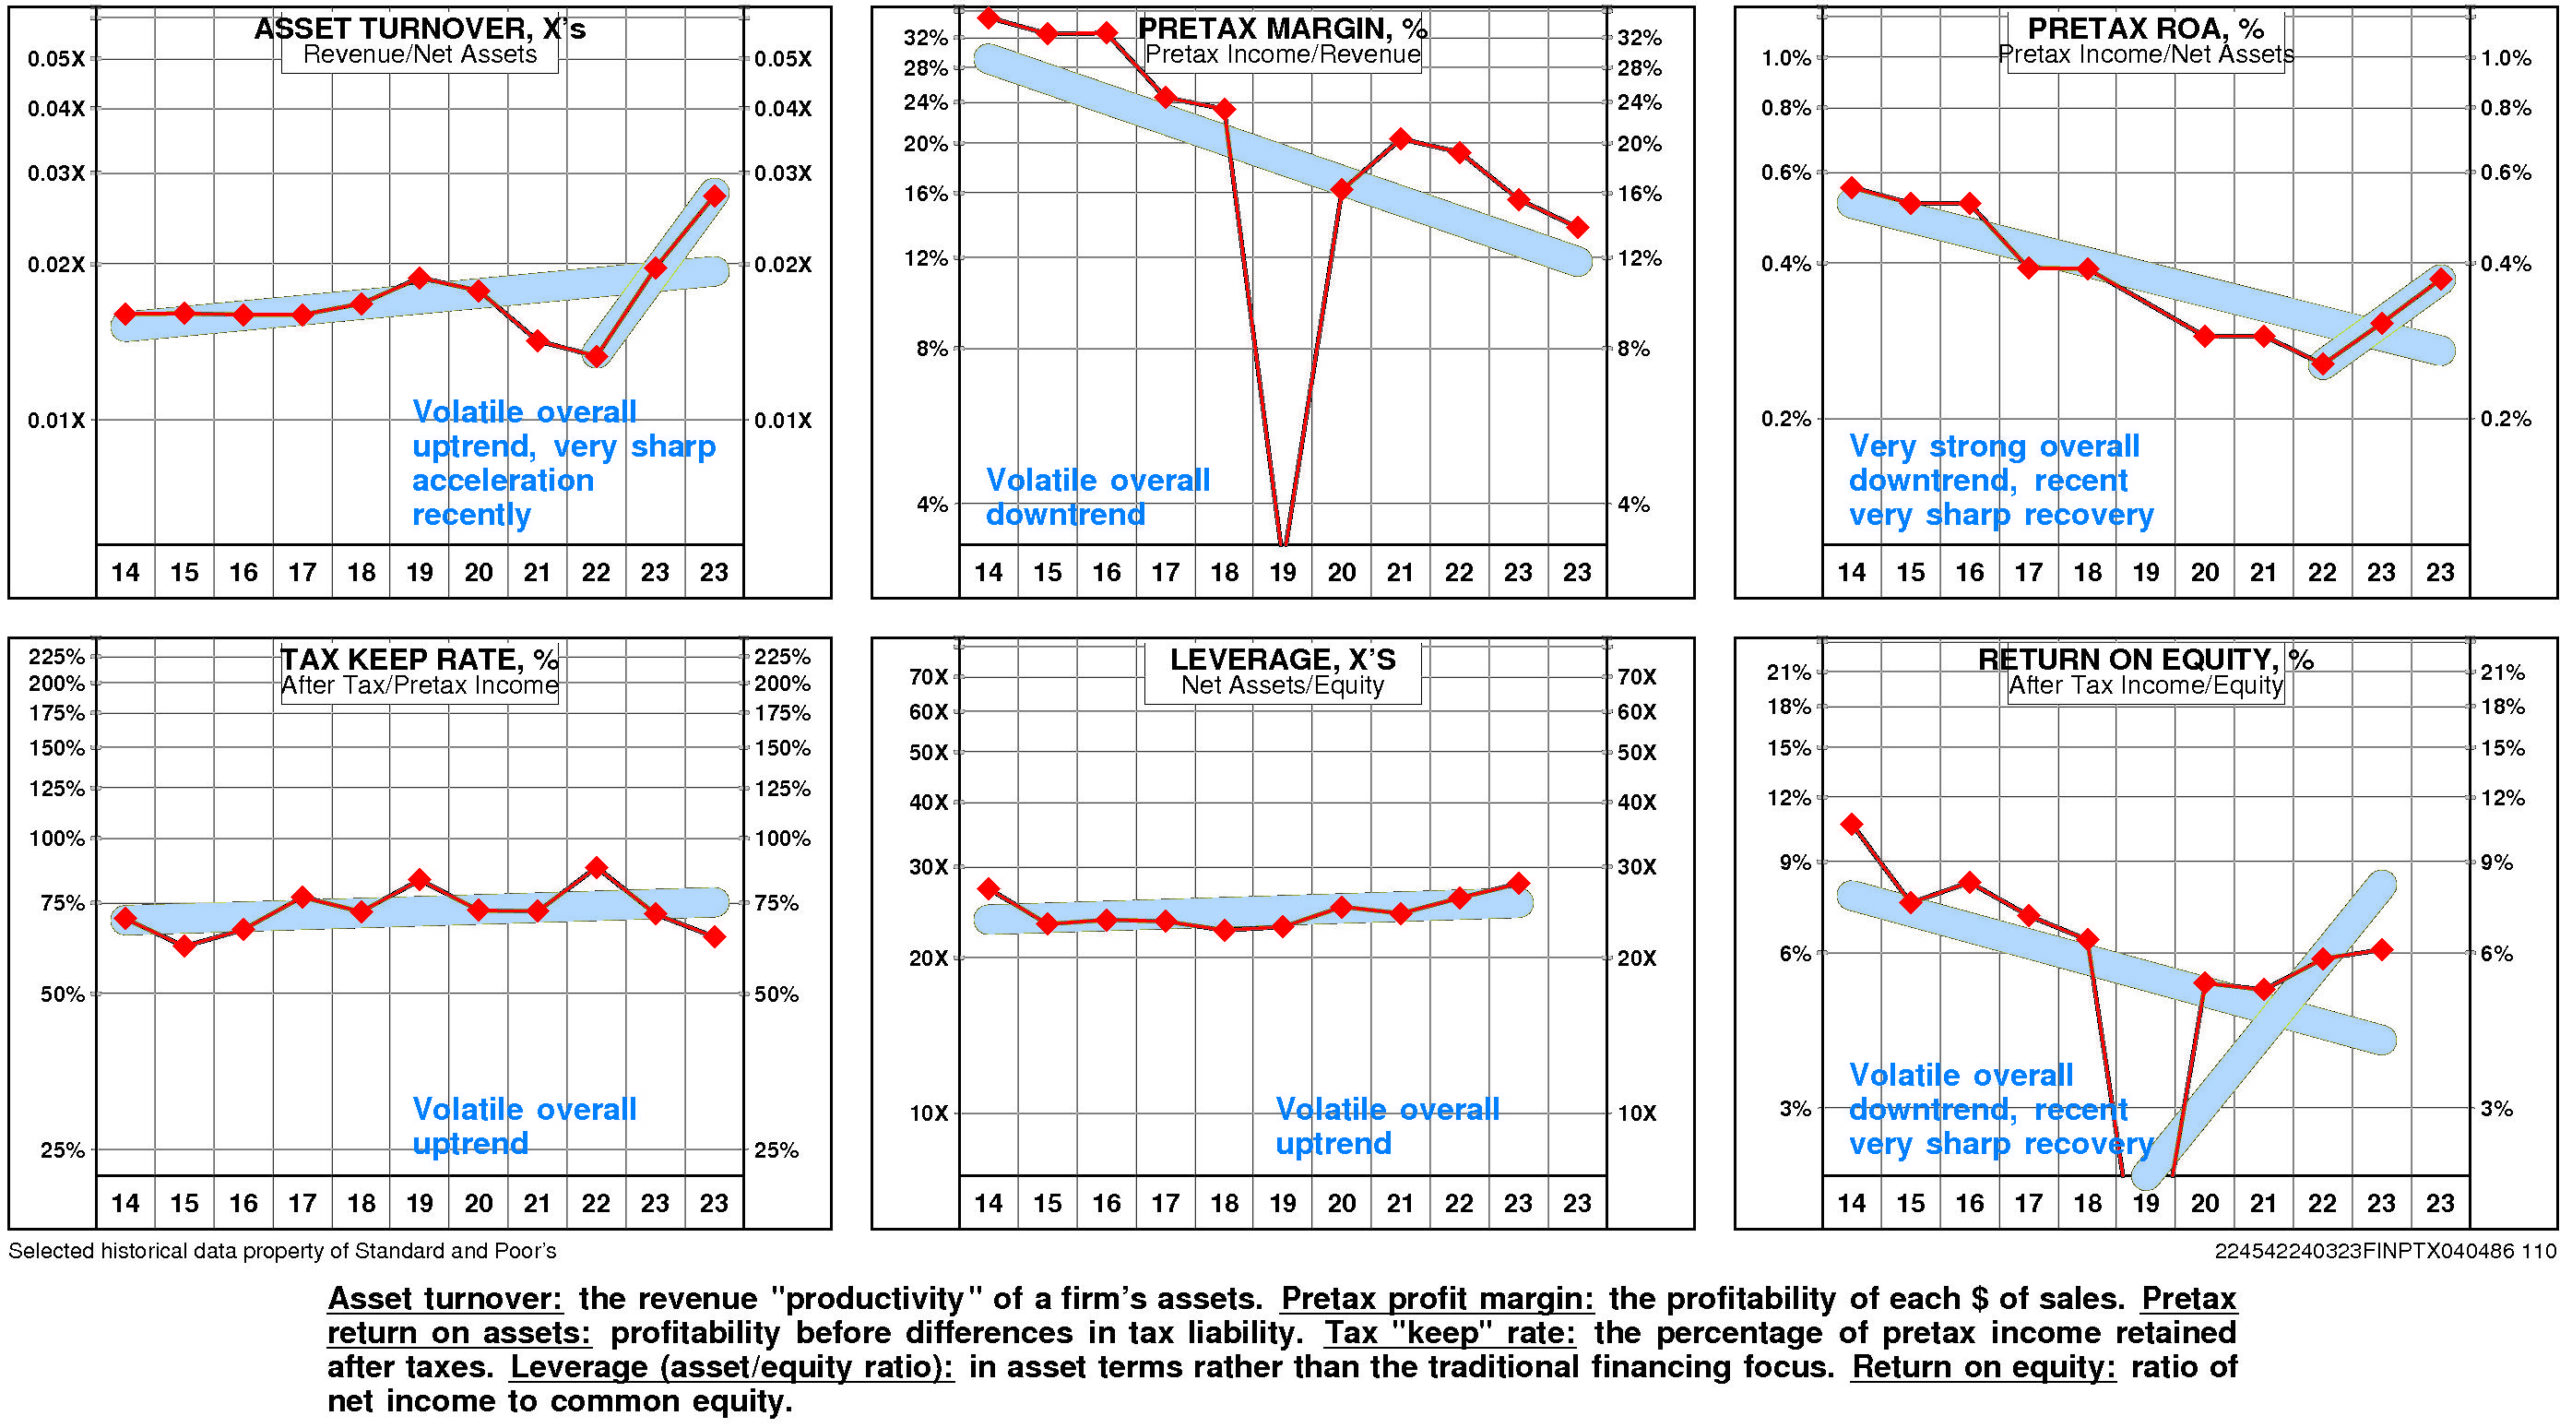
MFG's return on equity has eroded very significantly since 2014.
This very significant erosion was due to very strong negative trend in pretax operating return and very small negative trend in non-operating factors.
The productivity of MFG's assets rose over the full period 2014-2023: asset turnover has enjoyed a volatile overall uptrend that accelerated very sharply after the 2022 level.
MFG's pretax margin experienced a volatile overall downtrend over the period 2014-2023.
Non-operating factors (income taxes and financial leverage) had a very small negative influence on return on equity.
MFG's return on equity is unavailable for the four quarters ended December, 2023.
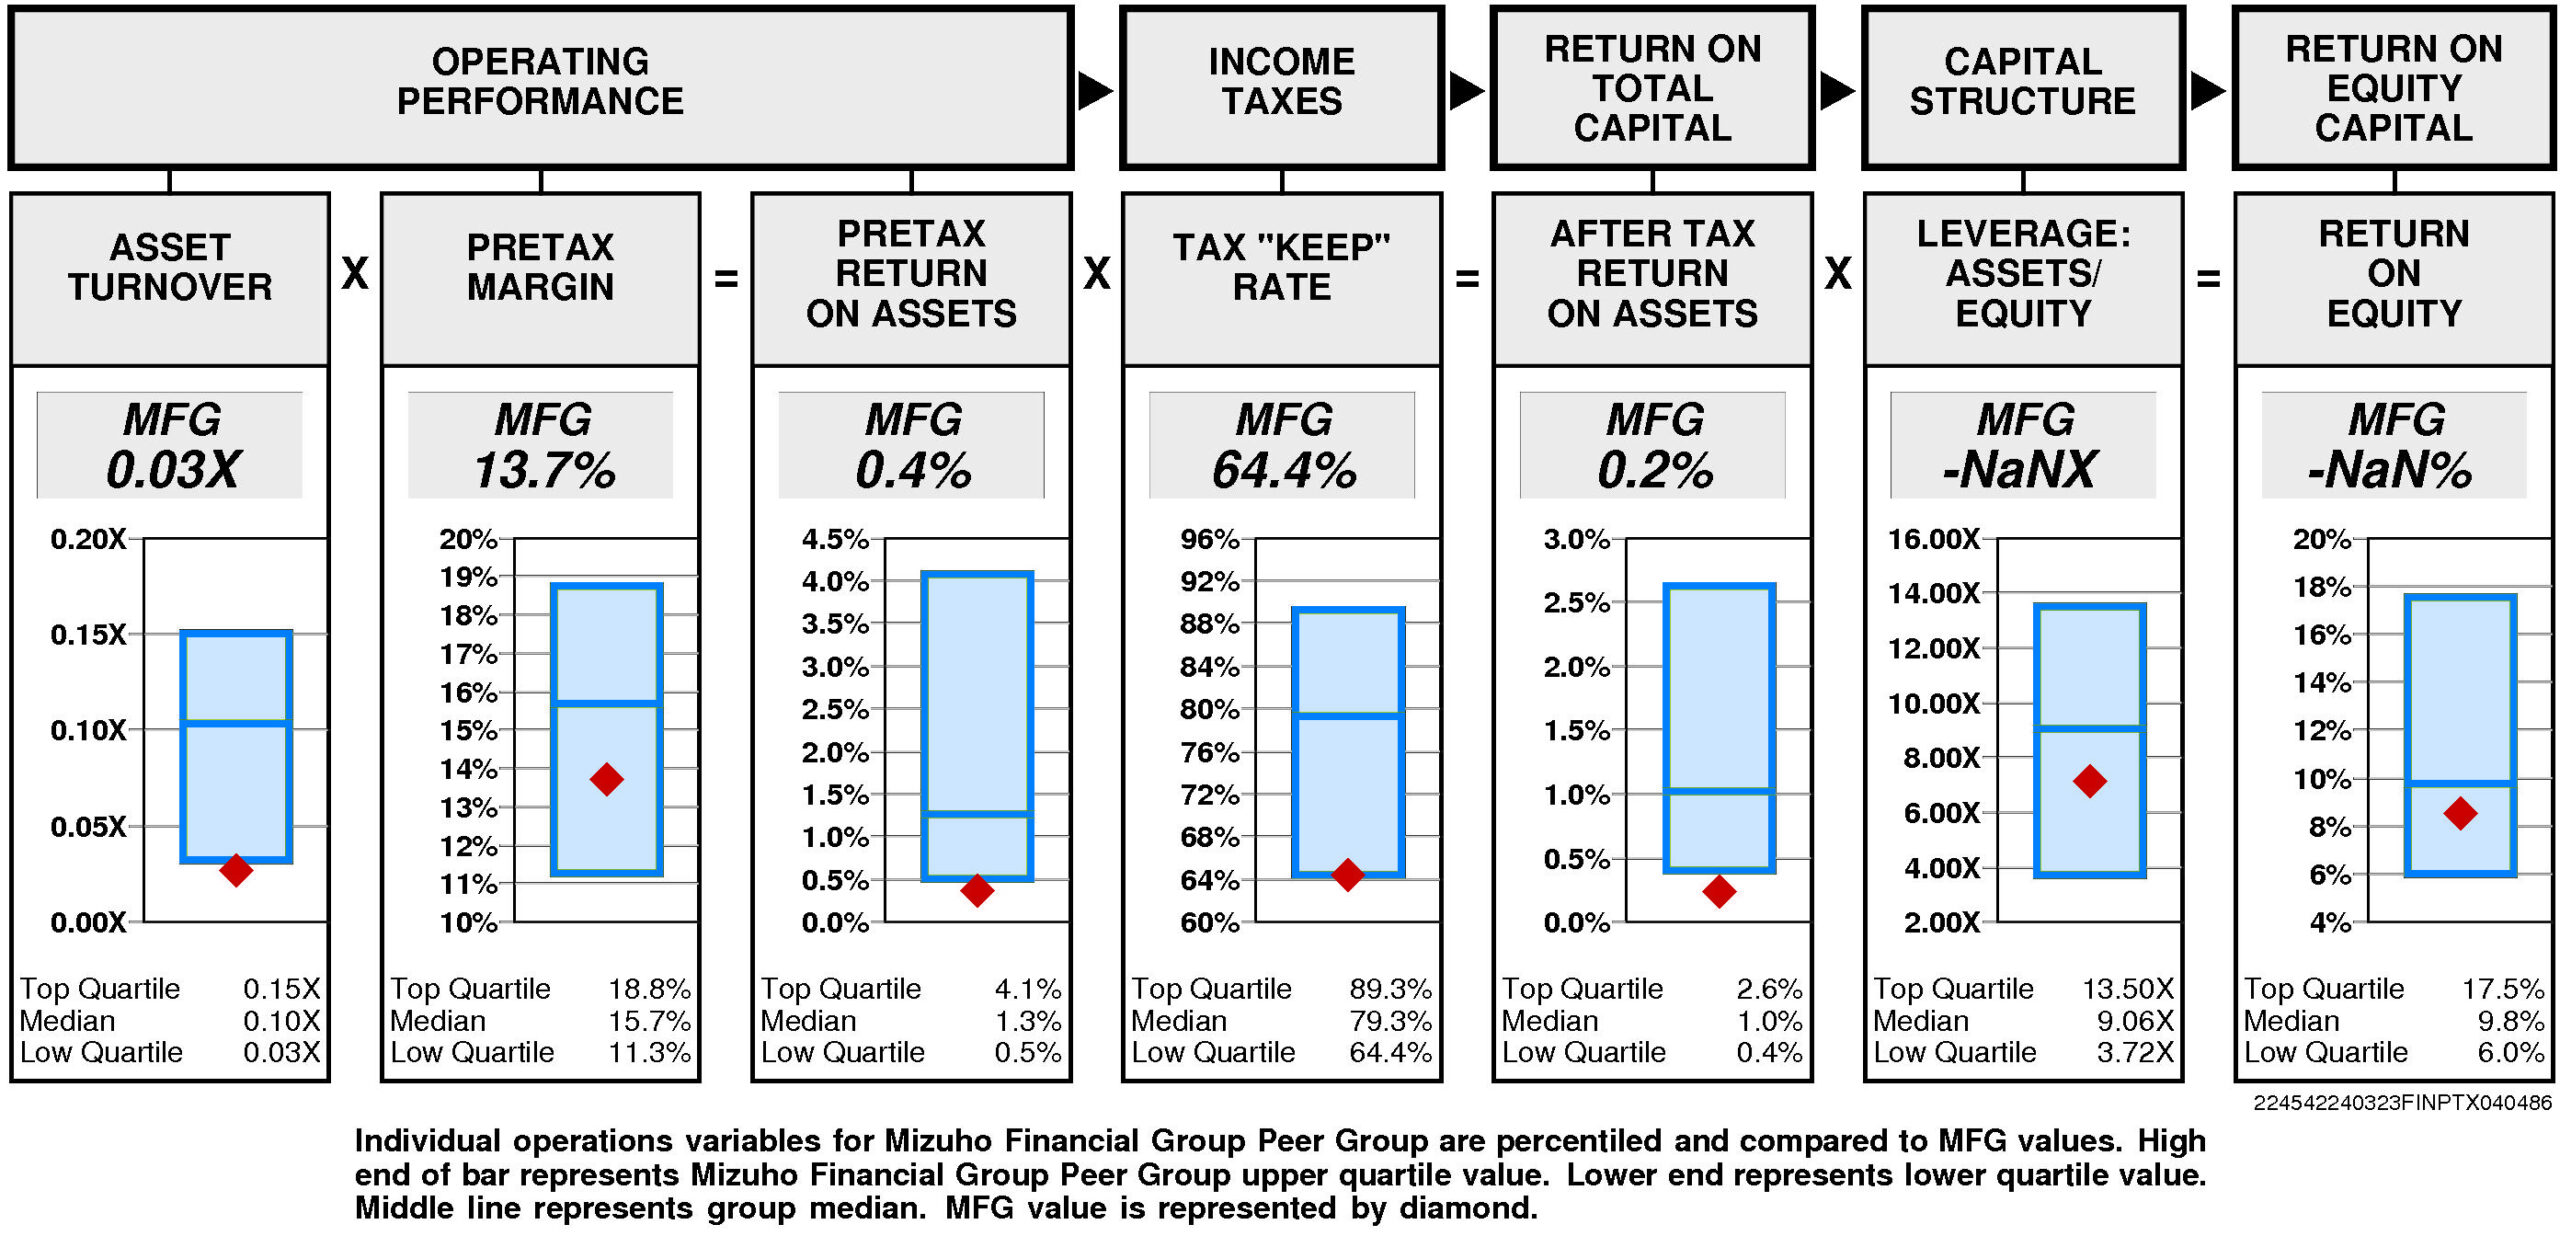
Operating performance (pretax return on assets) is lower quartile (0.4%) reflecting asset turnover that is lower quartile (0.03X) and below median pretax margin (13.7%).
Tax “keep” rate (income tax management) is at the lower quartile (64.4%) resulting in after tax return on assets that is lower quartile.
Financial leverage (leverage) is unavailable .
GROWTH RATES
There are no significant differences between Mizuho Financial Group's longer term growth and growth in recent years.
Mizuho Financial Group's historical income statement growth and balance sheet growth have diverged. Revenue growth has paralleled asset growth; earnings growth has fallen short of equity growth.
Annual revenue growth
has been 4.0% per year.
Total asset growth
has been 1.5% per year.
Annual E.P.S. growth
has been -4.7% per year. (More recently it has been 25.0%.)
Equity growth
has been 0.9% per year.
No consensus growth rate forecast is available for Mizuho Financial Group.
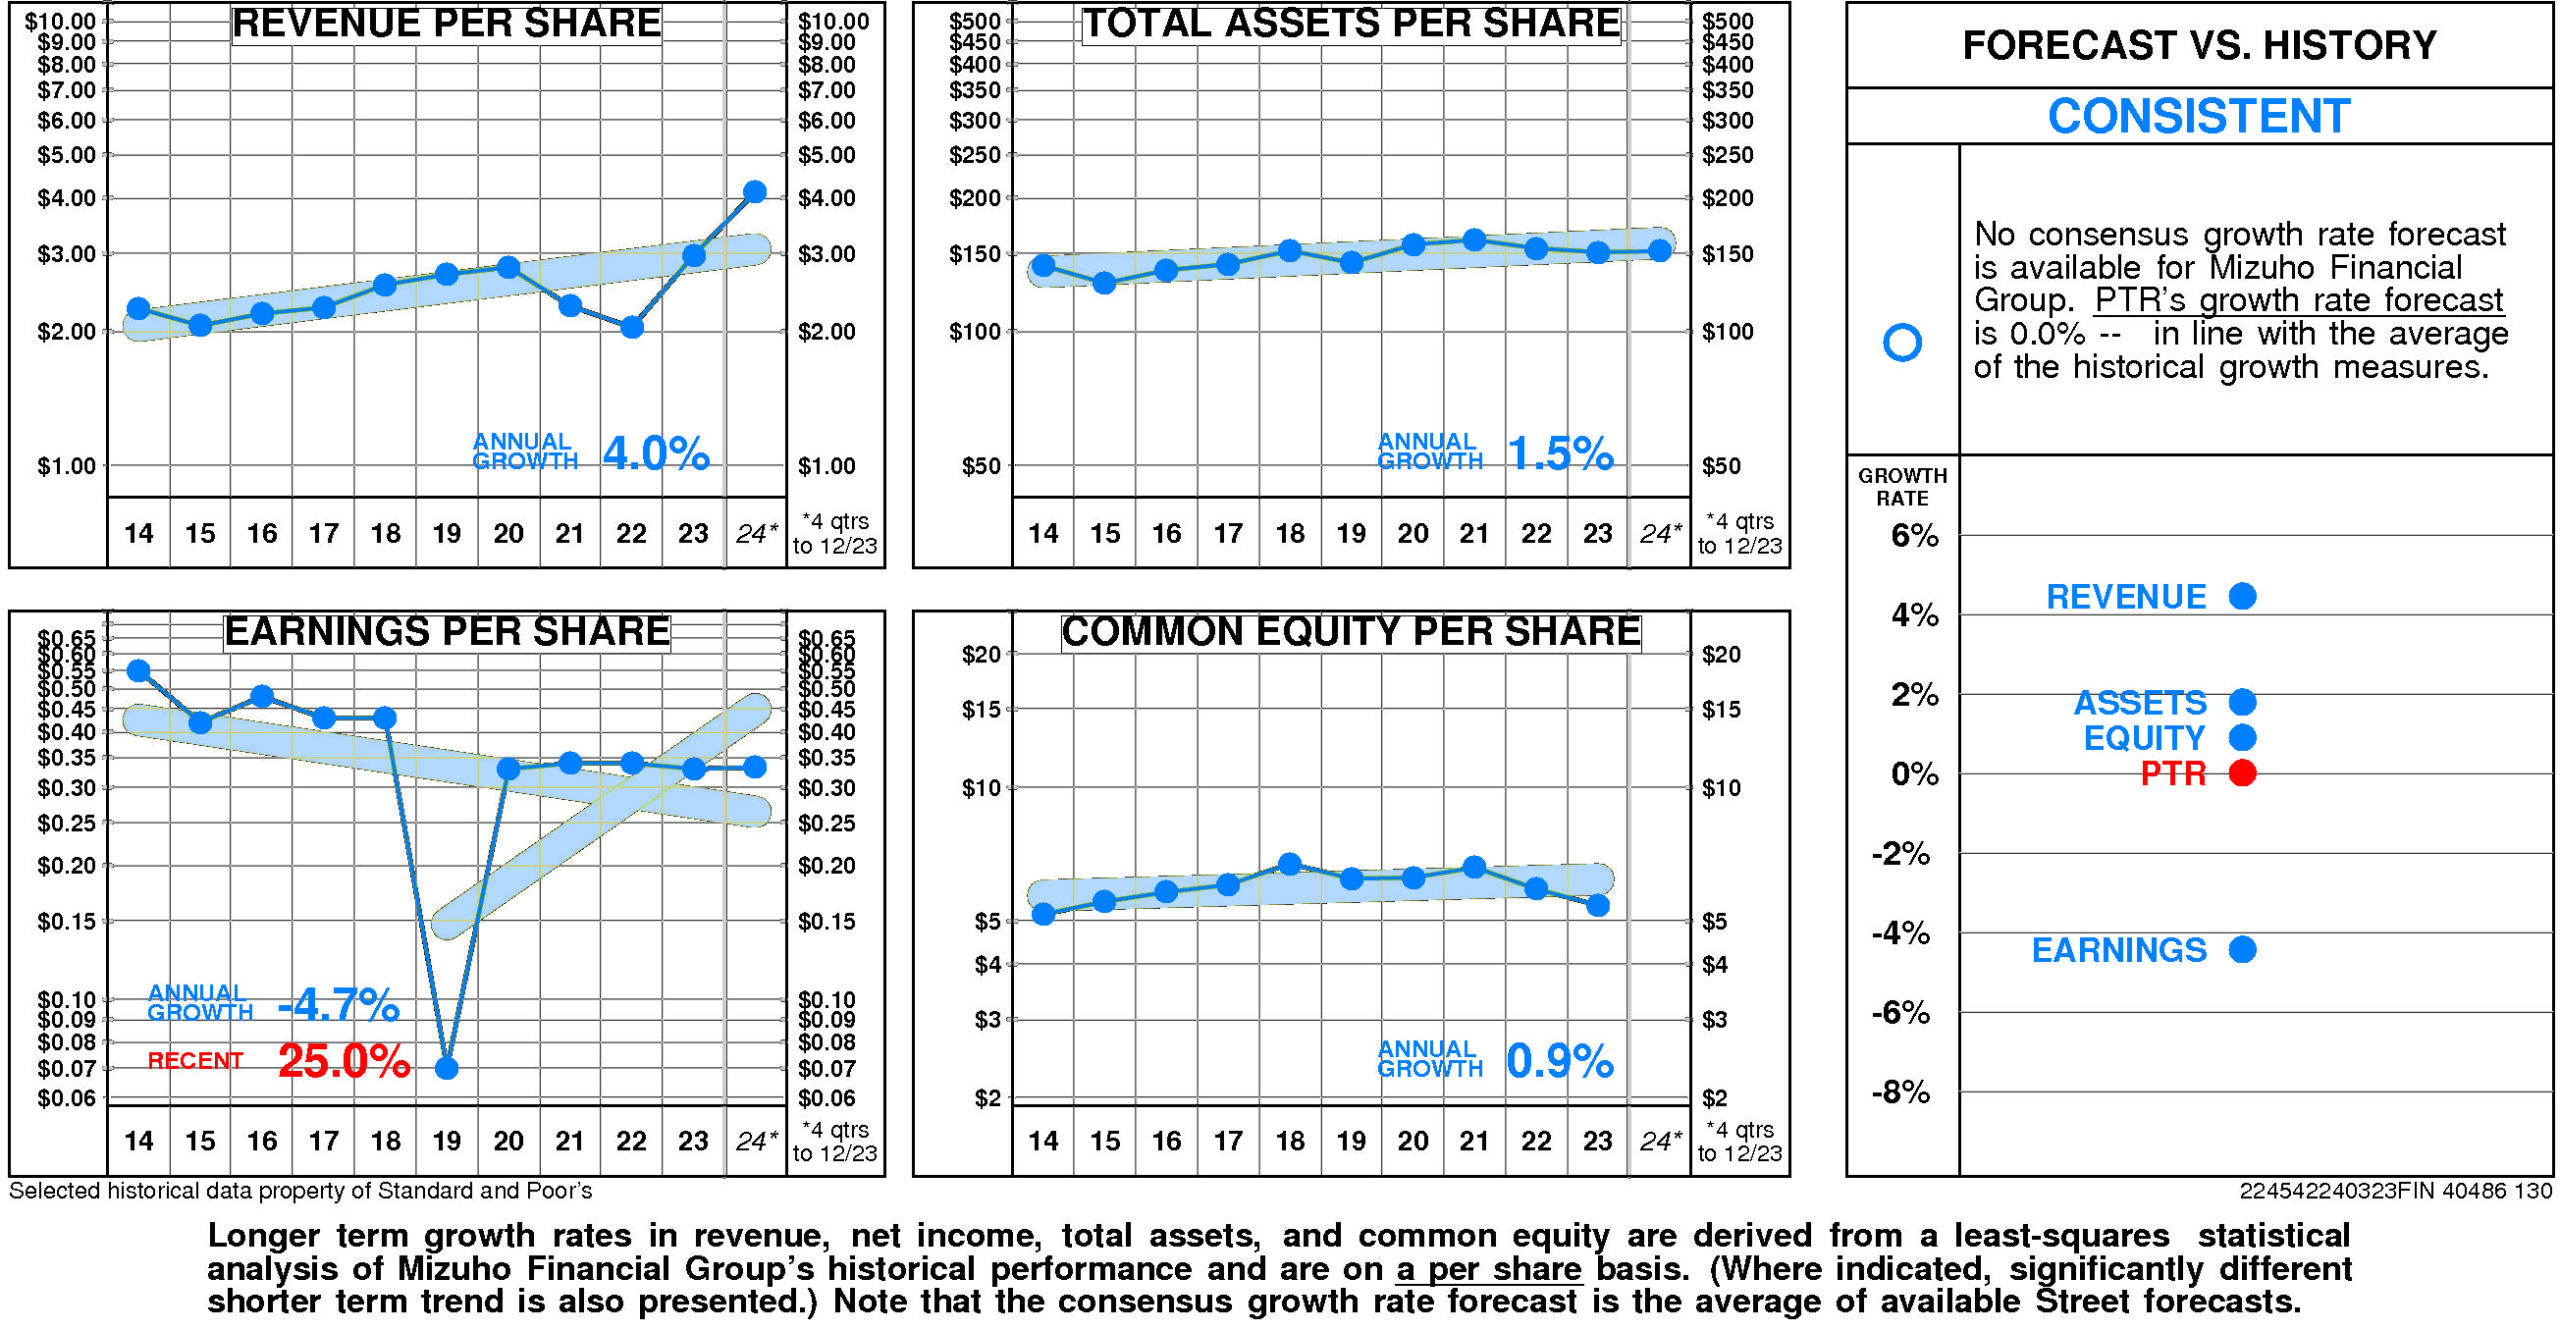
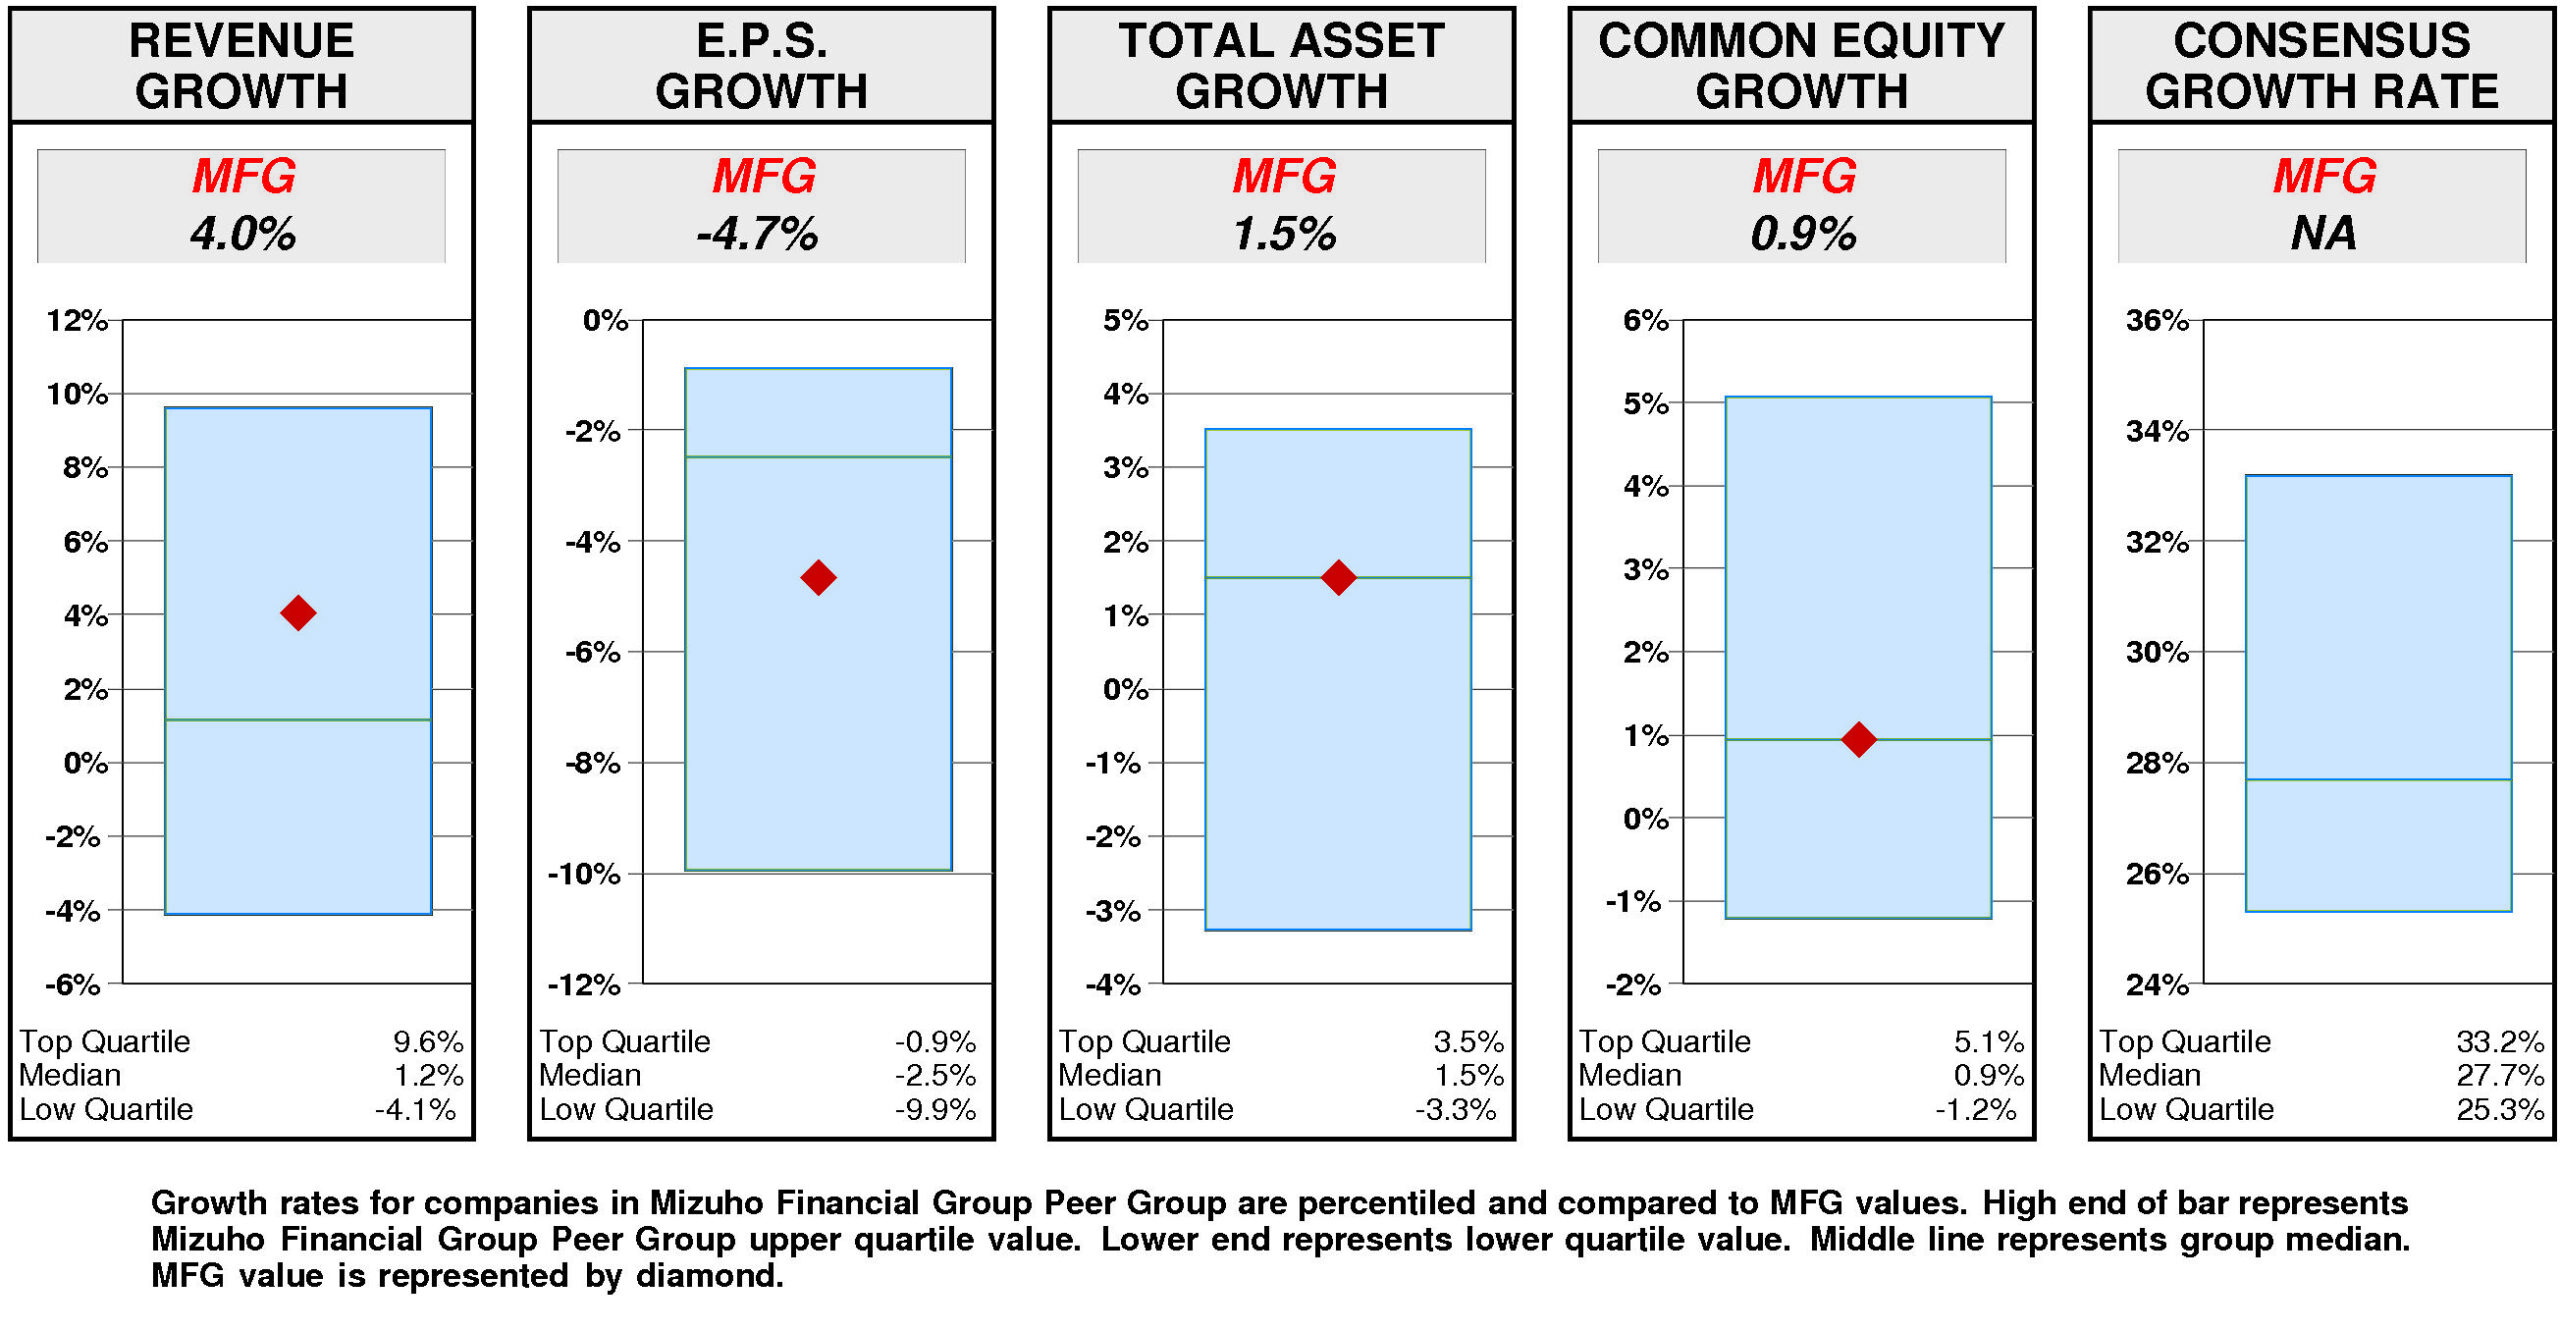
Relative to the Mizuho Financial Group Peer Group, Mizuho Financial Group's historical growth measures are generally second quartile.
Revenue growth (4.0%) has been above median. Total asset growth (1.5%) has been at median. Equity growth (0.9%) has been at median. E.P.S. growth (-4.7%) has been below median.
Consensus growth forecast is unavailable.
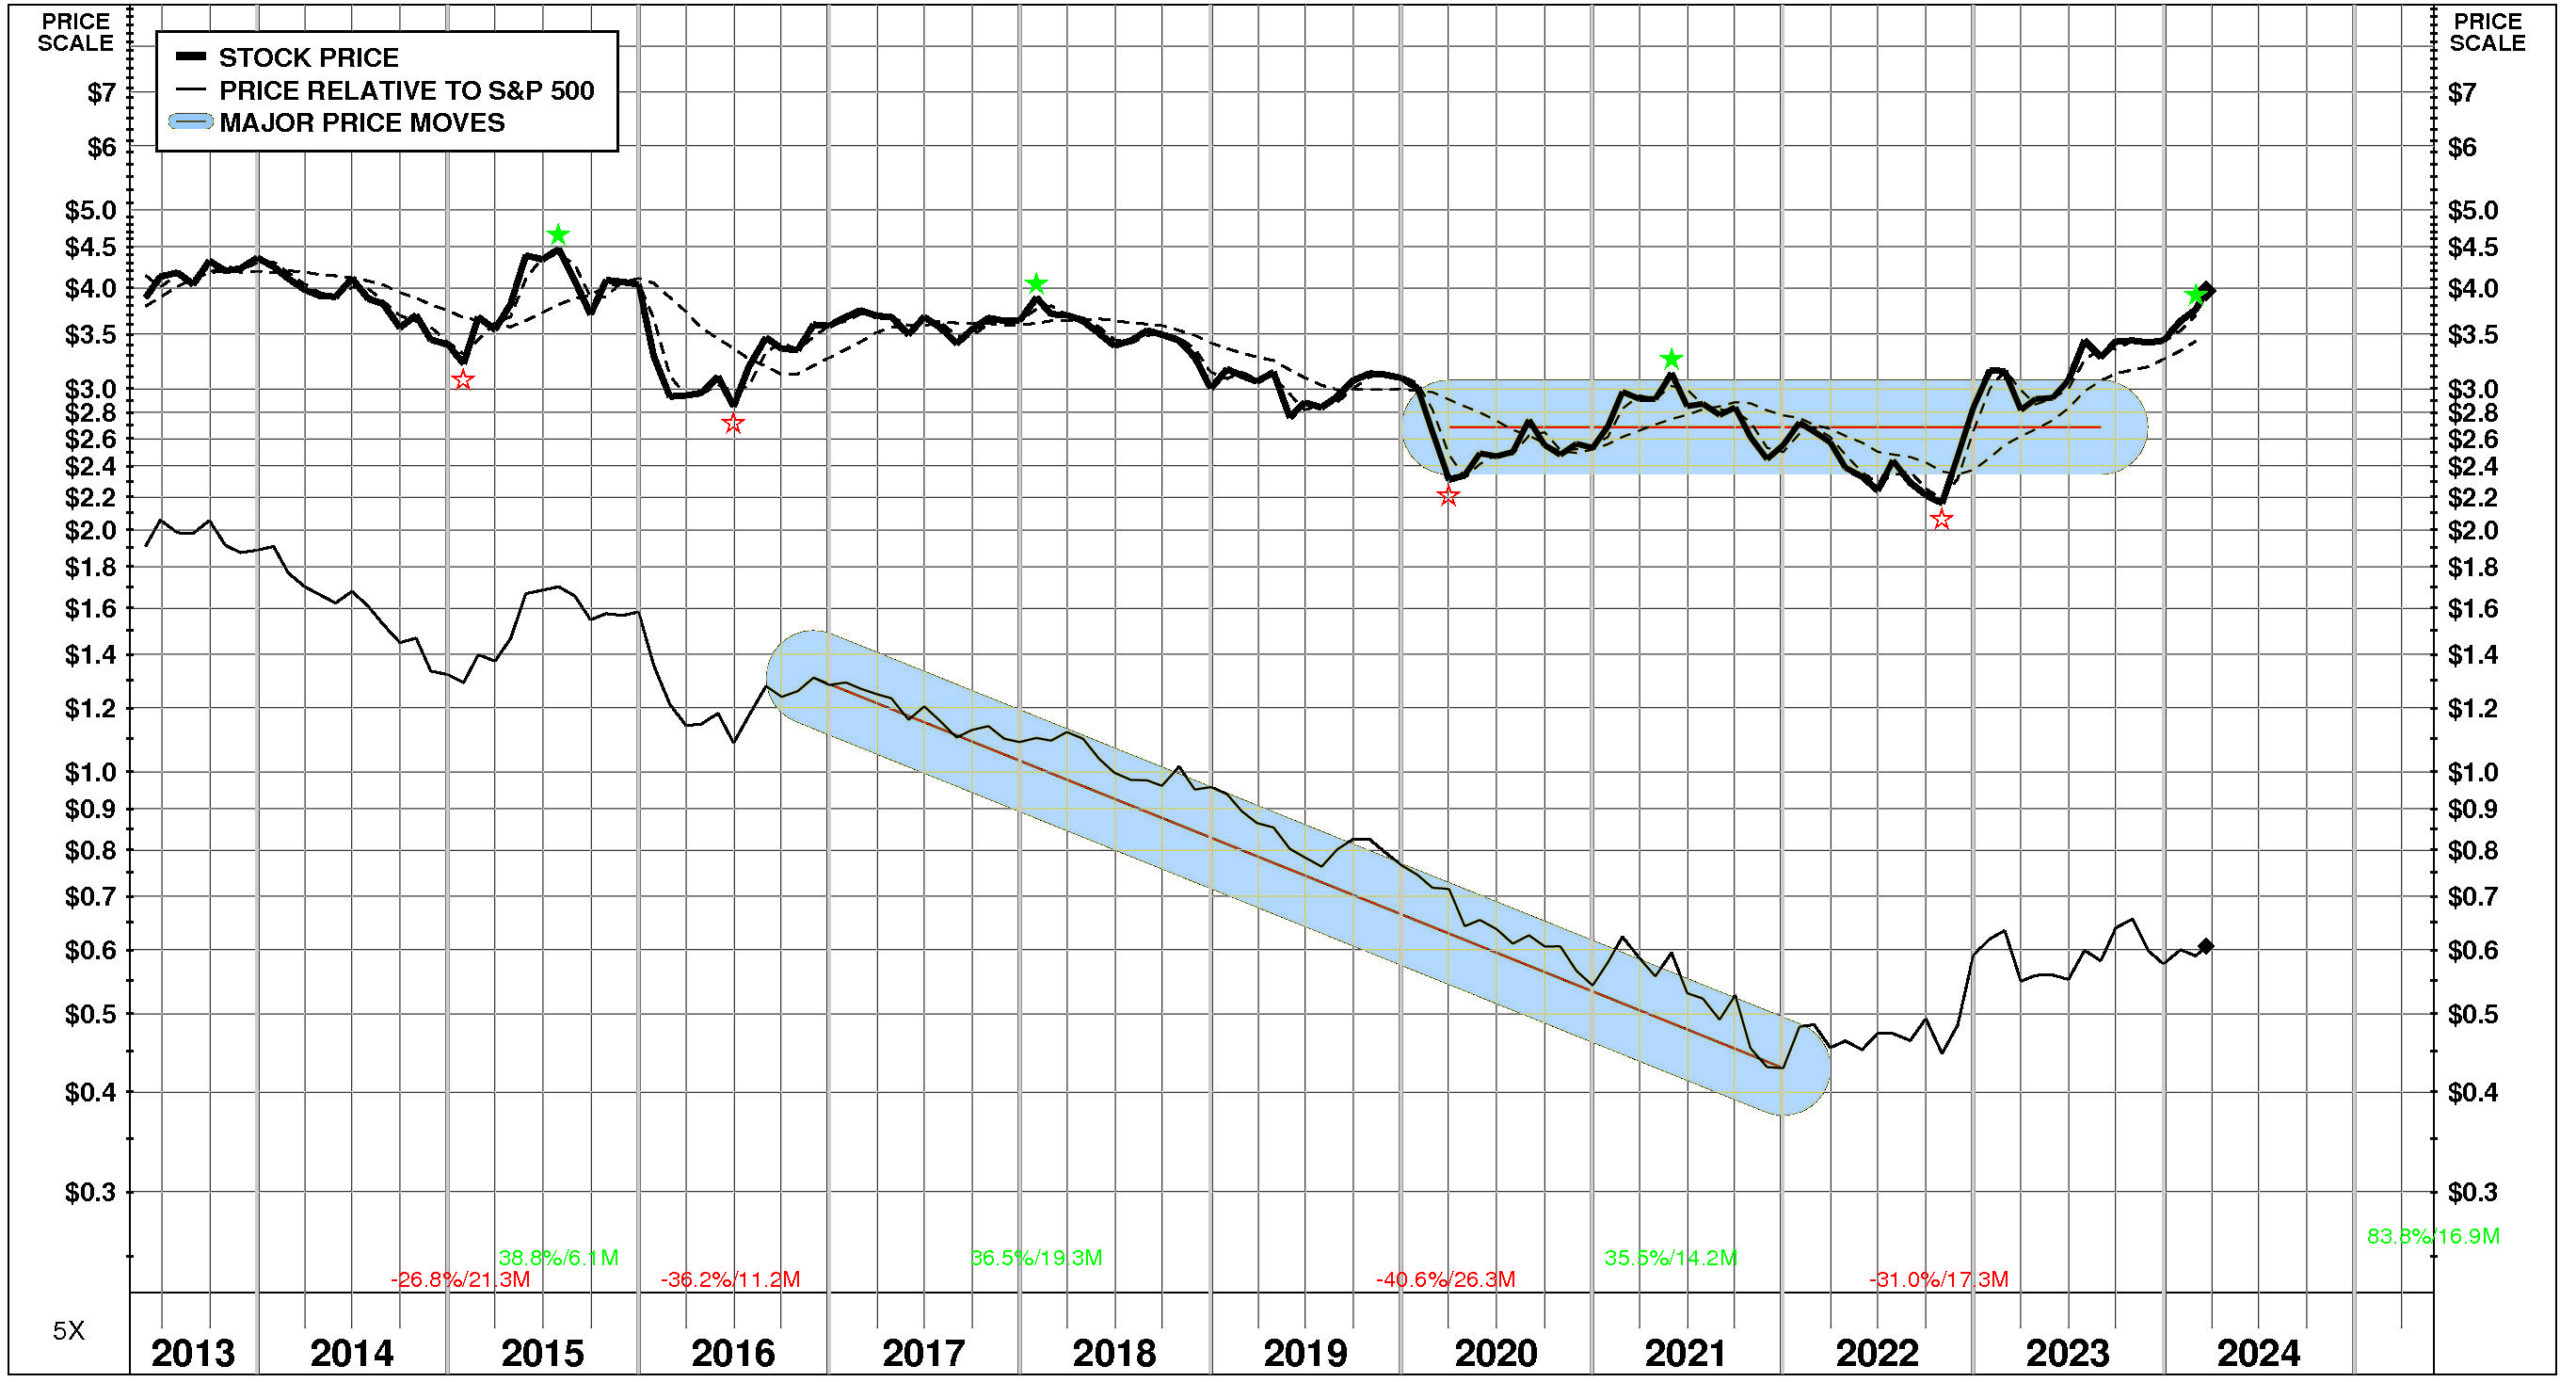
PRICE HISTORY
Over the full time period, Mizuho Financial Group's stock price performance has been significantly below market.
Between May, 2013 and March, 2024, Mizuho Financial Group's stock price rose +2%; relative to the market, this was a -68% loss.
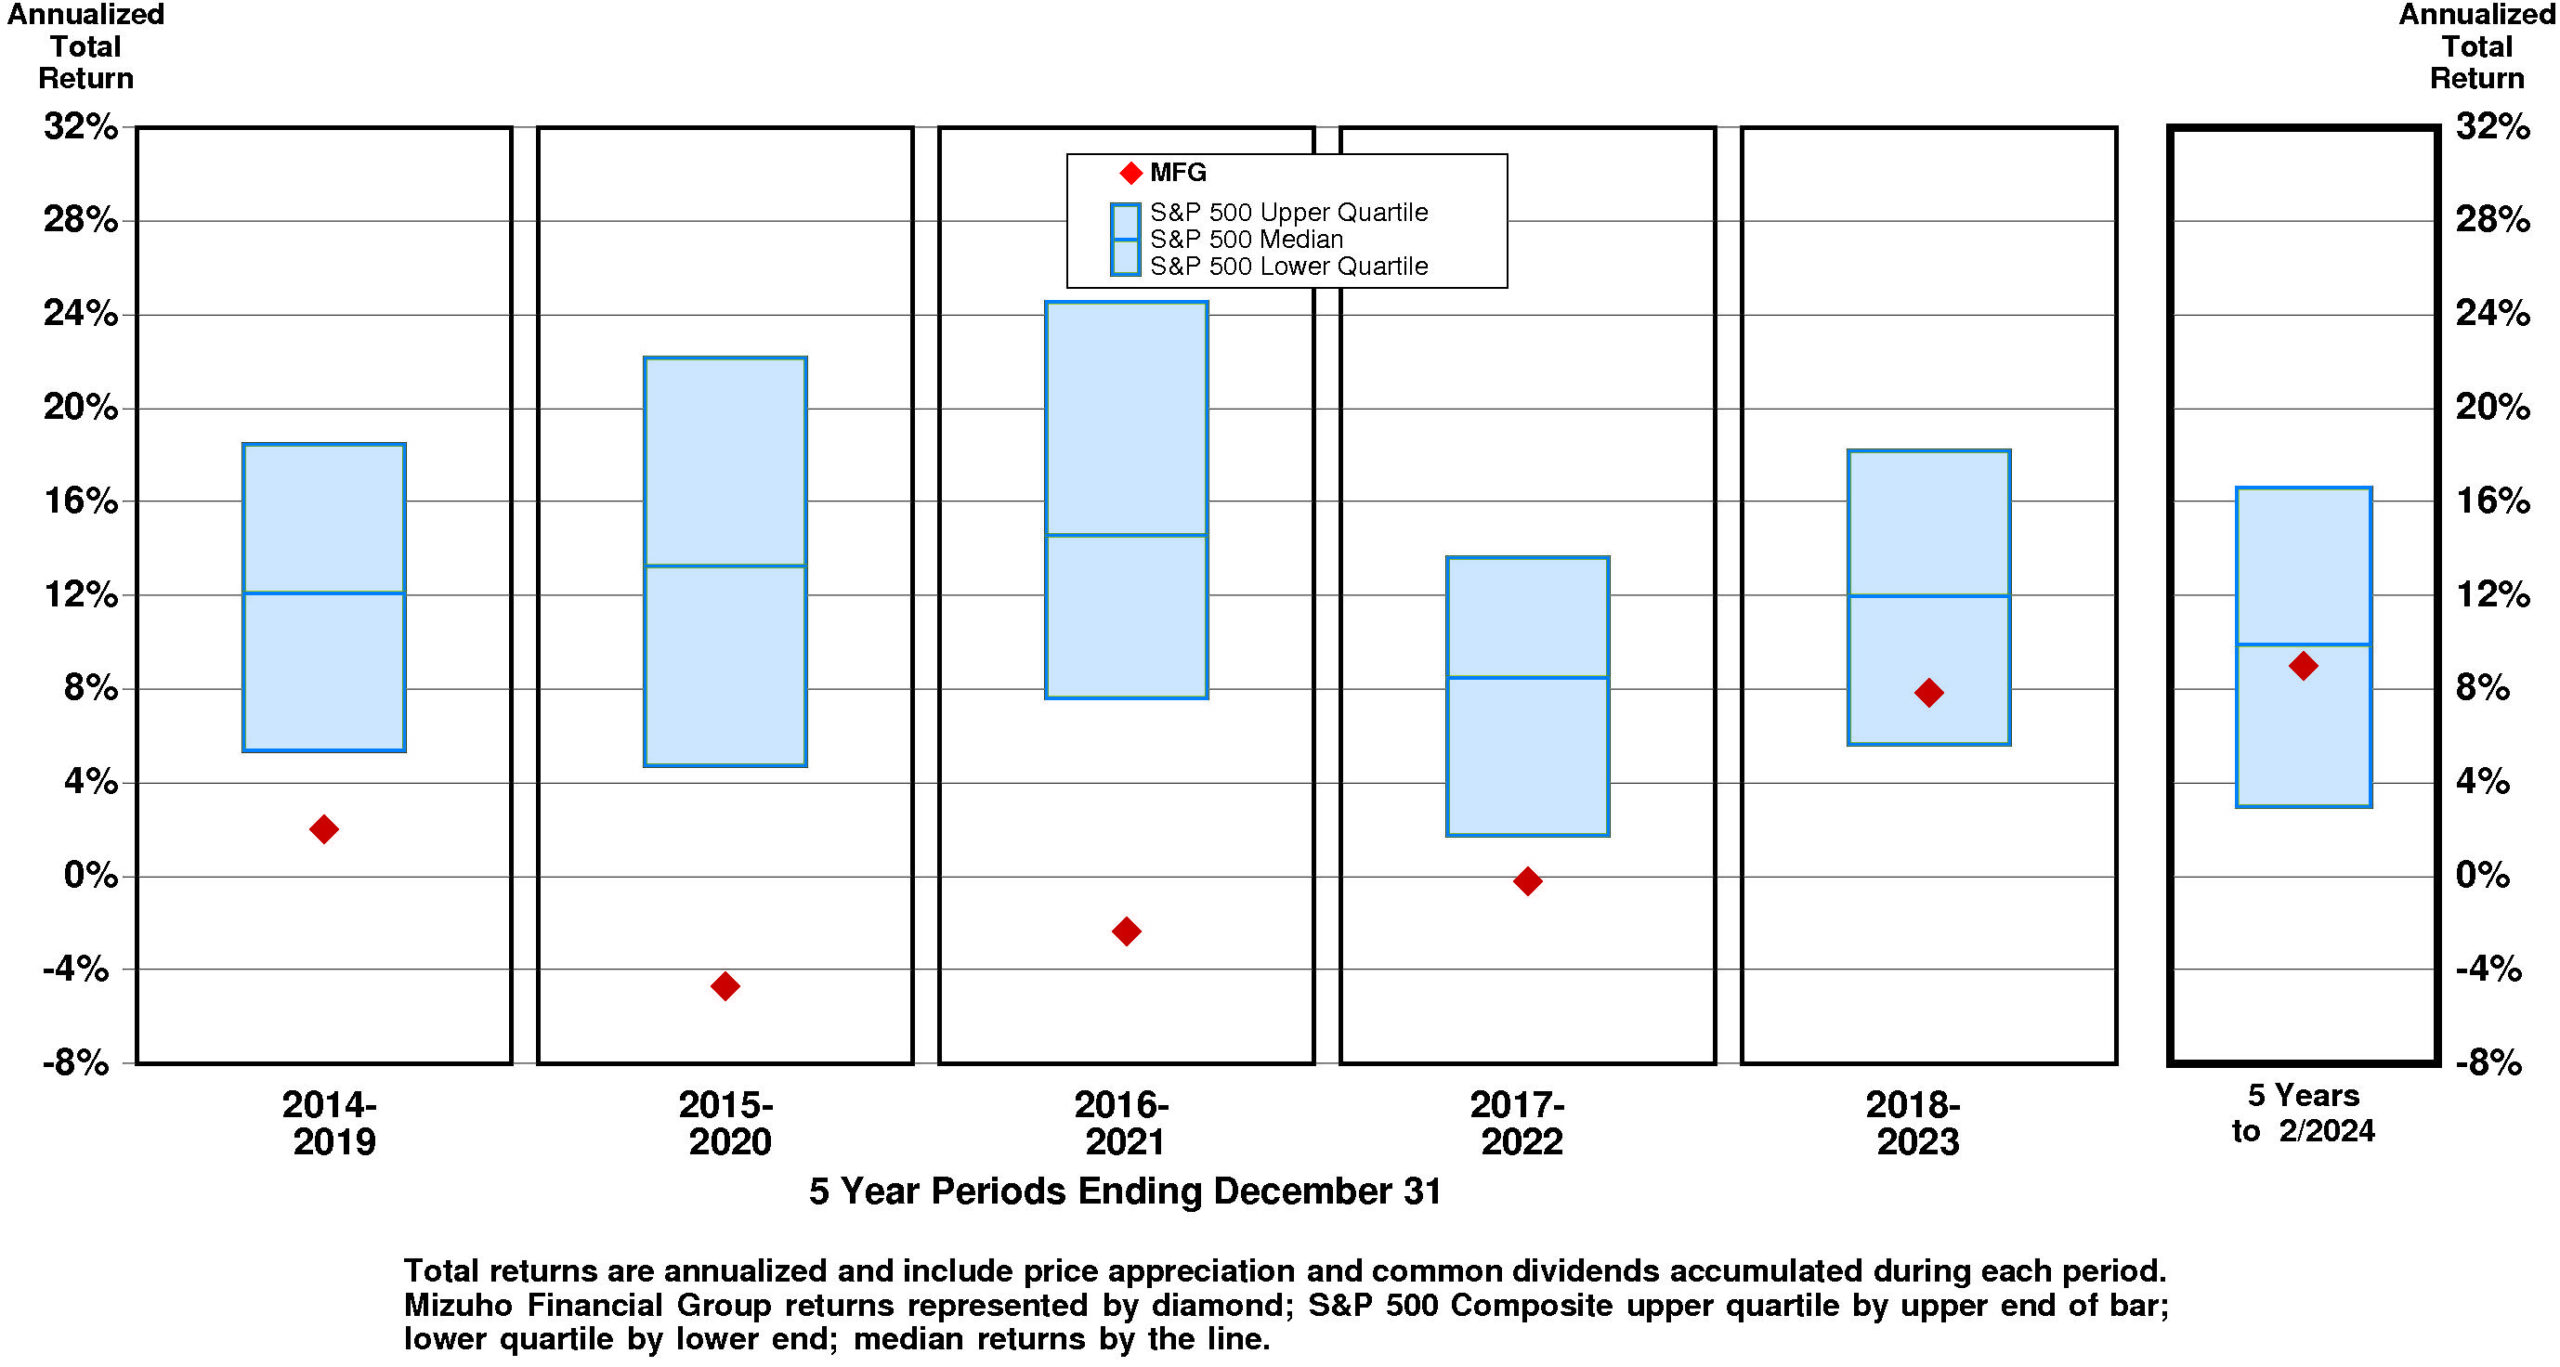
TOTAL INVESTMENT RETURNS
Current annual total return performance of 24.4% is above median relative to the S&P 500 Composite.
In addition to being above median relative to S&P 500 Composite, current annual total return performance through February, 2024 of 24.4% is below median relative to Mizuho Financial Group Inc Peer Group.
Current 5-year total return performance of 9.0% is slightly below median relative to the S&P 500 Composite.
Through February, 2024, with slightly below median current 5-year total return of 9.0% relative to S&P 500 Composite, Mizuho Financial Group's total return performance is below median relative to Mizuho Financial Group Inc Peer Group.
VALUATION BENCHMARKS
Relative to S&P 500 Composite, MFG's overall valuation is normal.
Ratio of enterprise value/earnings before interest and taxes is upper quartile. Ratio of enterprise value/revenue is upper quartile. Price/earnings ratio is lower quartile. Ratio of enterprise value/assets is lower quartile. Price/equity ratio is unavailable.
Relative to Mizuho Financial Group Peer Group, MFG's overall valuation is normal.
Ratio of enterprise value/earnings before interest and taxes is upper quartile. Ratio of enterprise value/revenue is at the upper quartile. Price/earnings ratio is below median. Ratio of enterprise value/assets is lower quartile. Price/equity ratio is unavailable.
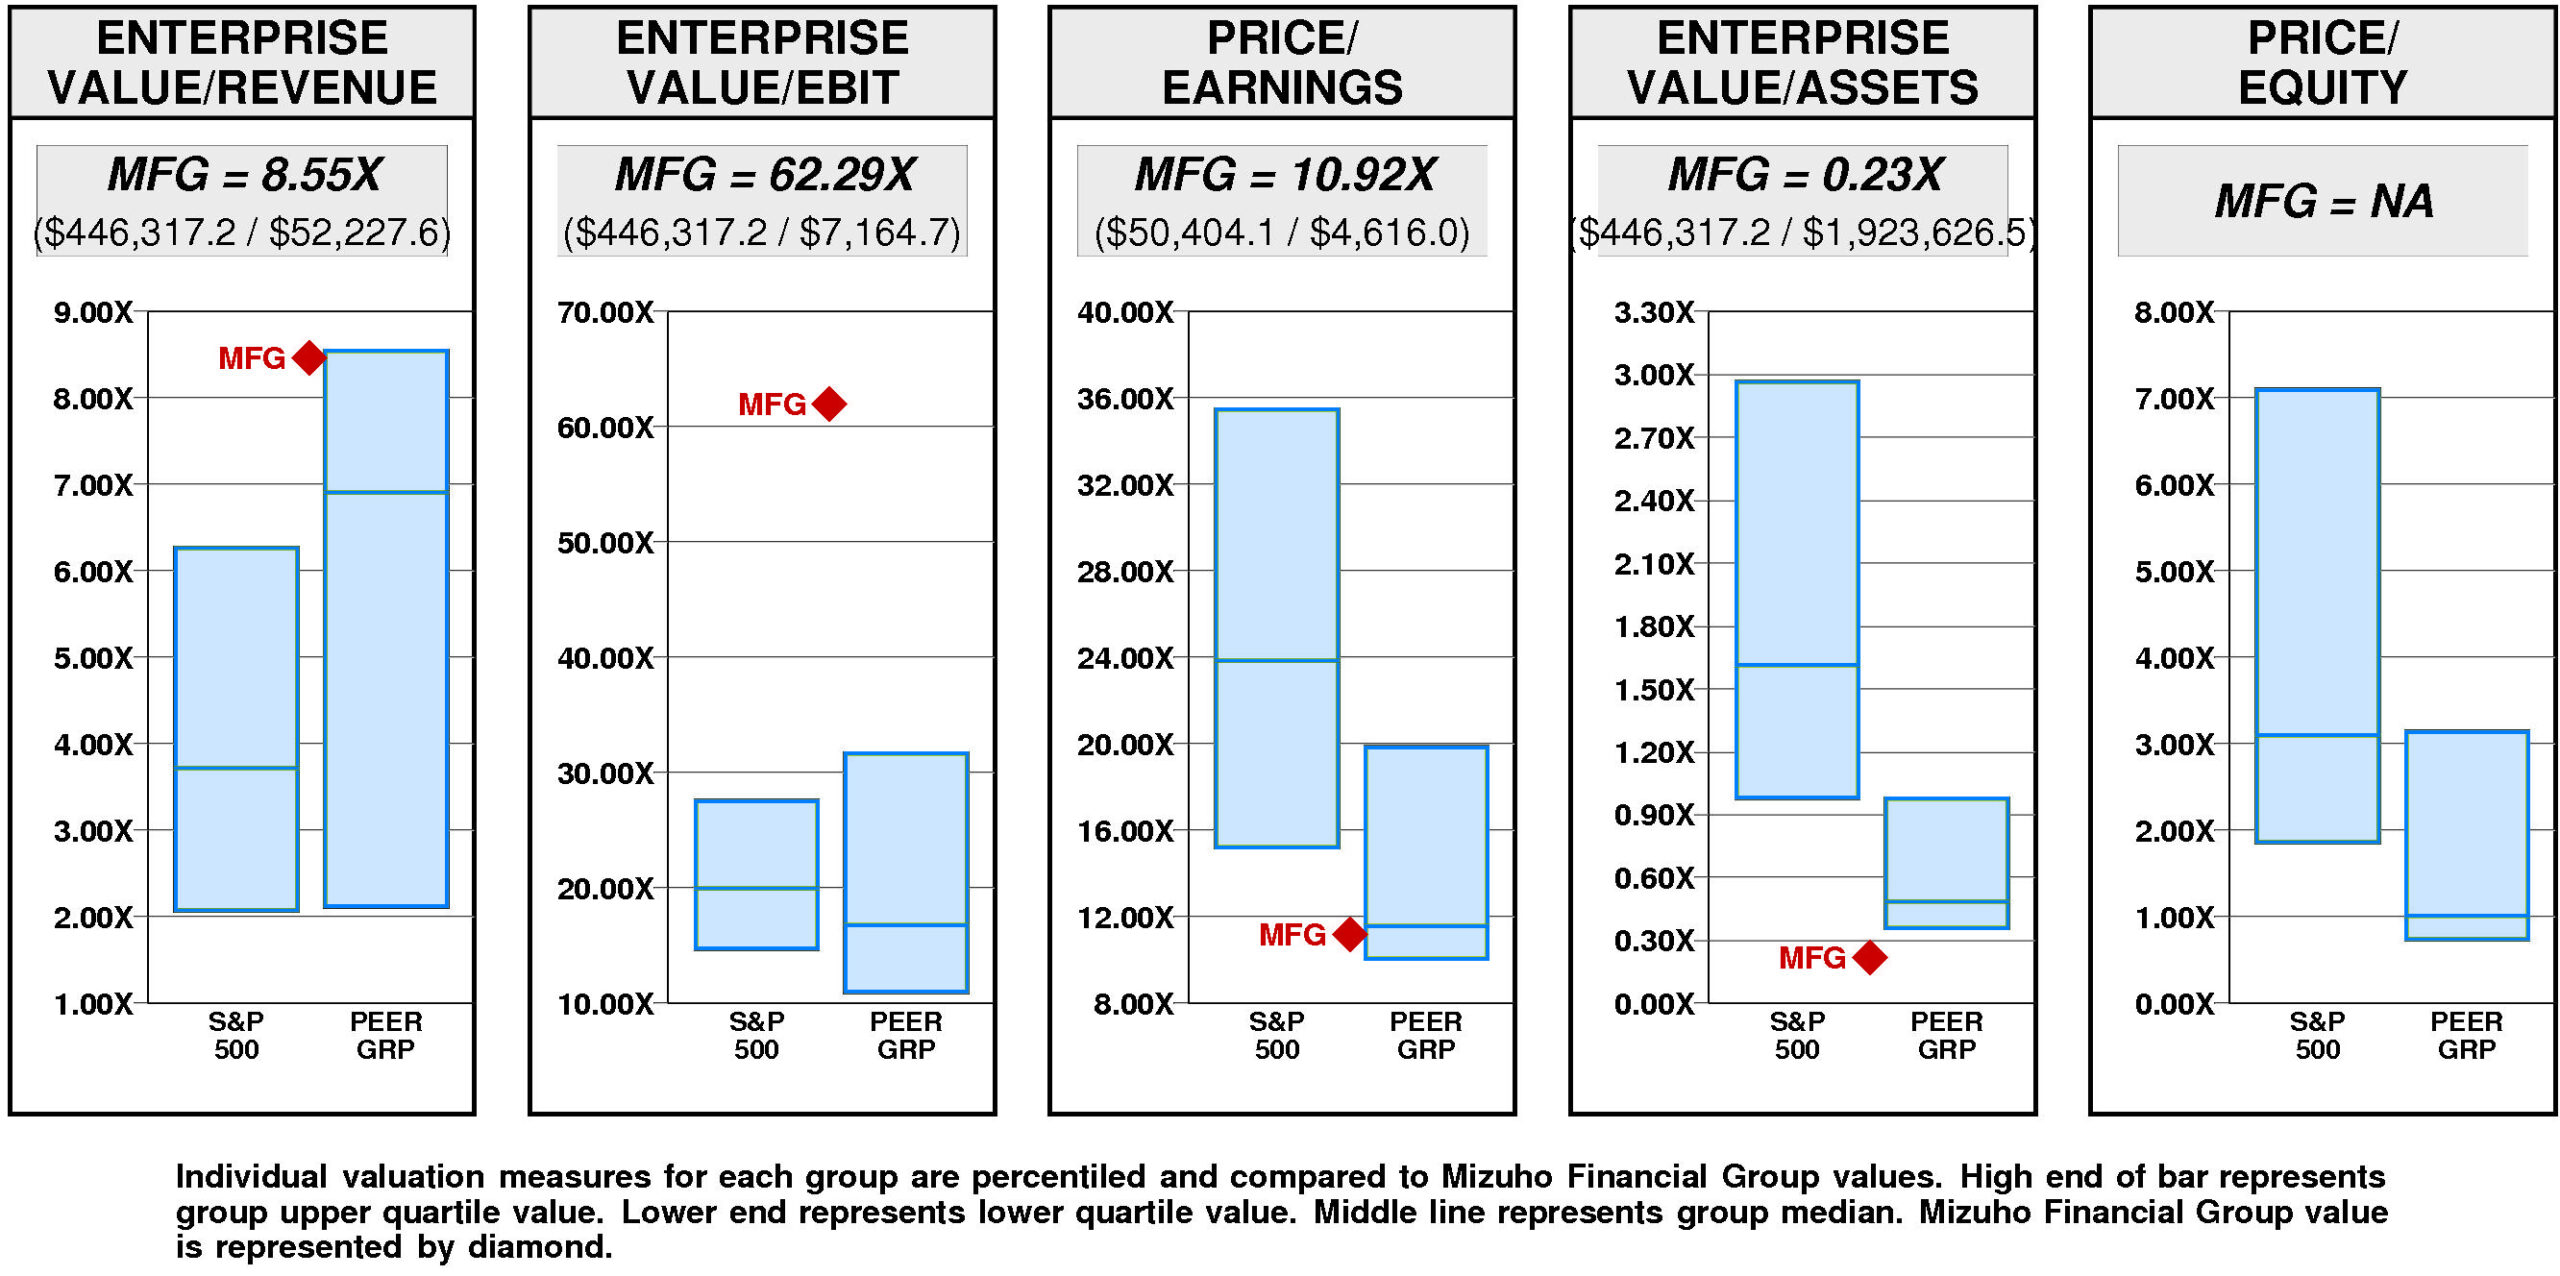
Mizuho Financial Group has a major value gap compared to the median valuation.
For MFG to achieve median valuation, its current ratio of enterprise value/revenue would have to fall from the current level of 8.55X to 6.91X. If MFG's ratio of enterprise value/revenue were to fall to 6.91X, its stock price would be lower by $-7 to $-3.
For MFG to fall to lower quartile valuation relative to the Mizuho Financial Group Peer Group, its current ratio of enterprise value/revenue would have to fall from the current level of 8.55X to 2.12X. If MFG's ratio of enterprise value/revenue were to fall to 2.12X, its stock price would decline by $-26 from the current level of $3.97.
VALUE TARGETS
MFG is expected to continue to be an important Value Builder reflecting capital returns that are forecasted to be above the cost of capital.
Mizuho Financial Group's current Price Target of $26 represents a +564% change from the current price of $3.97.
This very high appreciation potential results in an appreciation score of 97 (only 3% of the universe has greater appreciation potential.)
Reinforcing this high Appreciation Score of 97, the high Power Rating of 82 contributes to an Value Trend Rating of A.
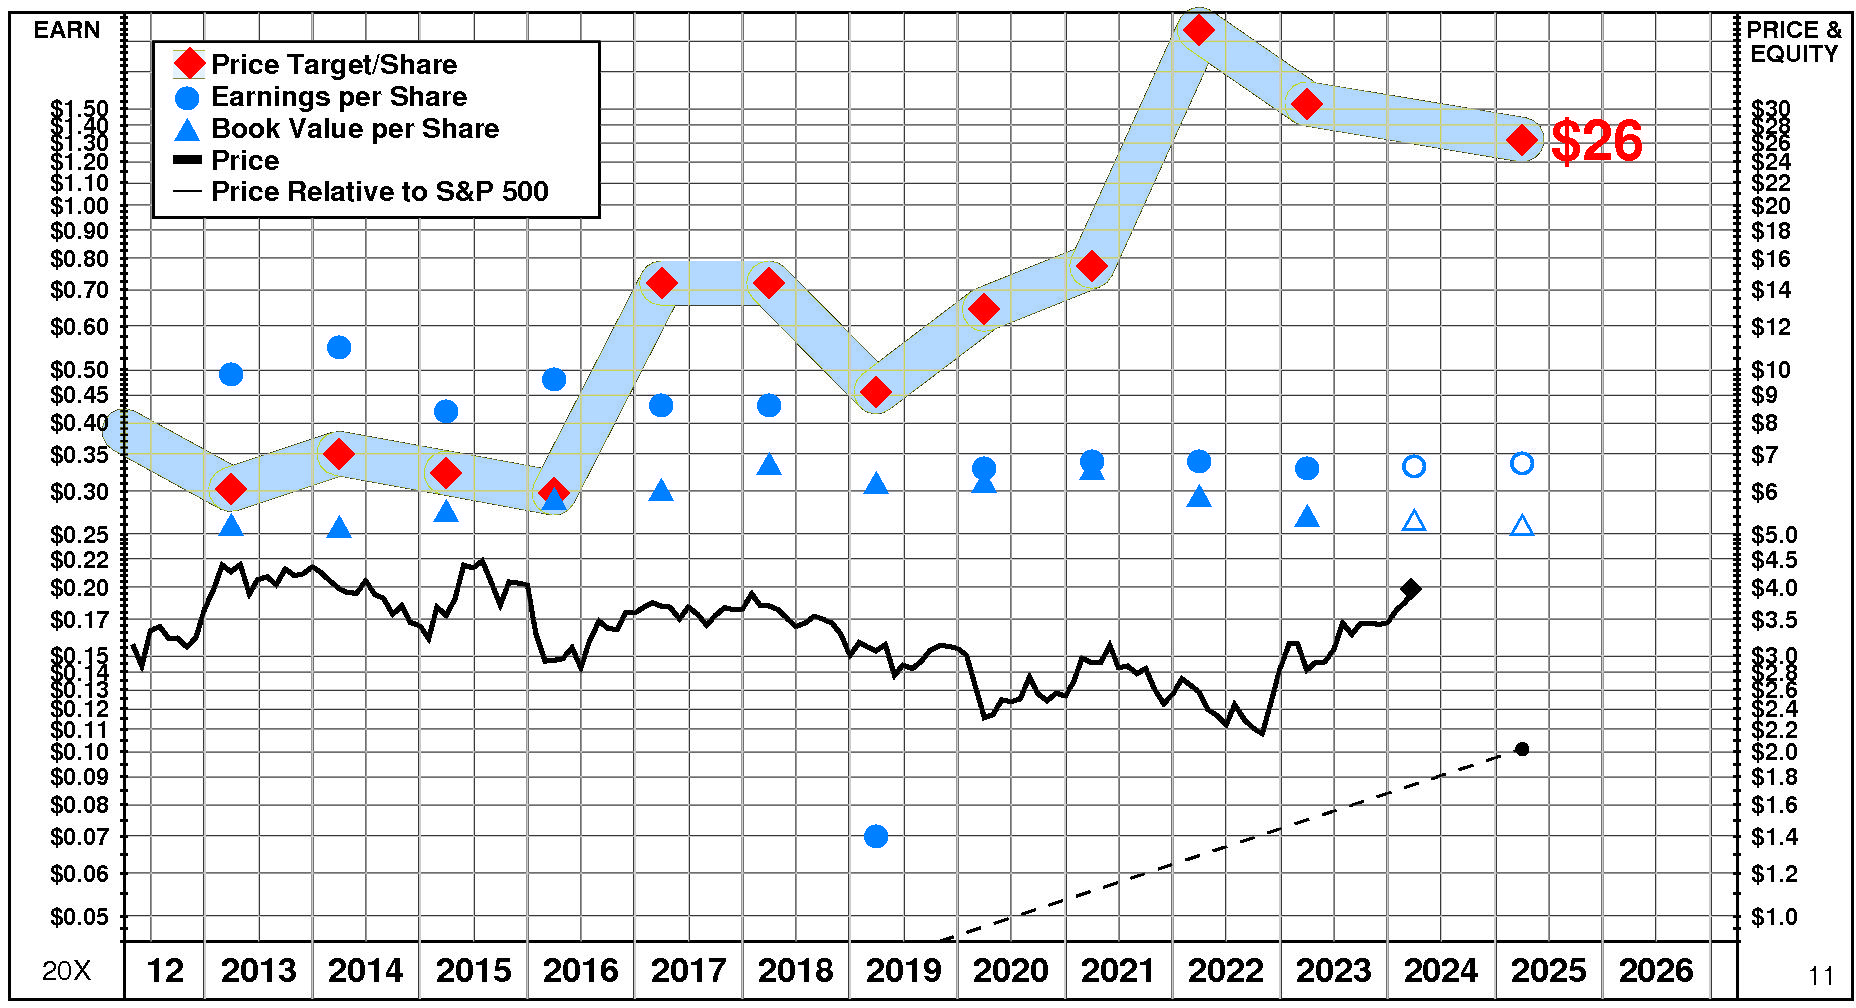
Mizuho Financial Group's current Price Target is $26 (-14% from the 2023 Target of $31 but +564% from the 03/20/24 price of $3.97).
This slight fall in the Target is the result of a -4% decrease in the equity base and a -11% decrease in the price/equity multiple. One Driver has a positive impact on the price/equity multiple, one has a negative impact, and one has no effect. The forecasted increase in return on equity has a slight positive impact on the price/equity multiple. The forecasted growth has no impact. The forecasted increase in cost of equity has a large negative impact.
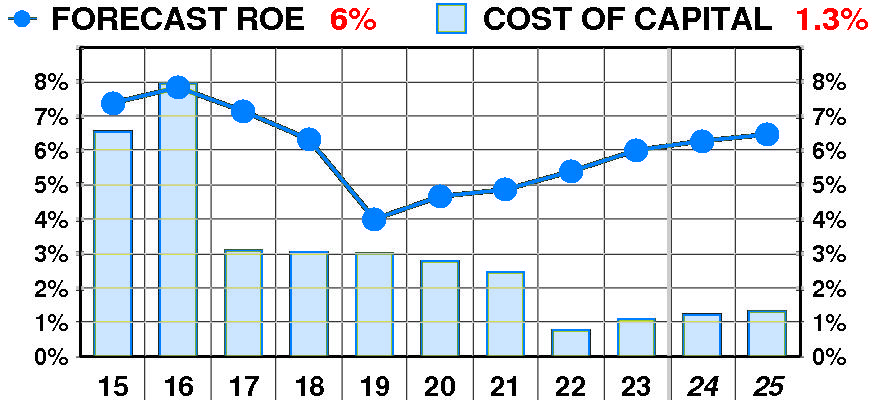
PTR's return on equity forecast is 6.5% — in line with our recent forecasts.
Forecasted return on equity suffered a dramatic, erratic decline between 2015 and 2023. The current forecast is above the 2019 low of 4%.
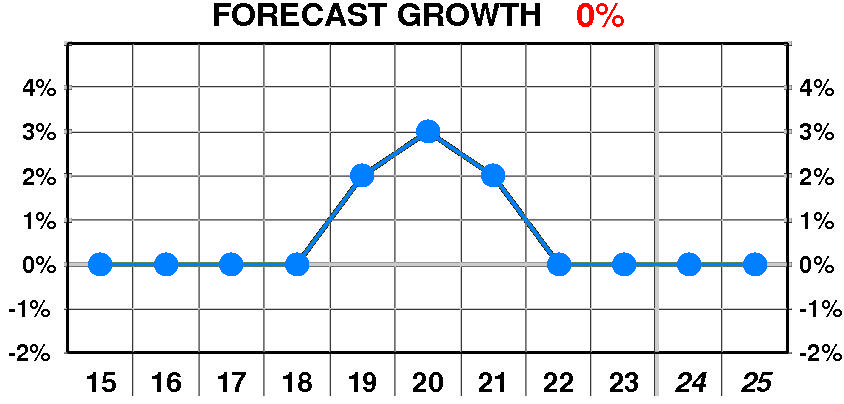
PTR's growth forecast is 0.0% — in line with our recent forecasts.
Forecasted growth erratic but little changed between 2019 and 2023. The current forecast is below the 2020 peak of 3%.
PTR's cost of equity forecast is 1.3% — in line with recent levels.
Forecasted cost of equity enjoyed a dramatic, steady decline between 2015 and 2023. The current forecast is well below the 2016 peak of 7.9%.
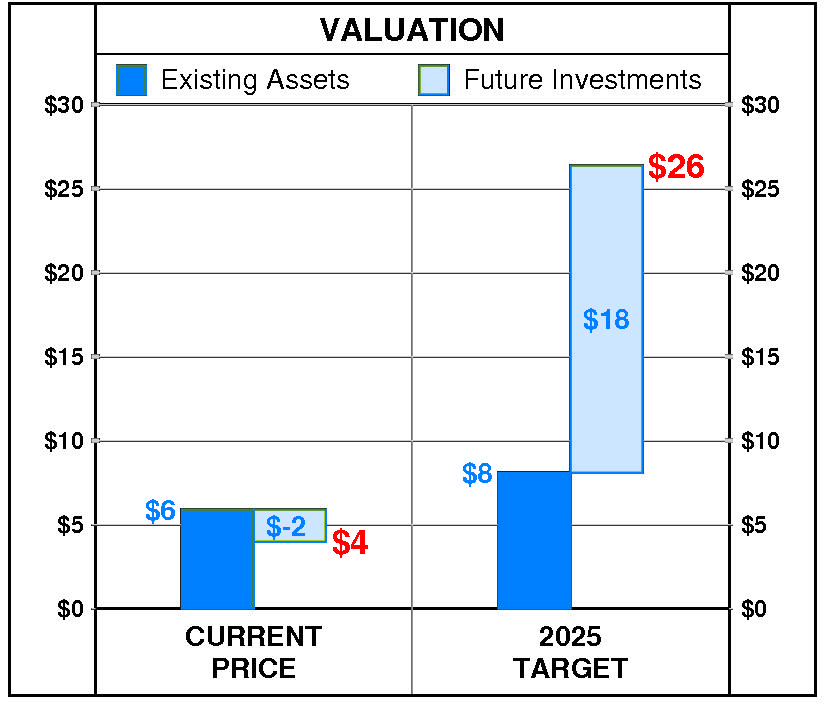
At Mizuho Financial Group's current price of $3.97, investors are placing a negative value of $-2 on its future investments. This view is not supported by the company's most recent performance that reflected a growth rate of 0.0% per year, and a return on equity of 6.0% versus a cost of equity of 1.1%.
PTR's 2025 Price Target of $26 is based on these forecasts and reflects an estimated value of existing assets of $8 and a value of future investments of $18.