BUSINESS
CGI Inc., together with its subsidiaries, provides information technology (IT) and business process services in Canada; Western, Southern, Central, and Eastern Europe; Australia; Scandinavia; Finland, Poland, and Baltics; the United States; the United Kingdom; and the Asia Pacific. Its services include the management of IT and business outsourcing, systems integration and consulting, and software solutions selling activities. The company also offers application development, integration and maintenance, testing, portfolio management, and modernization services; business consulting; and a suite of business process services designed to address the needs of specific industries, as well as IT infrastructure services.
INVESTMENT RATING
GIB's future returns on capital are forecasted to exceed the cost of capital. Accordingly, the company is expected to continue to be a major Value Builder.
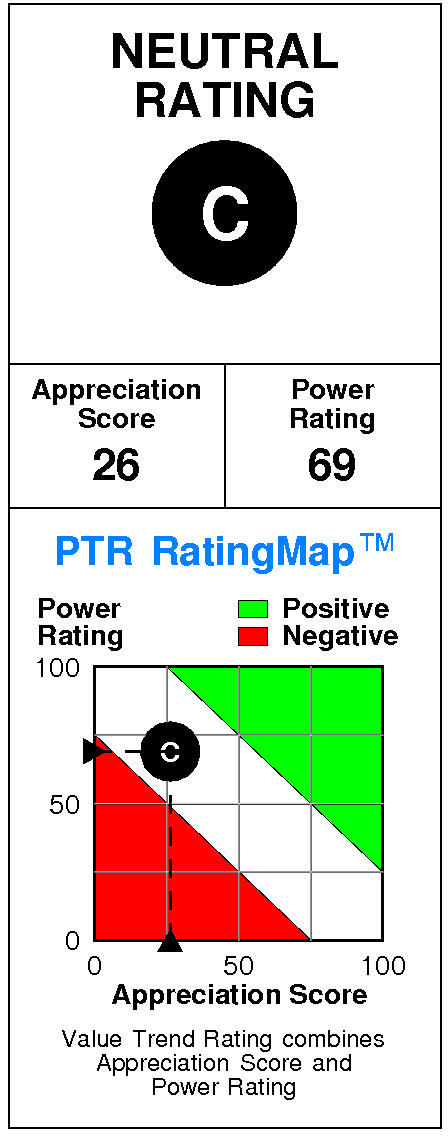
CGI has a current Value Trend Rating of C (Low Neutral).
The Value Trend Rating reflects contradictory signals from PTR's two proprietary measures of a stock's attractiveness. CGI has a poor Appreciation Score of 26 but a slightly positive Power Rating of 69, with the Low Neutral Value Trend Rating the result.
CGI's stock is selling well above targeted value.
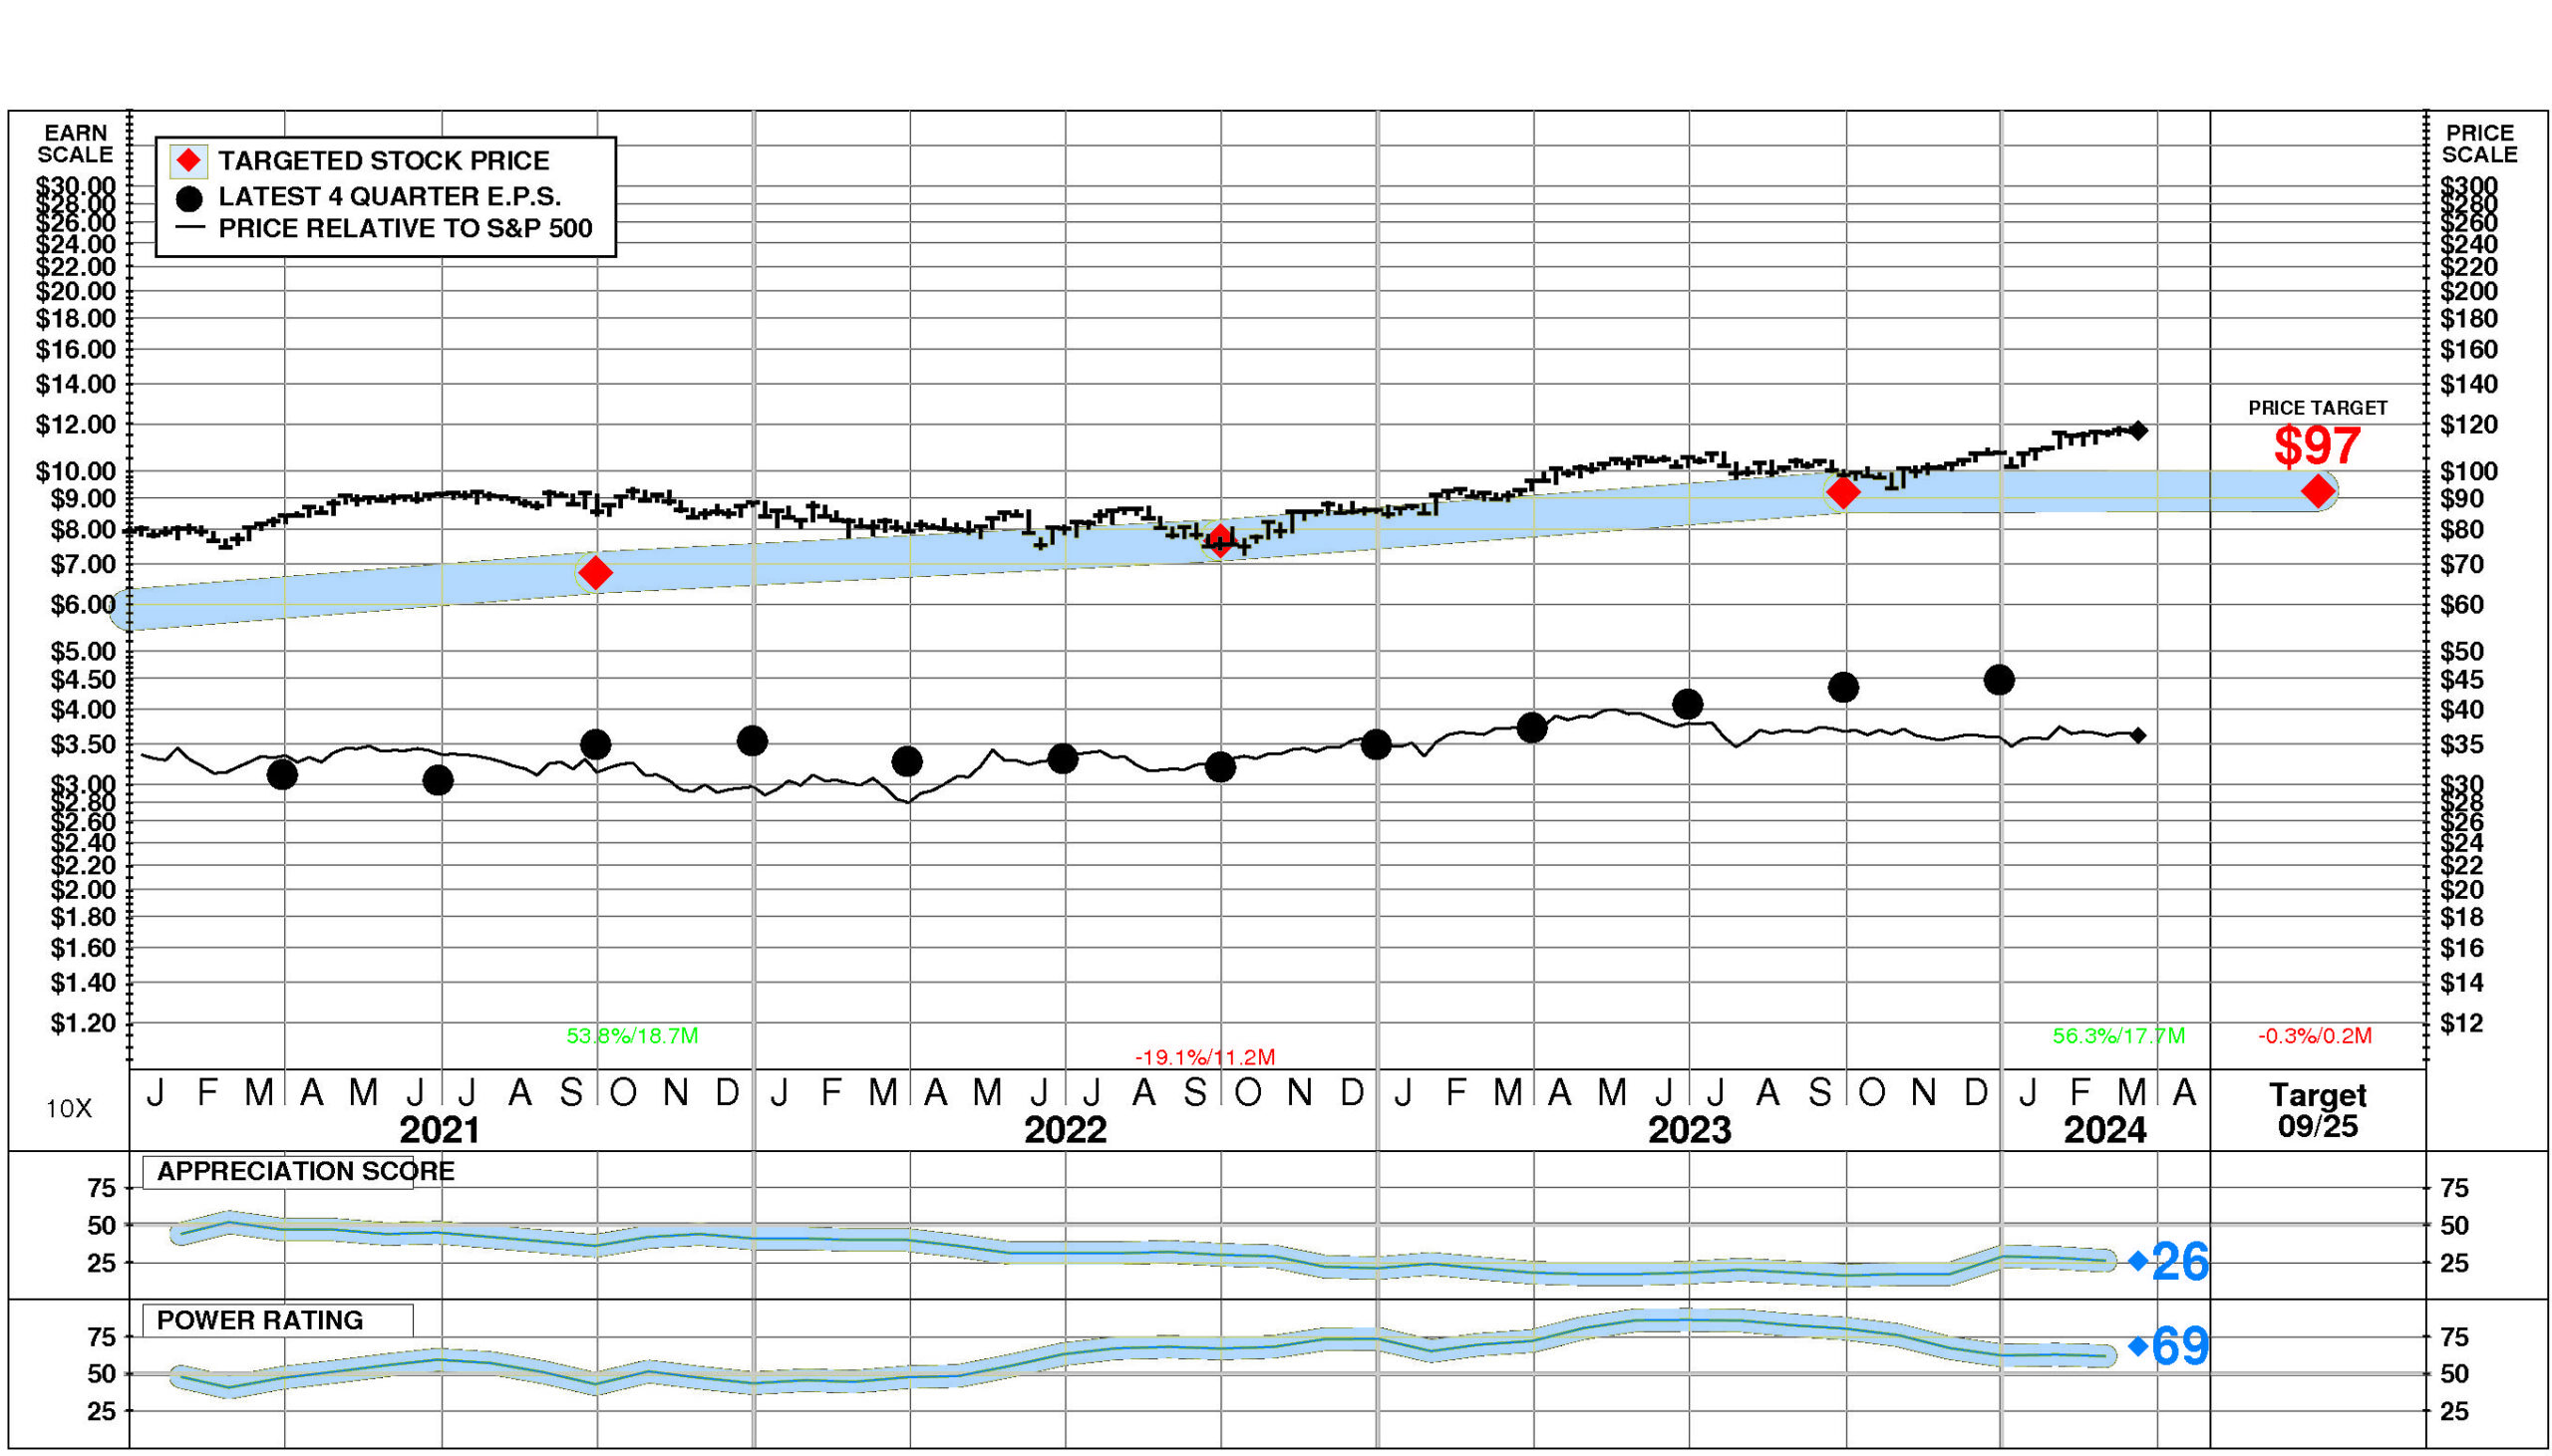
The current stock price of $117.23 compares to targeted value 12 months forward of $93.
This low appreciation potential results in an appreciation score of 26 (74% of the universe has greater appreciation potential.)
CGI has a Power Rating of 69.
(CGI's slightly positive Power Rating indicates that it has a better chance of achieving favorable investment performance over the near to intermediate term than all but 31% of companies in the universe.)
Factors contributing to this slightly positive Power Rating include: recent price action has been favorable; and earnings estimate behavior for CGI has been slightly favorable recently. An offsetting factor is the Computer Integrated System Design comparison group is in a slightly weakened position currently.
INVESTMENT PROFILE
CGI's financial strength is high. Financial strength rating is 77.
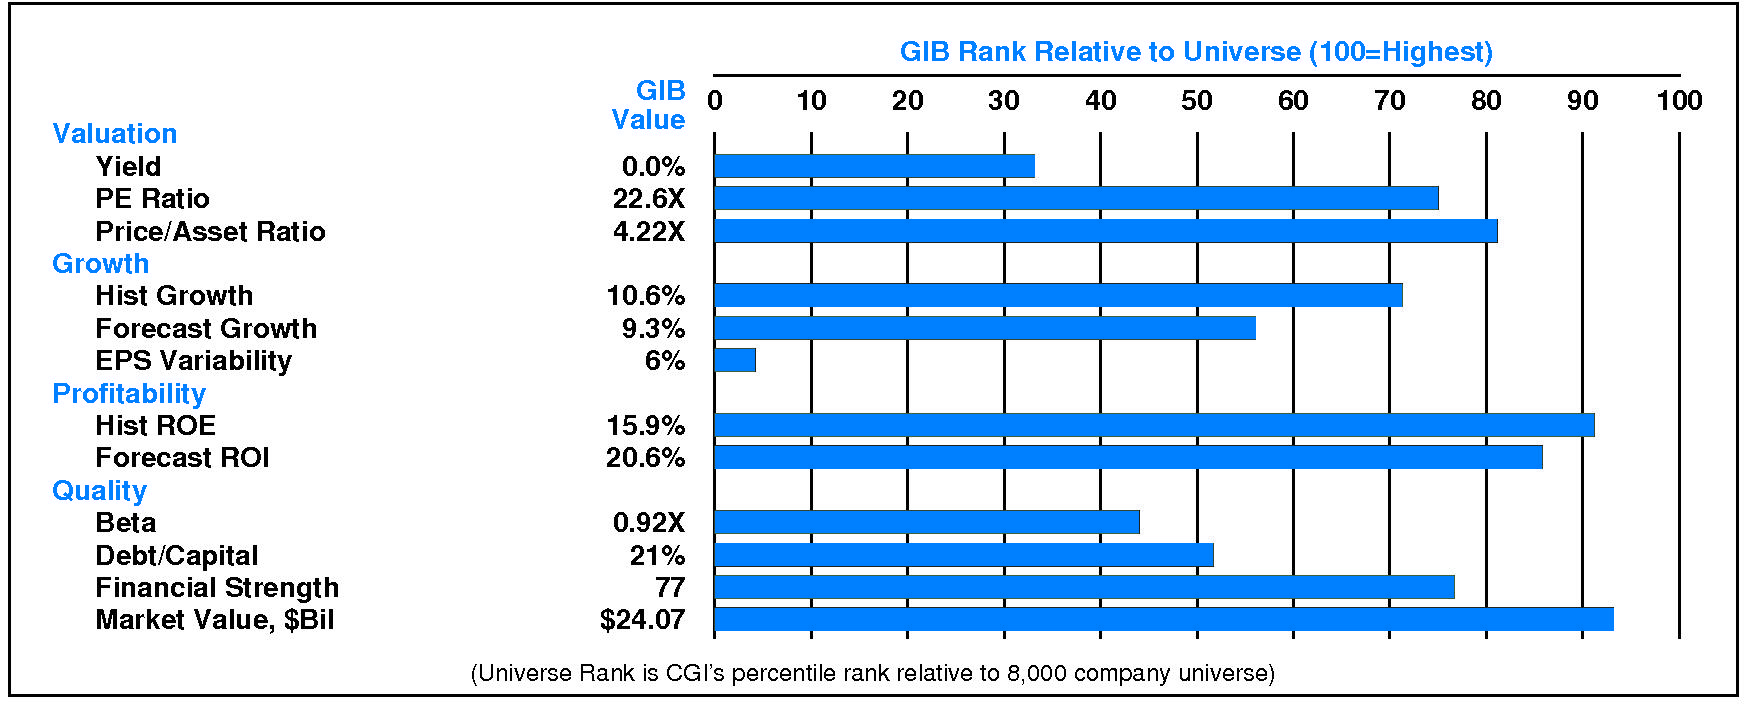
Relative to the S&P 500 Composite, CGI Inc has neutral Growth/Value characteristics; its appeal is likely to be to Capital Gain-oriented investors; the perception is that GIB is lower risk.
All factors are relative strengths. CGI's valuation is moderate: low dividend yield, moderate P/E ratio, and moderate price/book ratio. GIB has normal market capitalization.
CURRENT SIGNALS
CGI's current operations are eroding.
Return on equity is falling, reflecting: and falling tax keep rate.
CGI's current technical position is very strong.
The stock price is in a 17.7 month up move. The stock has appreciated 56.3% from its prior low. The stock price is above its 200 day moving average which is in an uptrend.
ALERTS
CGI Inc (NYSE: GIB). Marginal positive changes in fundamentals have recently occurred: significant quarterly earnings acceleration occurred.
The stock is currently rated C.
CGI Inc (NYSE: GIB) stock increased 1.2% on 3/19/24. The shares closed at $117.23. NORMAL trading volume accompanied the advance. The stock has been strong relative to the market over the last nine months and is unchanged during the last week.
CASH FLOW
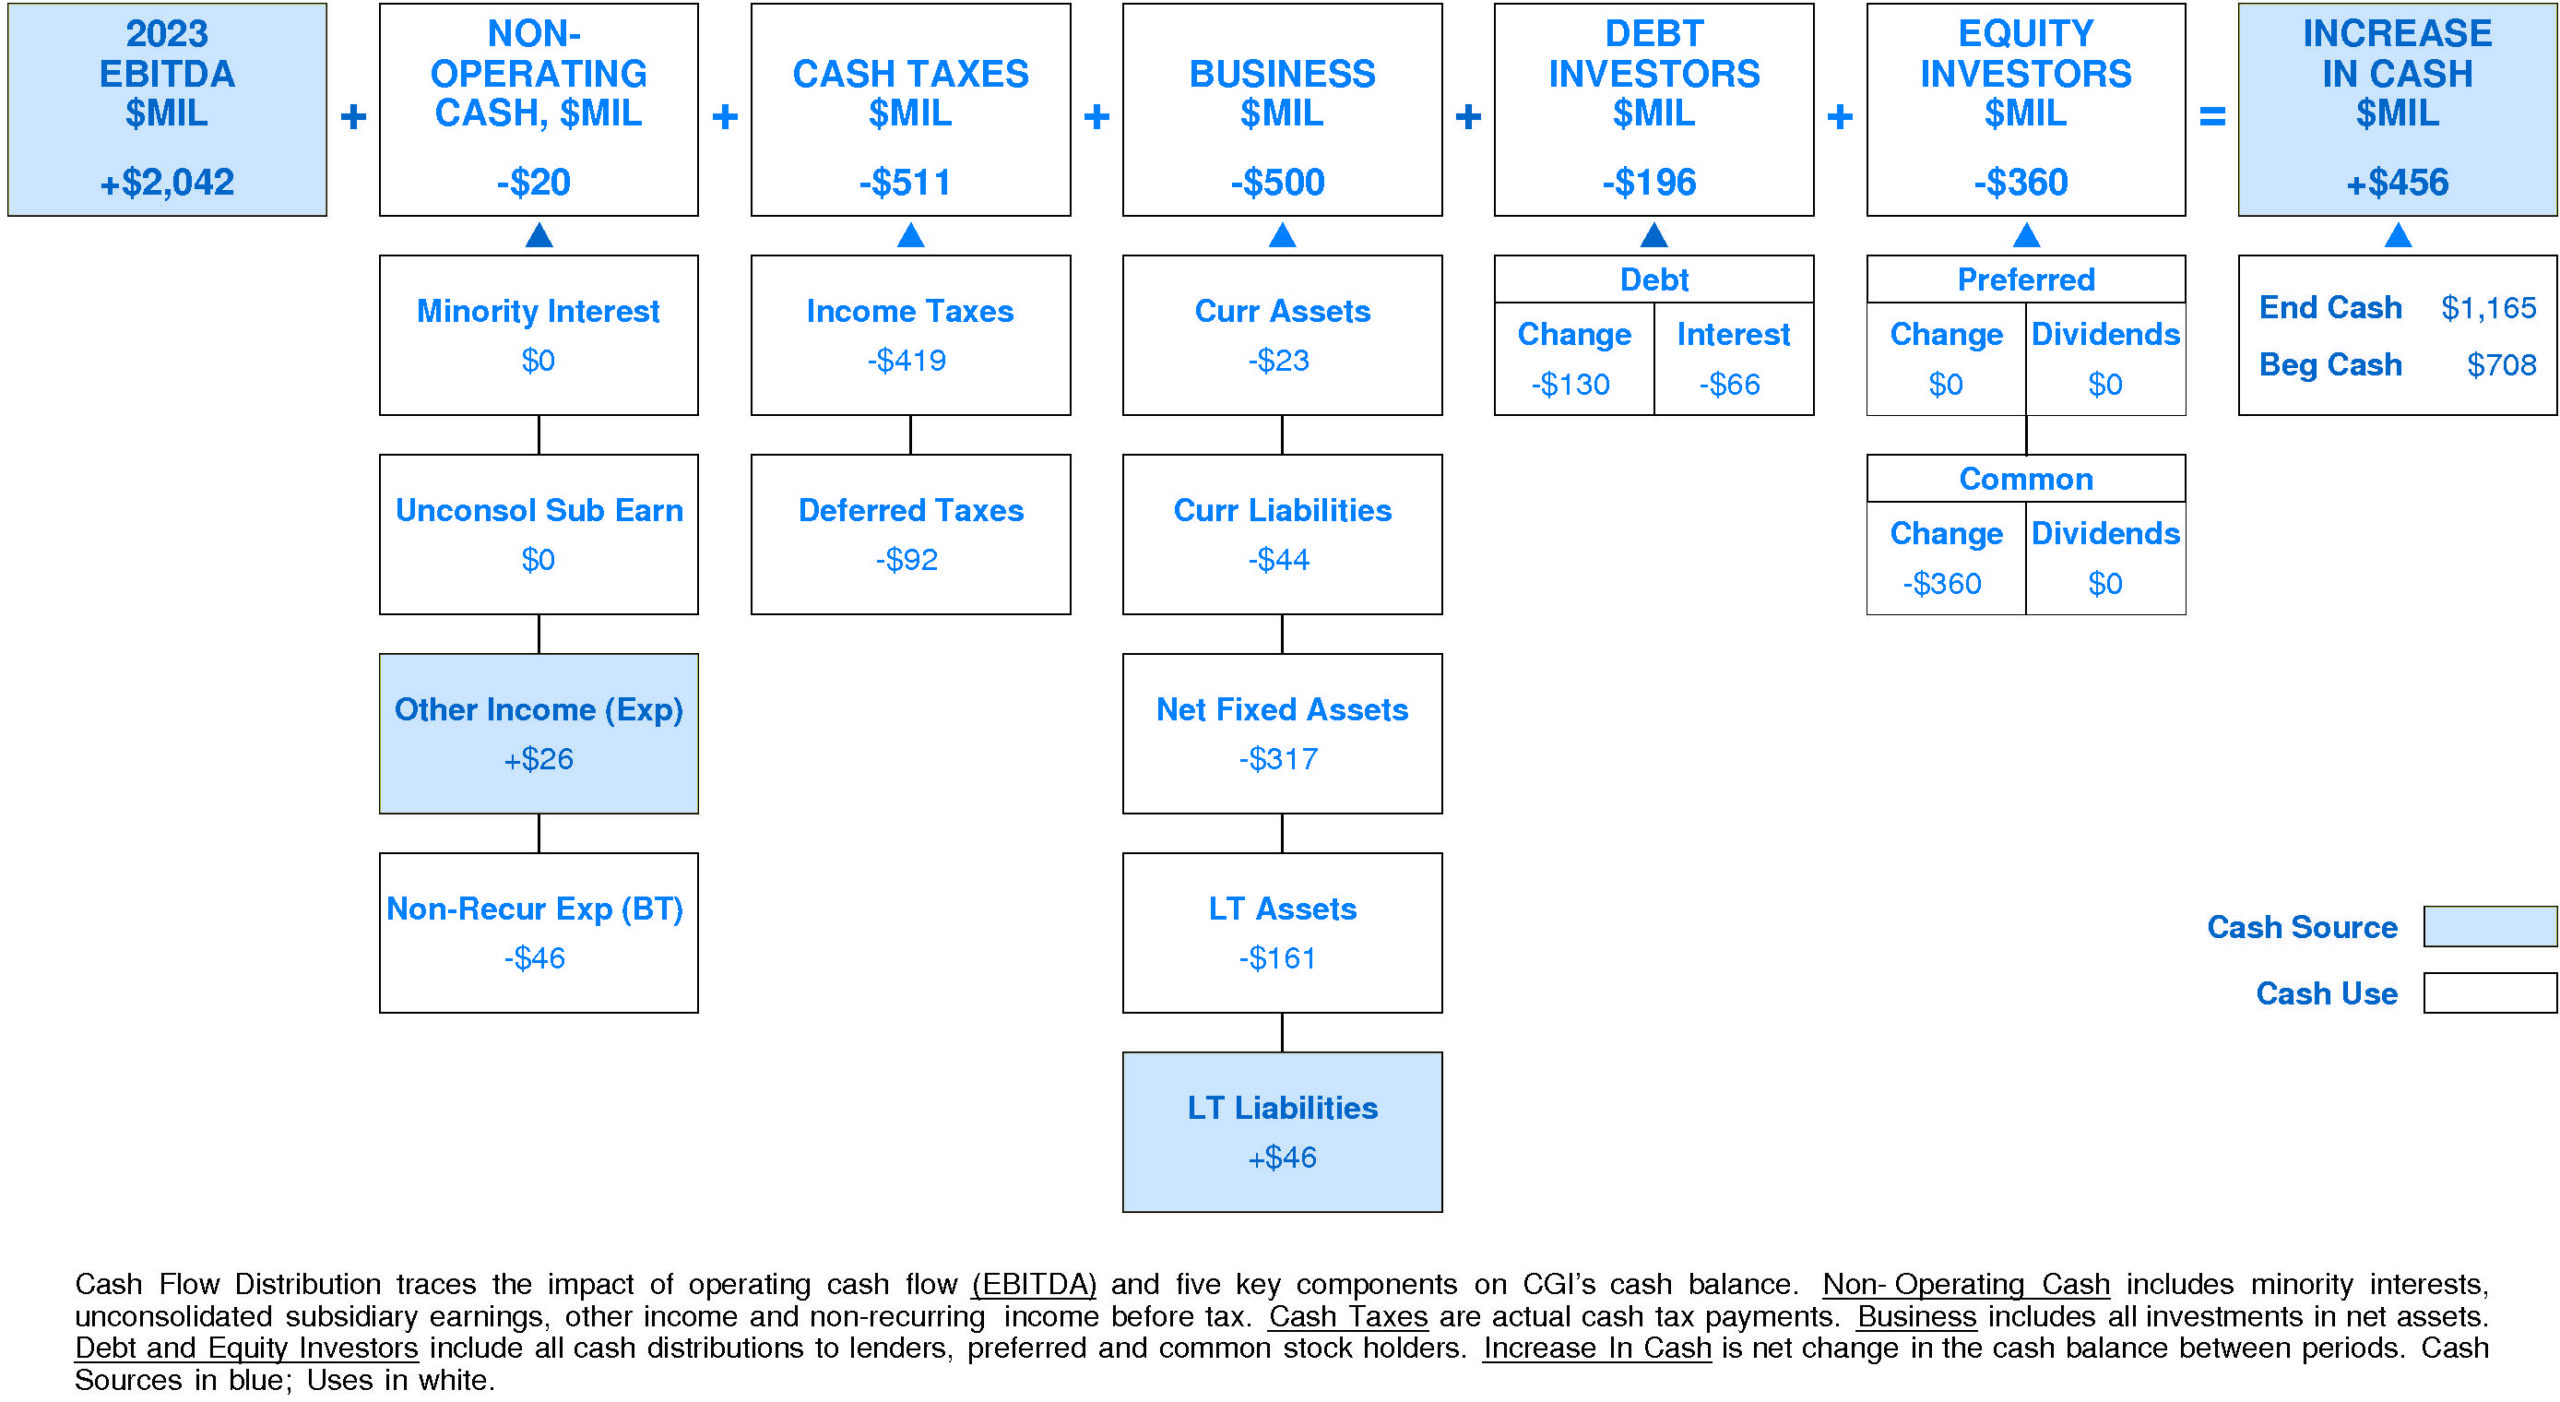
In 2023, CGI generated a very significant increase in cash of +$456 million (+64%). Sources of cash were much larger than uses.
Cash generated from 2023 EBITDA totaled +$2,042 million. Non-operating uses consumed -$20 million (-1% of EBITDA). Cash taxes consumed -$511 million (-25% of EBITDA). Re-investment in the business amounted to -$500 million (-24% of EBITDA). On a net basis, debt investors pulled out -$196 million (-10% of EBITDA) while equity investors withdrew -$360 million (-18% of EBITDA).
CGI's Non-operating Income, %EBITDA has exhibited little to no overall change over the period.
This stability was accompanied by stability for the Cgi Peer Group as well. In most years, CGI was in the third quartile and second quartile. Currently, CGI is at median at -1% of EBITDA (-$20 million).
CGI's Cash Taxes, %EBITDA has exhibited little to no overall change over the period.
This stability was accompanied by an uptrend for the Cgi Peer Group. In most years, CGI was in the lower quartile and second quartile. Currently, CGI is lower quartile at -25% of EBITDA (-$511 million).
CGI's Business Re-investment, %EBITDA has suffered a volatile overall downtrend over the period.
This downtrend was accompanied by an opposite trend for the Cgi Peer Group. In most years, CGI was in the top quartile and second quartile. Currently, CGI is upper quartile at -24% of EBITDA (-$500 million).
CGI's Debt Investors, %EBITDA has experienced a volatile overall uptrend over the period.
This improvement was accompanied by stability for the Cgi Peer Group. In most years, CGI was in the third quartile and lower quartile. Currently, CGI is slightly below median at -10% of EBITDA (-$196 million).
CGI's Equity Investors, %EBITDA has experienced a downtrend over the period.
This downtrend was accompanied by a similar trend for the Cgi Peer Group. In most years, CGI was in the third quartile and second quartile. Currently, CGI is upper quartile at -18% of EBITDA (-$360 million).
CGI's Change in Cash, %EBITDA has exhibited little to no overall change over the period.
This stability was accompanied by an uptrend for the Cgi Peer Group. In most years, CGI was in the top quartile and third quartile. Currently, CGI is at the upper quartile at +22% of EBITDA (+$456 million).
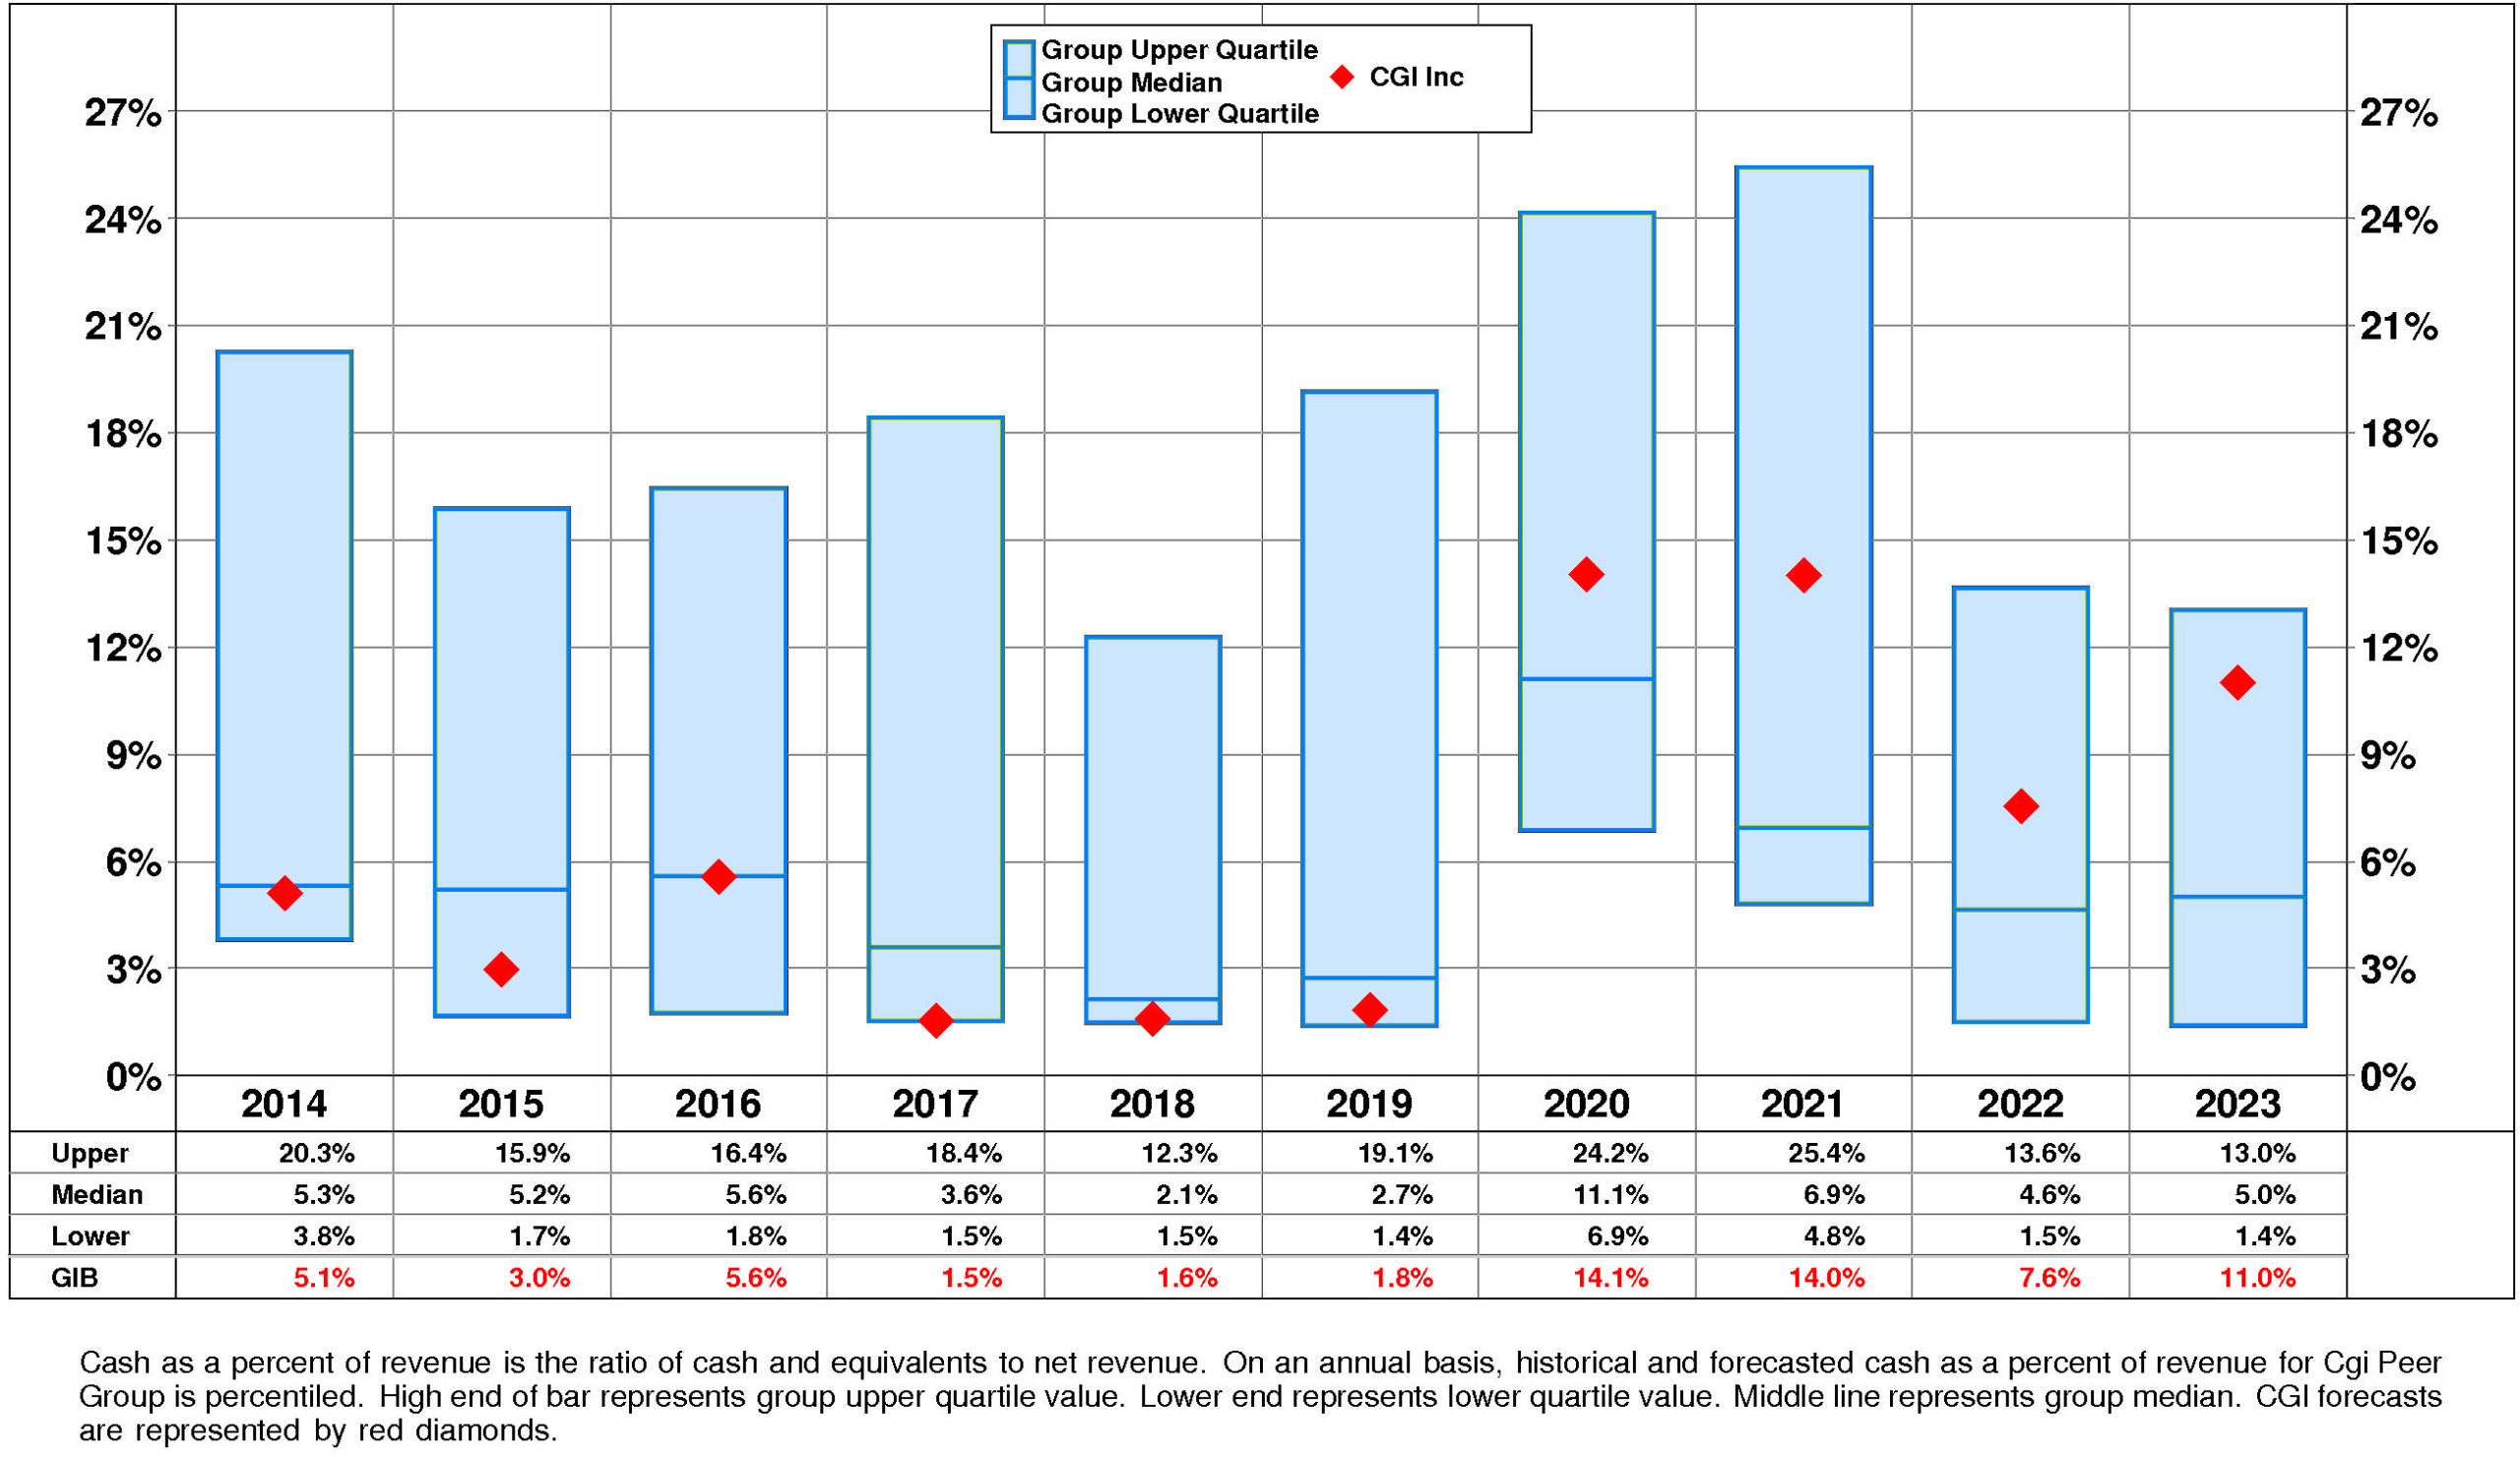
CGI's Cash, %Revenue has exhibited a very small overall uptrend over the period.
This improvement was accompanied by stability for the Cgi Peer Group. In most years, CGI was in the third quartile and second quartile. Currently, CGI is above median at +11%.
PROFITABILITY
CGI's return on equity has improved modestly since 2014. The current level of 18.8% is 1.09X the low for the period and is -6.7% from the high.
This modest improvement was due to minor positive trend in pretax operating return and little change in non-operating factors.
The productivity of CGI's assets declined over the full period 2014-2023: asset turnover has experienced a downtrend.
CGI's pretax margin enjoyed a strong overall uptrend over the period 2014-2023.
Non-operating factors (income taxes and financial leverage) had little influence on return on equity.
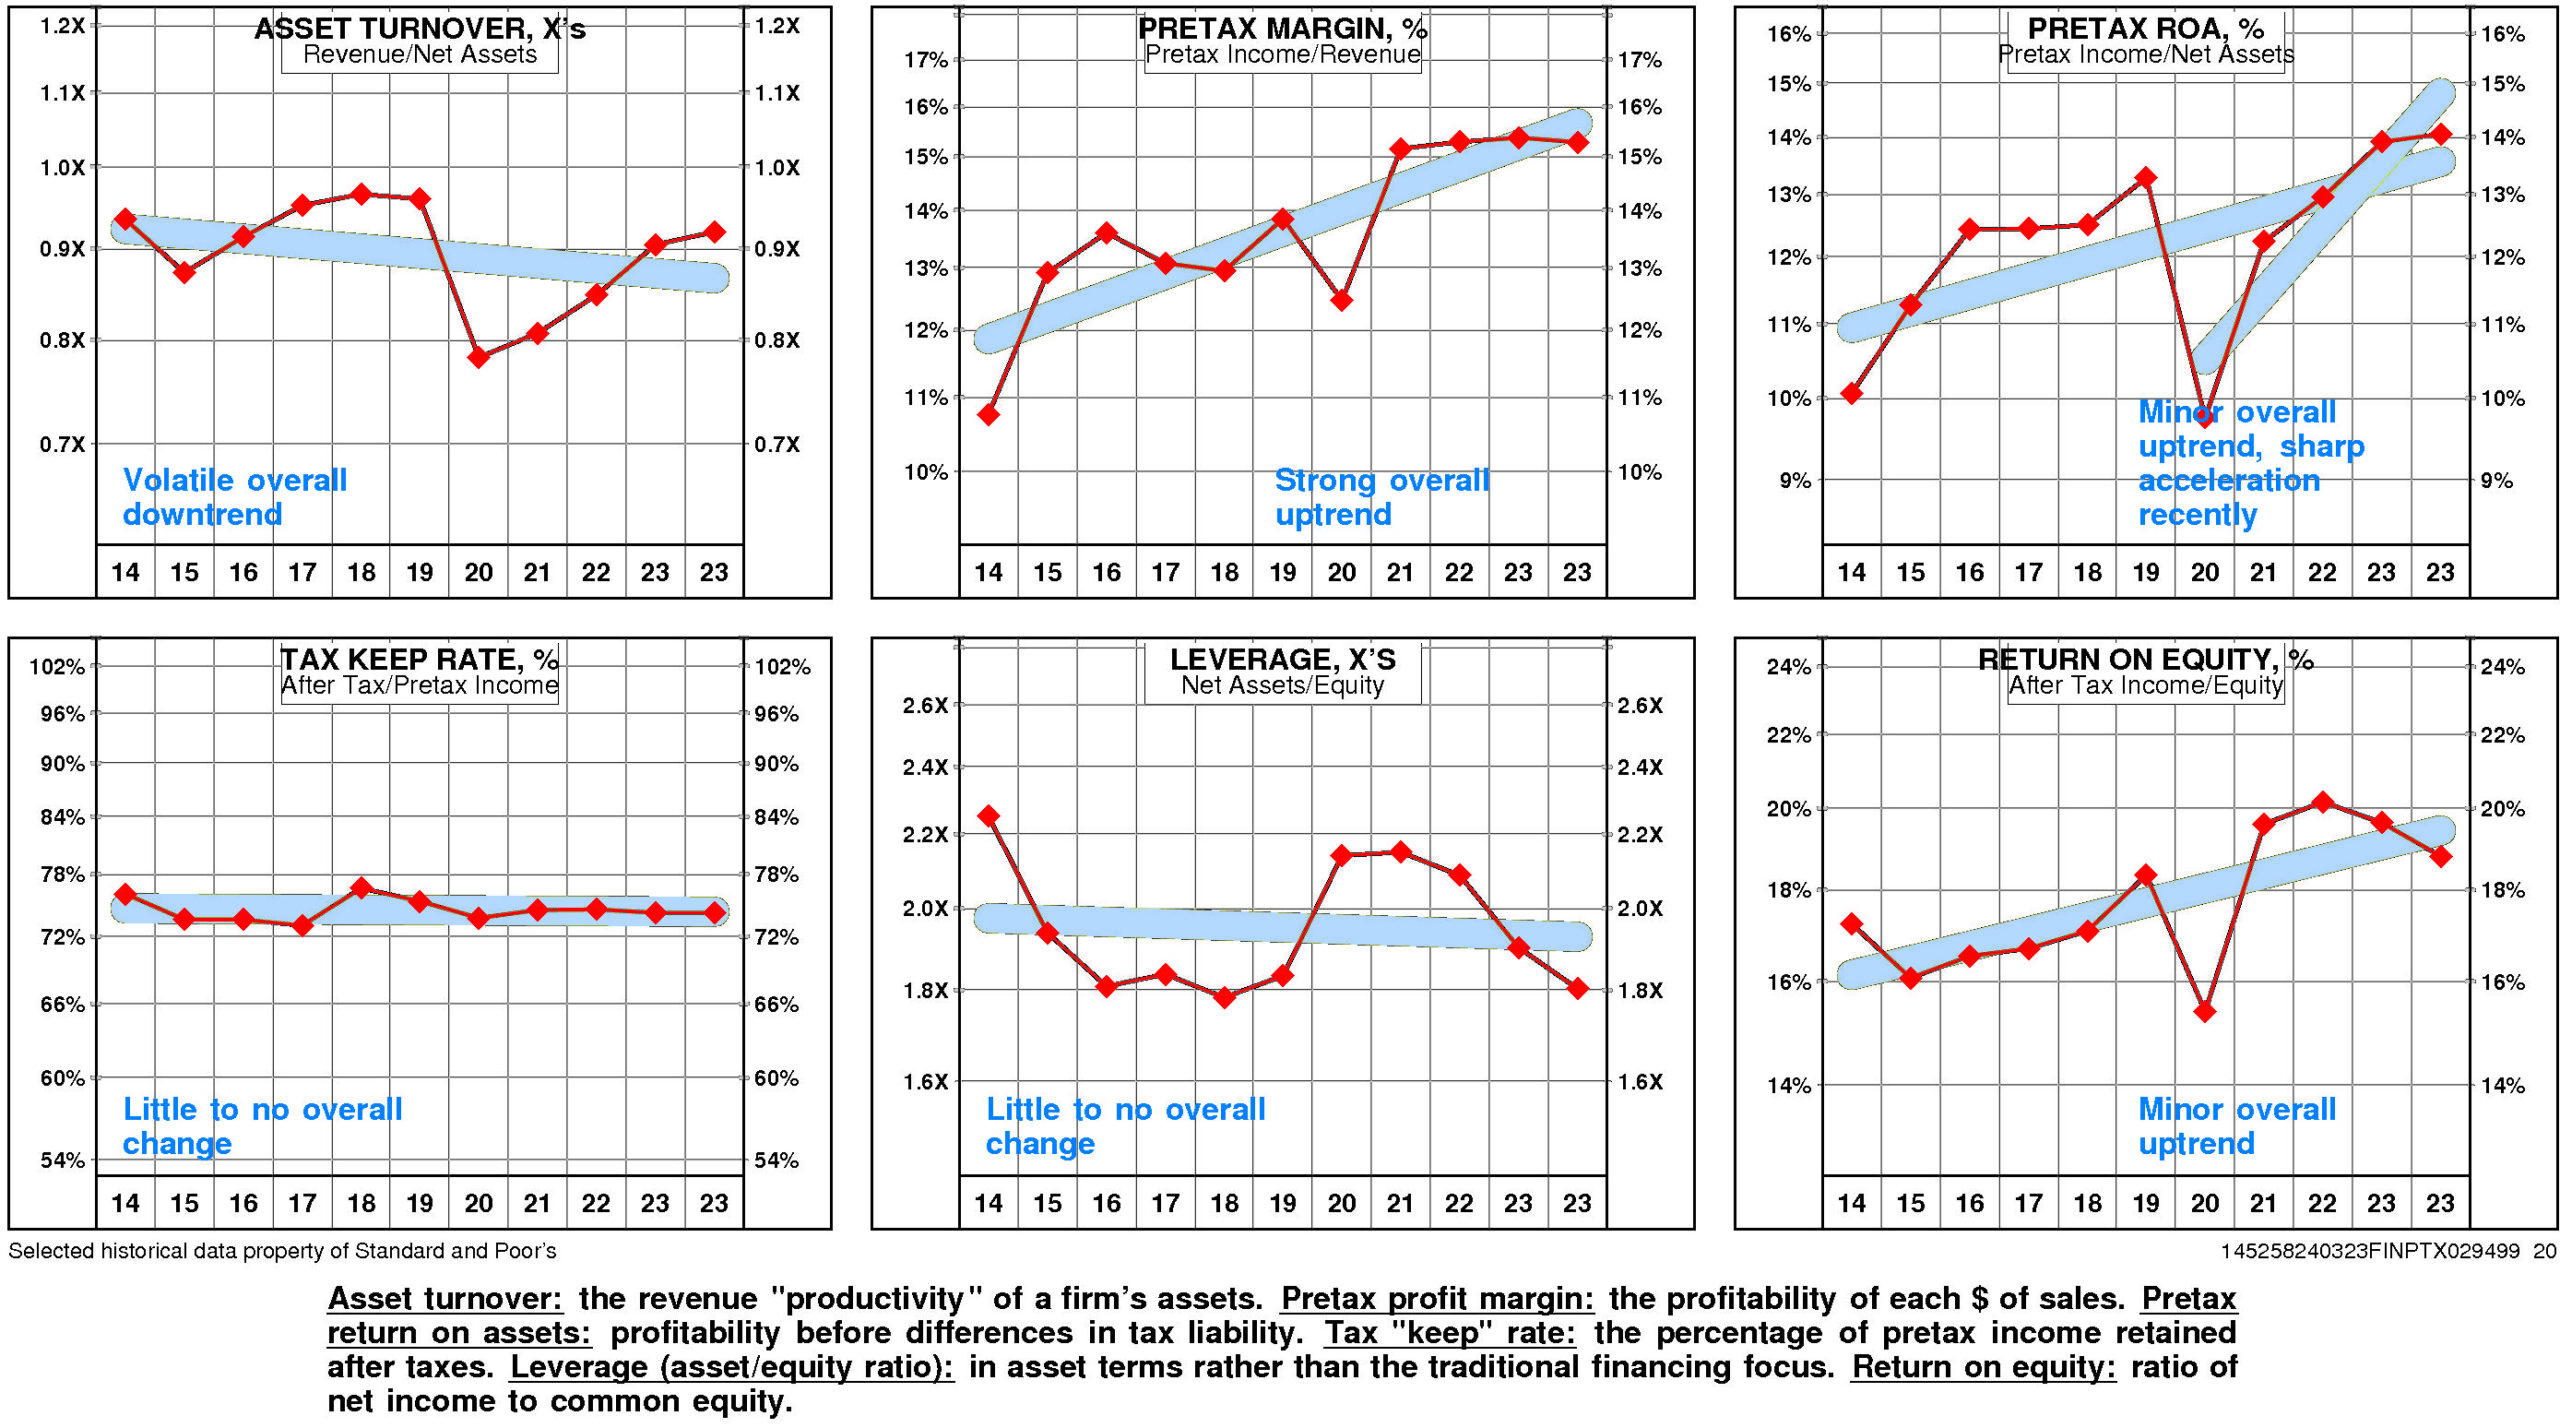
CGI's return on equity is slightly above median (18.8%) for the four quarters ended December, 2023.
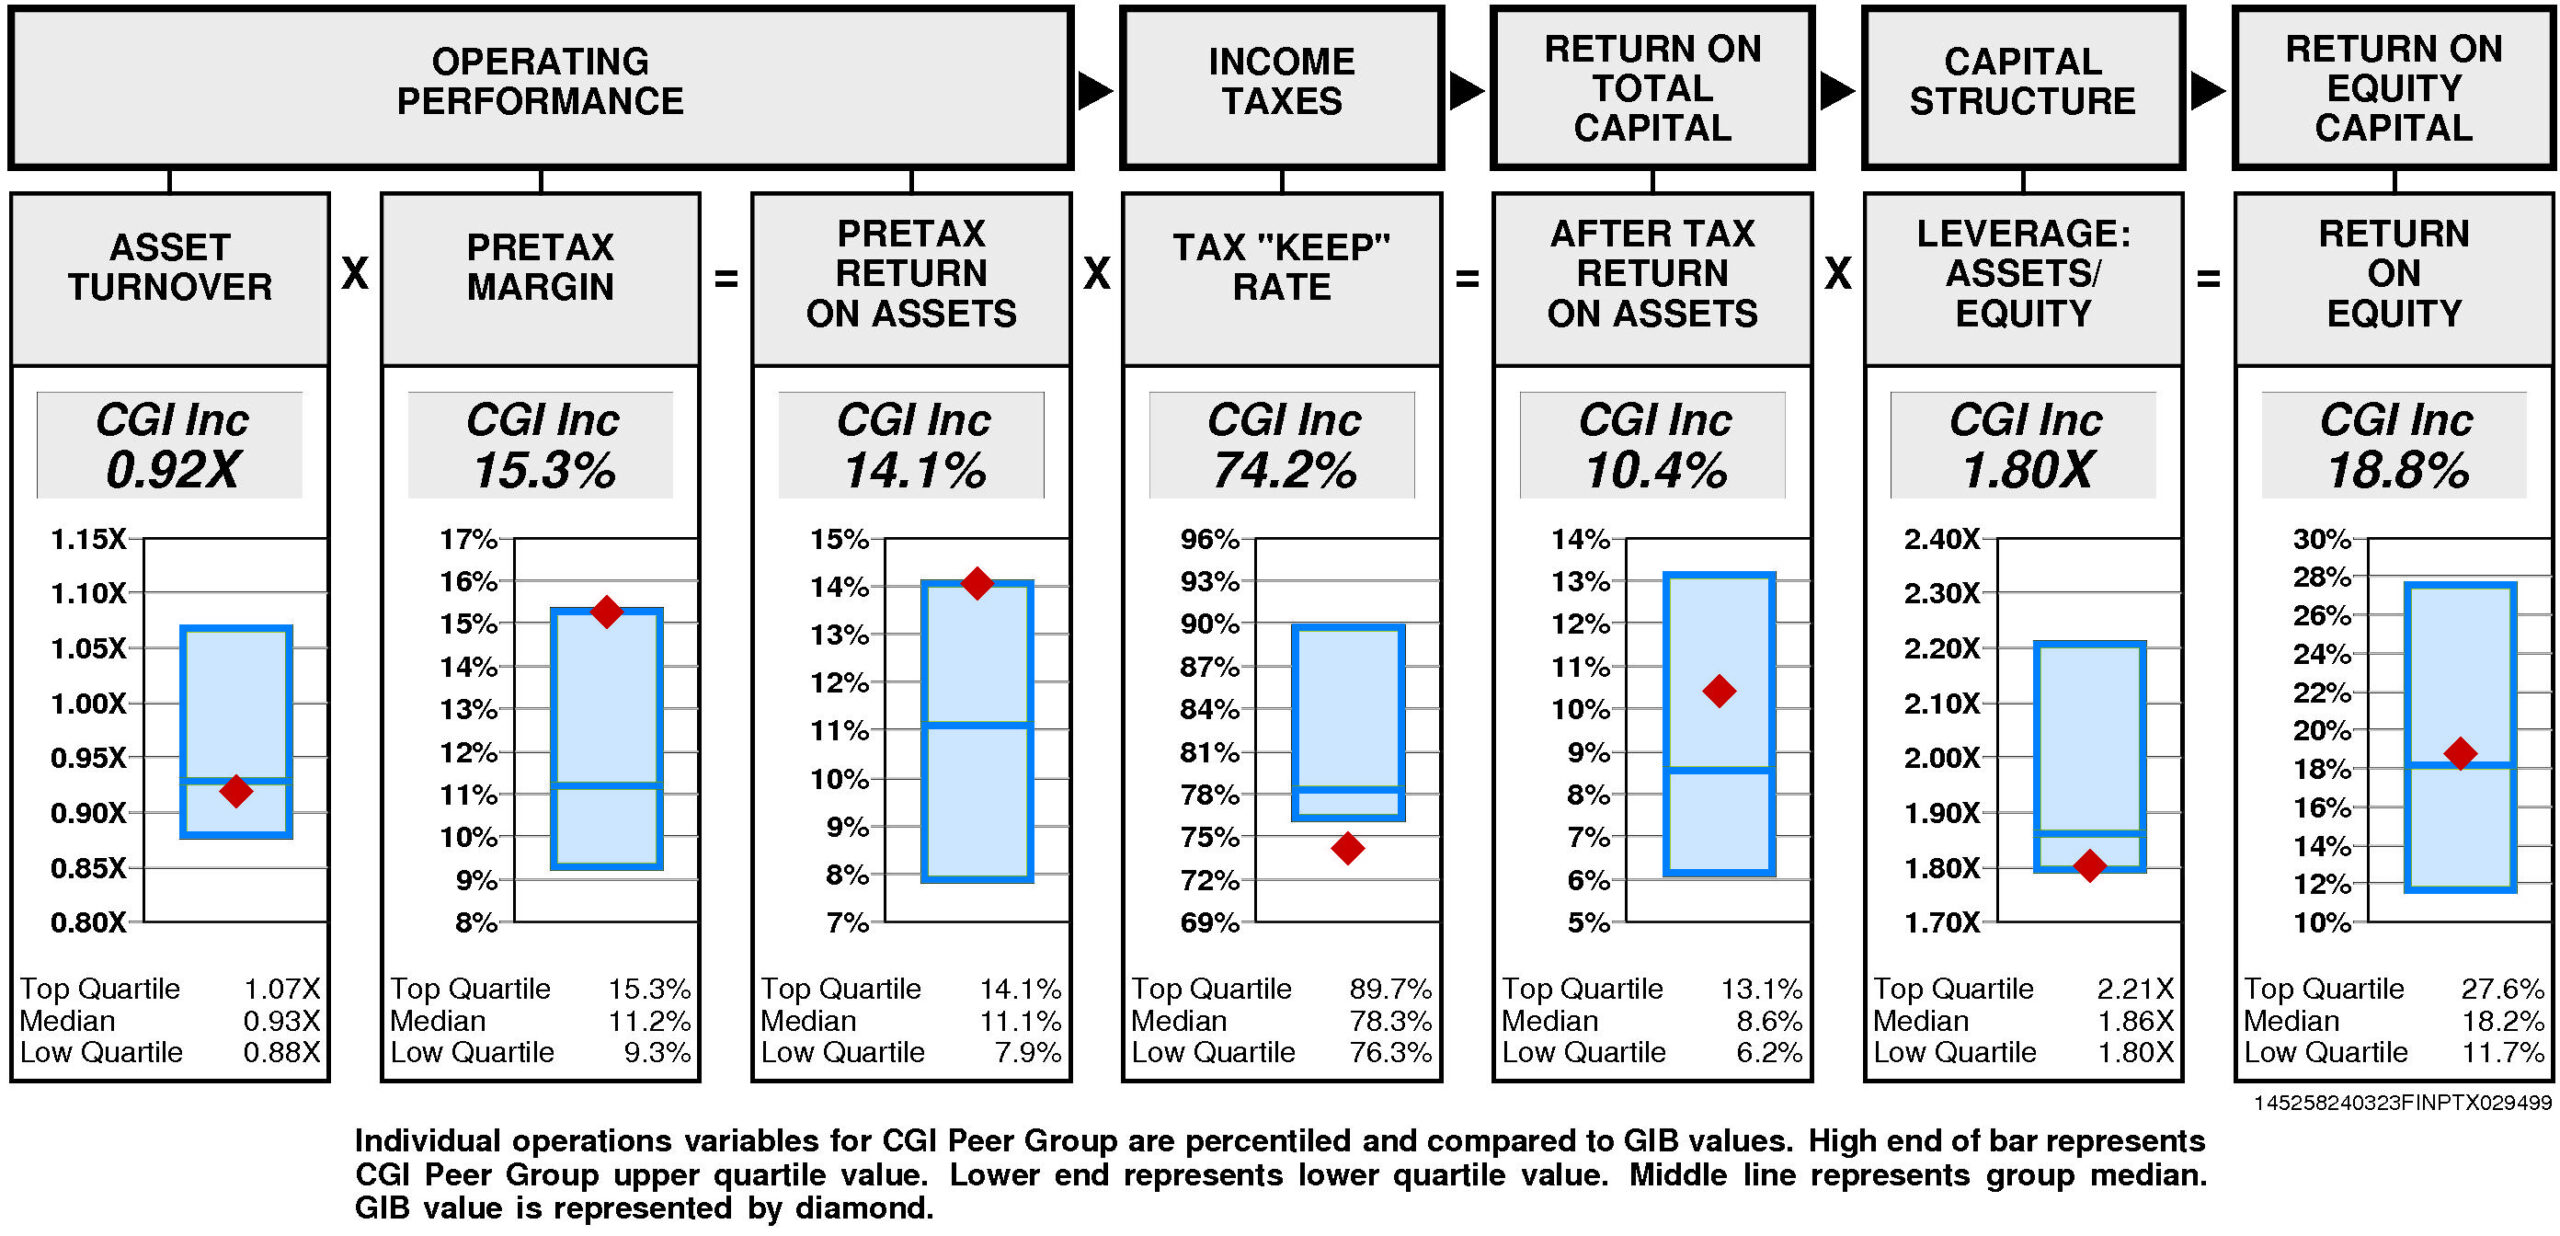
Operating performance (pretax return on assets) is at the upper quartile (14.1%) reflecting asset turnover that is at median (0.92X) and pretax margin at the upper quartile (15.3%).
Tax “keep” rate (income tax management) is lower quartile (74.2%) resulting in after tax return on assets that is above median.
Financial leverage (leverage) is at the lower quartile (1.80X).
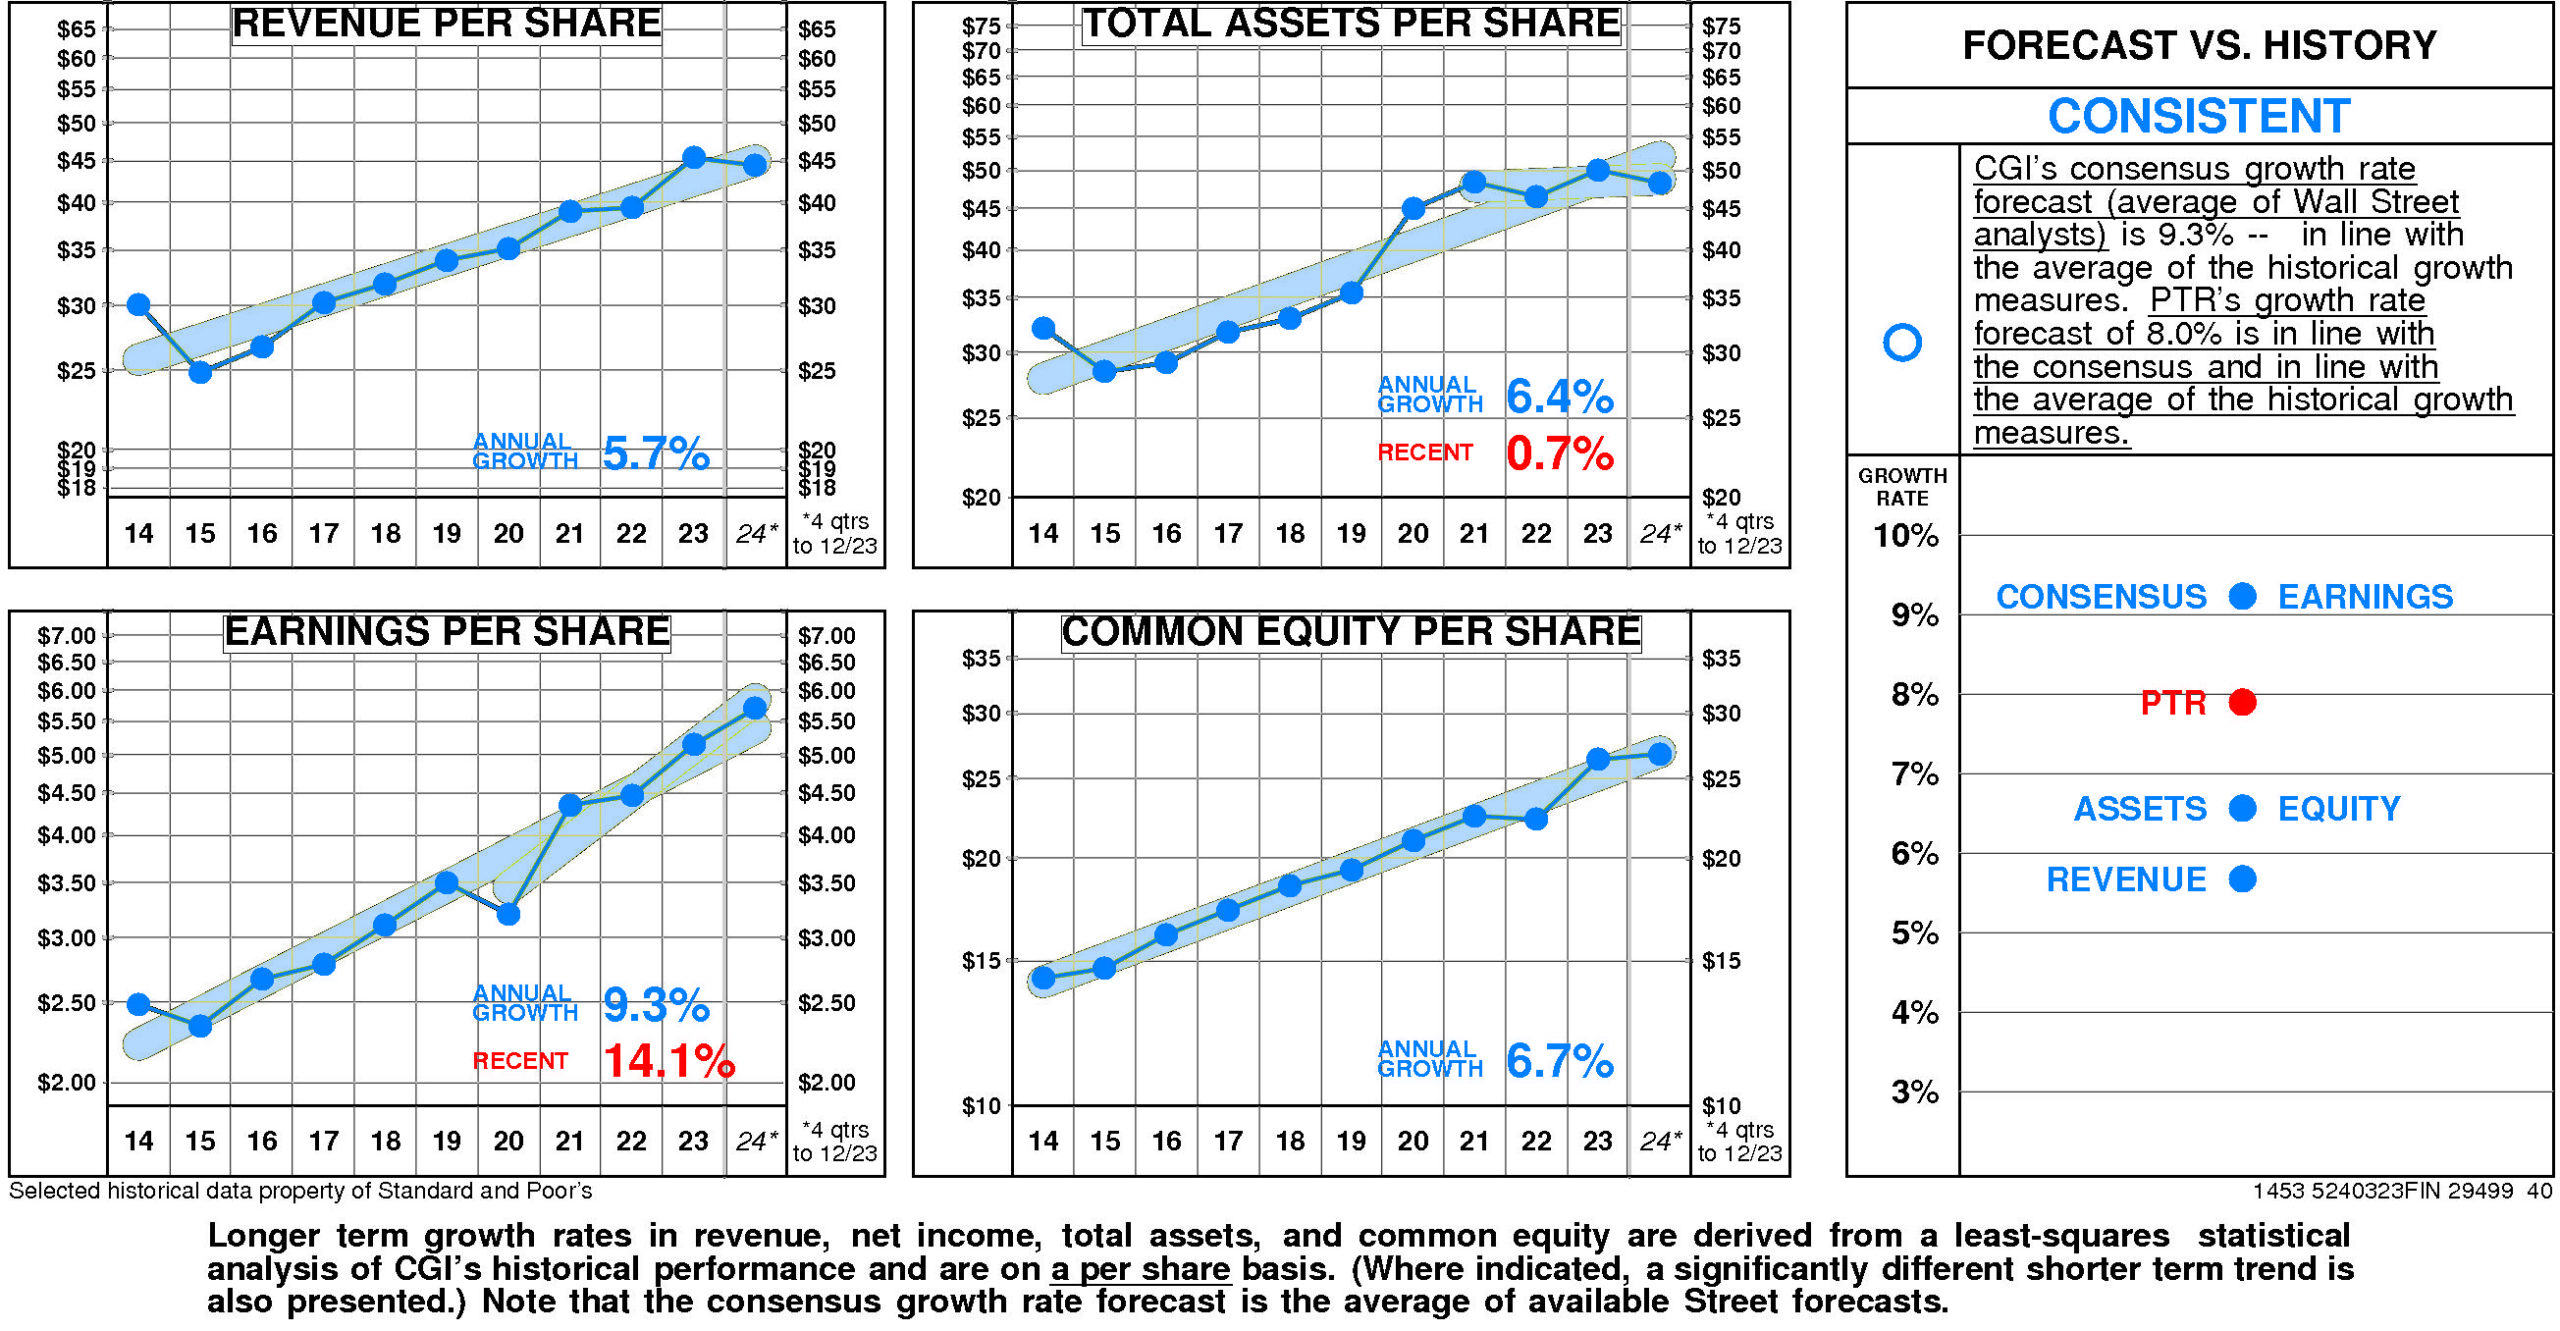
GROWTH RATES
Overall, CGI's growth rate has slowed considerably in recent years.
CGI's historical income statement growth has been in line with balance sheet growth. Revenue growth has paralleled asset growth; earnings growth has paralleled equity growth.
Annual revenue growth
has been 5.7% per year.
Total asset growth
has been 6.4% per year. (More recently it has been 0.7%.)
Annual E.P.S. growth
has been 9.3% per year. (More recently it has been 14.1%.)
Equity growth
has been 6.7% per year.
CGI's consensus growth rate forecast (average of Wall Street analysts)
is 9.3% — in line with the average of the historical growth measures.
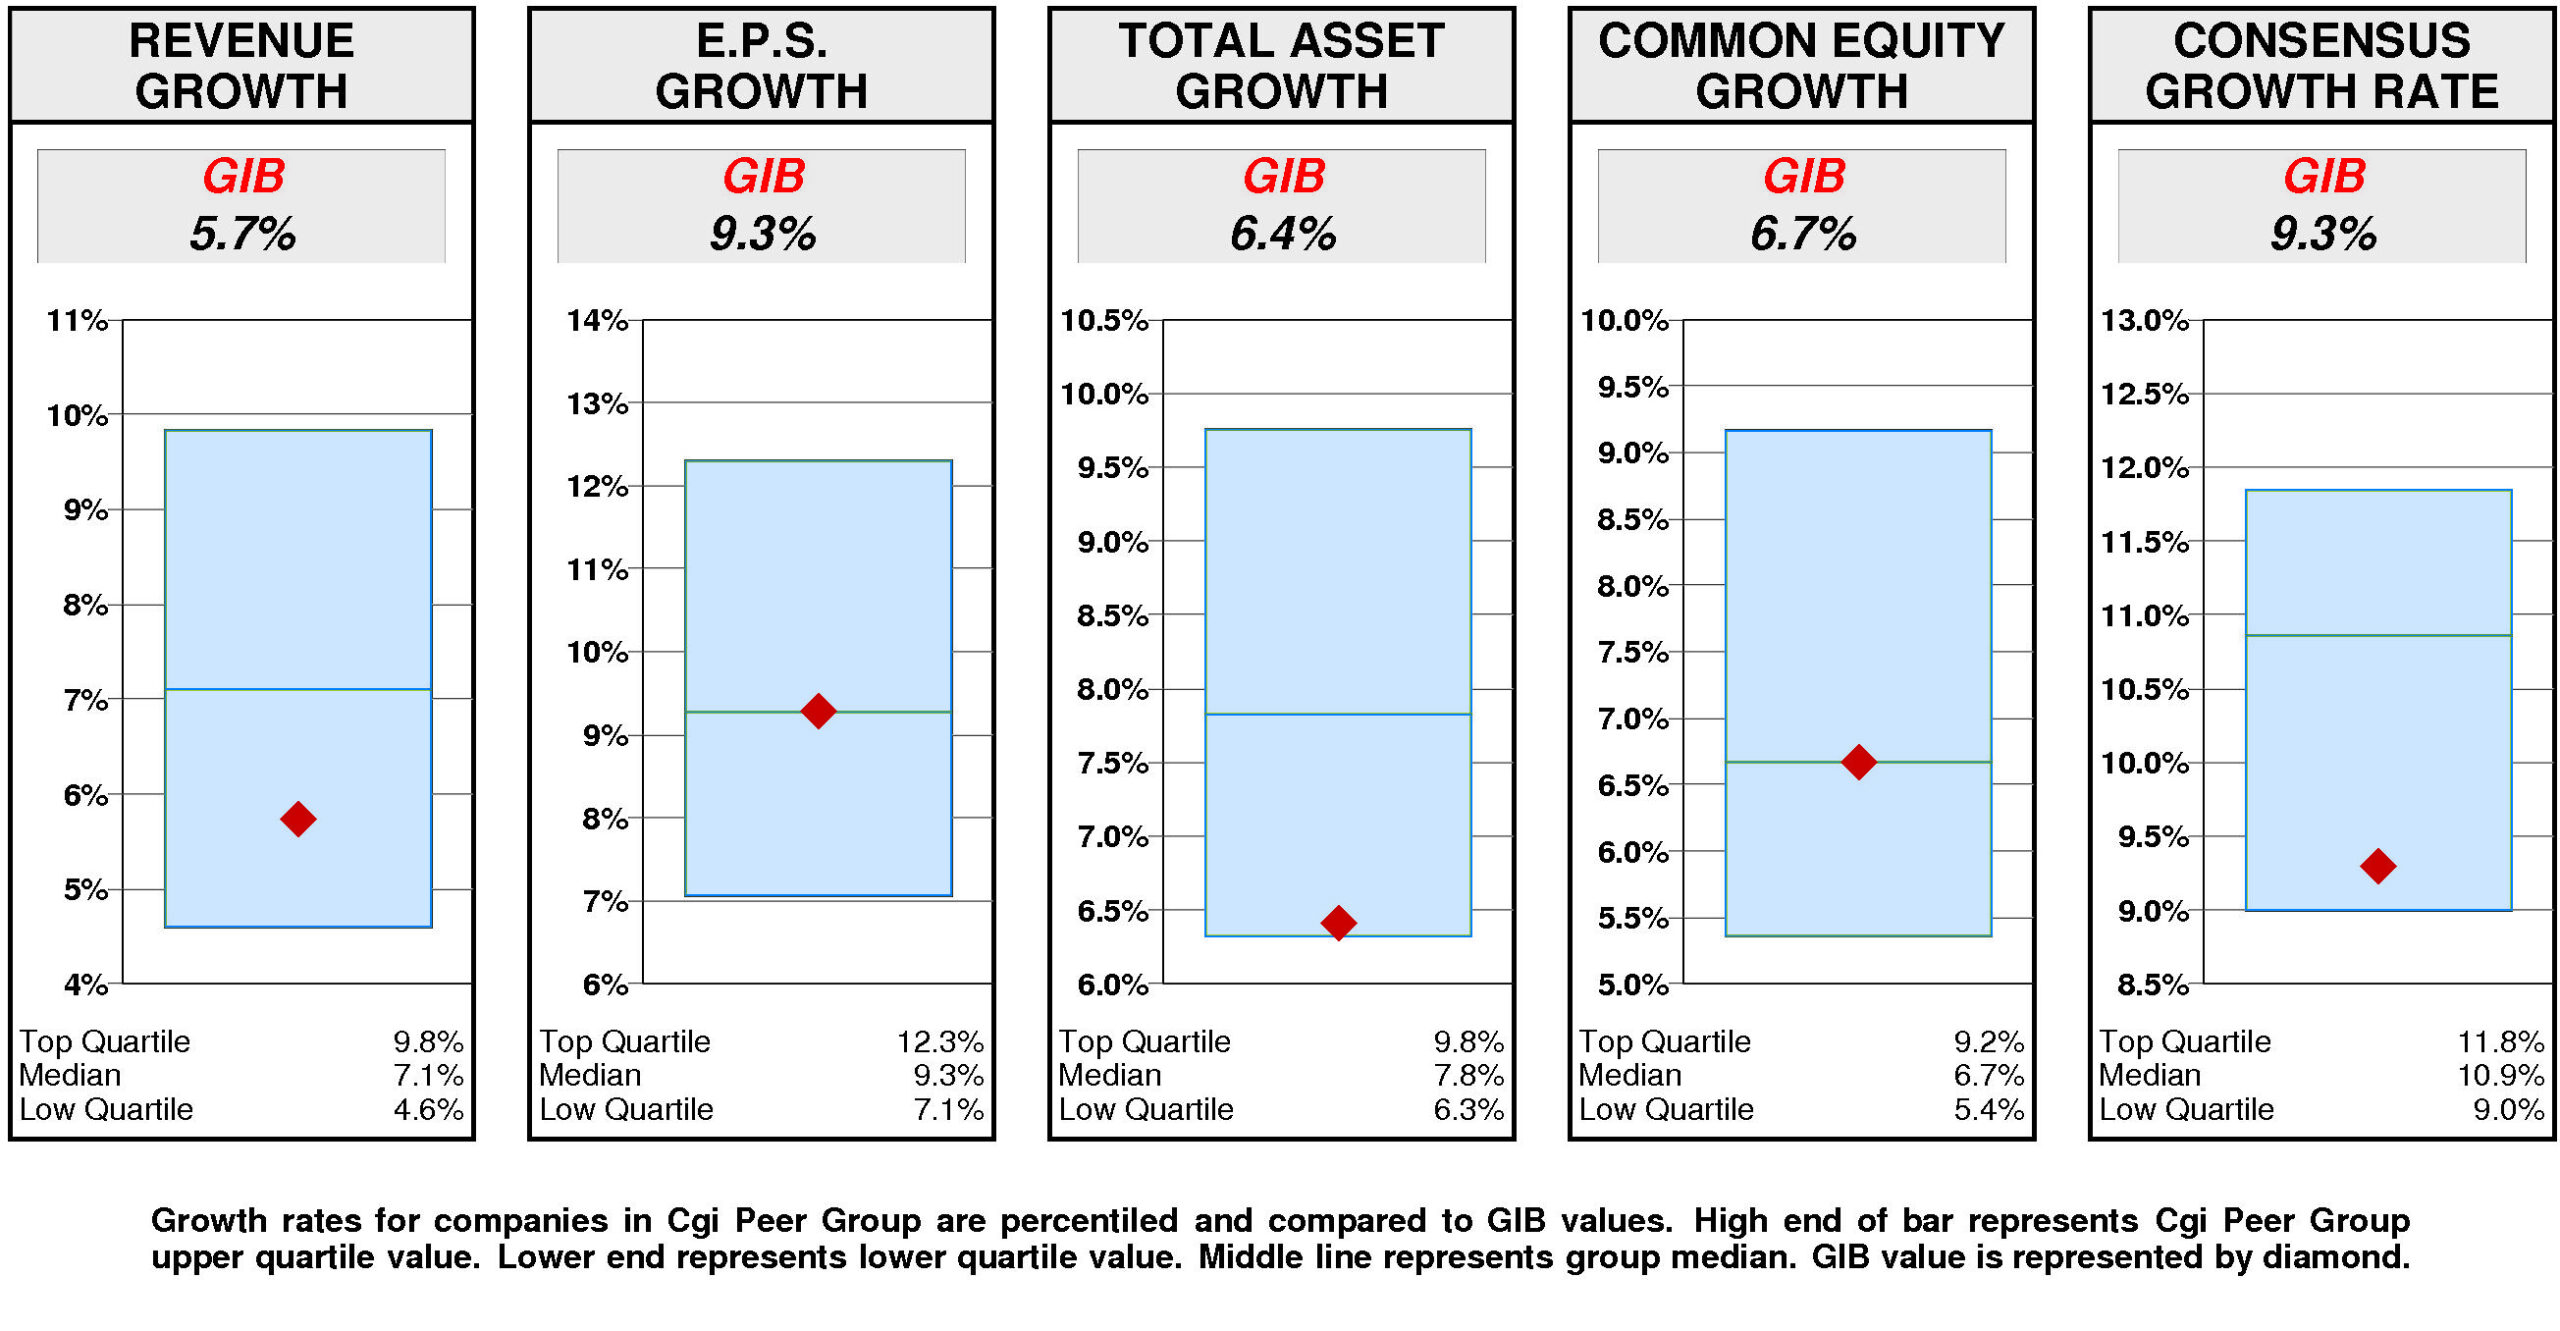
Relative to the Cgi Peer Group, CGI's historical growth measures are erratic.
E.P.S. growth (9.3%) has been at median. Equity growth (6.7%) has been at median. Revenue growth (5.7%) has been below median. Total asset growth (6.4%) has been at the lower quartile.
Consensus growth forecast (9.3%) is substantially below median.
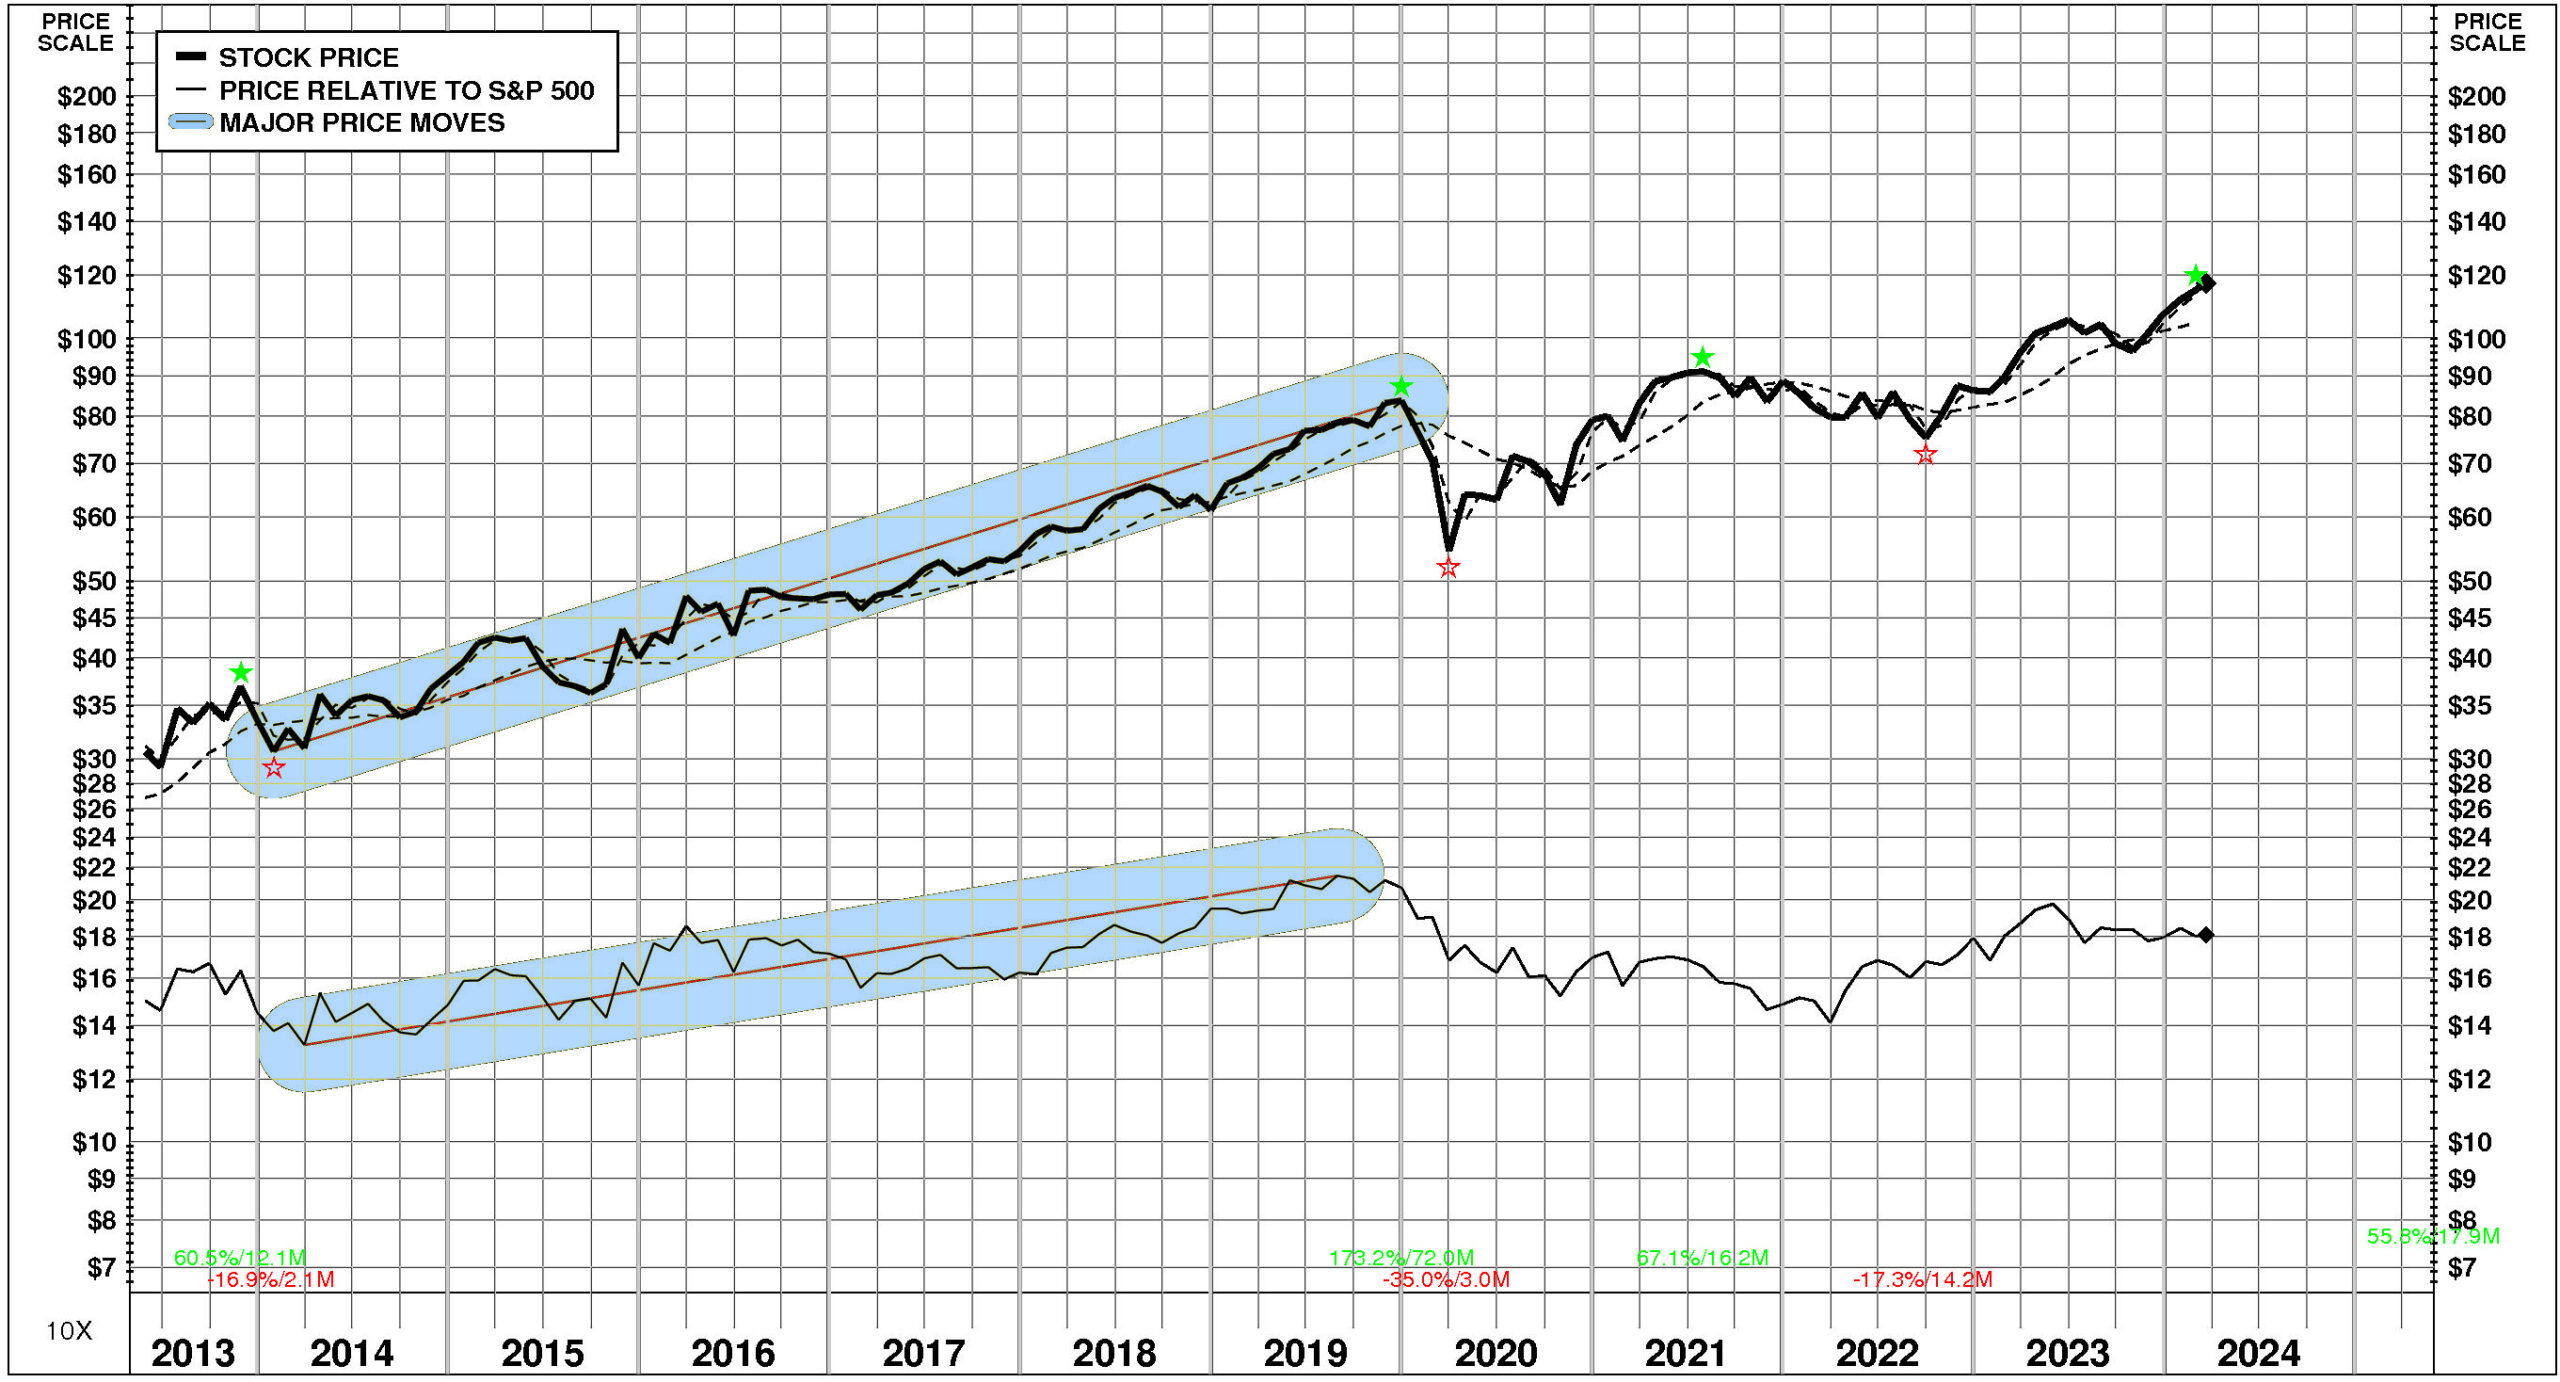
PRICE HISTORY
Over the full time period, CGI's stock price performance has been quite good.
Between May, 2013 and March, 2024, CGI's stock price rose +284%; relative to the market, this was a +21% gain. Significant price move during the period: 1) January, 2014 – December, 2019: +173%.
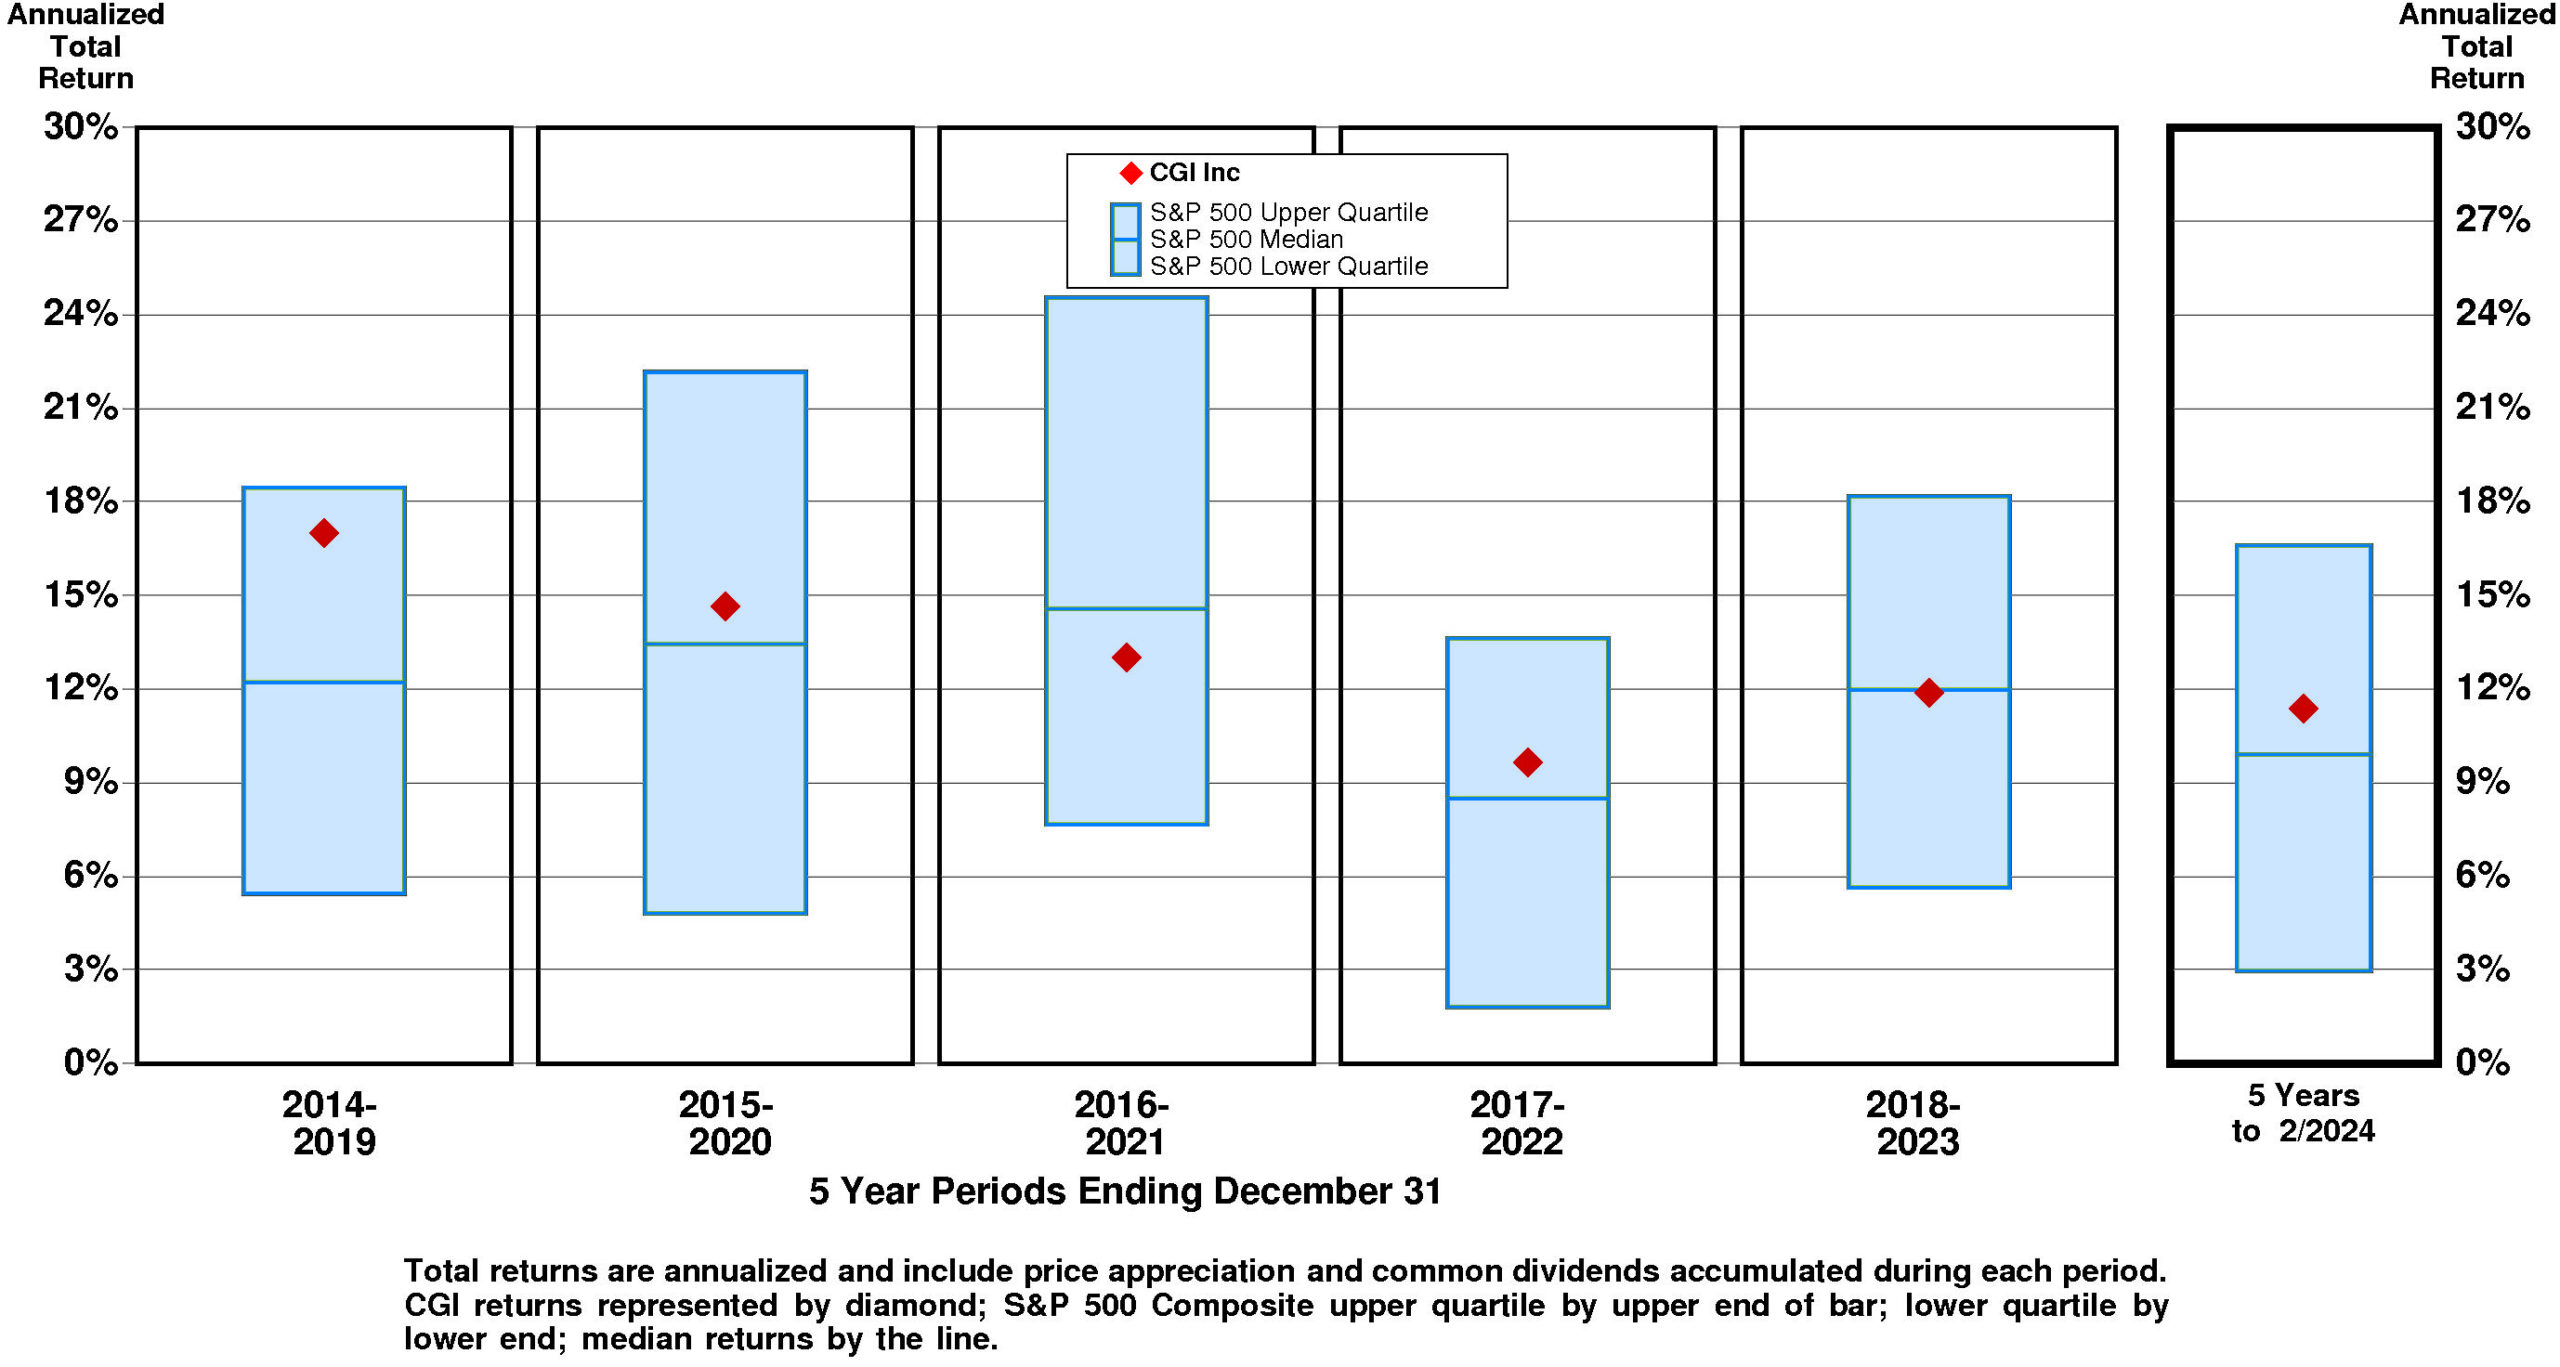
TOTAL INVESTMENT RETURNS
Current annual total return performance of 28.1% is substantially above median relative to the S&P 500 Composite.
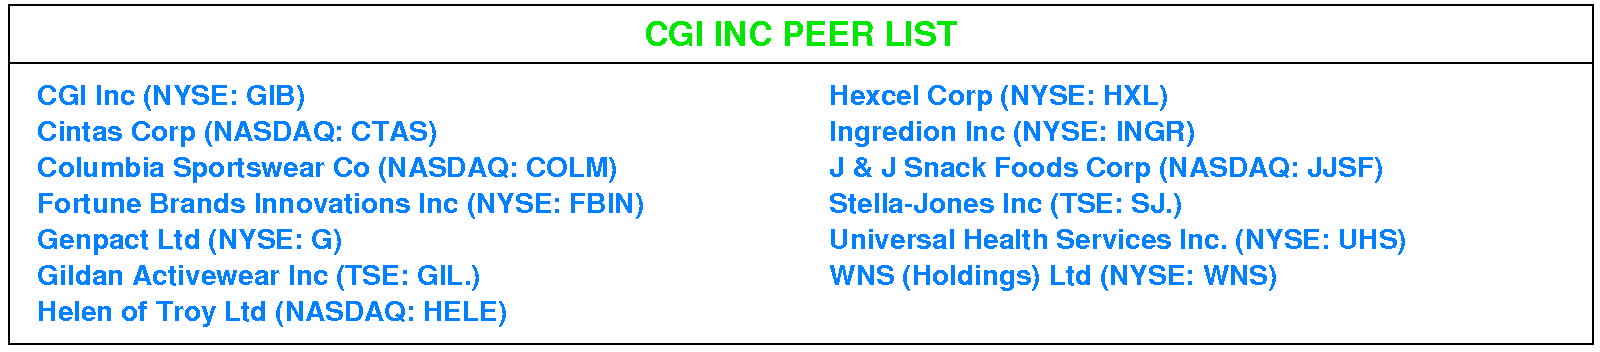
In addition to being substantially above median relative to S&P 500 Composite, current annual total return performance through February, 2024 of 28.1% is substantially above median relative to CGI Inc Peer Group.
Current 5-year total return performance of 11.4% is slightly above median relative to the S&P 500 Composite.
Through February, 2024, with slightly above median current 5-year total return of 11.4% relative to S&P 500 Composite, CGI's total return performance is above median relative to CGI Inc Peer Group.
VALUATION BENCHMARKS
Relative to S&P 500 Composite, GIB's overall valuation is normal.
The highest factor, the ratio of enterprise value/assets, is above median. Price/equity ratio is slightly above median. Price/earnings ratio is below median. Ratio of enterprise value/earnings before interest and taxes is at the lower quartile. The lowest factor, the ratio of enterprise value/revenue, is near the lower quartile.
Relative to CGI Peer Group, GIB's overall valuation is high.
The highest factor, the ratio of enterprise value/revenue, is above median. Price/equity ratio is at the upper quartile. Price/earnings ratio is slightly above median. Ratio of enterprise value/assets is at the upper quartile. The lowest factor, the ratio of enterprise value/earnings before interest and taxes, is slightly above median.
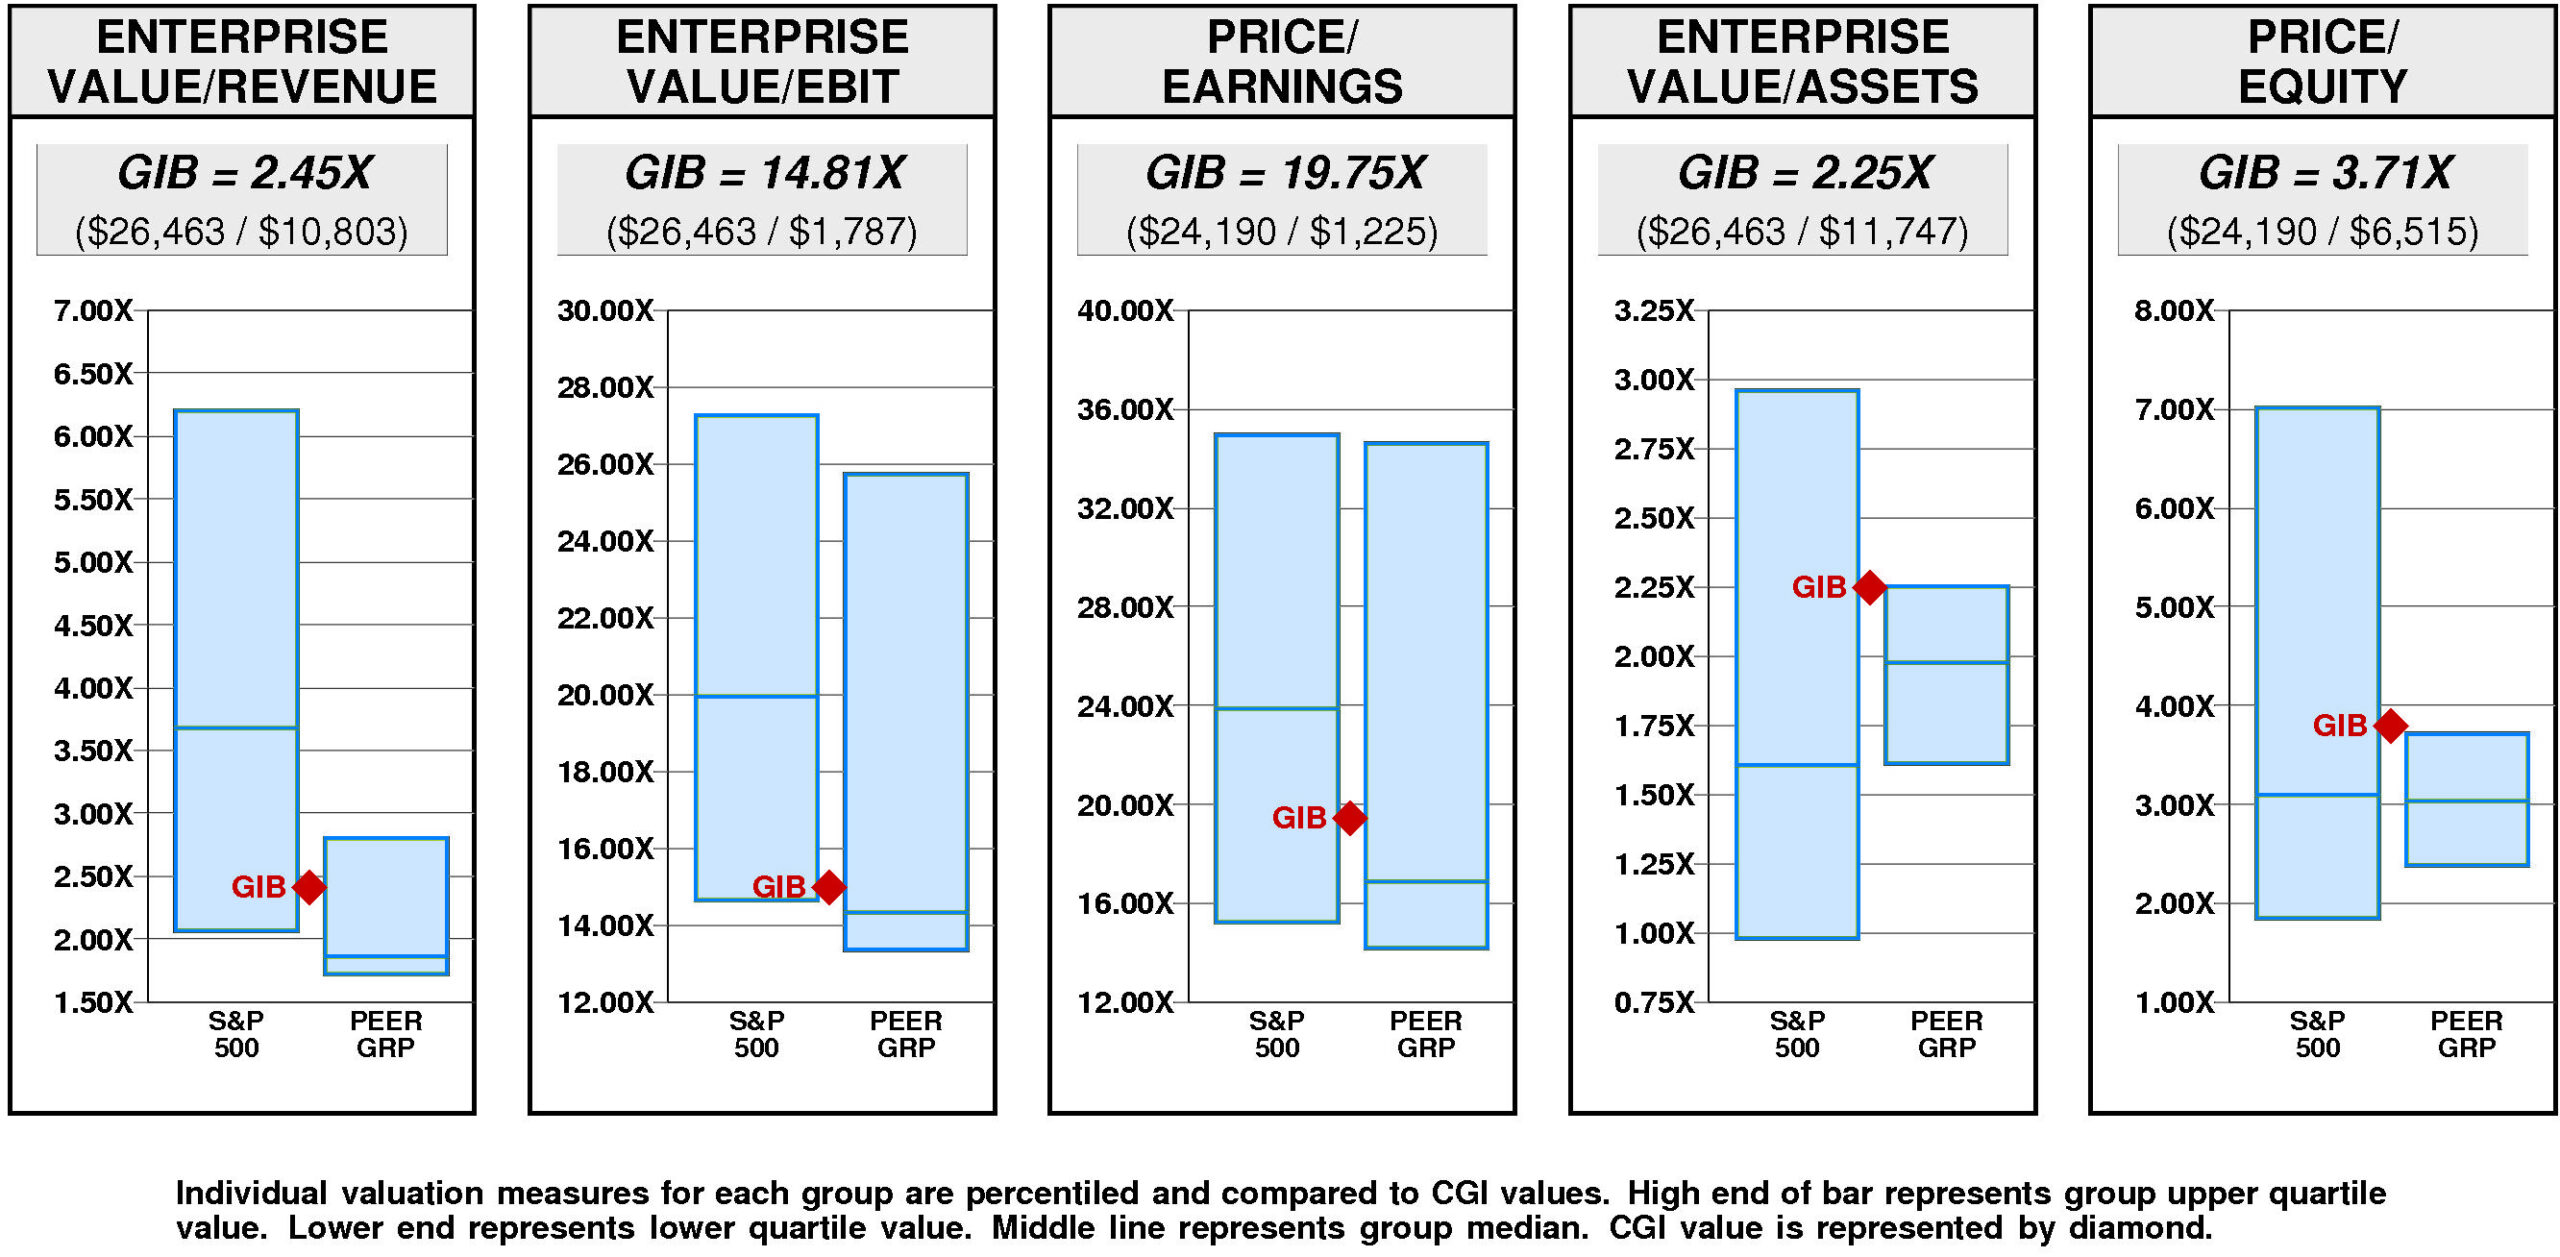
CGI has a very large value gap compared to the median.
For GIB to achieve median valuation, its current ratio of enterprise value/revenue would have to fall from the current level of 2.45X to 1.86X. If GIB's ratio of enterprise value/revenue were to fall to 1.86X, its stock price would be lower by $-31 to $87.
For GIB to achieve upper quartile valuation relative to the CGI Peer Group, its current ratio of enterprise value/revenue would have to rise from the current level of 2.45X to 2.80X. If GIB's ratio of enterprise value/revenue were to rise to 2.80X, its stock price would increase by $19 from the current level of $117.
VALUE TARGETS
GIB's future returns on capital are forecasted to exceed the cost of capital. Accordingly, the company is expected to continue to be a major Value Builder.
CGI's current Price Target of $97 represents a -17% change from the current price of $117.23.
This low appreciation potential results in an appreciation score of 26 (74% of the universe has greater appreciation potential.)
Notwithstanding this low Appreciation Score of 26, the moderately high Power Rating of 69 results in an Value Trend Rating of C.
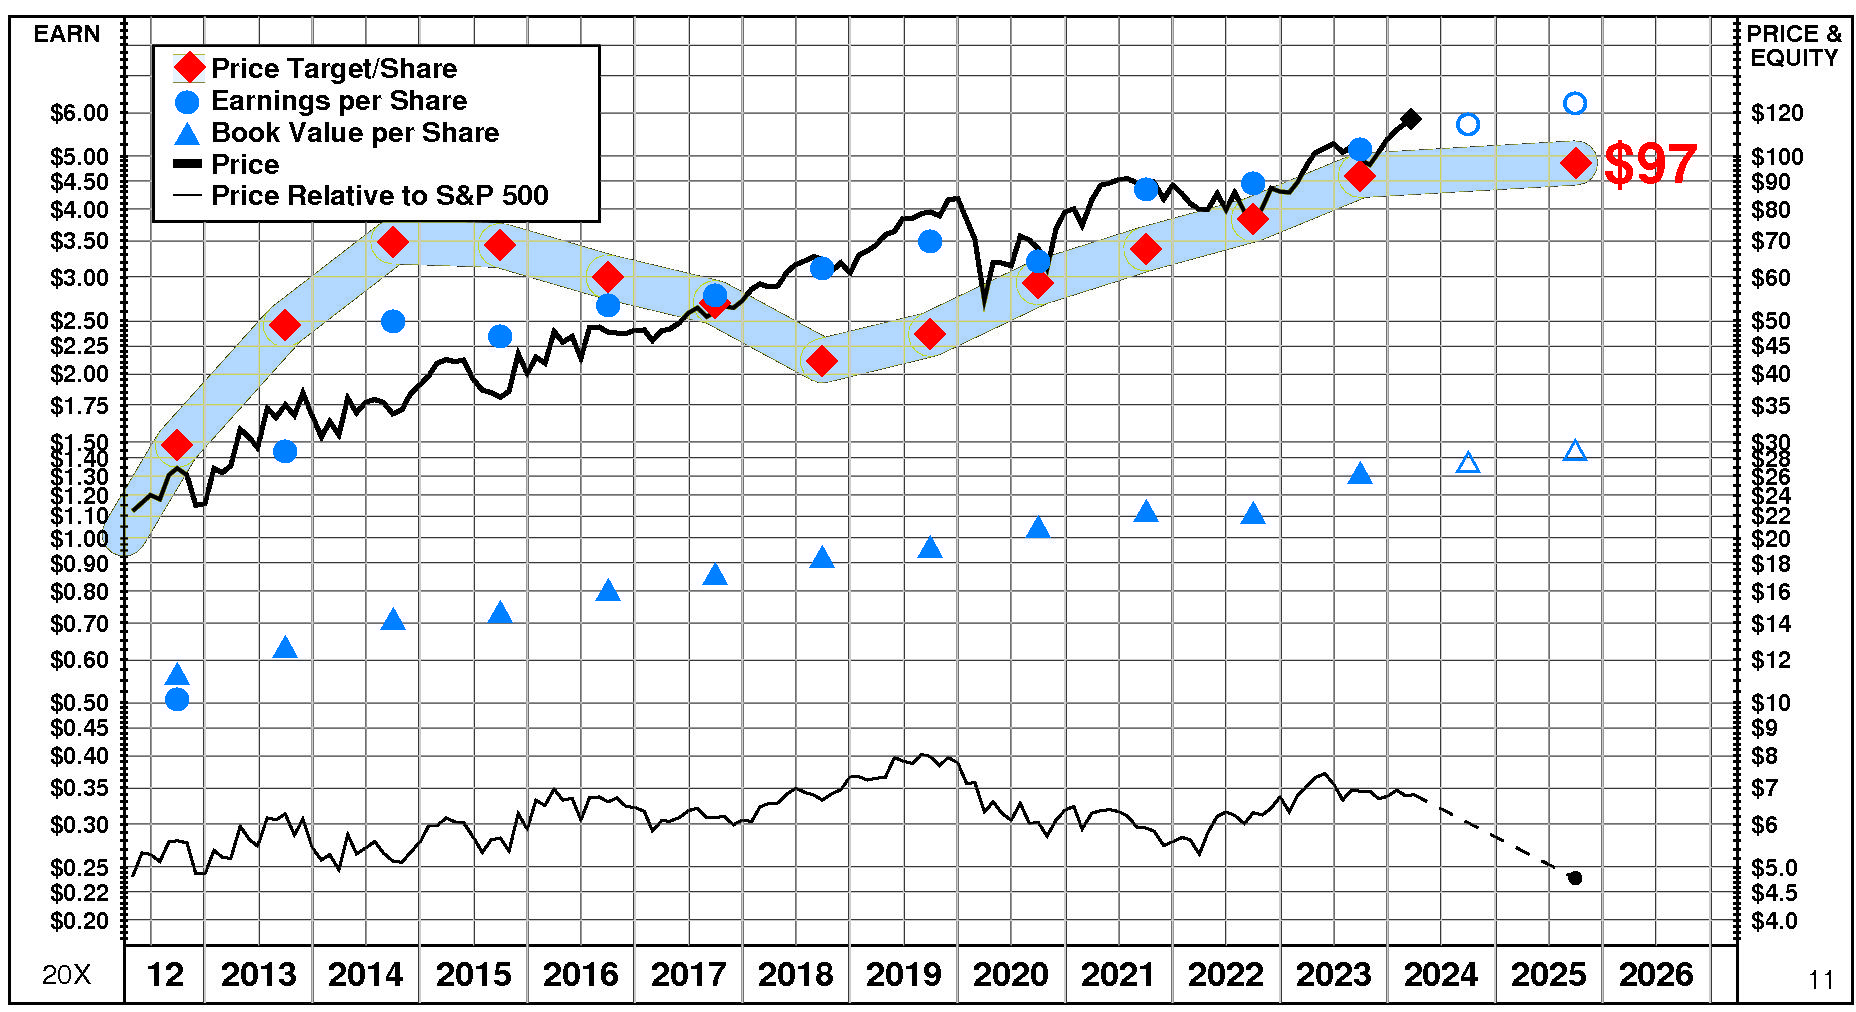
CGI's current Price Target is $97 (+5% from the 2023 Target of $92 but -17% from the 03/19/24 price of $117.23).
This plateau in the Target is the result of a +11% increase in the equity base and a -5% decrease in the price/equity multiple. The forecasted increase in cost of equity has a very large negative impact on the price/equity multiple and the forecasted decline in growth has a slight negative impact as well. Partially offsetting these Drivers, the forecasted increase in return on equity has a very large positive impact.
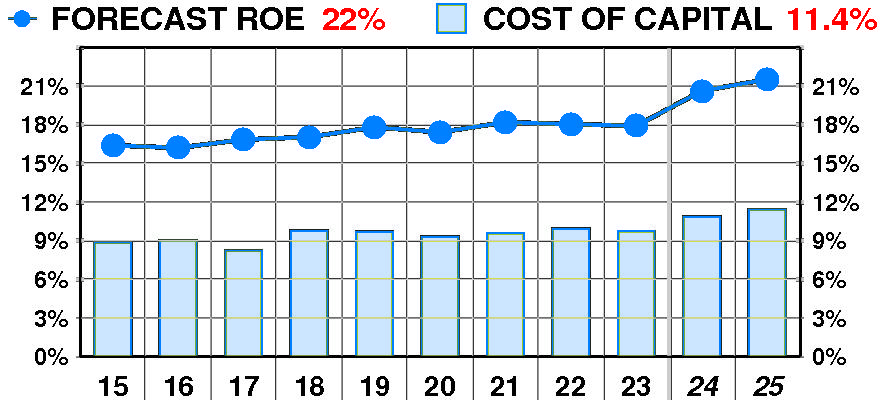
PTR's return on equity forecast is 21.5% — slightly above our recent forecasts.
Forecasted return on equity exhibited a modest, steady increase between 2015 and 2023. The current forecast is well above the 2015 low of 16%.
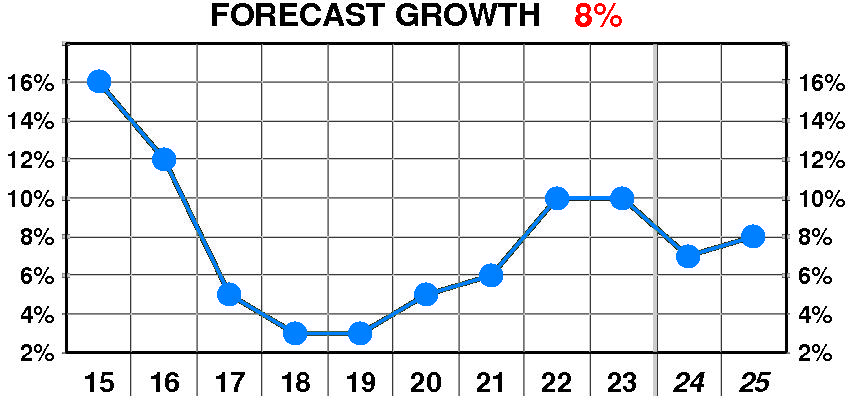
PTR's growth forecast is 8.0% — slightly below our recent forecasts.
Forecasted growth suffered a dramatic, erratic decline between 2015 and 2023. The current forecast is well below the 2015 peak of 16%.
PTR's cost of equity forecast is 11.4% — in line with recent levels.
Forecasted cost of equity exhibited a modest, erratic increase between 2015 and 2023. The current forecast is above the 2017 low of 8.2%.
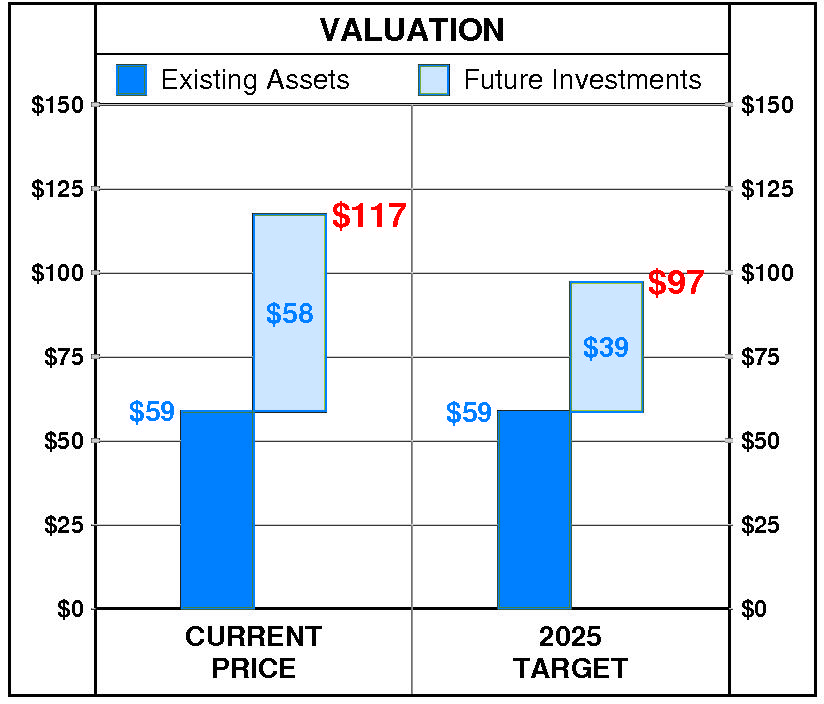
At CGI's current price of $117.23, investors are placing a positive value of $58 on its future investments. This view is consistent with the company's most recent performance that reflected a growth rate of 10.0% per year, and a return on equity of 17.9% versus a cost of equity of 9.7%.
PTR's 2025 Price Target of $97 is based on these forecasts and reflects an estimated value of existing assets of $59 and a value of future investments of $39.