![]()
BUSINESS
Sun Life Financial Inc., a financial services company, provides insurance, wealth, and asset management solutions to individuals and corporate clients worldwide. It offers term and permanent life, as well as personal health, dental, critical illness, long-term care, and disability insurance products. The company also provides reinsurance products; investment counselling and portfolio management services; mutual funds and segregated funds; trust and banking services; real estate property brokerage and appraisal services; and merchant banking services. It distributes its products through direct sales agents, managing and independent general agents, financial intermediaries, broker-dealers, banks, pension and benefits consultants, and other third-party marketing organizations. The company was founded in 1871 and is headquartered in Toronto, Canada.

INVESTMENT RATING

SLF’s future returns on capital are forecasted to exceed the cost of capital. Accordingly, the company is expected to continue to be a major Value Builder.
Sun Life Financial has a current Value Trend Rating of C (High Neutral).
The Value Trend Rating reflects contradictory signals from PTR’s two proprietary measures of a stock’s attractiveness. Sun Life Financial has a slightly negative Appreciation Score of 38 but a good Power Rating of 80, with the High Neutral Value Trend Rating the result.
Sun Life Financial’s stock is selling below targeted value. The current stock price of $54.61 compares to targeted value 12 months forward of $61.
This moderately low appreciation potential results in an appreciation score of 38 (62% of the universe has greater appreciation potential.)

Sun Life Financial has a Power Rating of 80. (This good Power Rating indicates that SLF has a better chance of achieving attractive investment performance over the near to intermediate term than all but 20% of companies in the universe.)
Factors contributing to this good Power Rating include: the recent trend in SLF’s earnings estimates has been extremely favorable; the Life Insurance comparison group is in an extremely strong phase currently; and recent price action has been slightly favorable.
INVESTMENT PROFILE
SLF’s financial strength is high. Financial strength rating is 78.
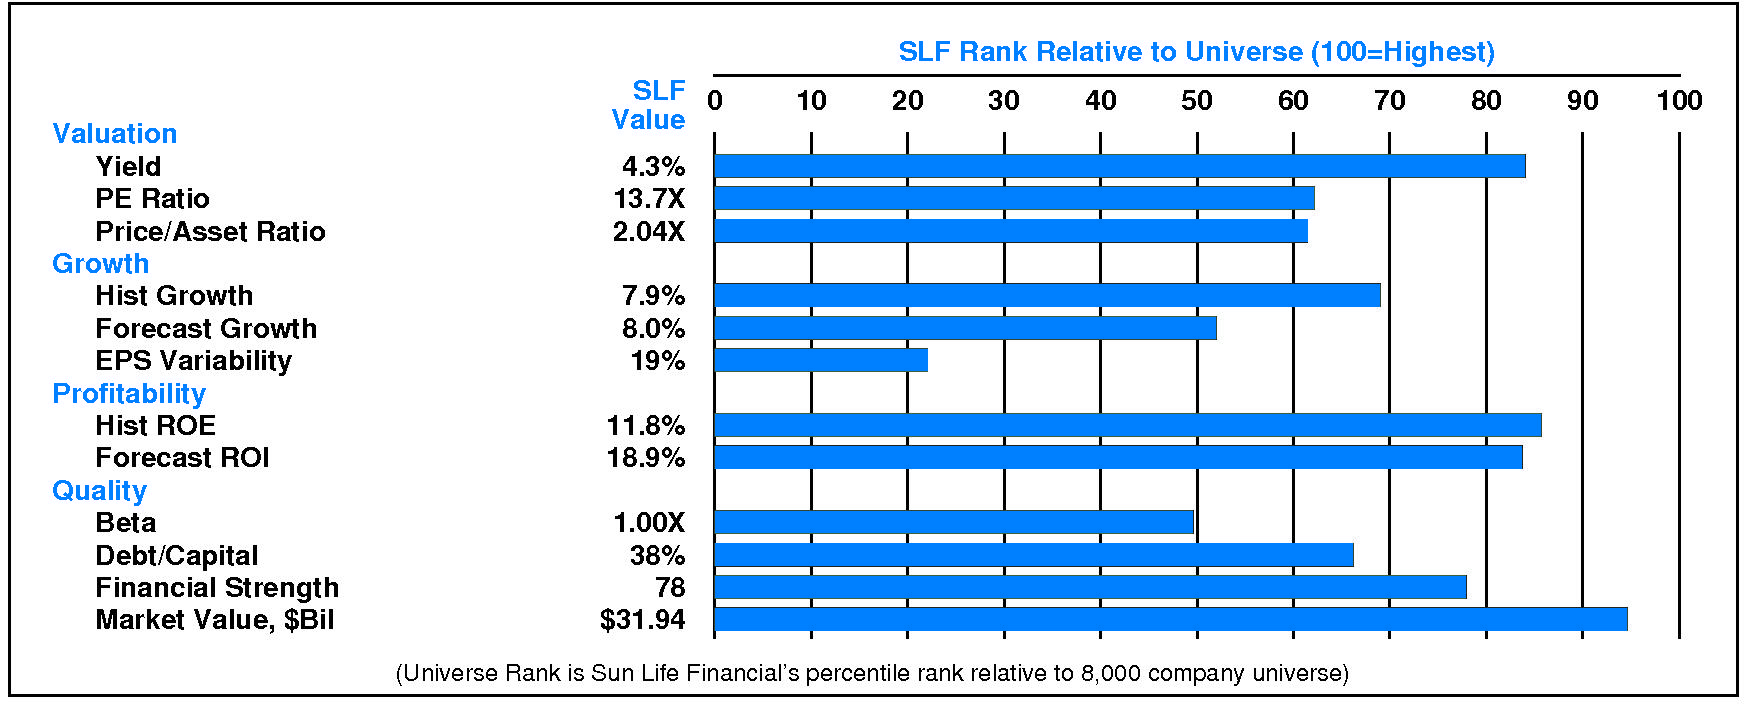
Relative to the S&P 500 Composite, Sun Life Financial Inc has neutral Growth/Value characteristics; its appeal is likely to be to Income-oriented investors; the perception is that SLF is lower risk. The only positive is SLF low earnings variability. SLF’s valuation is low: high dividend yield, low P/E ratio, and low price/book ratio. SLF has normal market capitalization.
CURRENT SIGNALS
Sun Life Financial’s current operations are strong. Return on equity is rising, reflecting: improving asset utilization; and rising tax keep rate.
Sun Life Financial’s current technical position is very strong. The stock price is in a 16.6 month up move. The stock has appreciated 39.6% from its prior low. The stock price is above its 200 day moving average which is in an uptrend.
ALERTS
Recent meaningful positive changes in fundamentals have benefitted Sun Life Financial Inc (NYSE: SLF): significant quarterly earnings acceleration occurred, and significant quarterly sales acceleration occurred.
The stock is currently rated C.
On 3/19/24, Sun Life Financial Inc (NYSE: SLF) stock rose slightly by 0.1%, closing at $54.61. However, this advance was accompanied by exceptionally low trading volume at 36% of normal. Relative to the market the stock has been strong over the last nine months but has declined -0.6% during the last week.
CASH FLOW
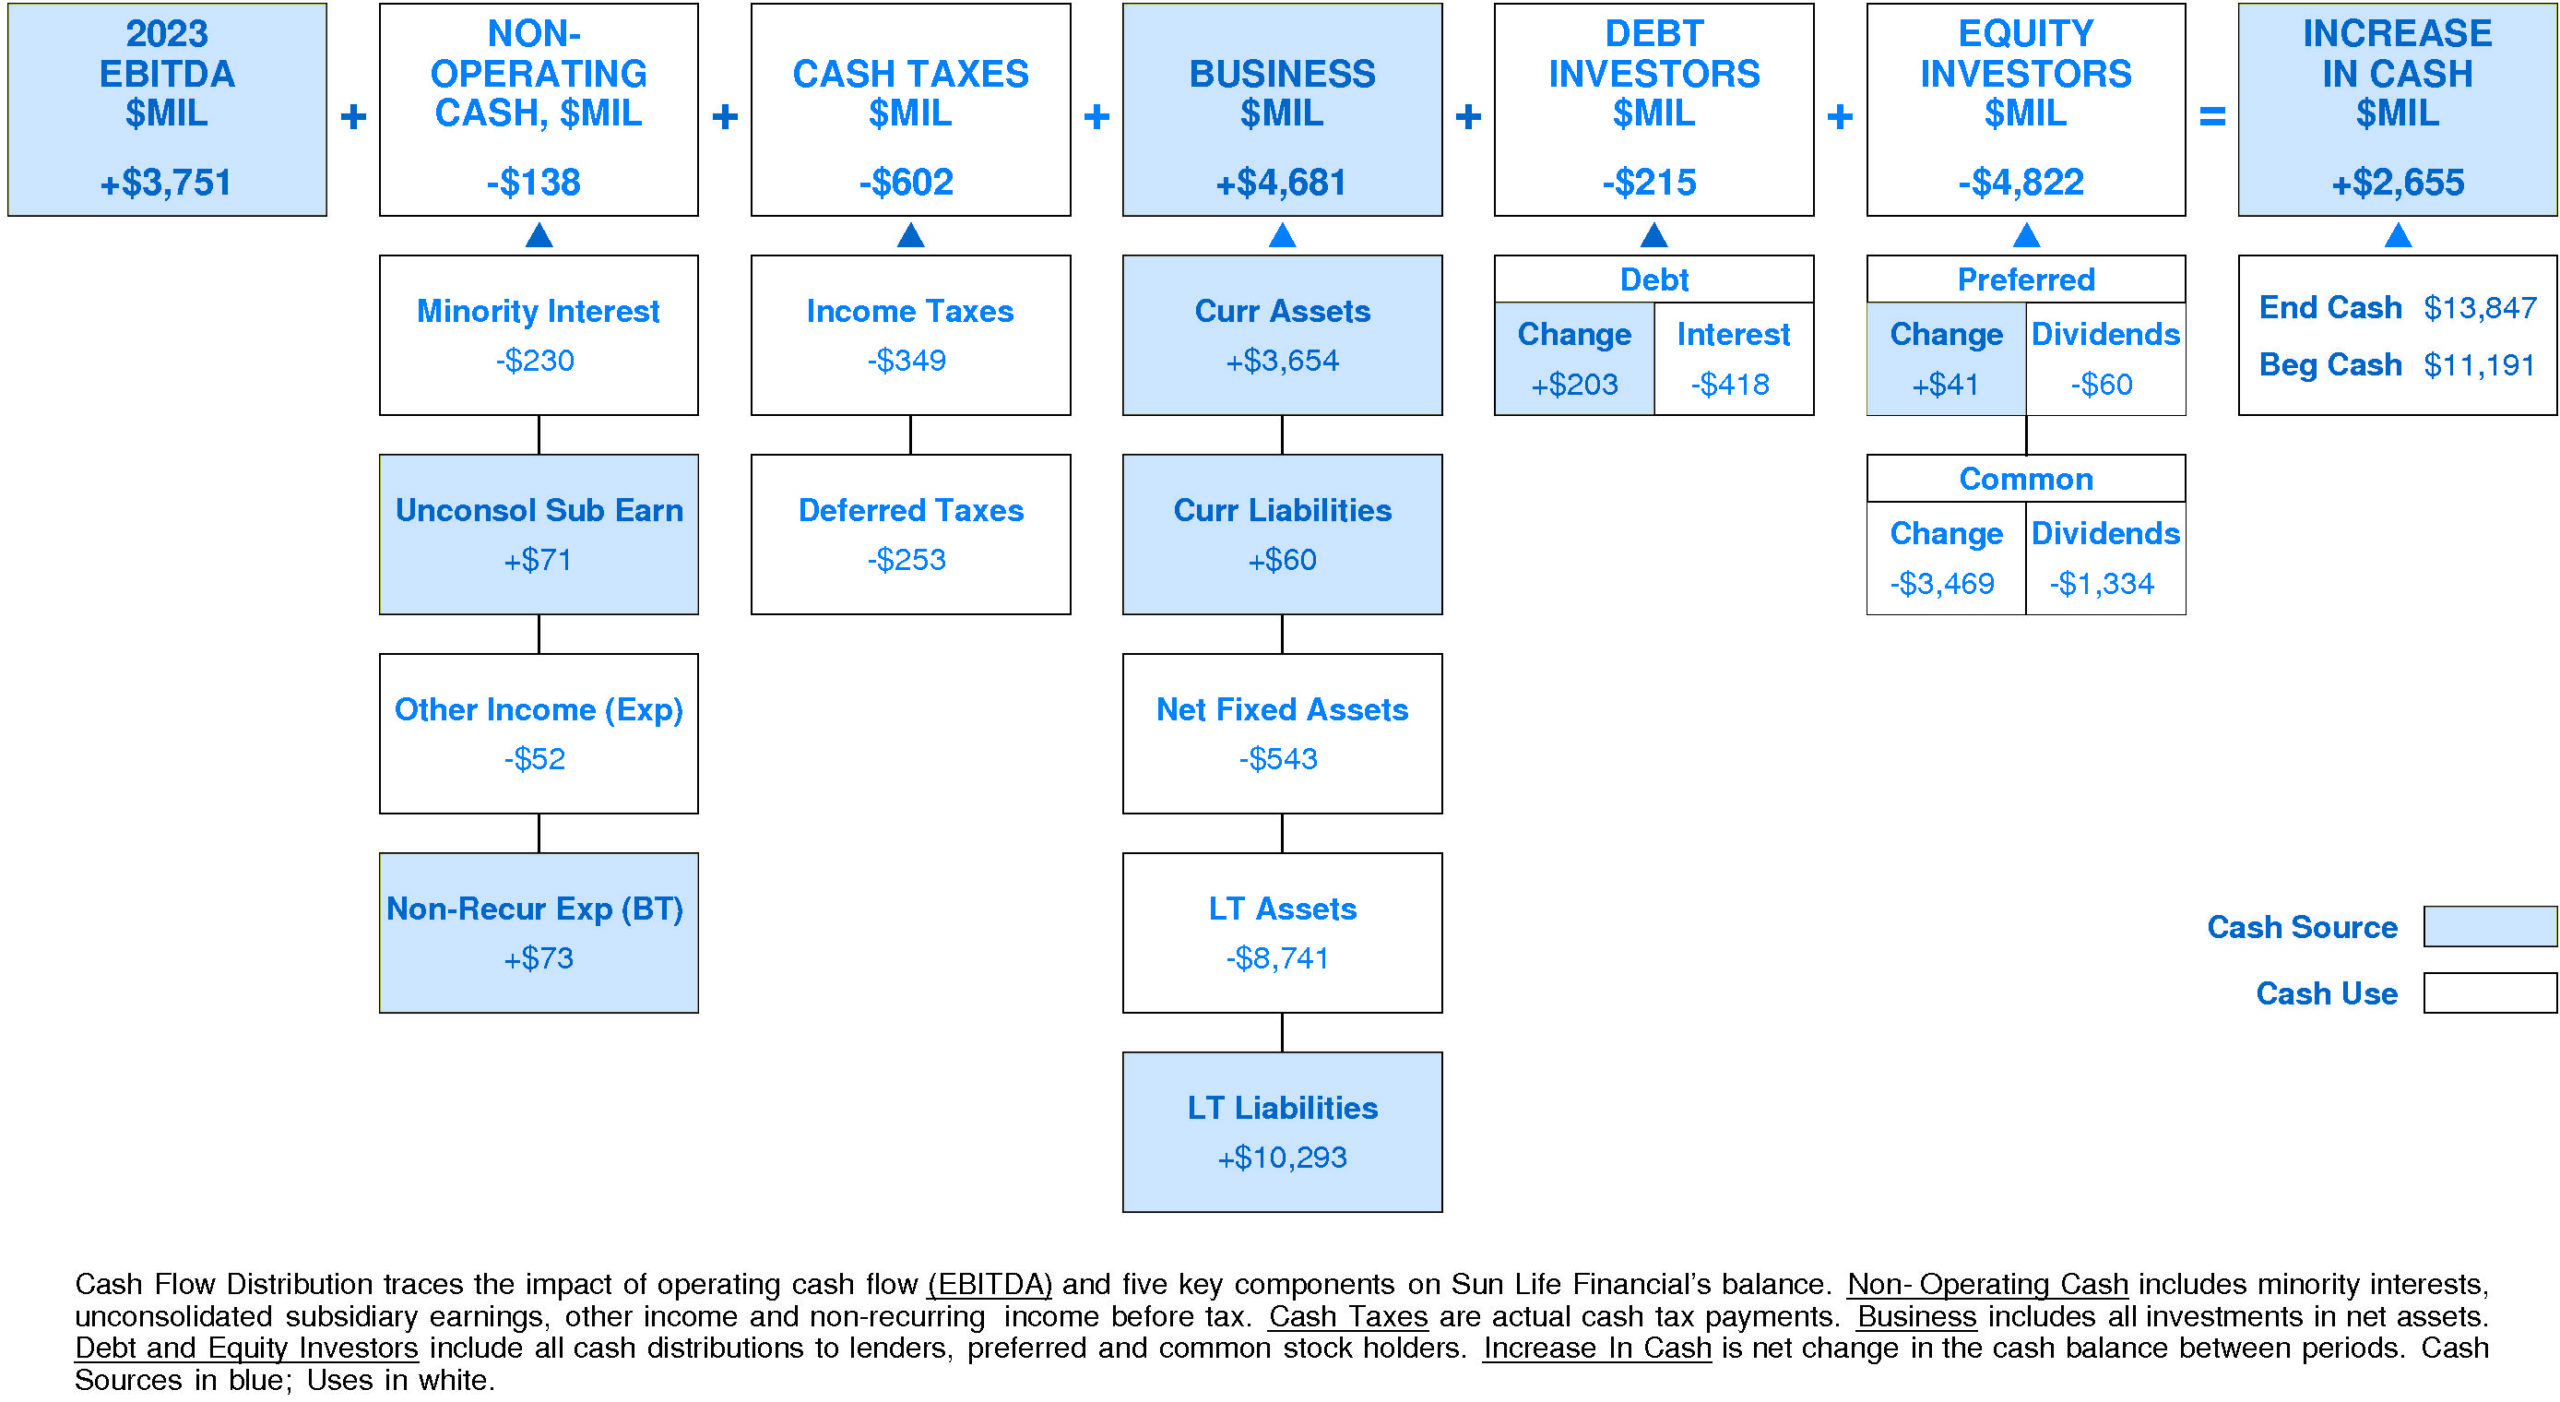
In 2023, Sun Life Financial generated a significant increase in cash of +$2,655 million (+24%). Sources of cash were larger than uses. Cash generated from 2023 EBITDA totaled +$3,751 million. Non-operating uses consumed -$138 million (-4% of EBITDA). Cash taxes consumed -$602 million (-16% of EBITDA). Withdrawal of investment from the business totaled +$4,681 million (+125% of EBITDA). On a net basis, debt investors withdrew -$215 million (-6% of EBITDA) while equity investors received -$4,822 million (-129% of EBITDA).
Sun Life Financial’s Non-operating Income, %EBITDA has suffered a very strong overall downtrend over the period. This downtrend was accompanied by a similar trend for the Sun Life Financial Peer Group. In most years, Sun Life Financial was in the top quartile and second quartile. Currently, Sun Life Financial is above median at -4% of EBITDA (-$138 million).
Sun Life Financial’s Cash Taxes, %EBITDA has exhibited a volatile overall uptrend over the period. This improvement was accompanied by stability for the Sun Life Financial Peer Group. In most years, Sun Life Financial was in the third quartile and top quartile. Currently, Sun Life Financial is below median at -16% of EBITDA (-$602 million).
Sun Life Financial’s Business Re-investment, %EBITDA has exhibited little to no overall change over the period. This stability was accompanied by an uptrend for the Sun Life Financial Peer Group. (Since 2021 Business Re-investment, %EBITDA has experienced very sharp improvement.) In most years, Sun Life Financial was in the second quartile and top quartile. Currently, Sun Life Financial is upper quartile at +125% of EBITDA (+$4,681 million).
Sun Life Financial’s Debt Investors, %EBITDA has experienced a very strong overall uptrend over the period. This improvement was accompanied by an opposite trend for the Sun Life Financial Peer Group. (Since 2021 Debt Investors, %EBITDA has experienced a very sharp decline.) In most years, Sun Life Financial was in the lower quartile and second quartile. Currently, Sun Life Financial is lower quartile at -6% of EBITDA (-$215 million).
Sun Life Financial’s Equity Investors, %EBITDA has exhibited a volatile overall uptrend over the period. This improvement was accompanied by an opposite trend for the Sun Life Financial Peer Group. (Since 2021 Equity Investors, %EBITDA has experienced a very sharp decline.) In most years, Sun Life Financial was in the lower quartile and second quartile. Currently, Sun Life Financial is lower quartile at -129% of EBITDA (-$4,822 million).
Sun Life Financial’s Change in Cash, %EBITDA has experienced a volatile overall uptrend over the period. This improvement was accompanied by a similar trend for the Sun Life Financial Peer Group. In most years, Sun Life Financial was in the top quartile and lower quartile. Currently, Sun Life Financial is substantially above median at +71% of EBITDA (+$2,655 million).
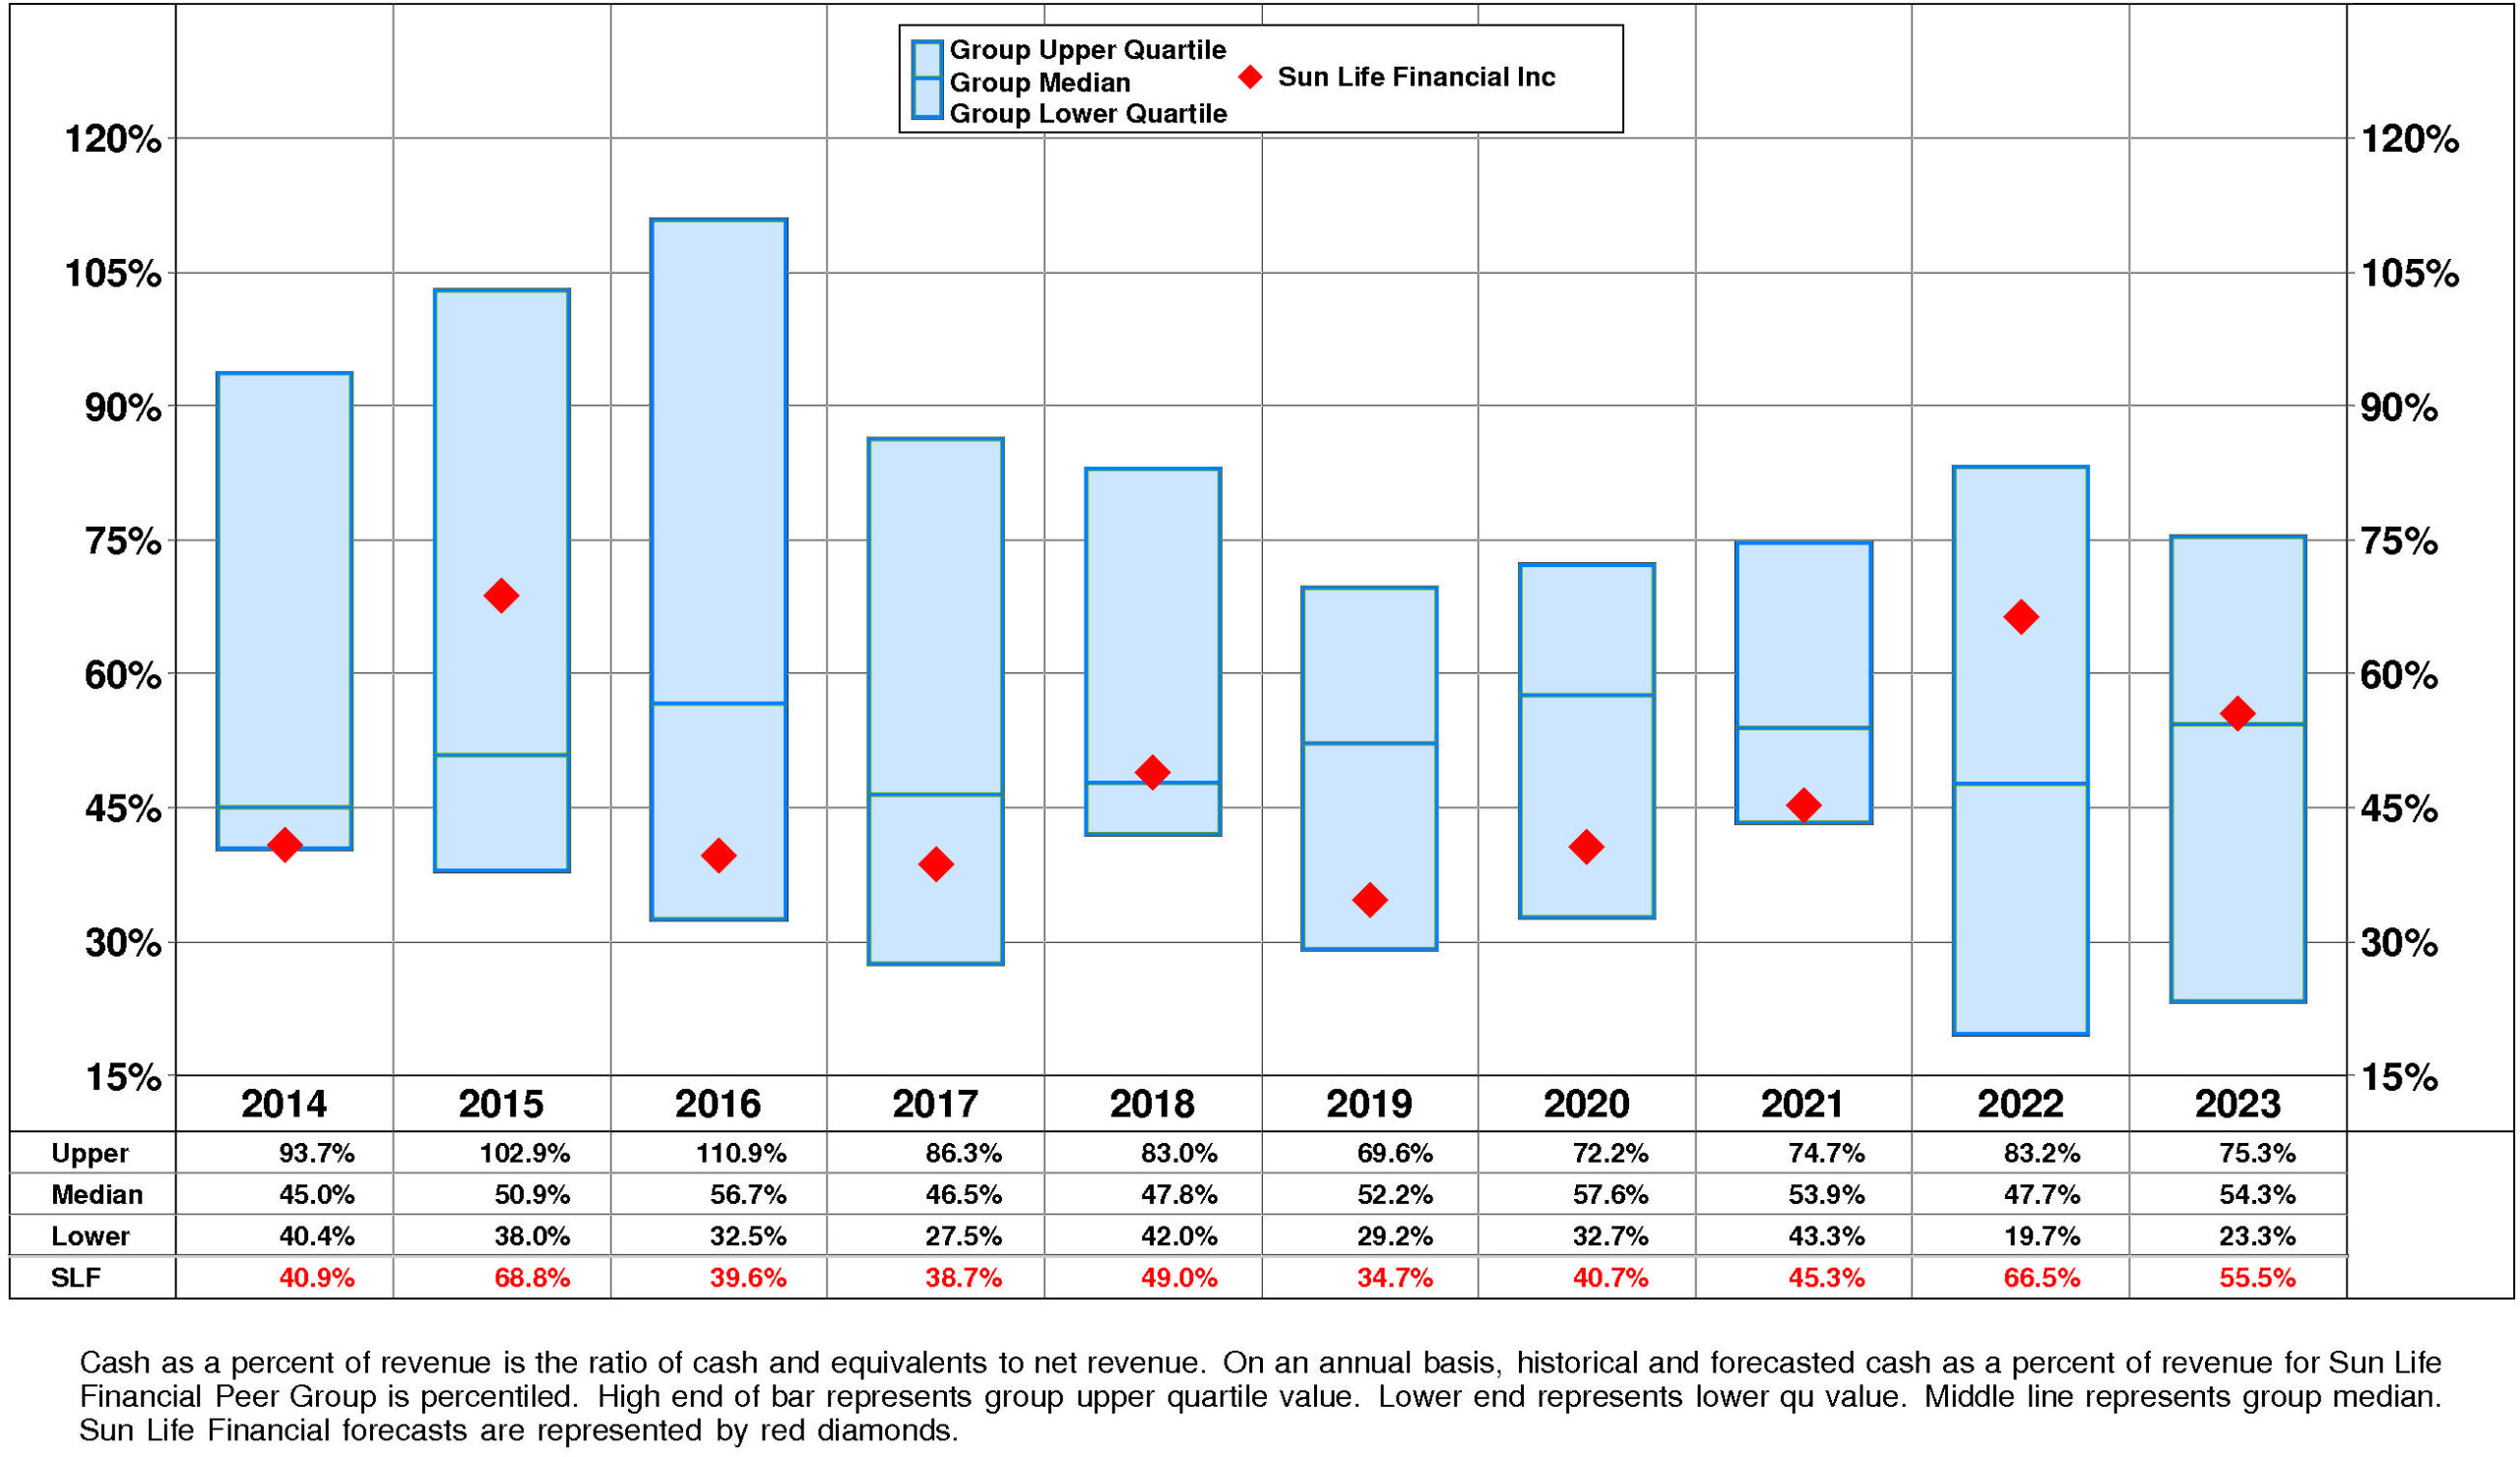
Sun Life Financial’s Cash, %Revenue has exhibited a volatile overall uptrend over the period. This improvement was accompanied by a similar trend for the Sun Life Financial Peer Group. (Since 2019 Cash, %Revenue has sharply accelerated.) In most years, Sun Life Financial was in the third quartile and second quartile. Currently, Sun Life Financial is slightly above median at +56%.
PROFITABILITY
Sun Life Financial’s return on equity has improved significantly since 2014. The current level of 14.6% is 1.29X the low for the period and is 11.6% from the high.
This significant improvement was due to very small positive trend in pretax operating return and small positive trend in non-operating factors.
The productivity of Sun Life Financial’s assets declined over the full period 2014-2023: asset turnover has experienced a downtrend but it experienced a very sharp recovery after the 2022 low.
More than offsetting this trend, however, pretax margin has exhibited a volatile overall uptrend although it experienced a very sharp decline after the 2022 high.
Non-operating factors (income taxes and financial leverage) had a minor positive influence on return on equity.
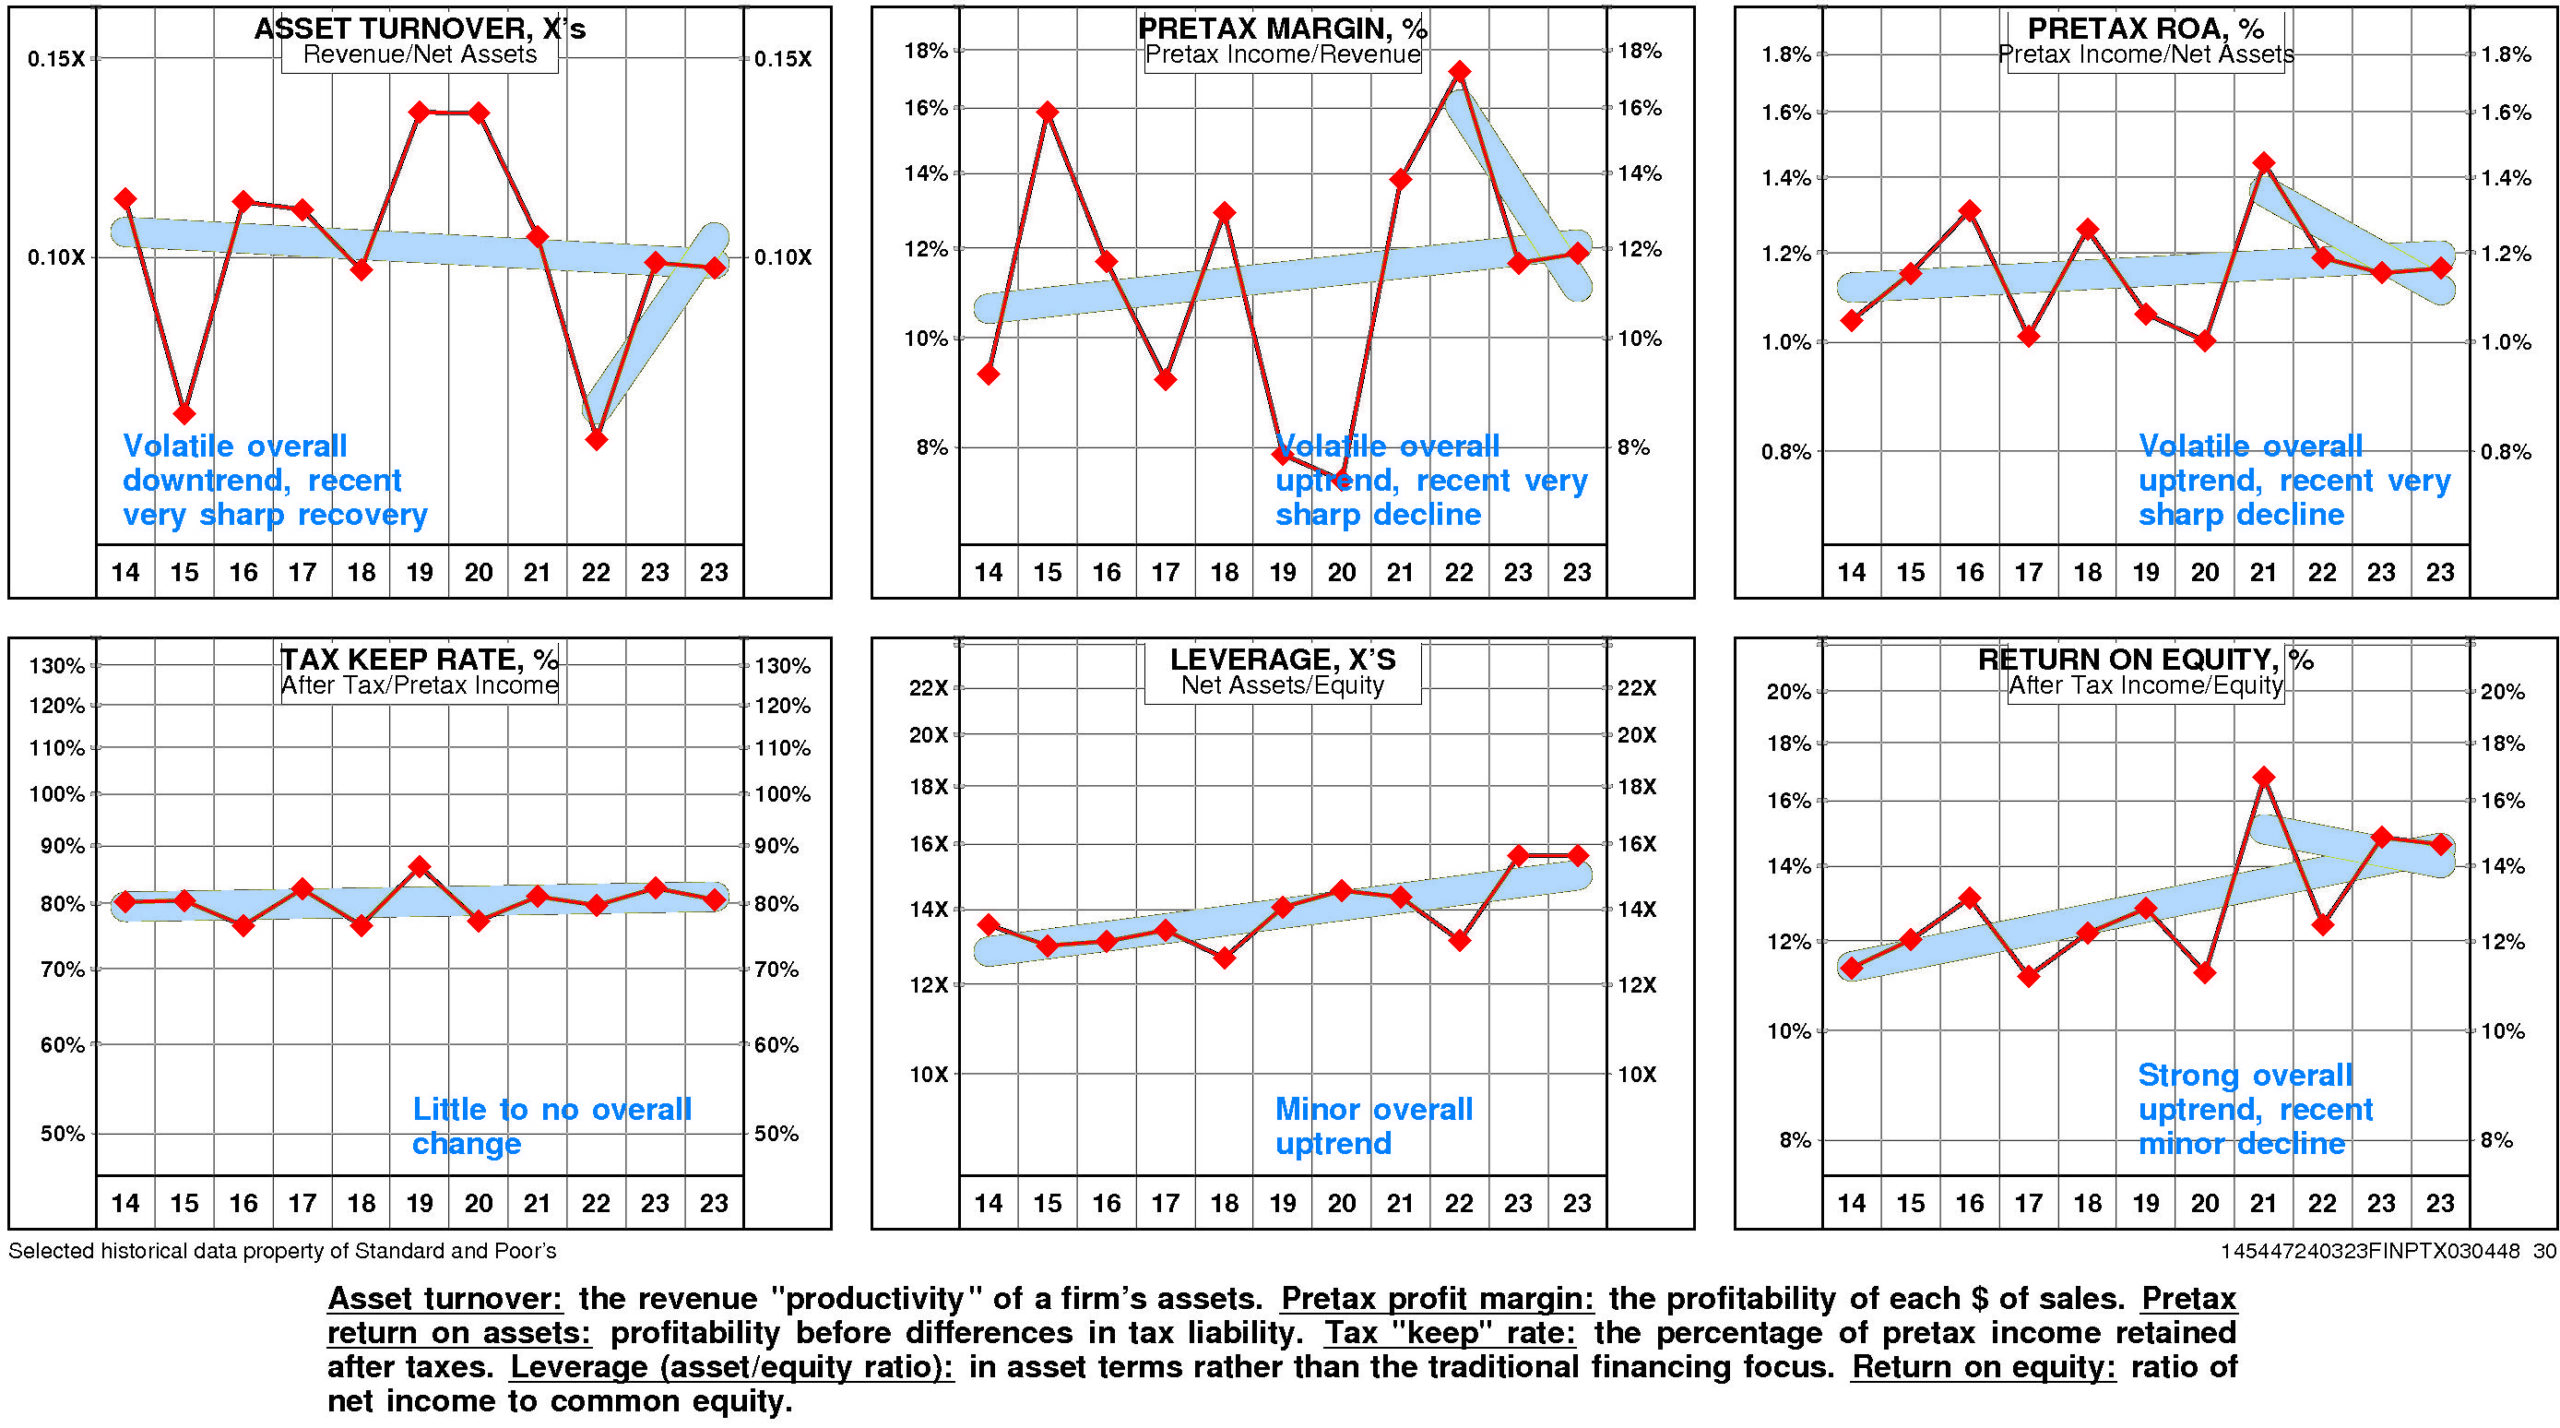
Sun Life Financial’s return on equity is above median (14.6%) for the four quarters ended December, 2023.
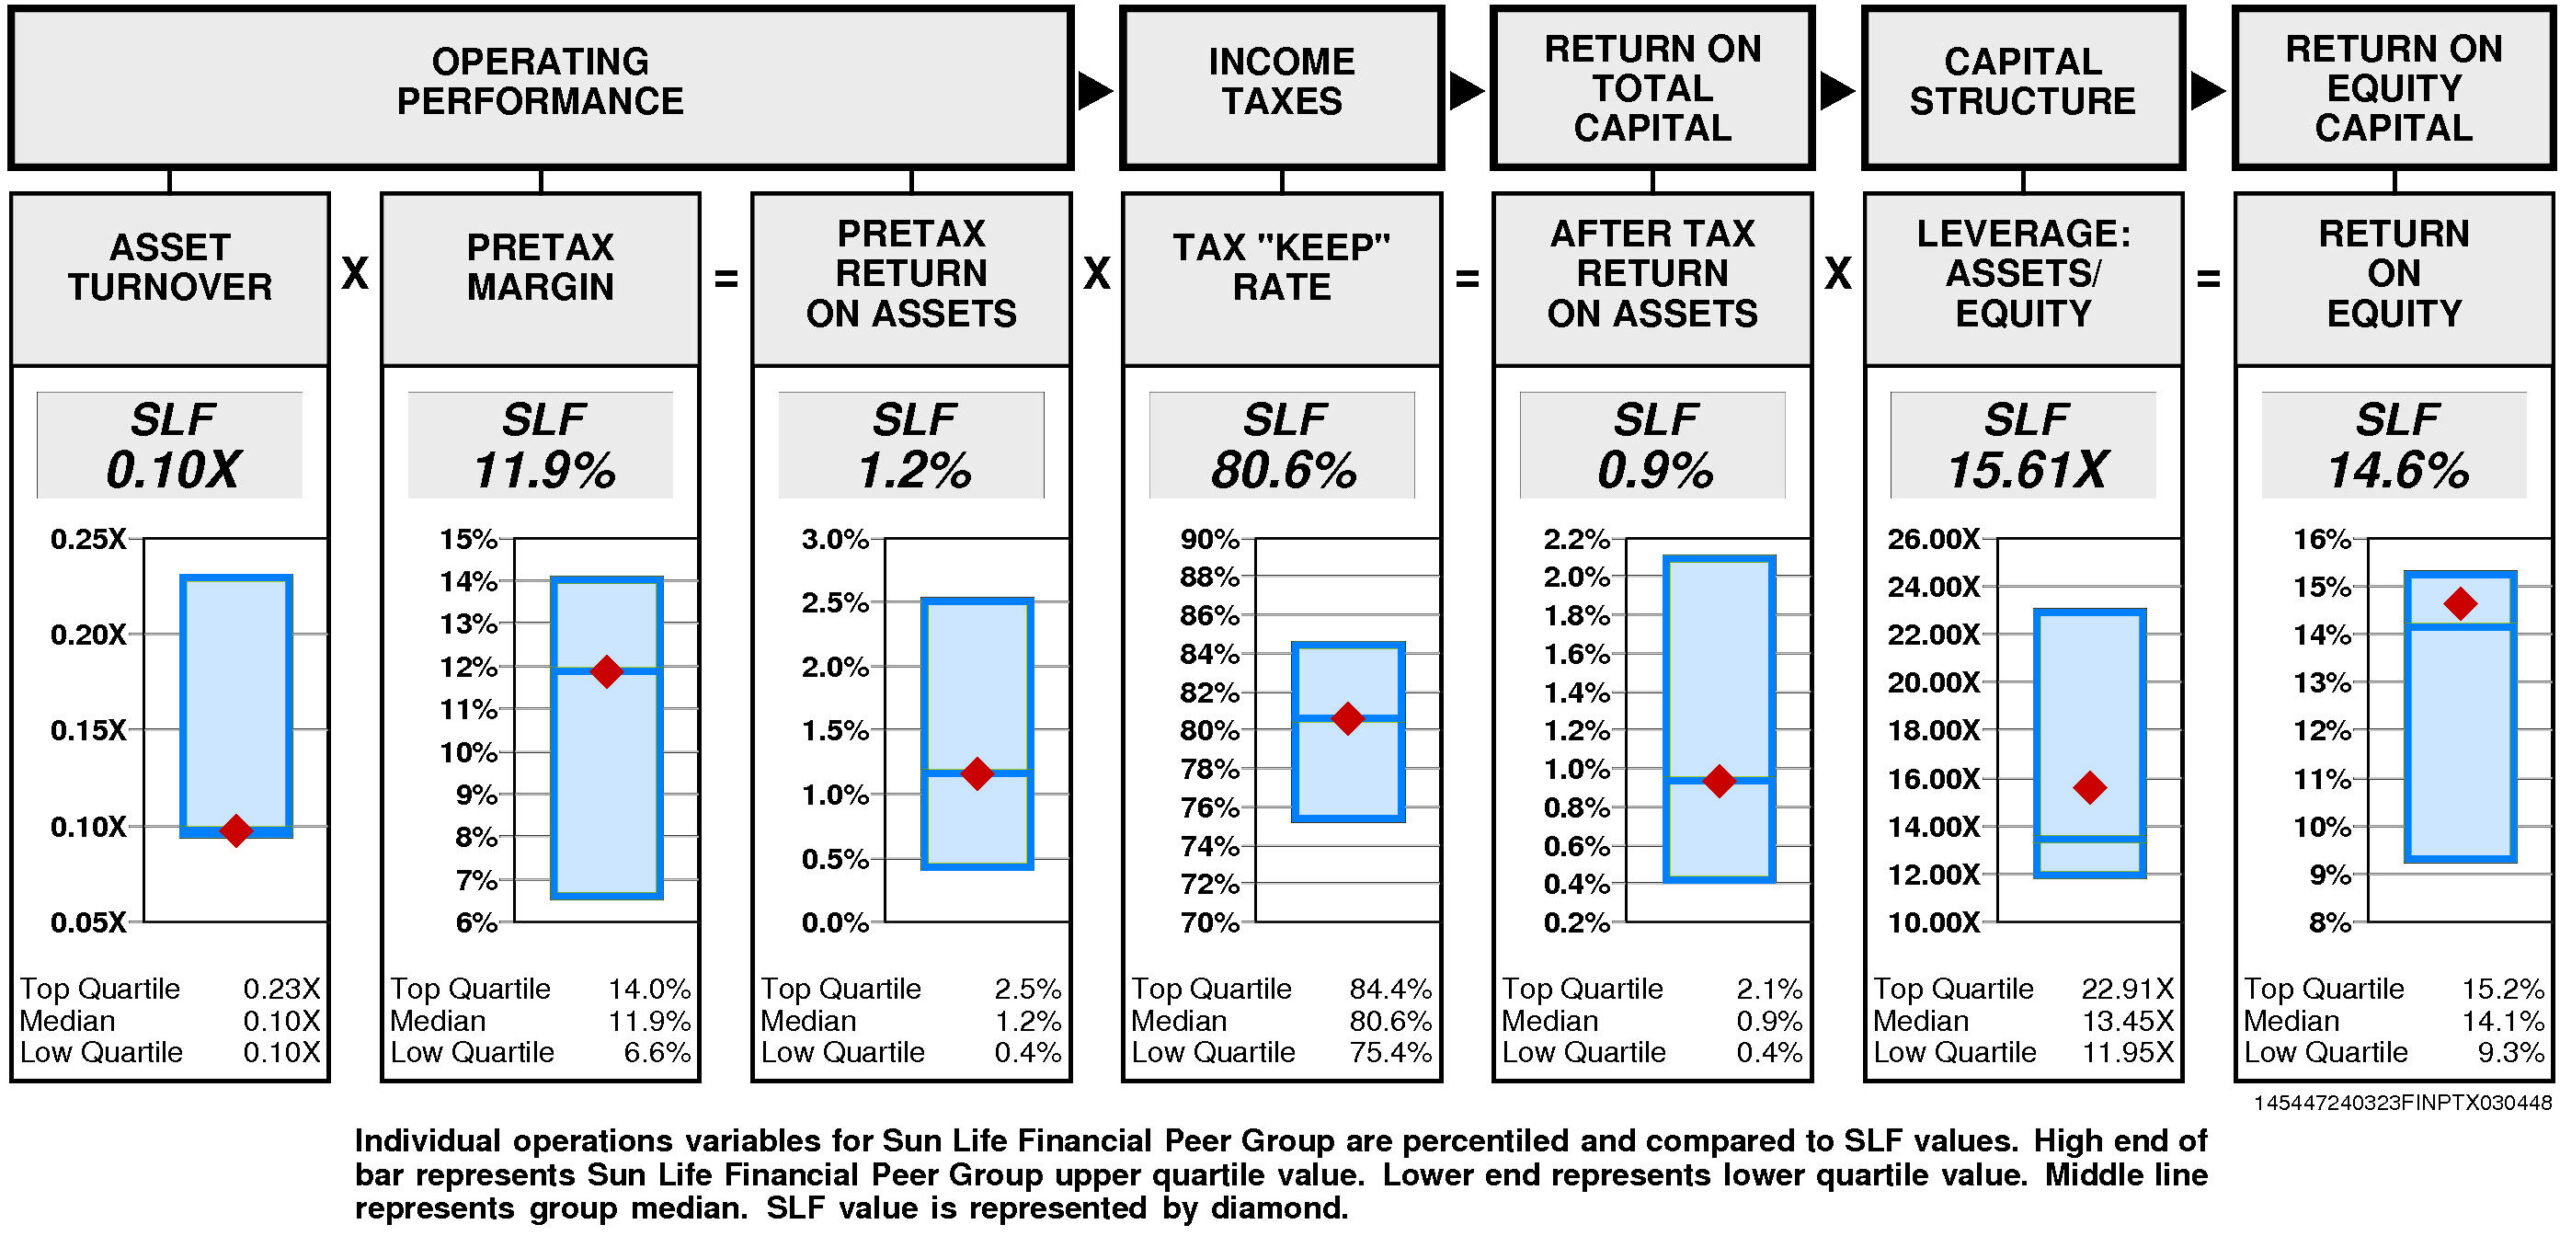
Operating performance (pretax return on assets) is at median (1.2%) reflecting asset turnover that is at median (0.10X) and at median pretax margin (11.9%).
Tax “keep” rate (income tax management) is at median (80.6%) resulting in after tax return on assets that is at median.
Financial leverage (leverage) is slightly above median (15.61X).
GROWTH RATES
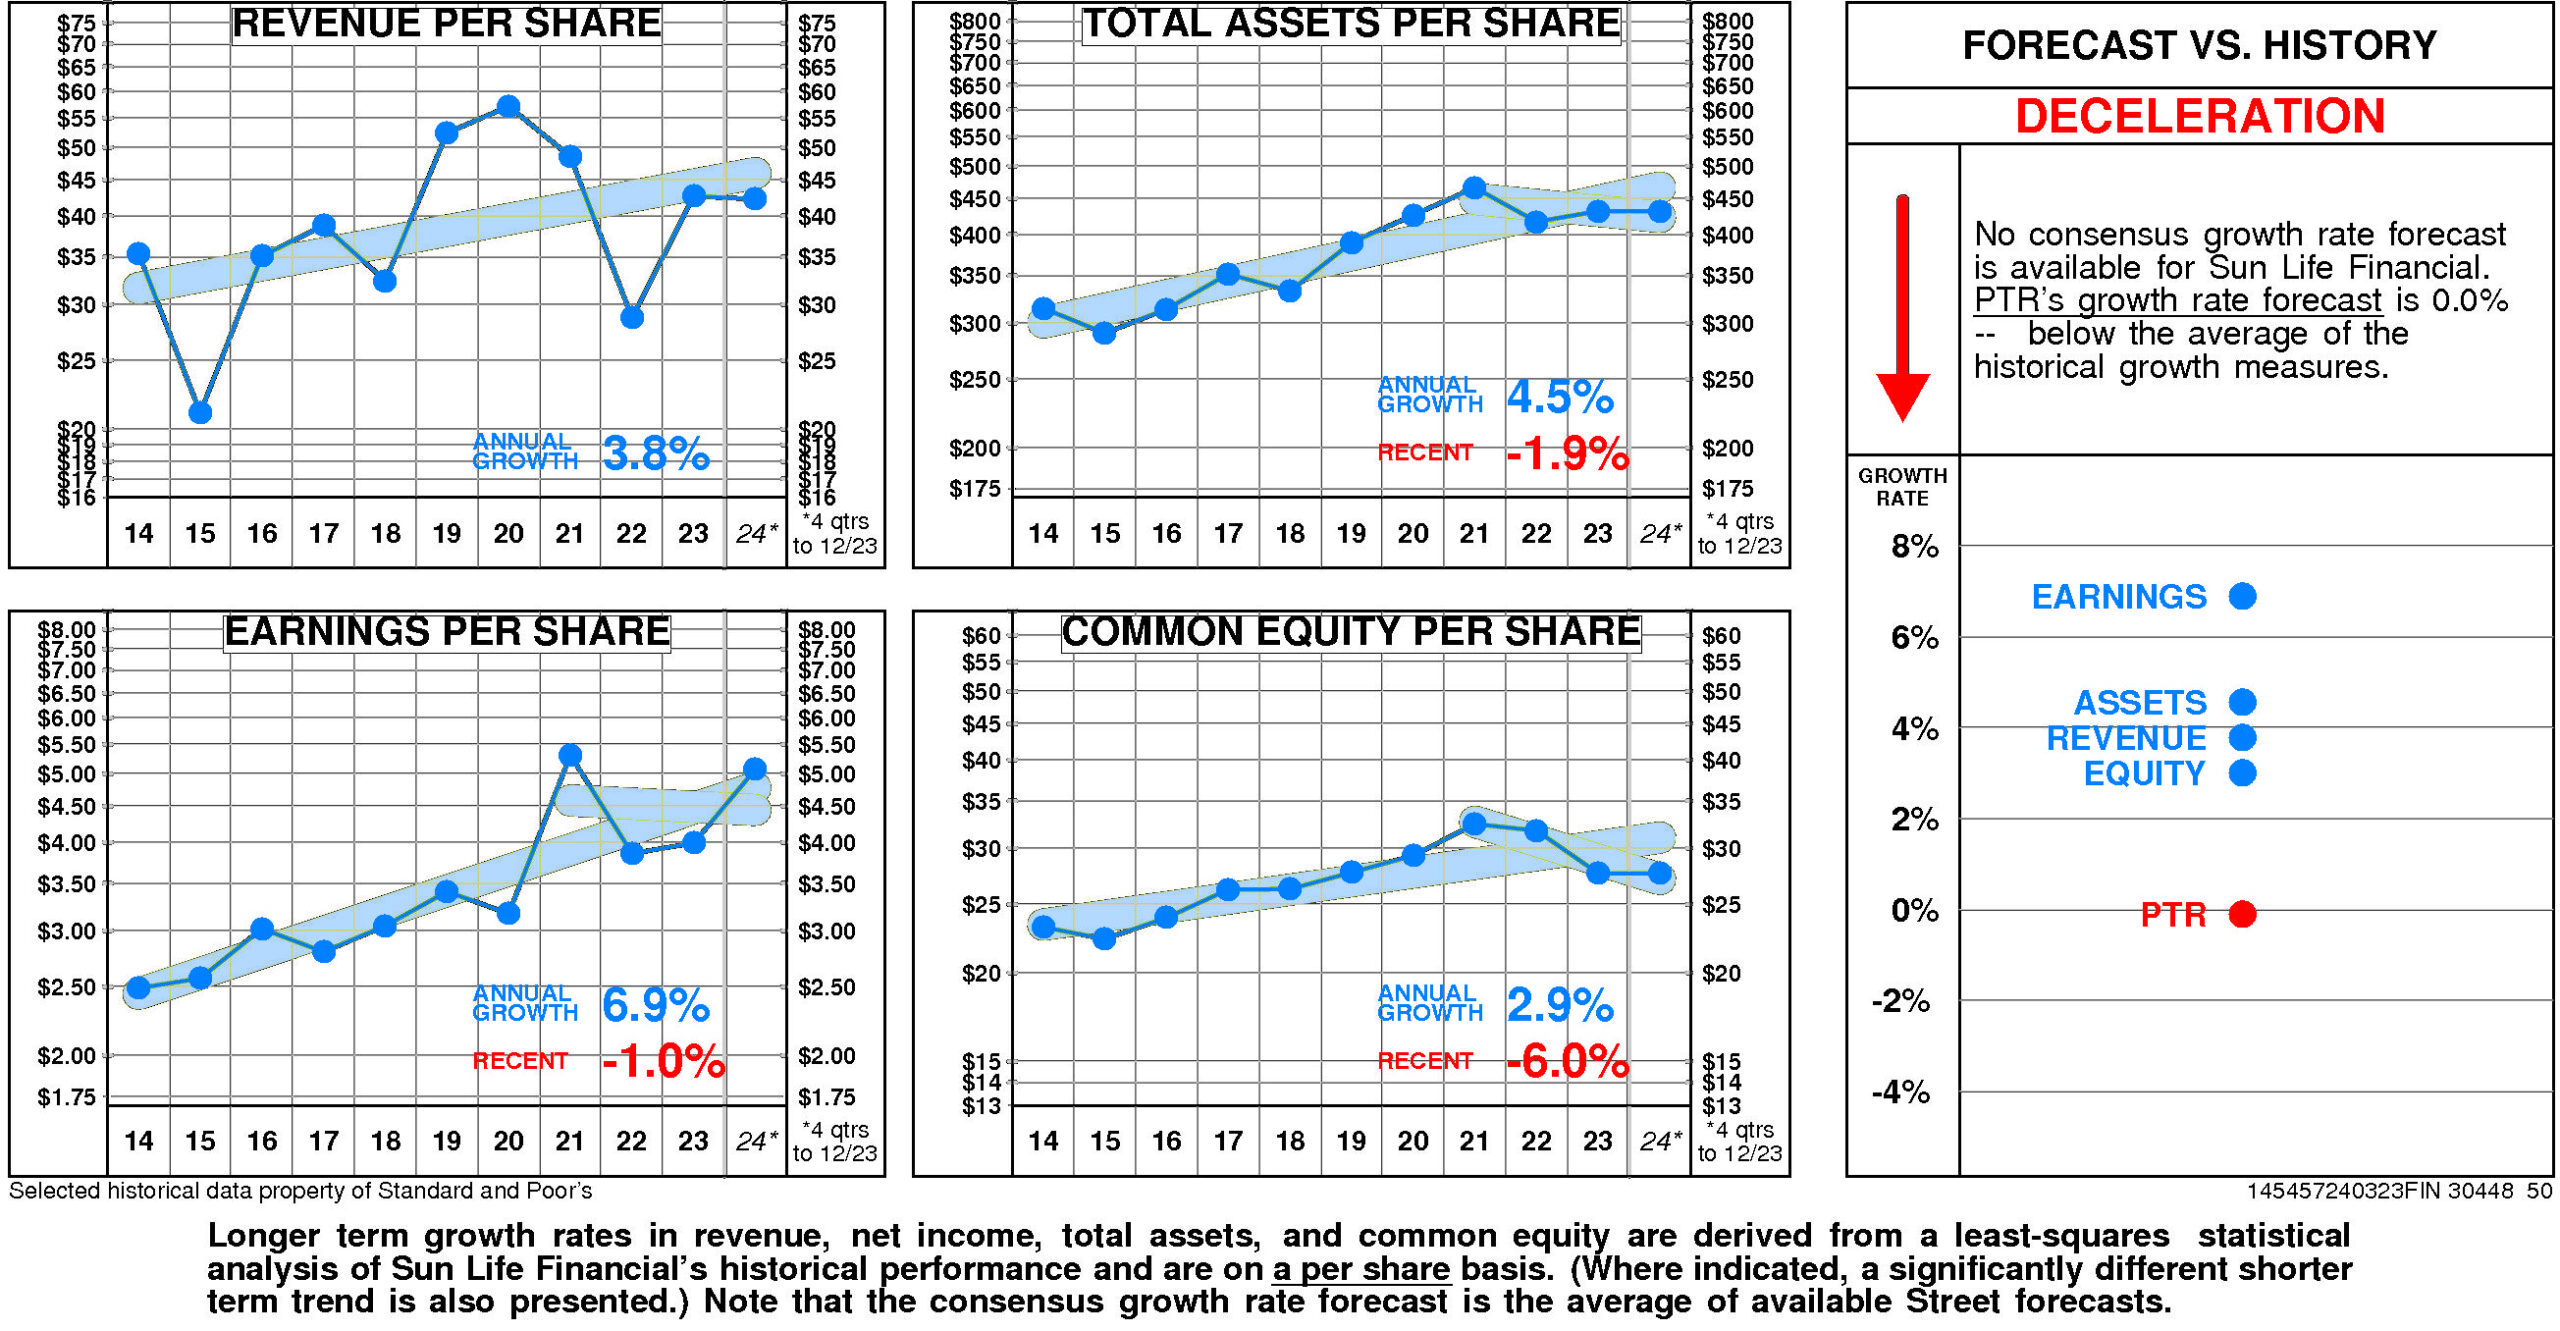
Overall, Sun Life Financial’s growth rate has slowed very considerably in recent years.
Sun Life Financial’s historical income statement growth has been in line with balance sheet growth. Revenue growth has paralleled asset growth; earnings growth has paralleled equity growth.
Annual revenue growth has been 3.8% per year.
Total asset growth has been 4.5% per year. (More recently it has been -1.9%.)
Annual E.P.S. growth has been 6.9% per year. (More recently it has been -1.0%.)
Equity growth has been 2.9% per year. (More recently it has been -6.0%.)
No consensus growth rate forecast is available for Sun Life Financial.
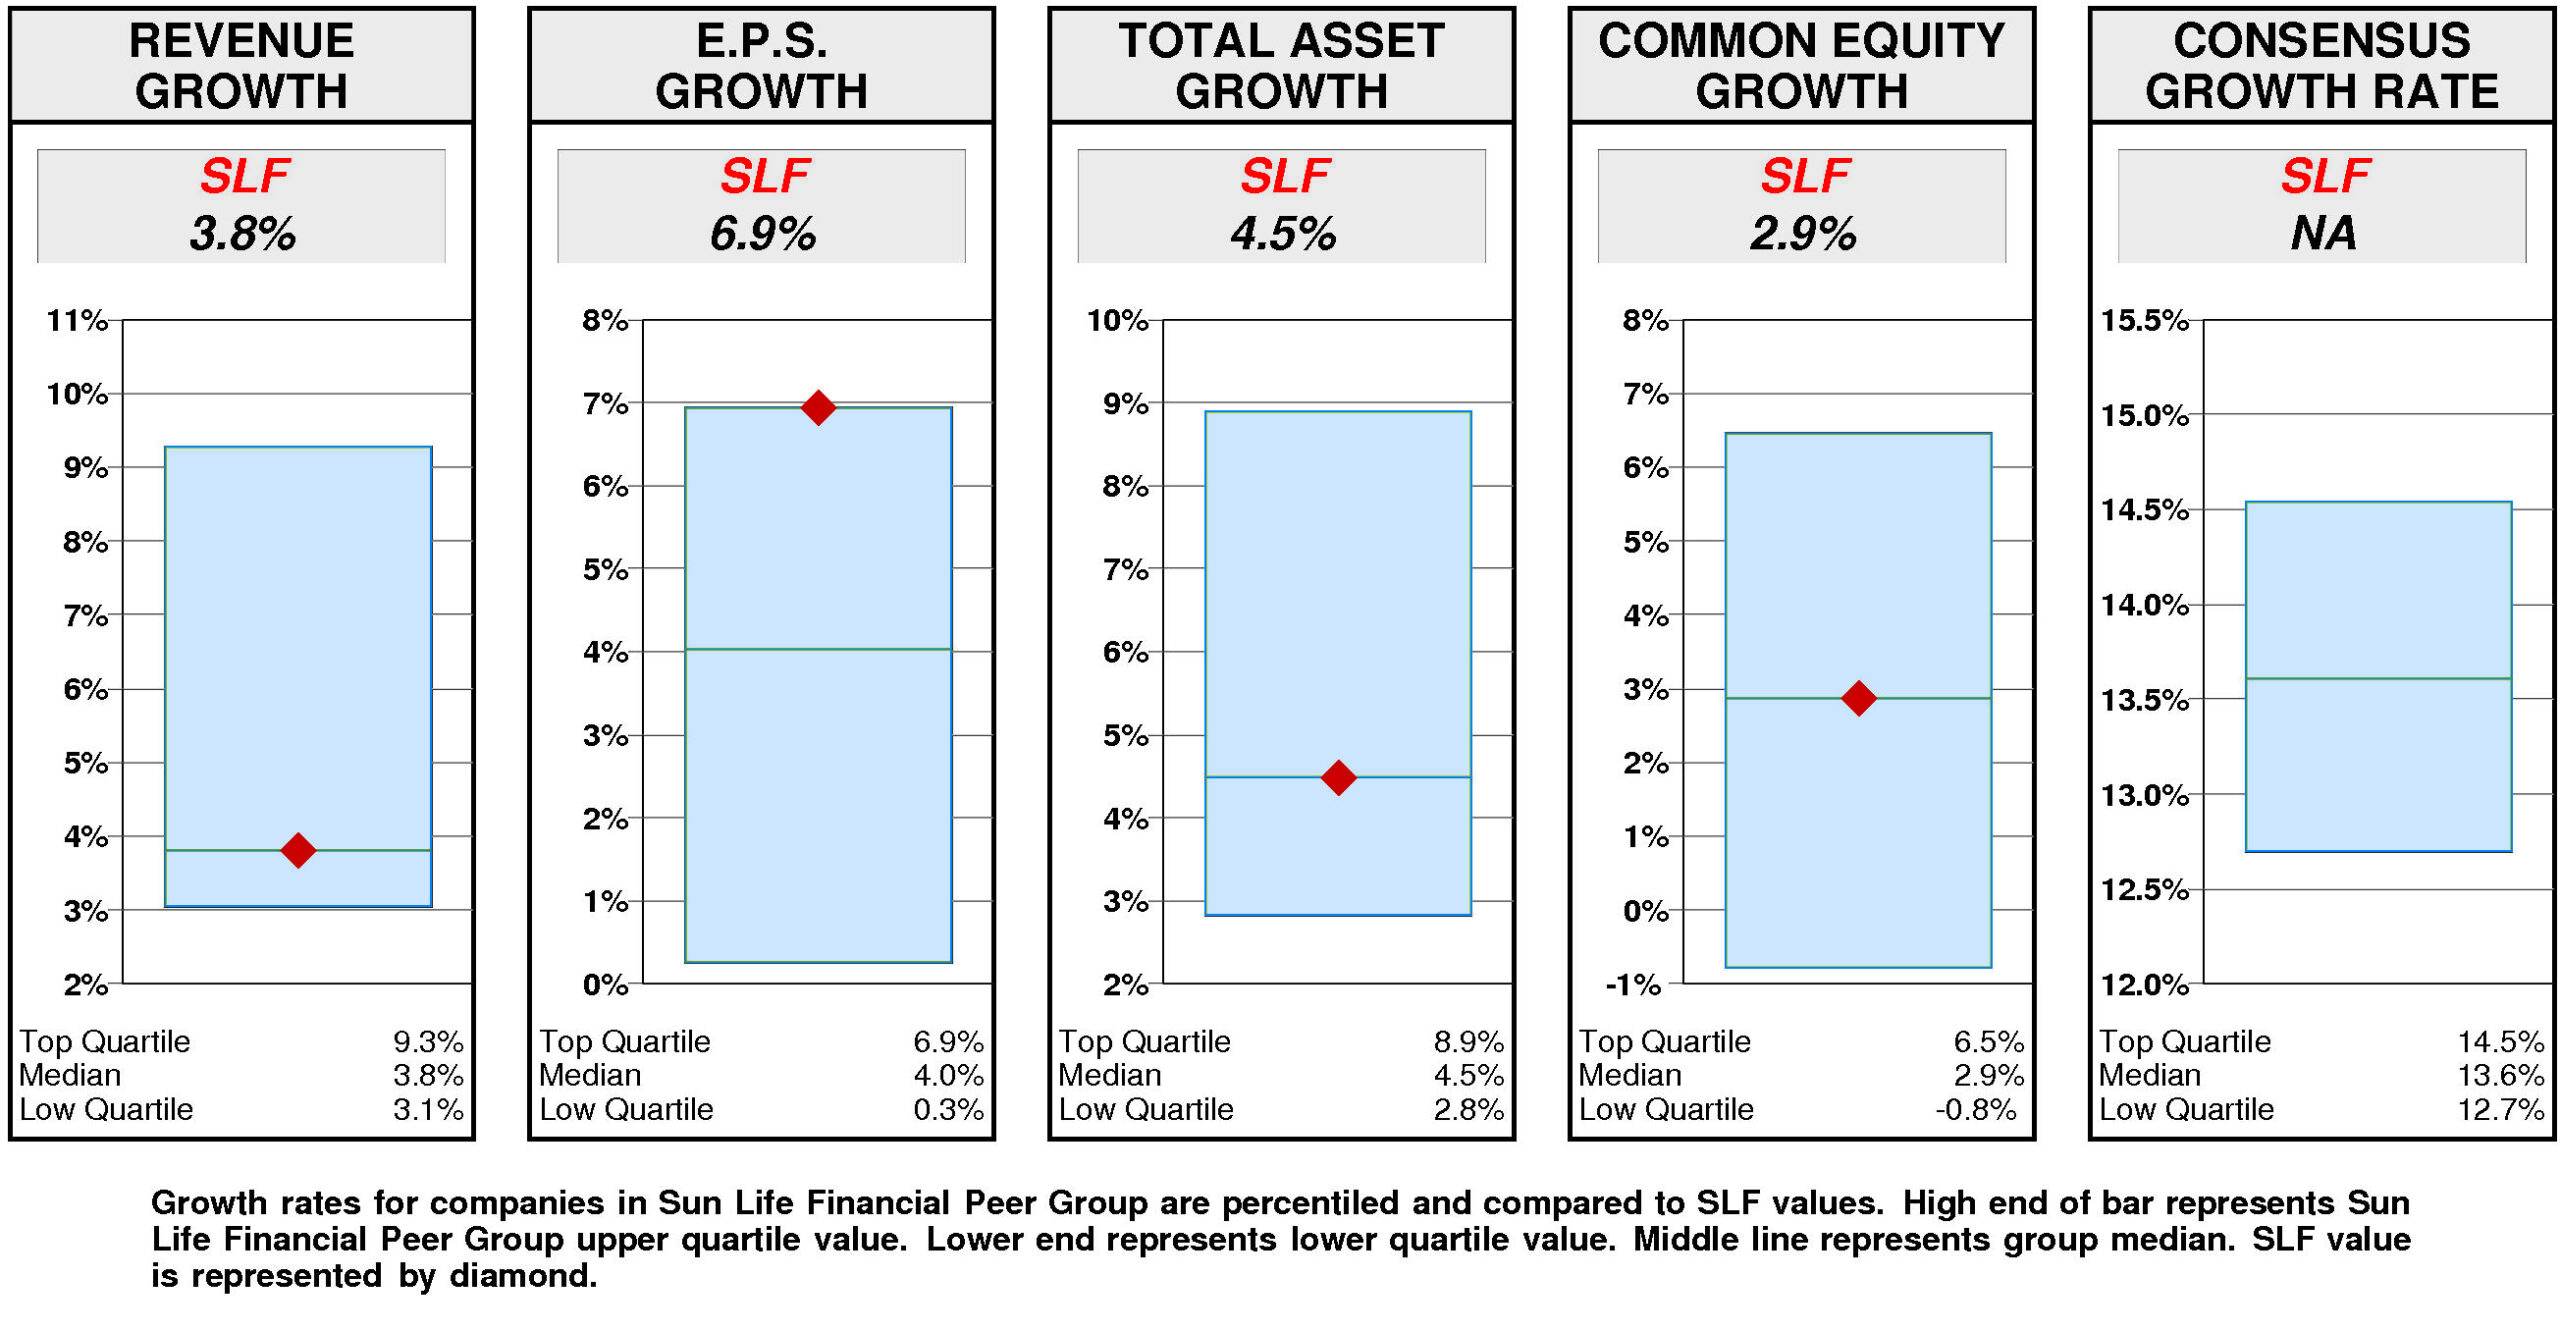
Relative to the Sun Life Financial Peer Group, Sun Life Financial’s historical growth measures are generally second quartile. E.P.S. growth (6.9%) has been at the upper quartile. Total asset growth (4.5%) has been at median. Revenue growth (3.8%) has been at median. Equity growth (2.9%) has been at median.
Consensus growth forecast is unavailable.
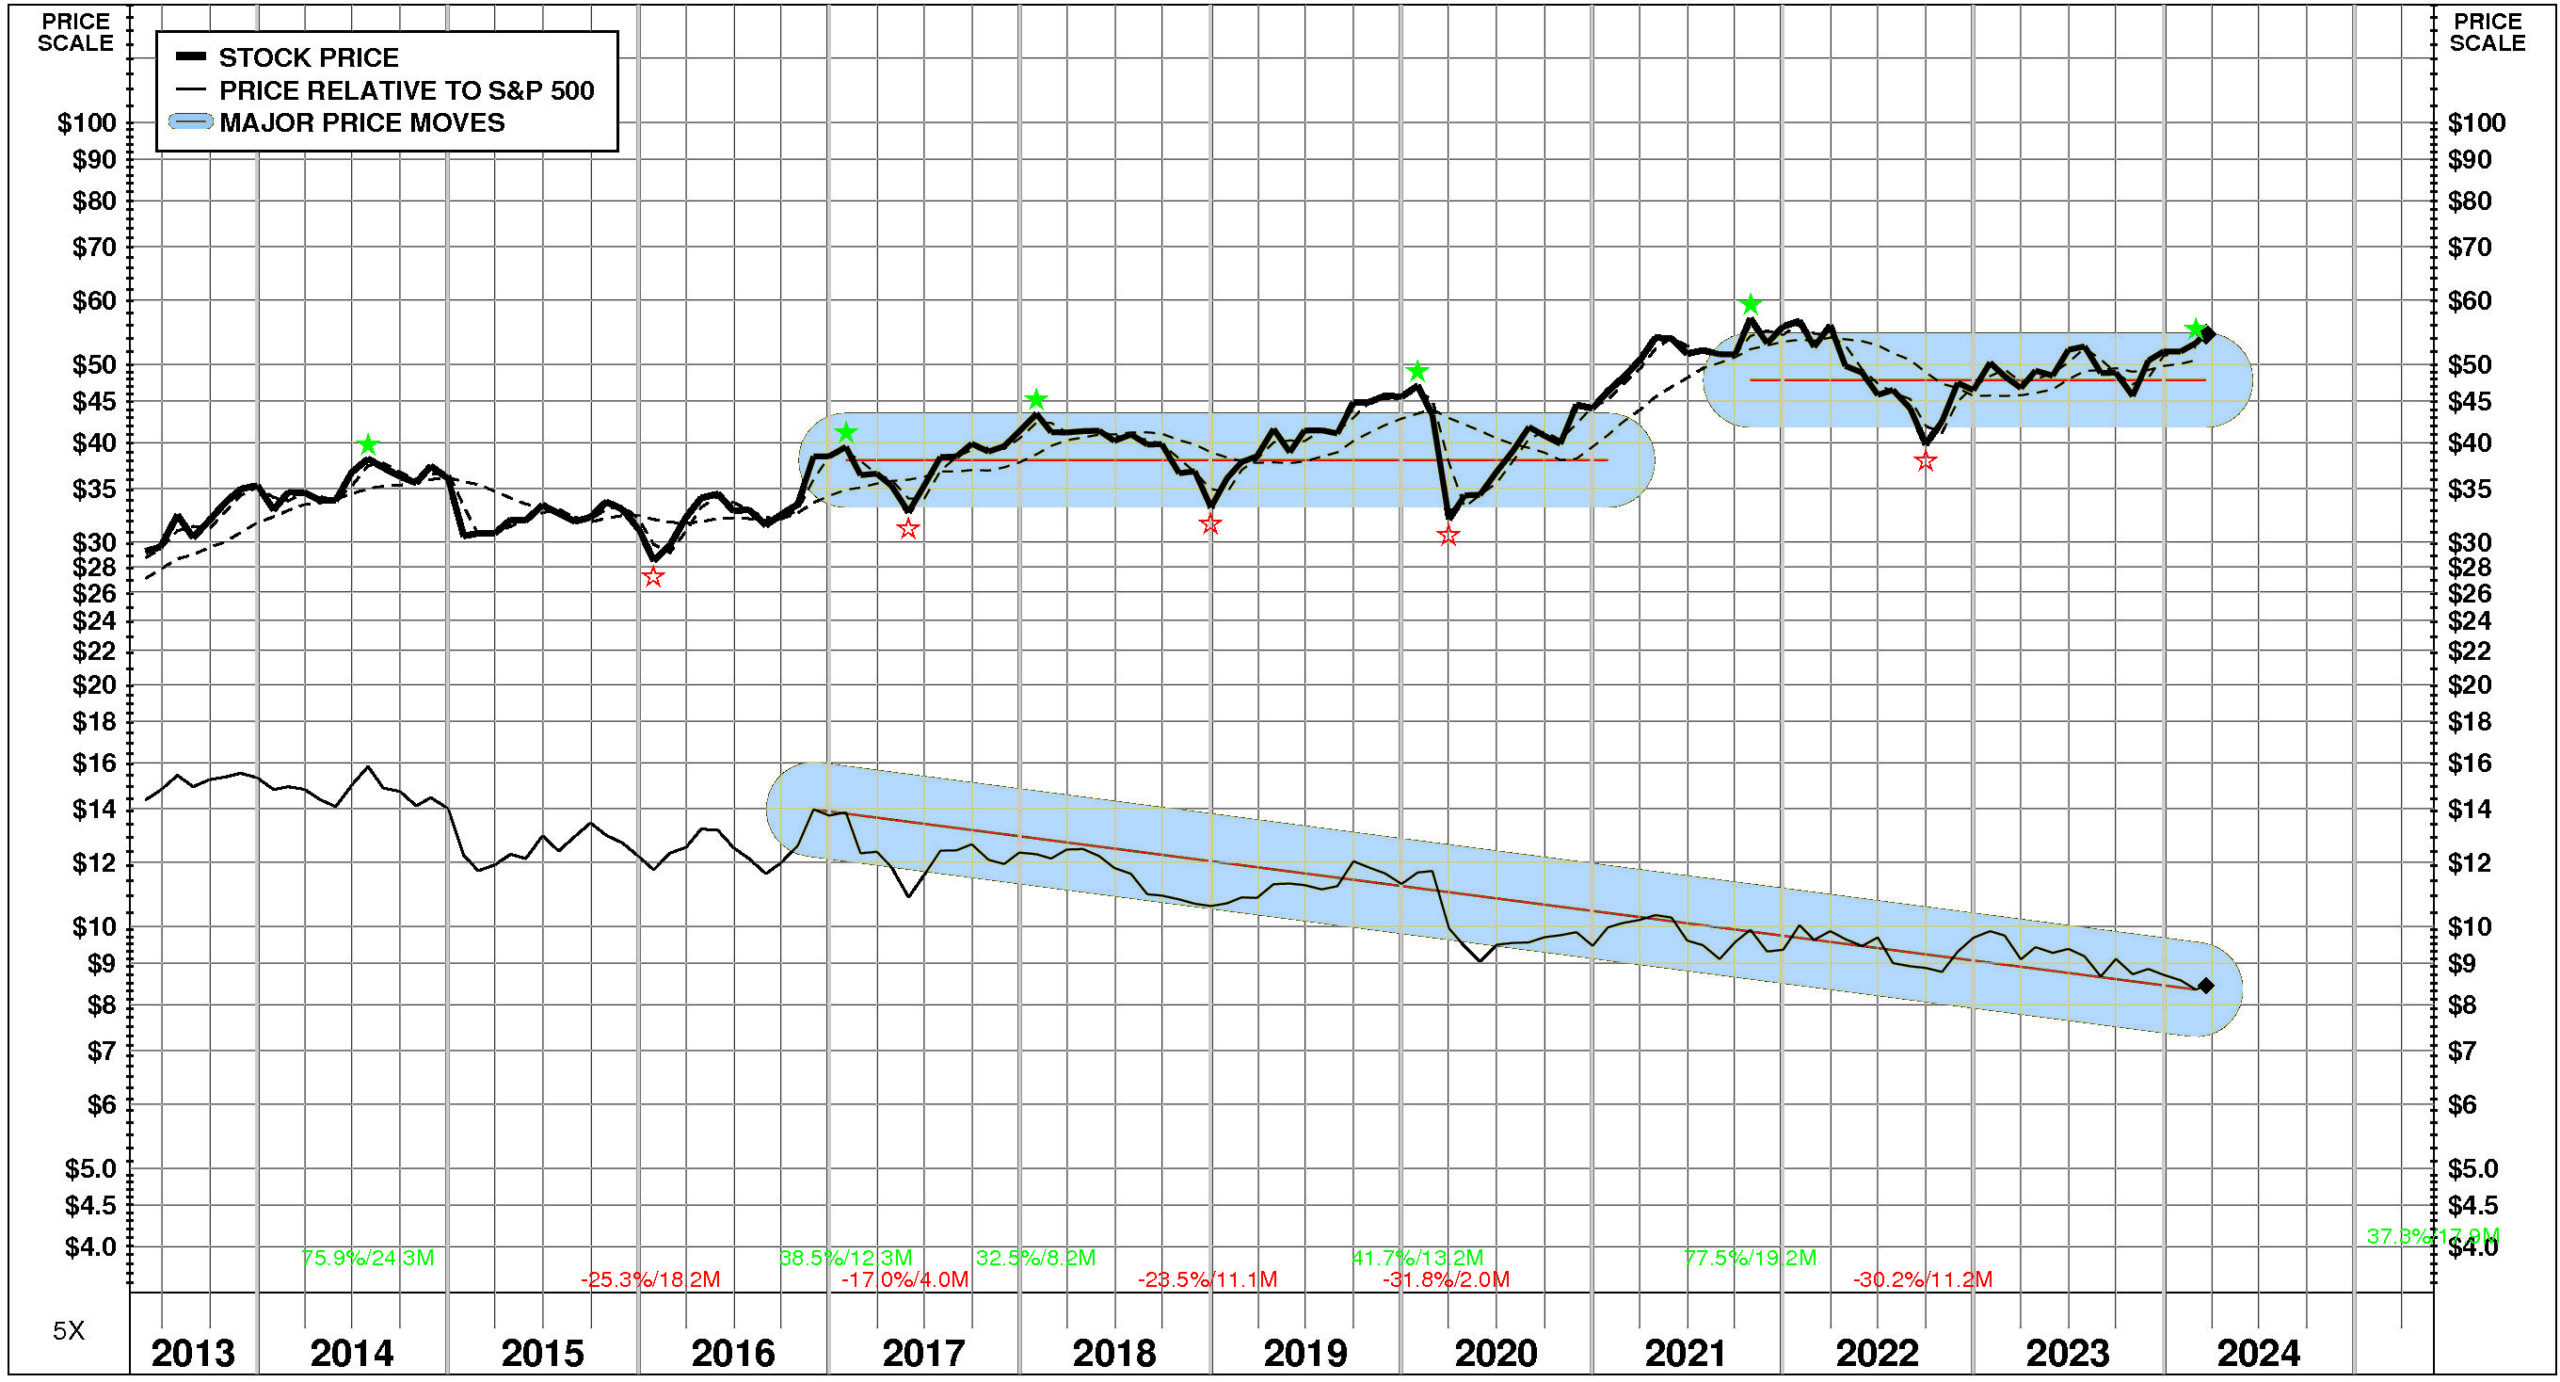
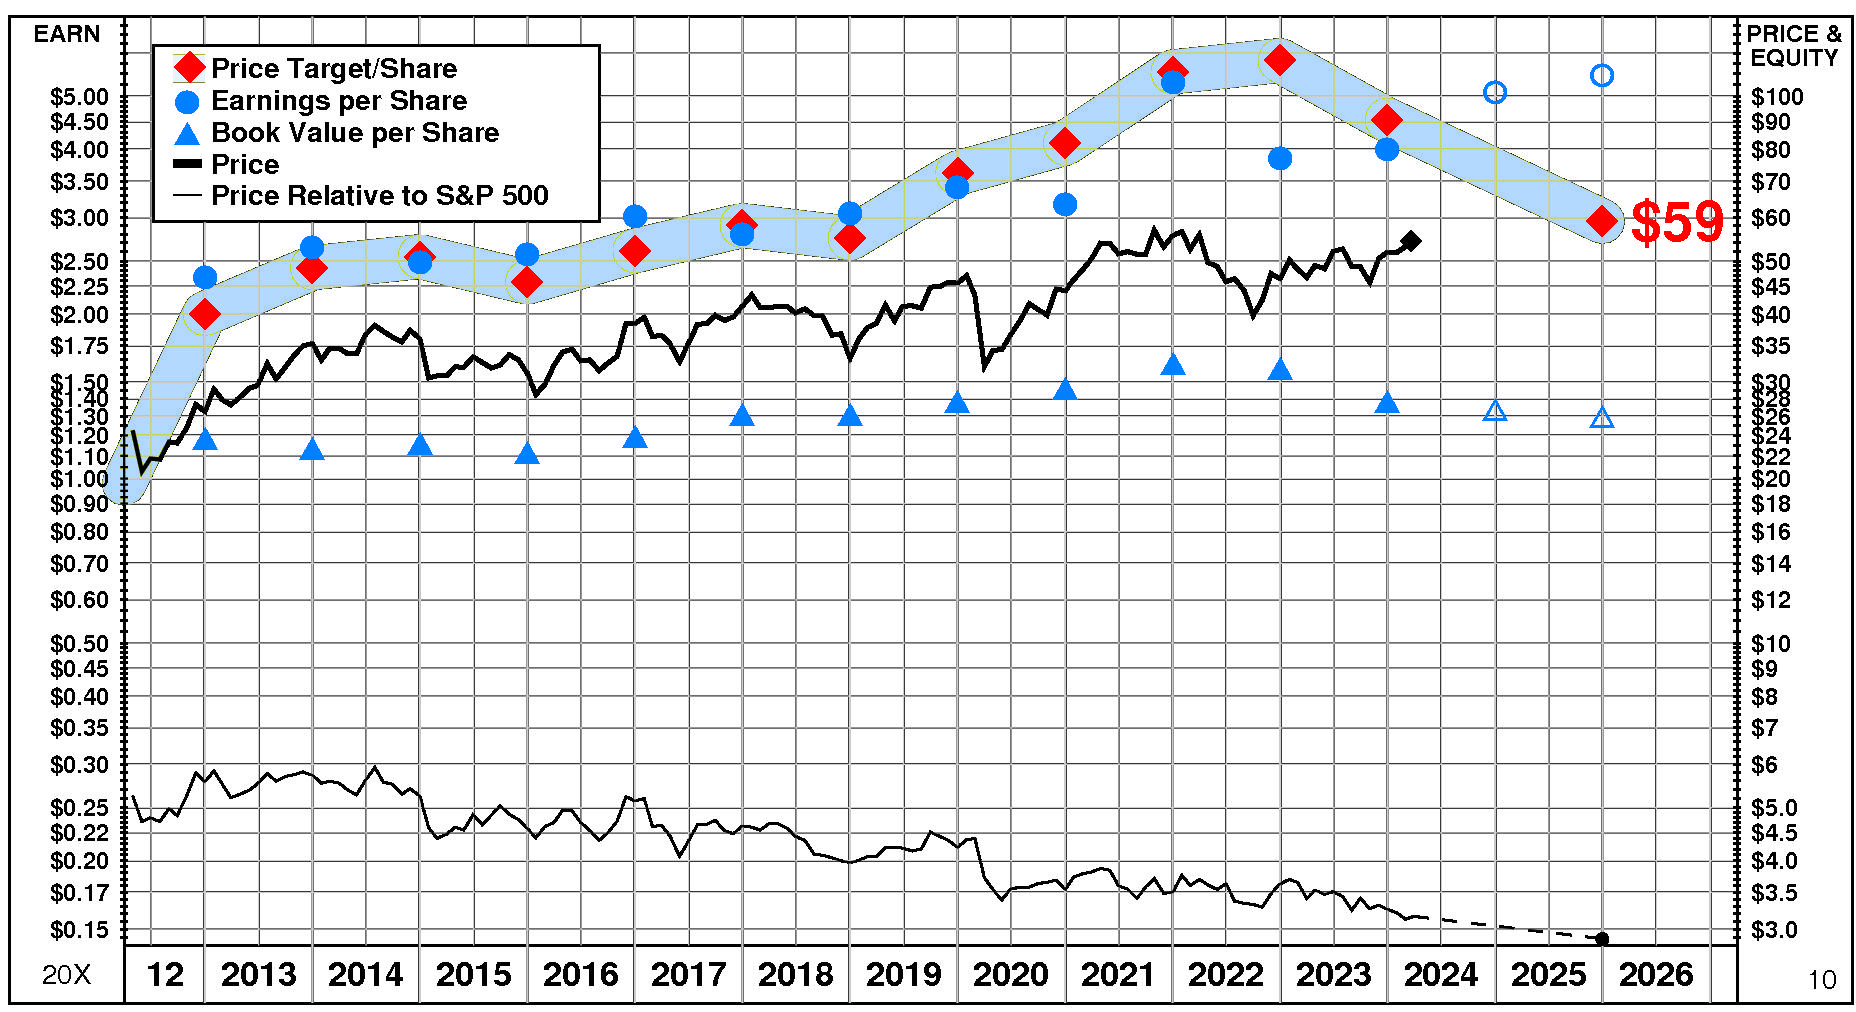
PRICE HISTORY
Over the full time period, Sun Life Financial’s stock price performance has been variable and below market. Between May, 2013 and March, 2024, Sun Life Financial’s stock price rose +87%; relative to the market, this was a -41% loss.
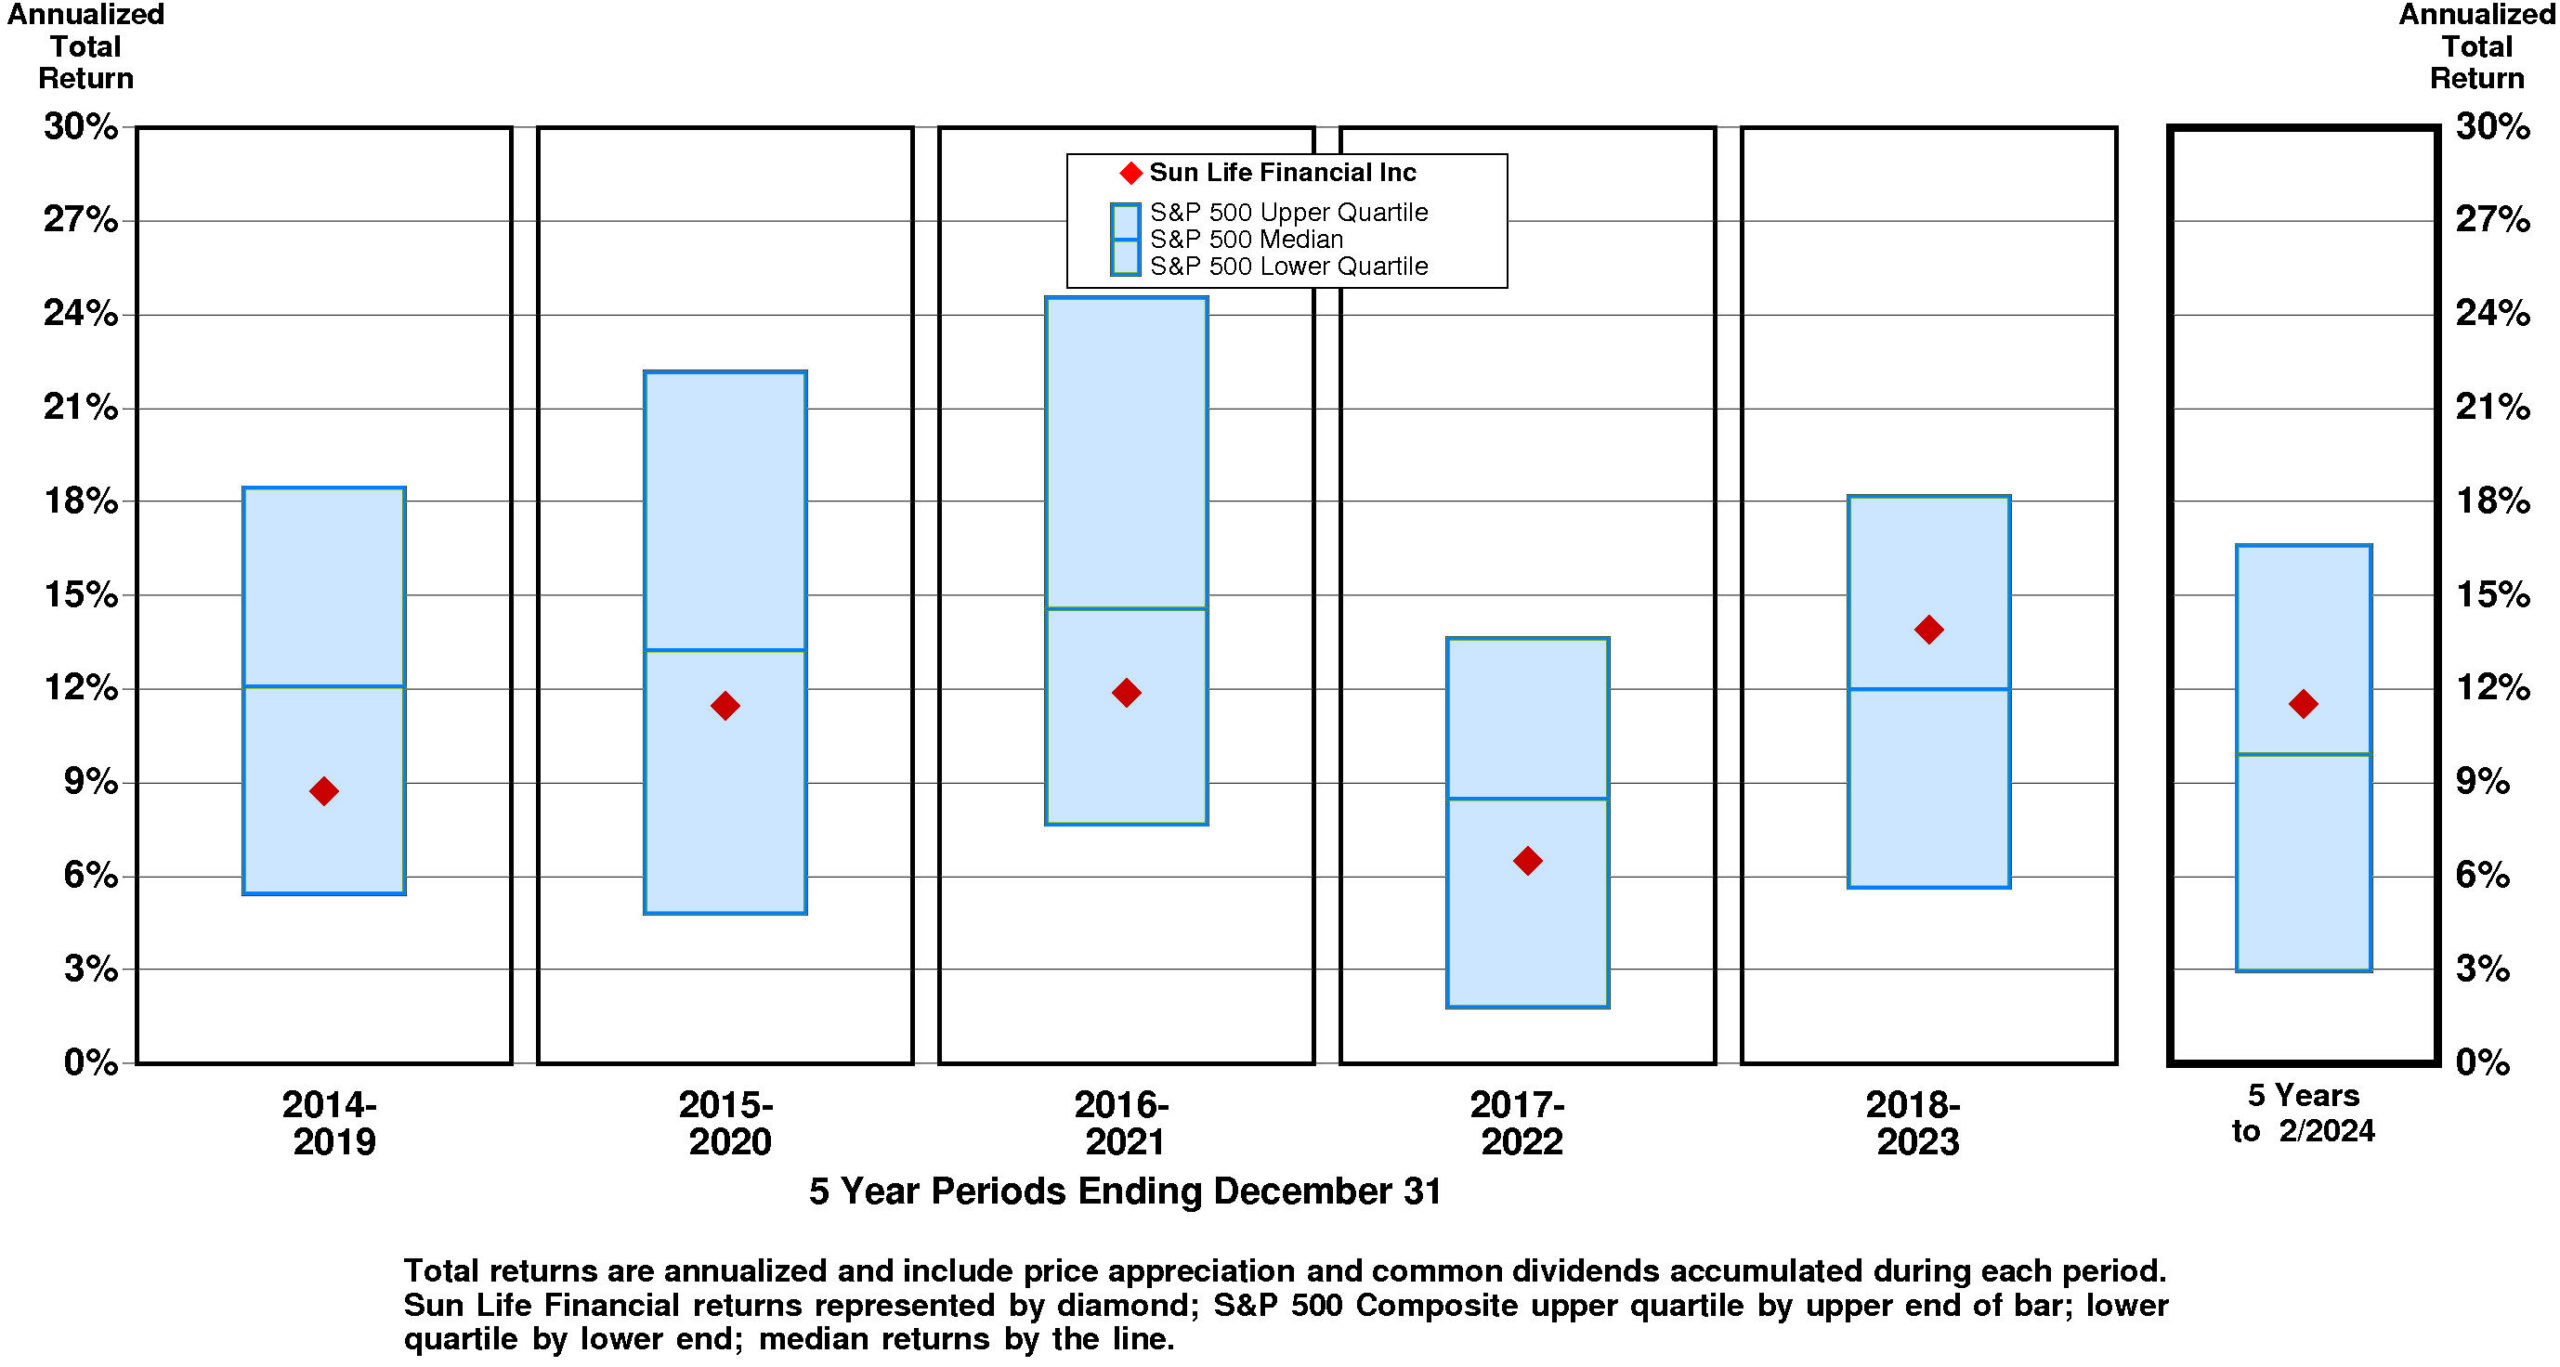
TOTAL INVESTMENT RETURNS
Current annual total return performance of 15.0% is slightly above median relative to the S&P 500 Composite.
In addition to being slightly above median relative to S&P 500 Composite, current annual total return performance through February, 2024 of 15.0% is slightly above median relative to Sun Life Financial Inc Peer Group.
Current 5-year total return performance of 11.5% is slightly above median relative to the S&P 500 Composite.
Through February, 2024, with slightly above median current 5-year total return of 11.5% relative to S&P 500 Composite, Sun Life Financial’s total return performance is slightly below median relative to Sun Life Financial Inc Peer Group.
VALUATION BENCHMARKS
Relative to S&P 500 Composite, SLF’s overall valuation is quite low. Four of five factors are lower quartile. The highest factor is the ratio of enterprise value/earnings before interest and taxes, followed by the price/equity ratio, then by the price/earnings ratio, then by the ratio of enterprise value/revenue. The lowest factor, ratio of enterprise value/assets, is lower quartile.
Relative to Sun Life Financial Peer Group, SLF’s overall valuation is normal. The highest factor, the price/equity ratio, is at the upper quartile. Ratio of enterprise value/revenue is at median. Price/earnings ratio is at median. Ratio of enterprise value/assets is slightly below median. The lowest factor, the ratio of enterprise value/earnings before interest and taxes, is below median.
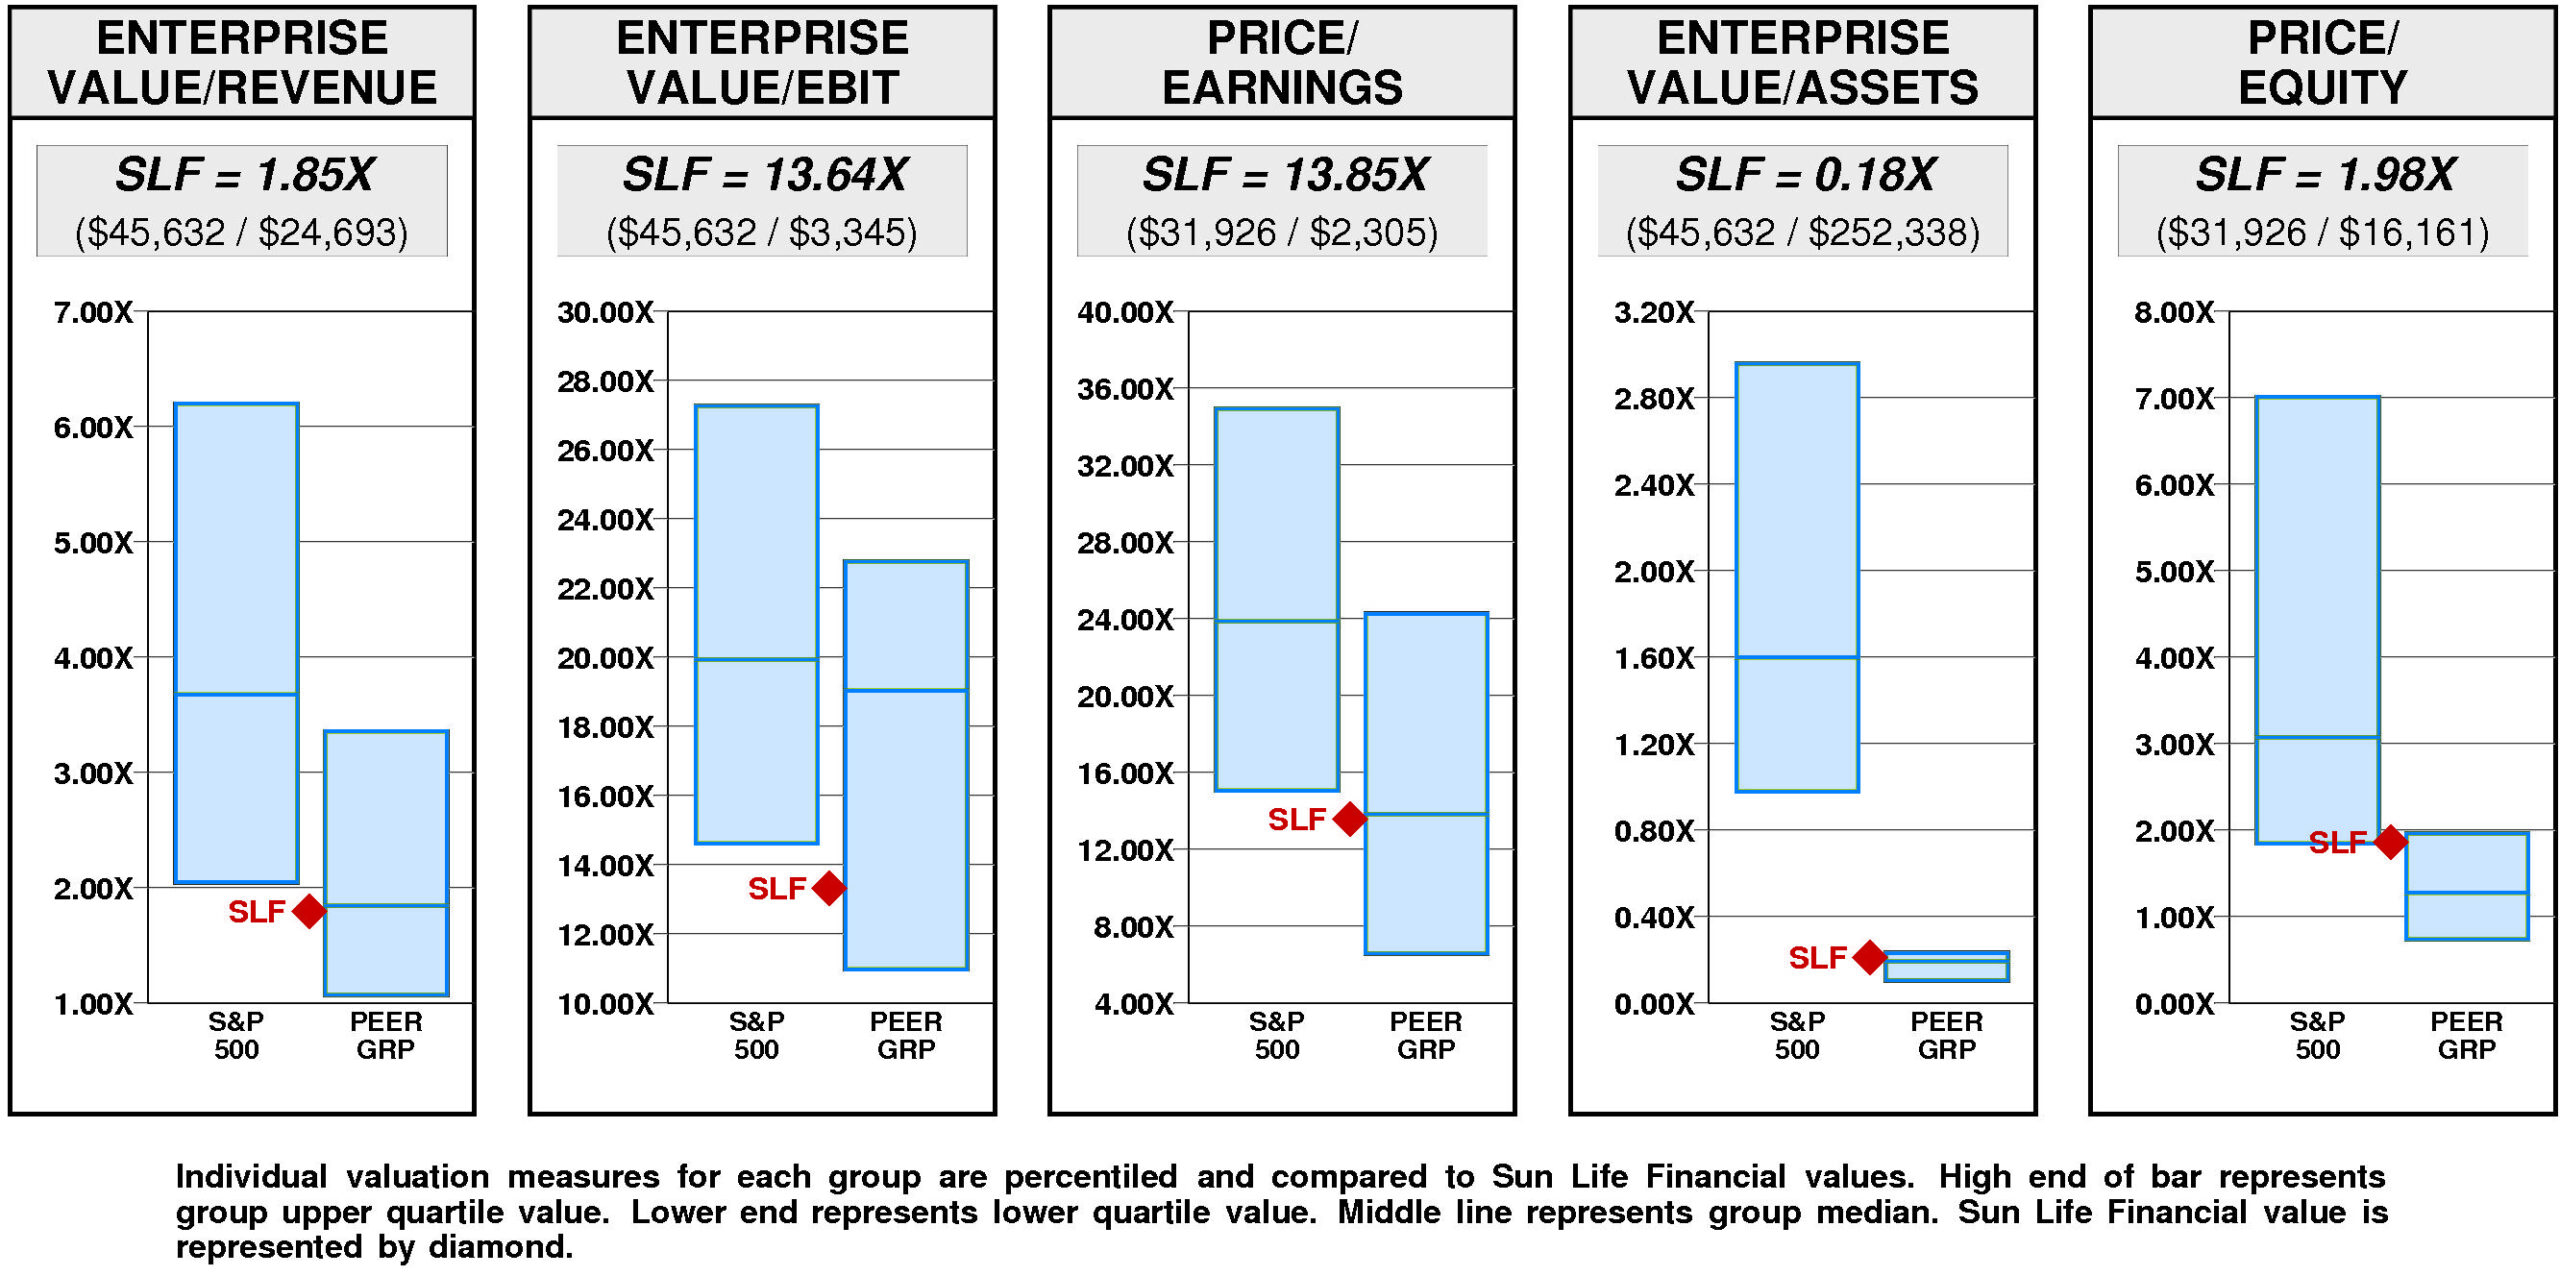
Sun Life Financial has a major value gap compared to median valuation. For SLF to fall to lower quartile valuation, its current ratio of enterprise value/revenue would have to decline from the current level of 1.85X to 1.07X. If SLF’s ratio of enterprise value/revenue were to decline to 1.07X, its stock price would be lower by $-33 to $22.
For SLF to achieve upper quartile valuation relative to the Sun Life Financial Peer Group, its current ratio of enterprise value/revenue would have to rise from the current level of 1.85X to 3.36X. If SLF’s ratio of enterprise value/revenue were to rise to 3.36X, its stock price would increase by $64 from the current level of $55.
VALUE TARGETS
SLF’s future returns on capital are forecasted to exceed the cost of capital. Accordingly, the company is expected to continue to be a major Value Builder.
Sun Life Financial’s current Price Target of $59 represents a +8% change from the current price of $54.61.
This moderately low appreciation potential results in an appreciation score of 38 (62% of the universe has greater appreciation potential.)
Notwithstanding this moderately low Appreciation Score of 38, the high Power Rating of 80 results in an Value Trend Rating of C.
Sun Life Financial’s current Price Target is $59 (-35% from the 2023 Target of $91 but +8% from the 03/19/24 price of $54.61). This dramatic fall in the Target is the result of a -3% decrease in the equity base and a -33% decrease in the price/equity multiple. The forecasted increase in cost of equity has a very large negative impact on the price/equity multiple and the forecasted decline in growth has a very large negative impact as well. Partially offsetting these Drivers, the forecasted increase in return on equity has a very large positive impact.
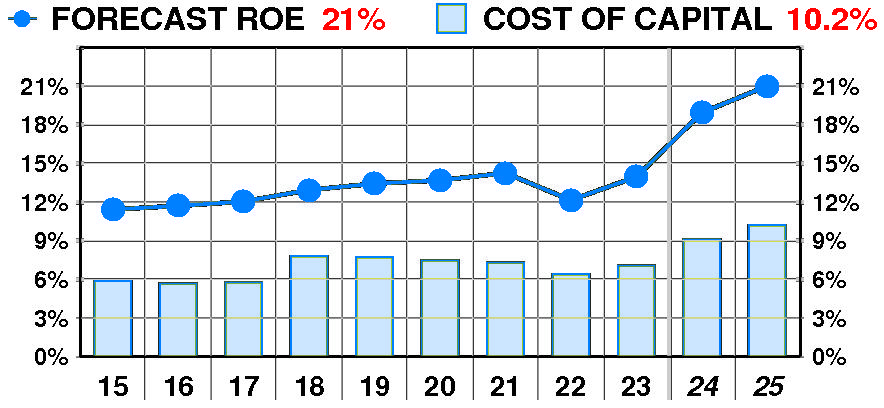
PTR’s return on equity forecast is 21.0% — above our recent forecasts. Forecasted return on equity enjoyed a dramatic, erratic increase between 2015 and 2023. The current forecast is well above the 2015 low of 11%.
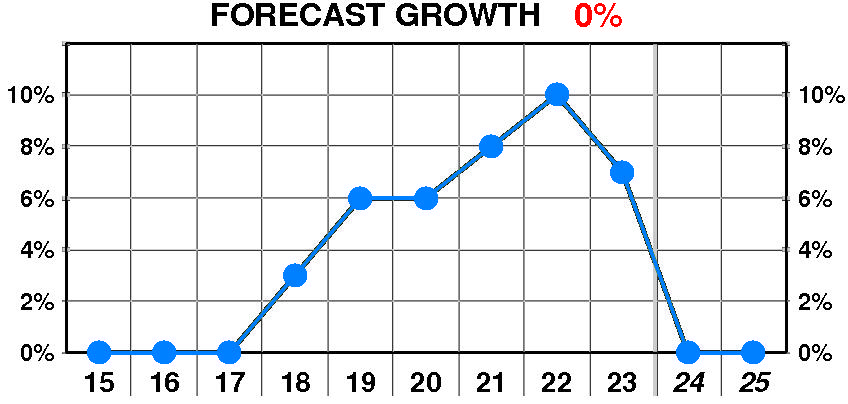
PTR’s growth forecast is 0.0% — below our recent forecasts. Forecasted growth enjoyed a dramatic, variable increase between 2018 and 2023. The current forecast is significantly below the 2022 peak of 10%.
PTR’s cost of equity forecast is 10.2% — slightly above recent levels. Forecasted cost of equity suffered a dramatic, erratic increase between 2015 and 2023. The current forecast is above the 2016 low of 5.7%.
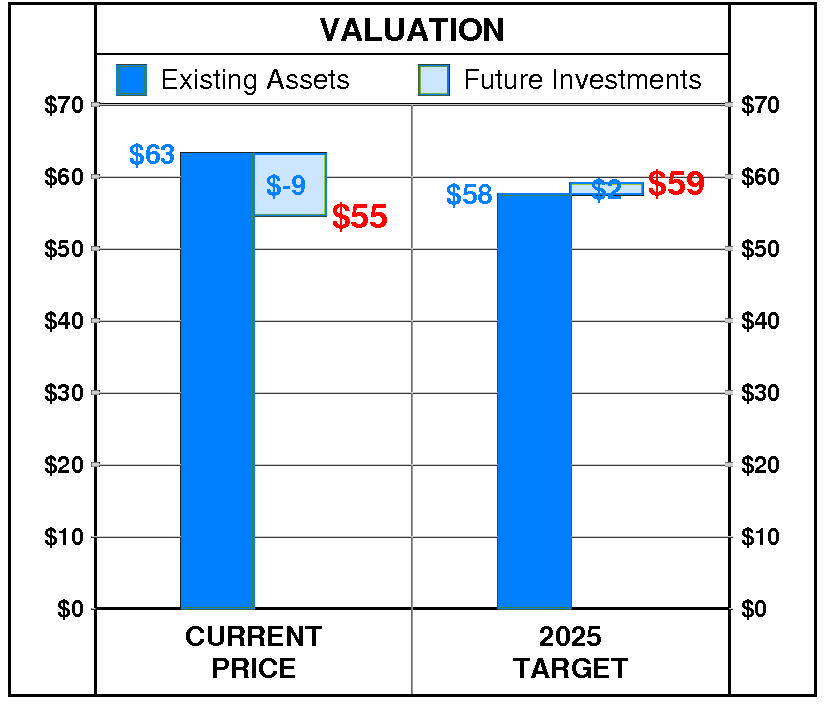
At Sun Life Financial’s current price of $54.61, investors are placing a negative value of $-9 on its future investments. This view is not supported by the company’s most recent performance that reflected a growth rate of 7.0% per year, and a return on equity of 14.0% versus a cost of equity of 7.1%.
PTR’s 2025 Price Target of $59 is based on these forecasts and reflects an estimated value of existing assets of $58 and a value of future investments of $2.
Be the first to comment