
BUSINESS
NewMarket Corporation, through its subsidiaries, engages in the petroleum additives business. The company offers lubricant additives for use in various vehicle and industrial applications, including engine oils, transmission fluids, off-road powertrain and hydraulic systems, gear oils, hydraulic oils, turbine oils, and other applications where metal-to-metal moving parts are utilized; engine oil additives designed for passenger cars, motorcycles, on and off-road heavy duty commercial equipment, locomotives, and engines in ocean-going vessels; driveline additives designed for products, such as transmission fluids, axle fluids, and off-road powertrain fluids; and industrial additives designed for products for industrial applications consisting of hydraulic fluids, grease, industrial gear fluids, and industrial specialty applications, such as turbine oils.
INVESTMENT RATING
NEU's future returns on capital are forecasted to be above the cost of capital. Accordingly, the company is expected to continue to be a major Value Builder.
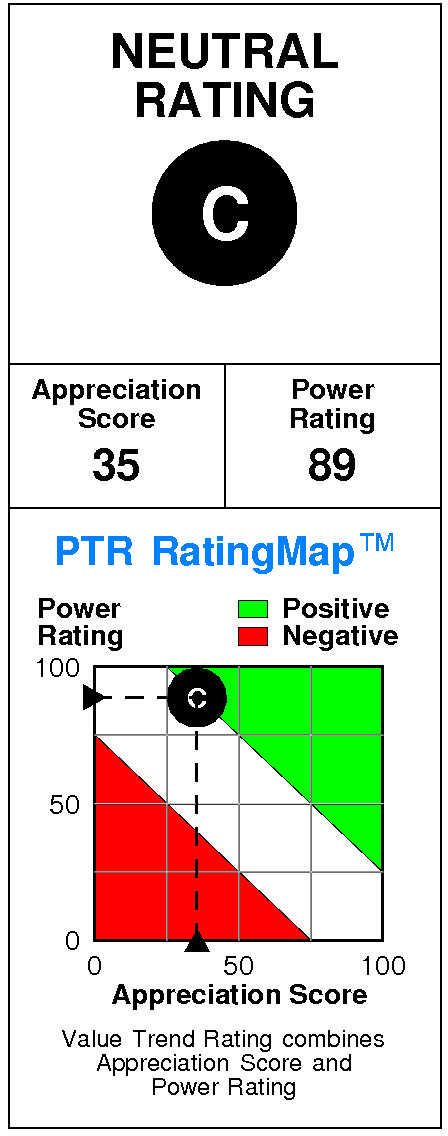
NewMarket has a current Value Trend Rating of C (High Neutral).
With this rating, PTR's two proprietary measures of a stock's current attractiveness are providing very contradictory signals. NewMarket has a slightly negative Appreciation Score of 35 but a very high Power Rating of 89, leading to the High Neutral Value Trend Rating.
NewMarket's stock is selling at targeted value.
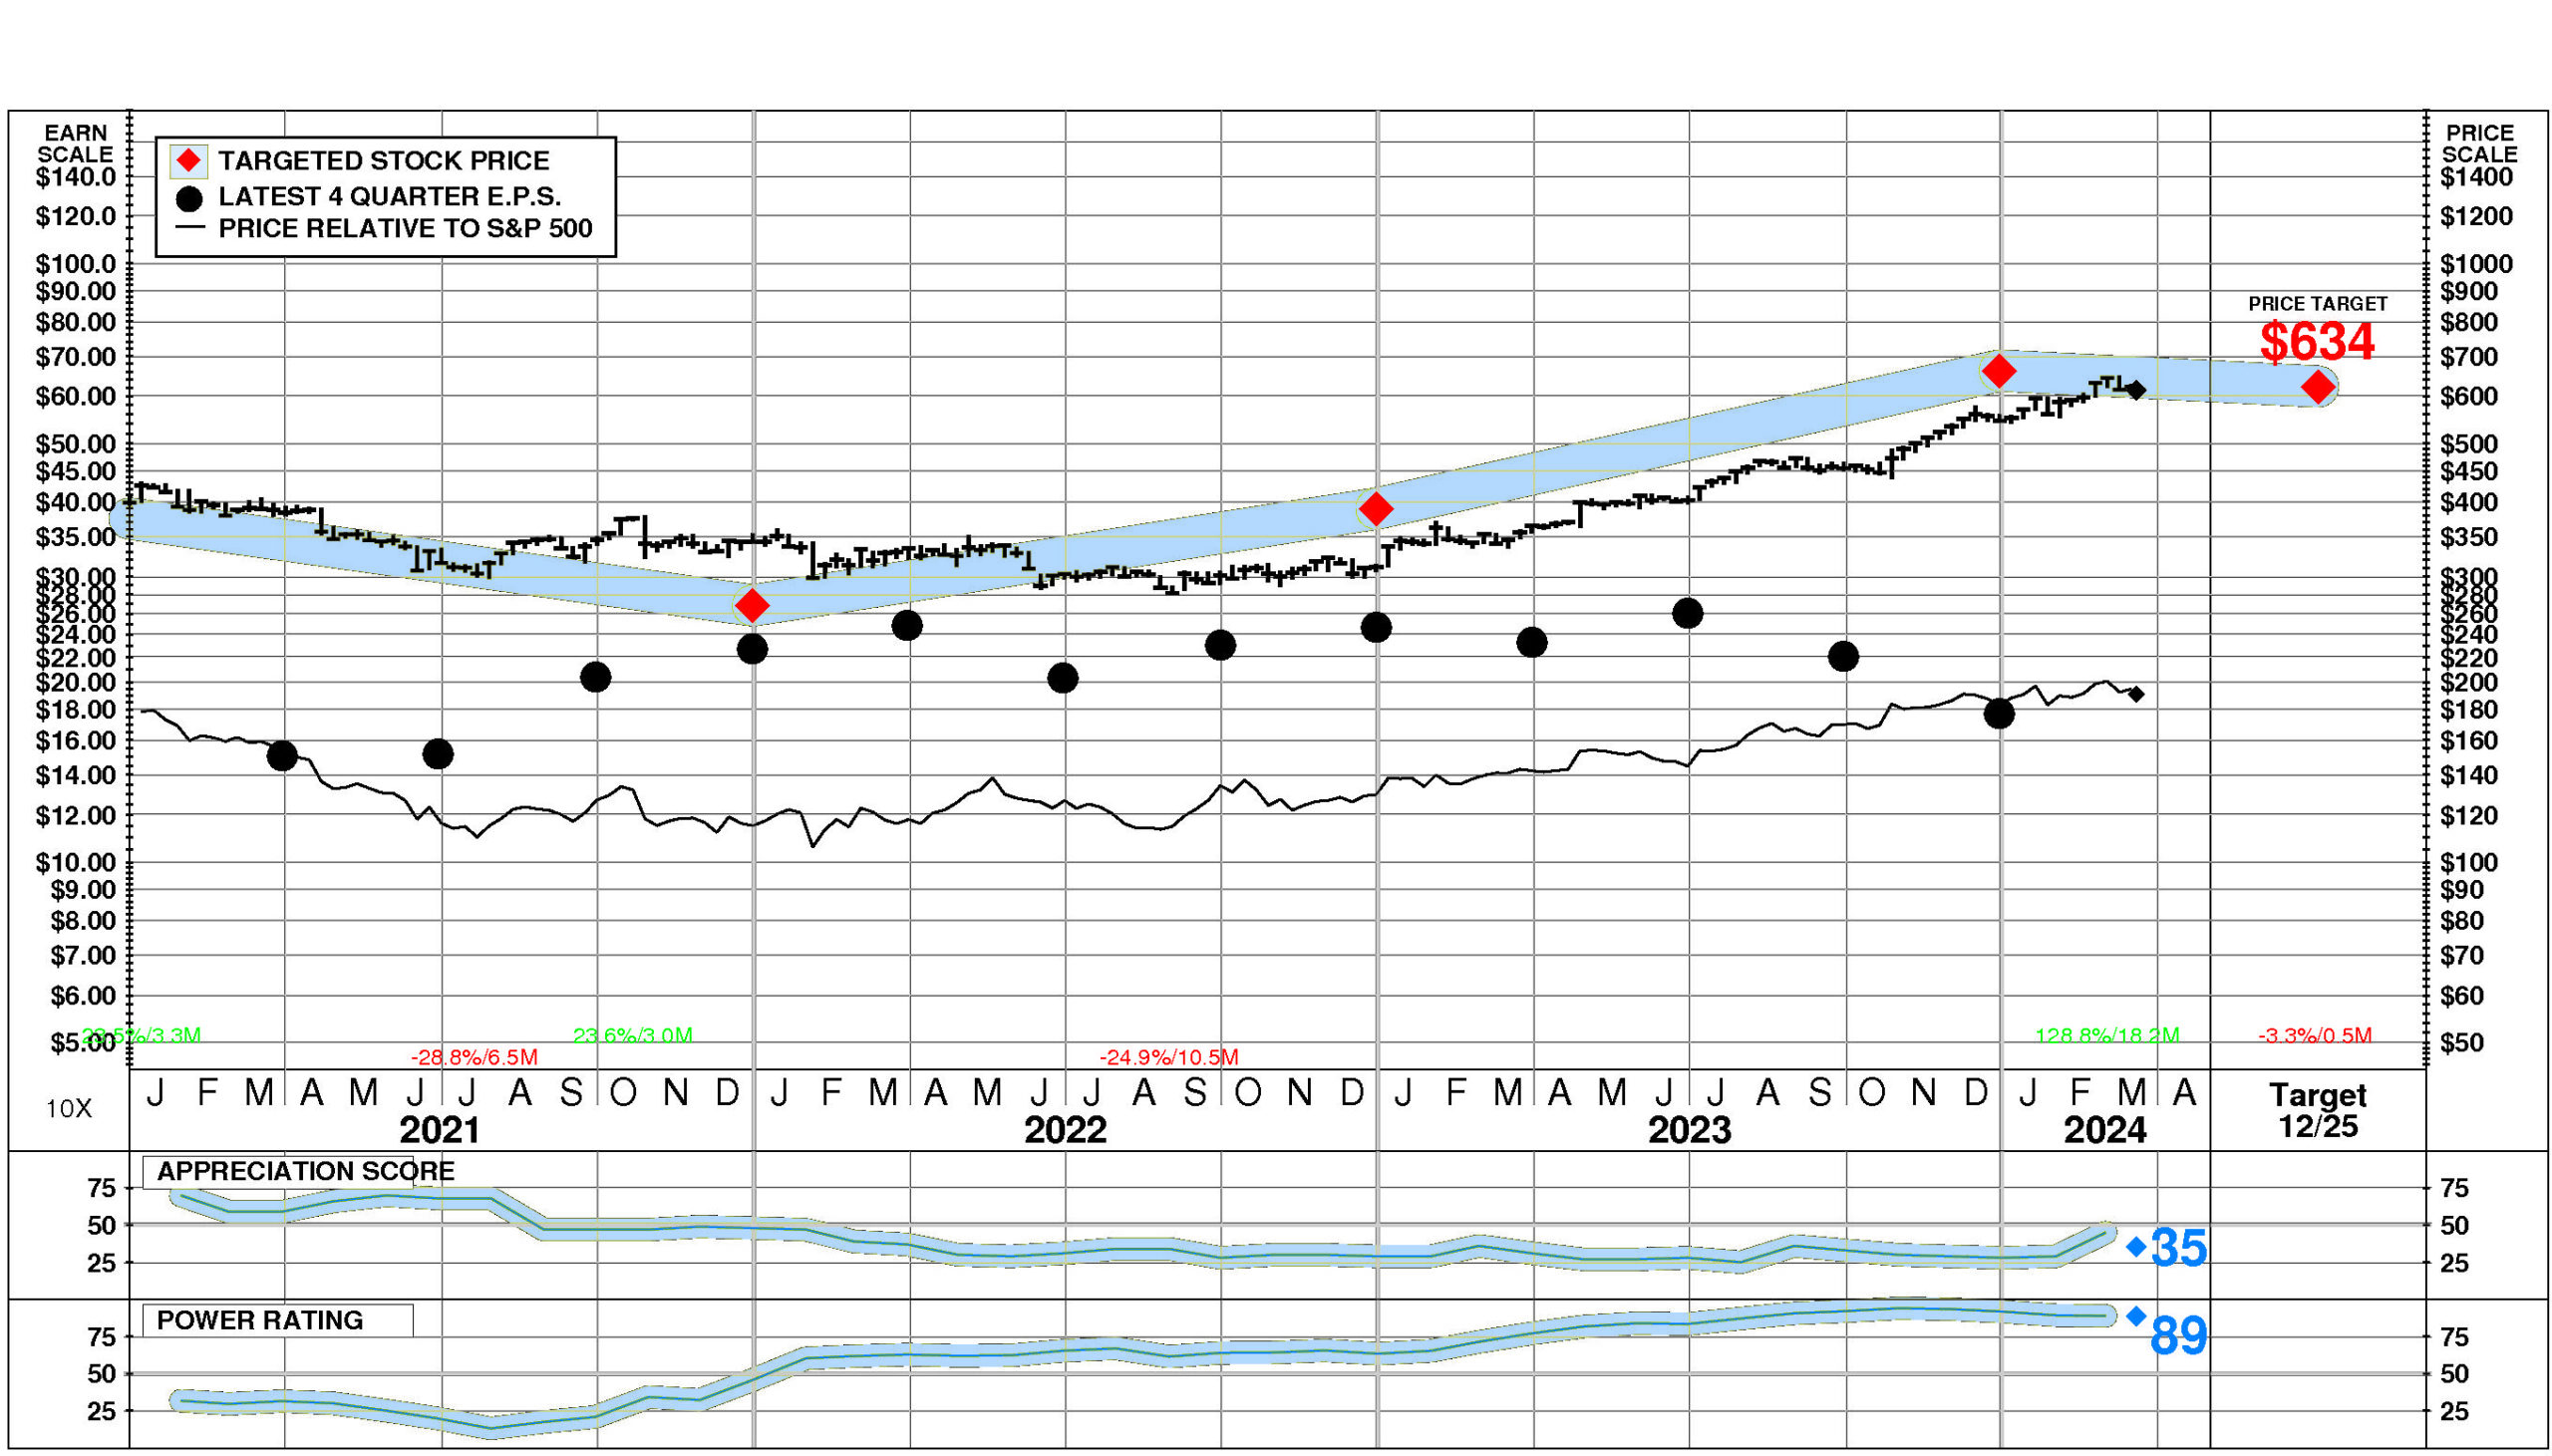
The current stock price of $615.20 compares to targeted value 12 months forward of $623.
This moderately low appreciation potential results in an appreciation score of 35 (65% of the universe has greater appreciation potential.)
NewMarket has a Power Rating of 89.
(NEU's very high Power Rating indicates that it has a higher likelihood of achieving favorable investment performance over the near to intermediate term than all but 11% of companies in the universe.)
Contributing to this very high Power Rating: recent price action has been extremely favorable. An offsetting factor is the Industrial Organic Chemicals comparison group is in a slightly weakened position currently.
INVESTMENT PROFILE
NewMarket's financial strength is high. Financial strength rating is 87.
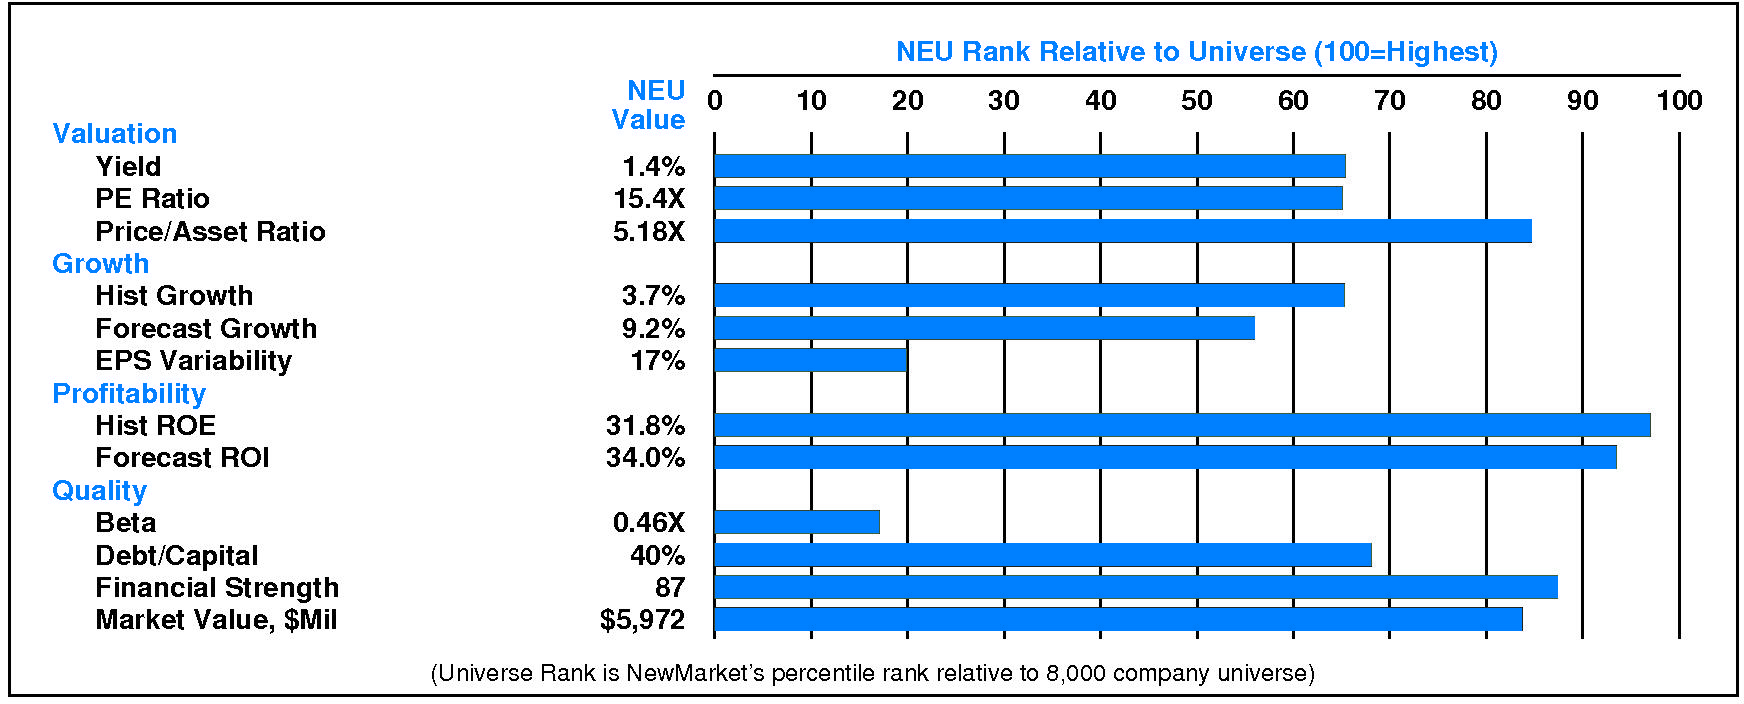
Relative to the S&P 500 Composite, NewMarket Corp has moderate Growth characteristics; its appeal is likely to be to Capital Gain-oriented investors; the perception is that NEU is lower risk.
All factors are relative strengths. NewMarket's valuation is moderate: moderate dividend yield, moderate P/E ratio, and moderate price/book ratio. NEU has unusually low market capitalization.
CURRENT SIGNALS
NewMarket's current operations are strong.
Return on equity is rising, reflecting: improving asset utilization; widening pretax margins; rising tax keep rate; and rising leverage.
NewMarket's current technical position is very strong.
The stock price is in a 18.2 month up move. The stock has appreciated 128.8% from its prior low. The stock price is above its 200 day moving average which is in an uptrend.
ALERTS
Recent meaningful negative changes in investment behavior have impacted NewMarket Corp (NYSE: NEU): negative upside/downside volume developed.
The stock is currently rated C.
On 3/18/24, NewMarket Corp (NYSE: NEU) stock declined modestly by -1.2%, closing at $615.20. However, trading volume in this decline was unusually low at 62% of normal. The stock has been exceptionally strong relative to the market over the last nine months but is unchanged during the last week.
CASH FLOW
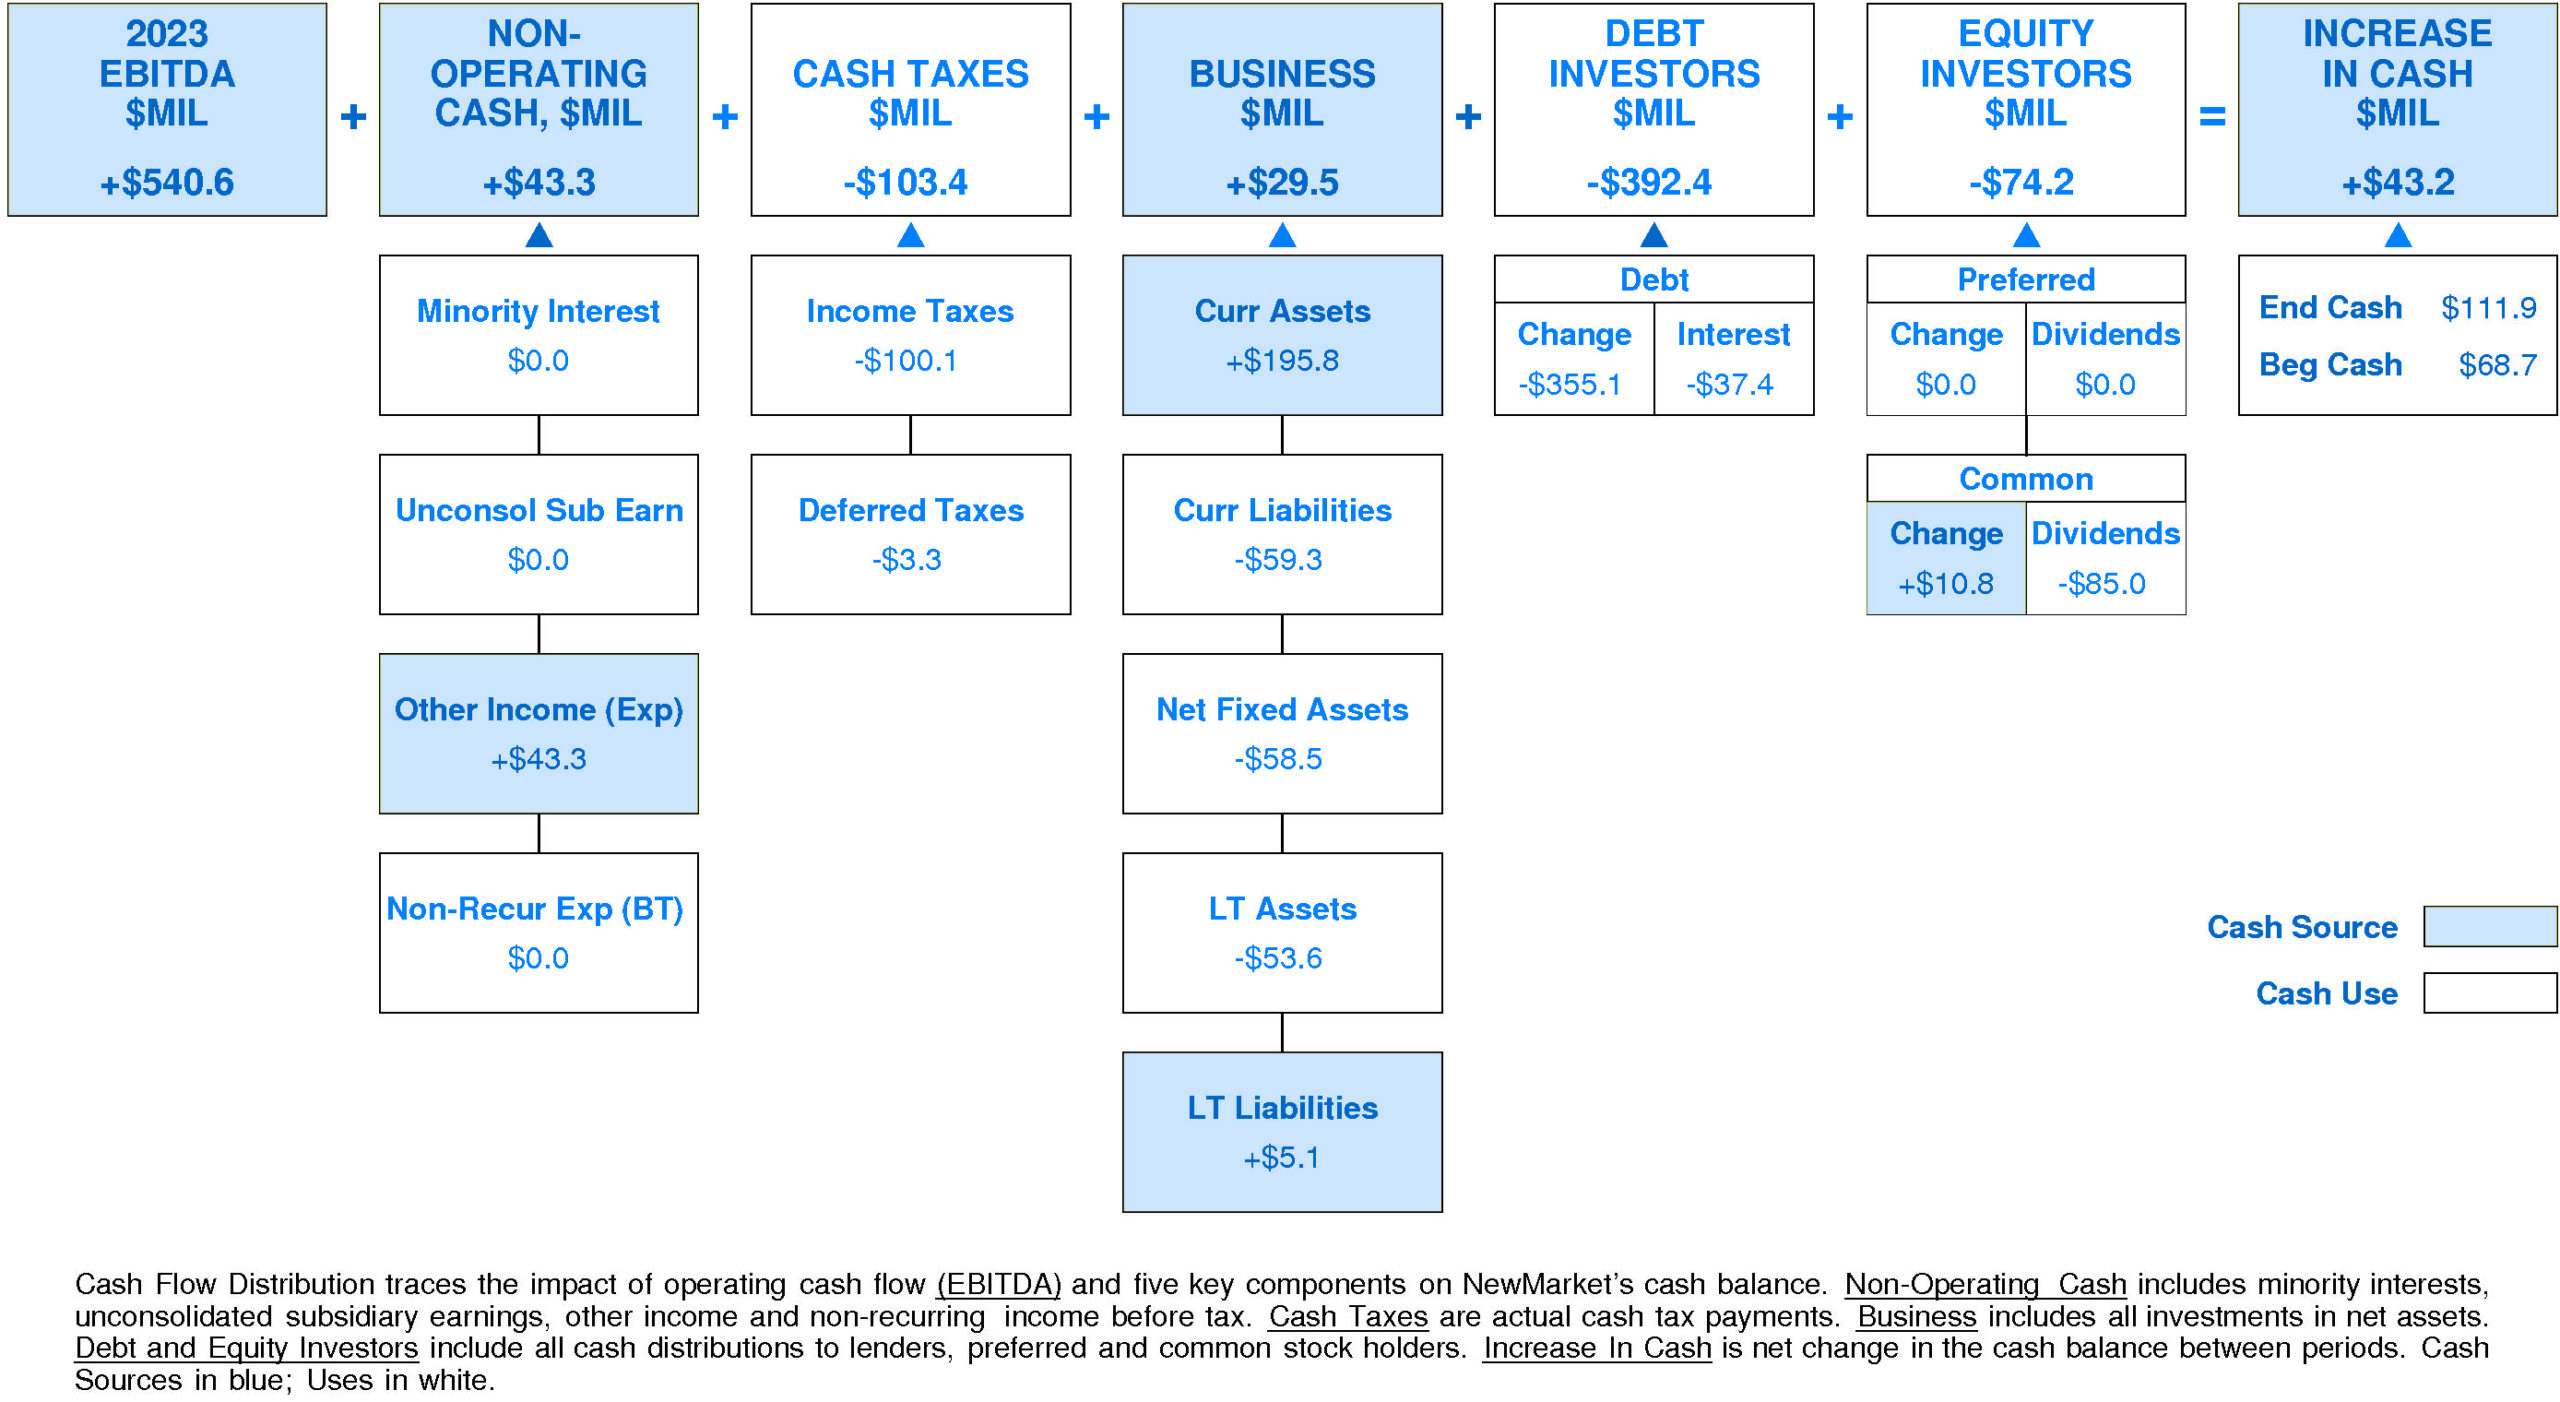
In 2023, NewMarket generated a very significant increase in cash of +$43.2 million (+63%). Sources of cash were much larger than uses.
Cash generated from 2023 EBITDA totaled +$540.6 million. Non-operating sources contributed +$43.3 million (+8% of EBITDA). Cash taxes consumed -$103.4 million (-19% of EBITDA). Withdrawal of investment from the business totaled +$29.5 million (+5% of EBITDA). On a net basis, debt investors removed -$392.4 million (-73% of EBITDA) while equity investors received -$74.2 million (-14% of EBITDA).
NewMarket's Non-operating Income, %EBITDA has exhibited a very small overall uptrend over the period.
This improvement was accompanied by stability for the Newmarket Peer Group. In most years, NewMarket was in the top quartile and second quartile. Currently, NewMarket is upper quartile at +8% of EBITDA (+$43.3 million).
NewMarket's Cash Taxes, %EBITDA has exhibited a very small overall uptrend over the period.
This improvement was accompanied by a similar trend for the Newmarket Peer Group. In most years, NewMarket was in the second quartile and top quartile. Currently, NewMarket is at the lower quartile at -19% of EBITDA (-$103.4 million).
NewMarket's Business Re-investment, %EBITDA has experienced a downtrend over the period.
This downtrend was accompanied by a similar trend for the Newmarket Peer Group. (Since 2021 Business Re-investment, %EBITDA has experienced a very sharp recovery.) In most years, NewMarket was in the second quartile and top quartile. Currently, NewMarket is substantially above median at +5% of EBITDA (+$29.5 million).
NewMarket's Debt Investors, %EBITDA has experienced a volatile overall downtrend over the period.
This downtrend was accompanied by a similar trend for the Newmarket Peer Group. (Since 2021 Debt Investors, %EBITDA has accelerated very sharply.) In most years, NewMarket was in the top quartile and lower quartile. Currently, NewMarket is lower quartile at -73% of EBITDA (-$392.4 million).
NewMarket's Equity Investors, %EBITDA has enjoyed a volatile overall uptrend over the period.
This improvement was accompanied by a similar trend for the Newmarket Peer Group. In most years, NewMarket was in the third quartile and top quartile. Currently, NewMarket is upper quartile at -14% of EBITDA (-$74.2 million).
NewMarket's Change in Cash, %EBITDA has exhibited a volatile overall uptrend over the period.
This improvement was accompanied by an opposite trend for the Newmarket Peer Group. In most years, NewMarket was in the top quartile and lower quartile. Currently, NewMarket is above median at +8% of EBITDA (+$43.2 million).
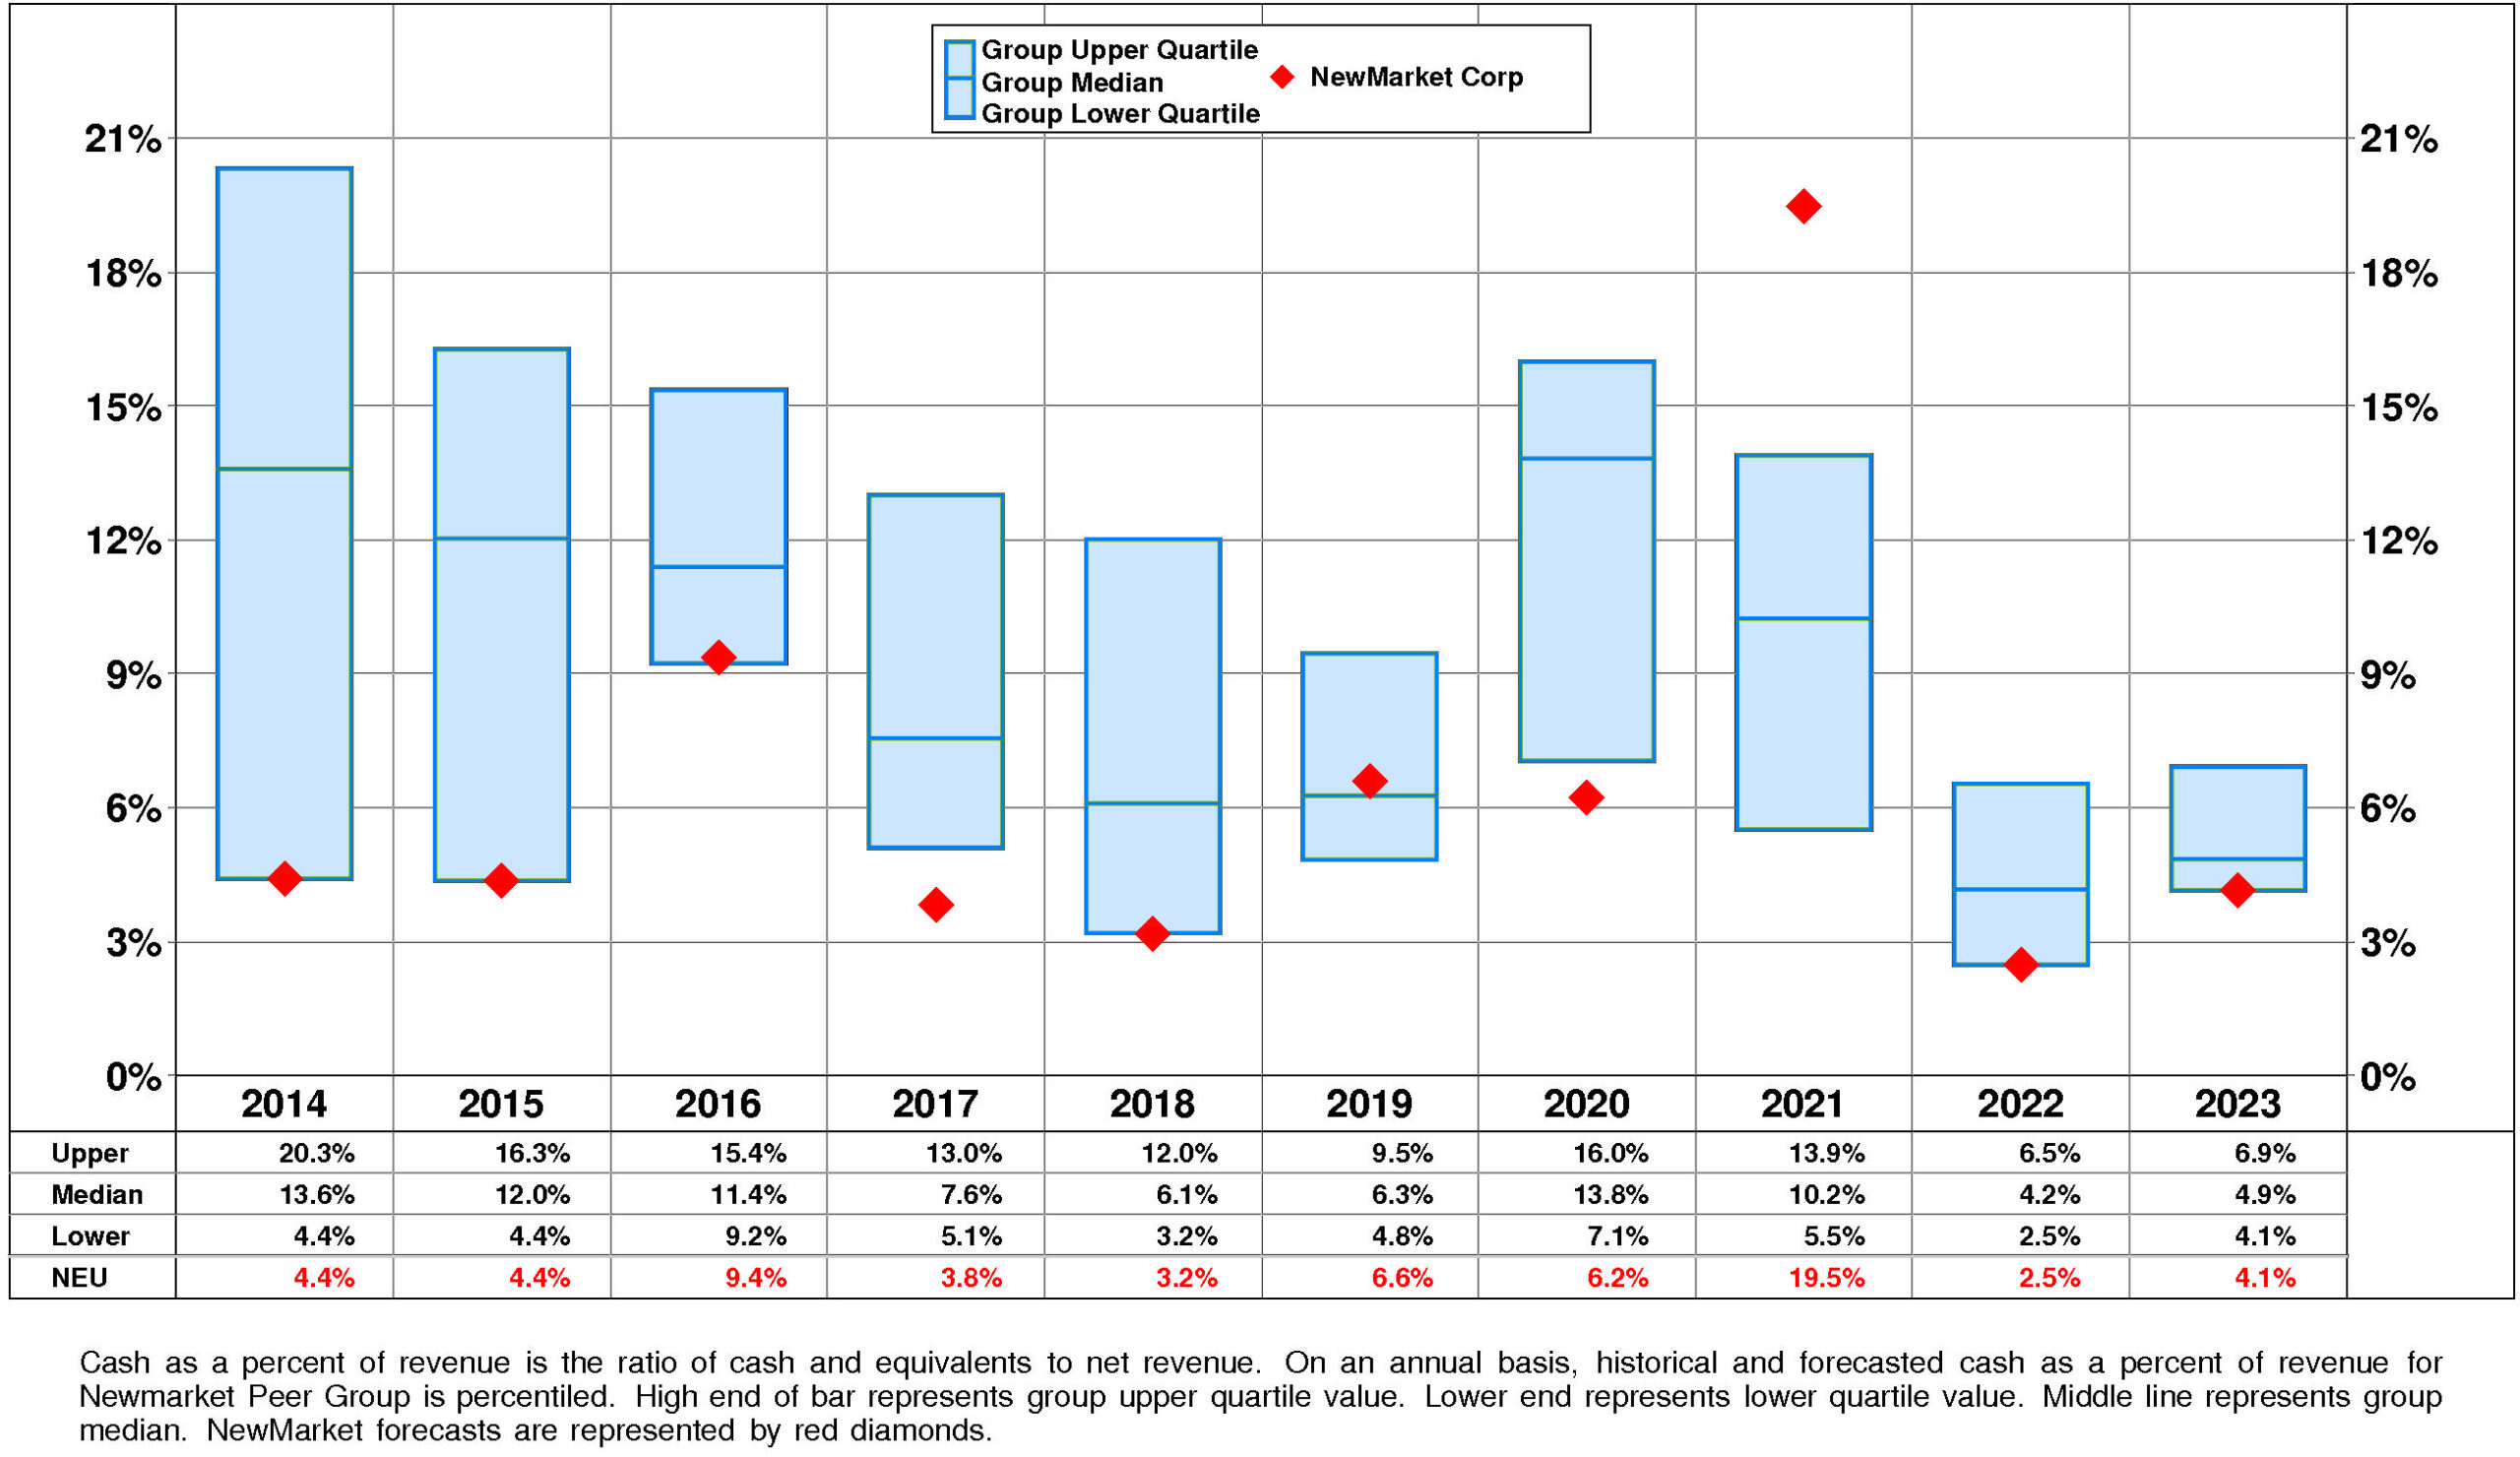
NewMarket's Cash, %Revenue has exhibited little to no overall change over the period.
This stability was accompanied by a downtrend for the Newmarket Peer Group. In most years, NewMarket was in the third quartile and top quartile. Currently, NewMarket is at the lower quartile at +4%.
PROFITABILITY
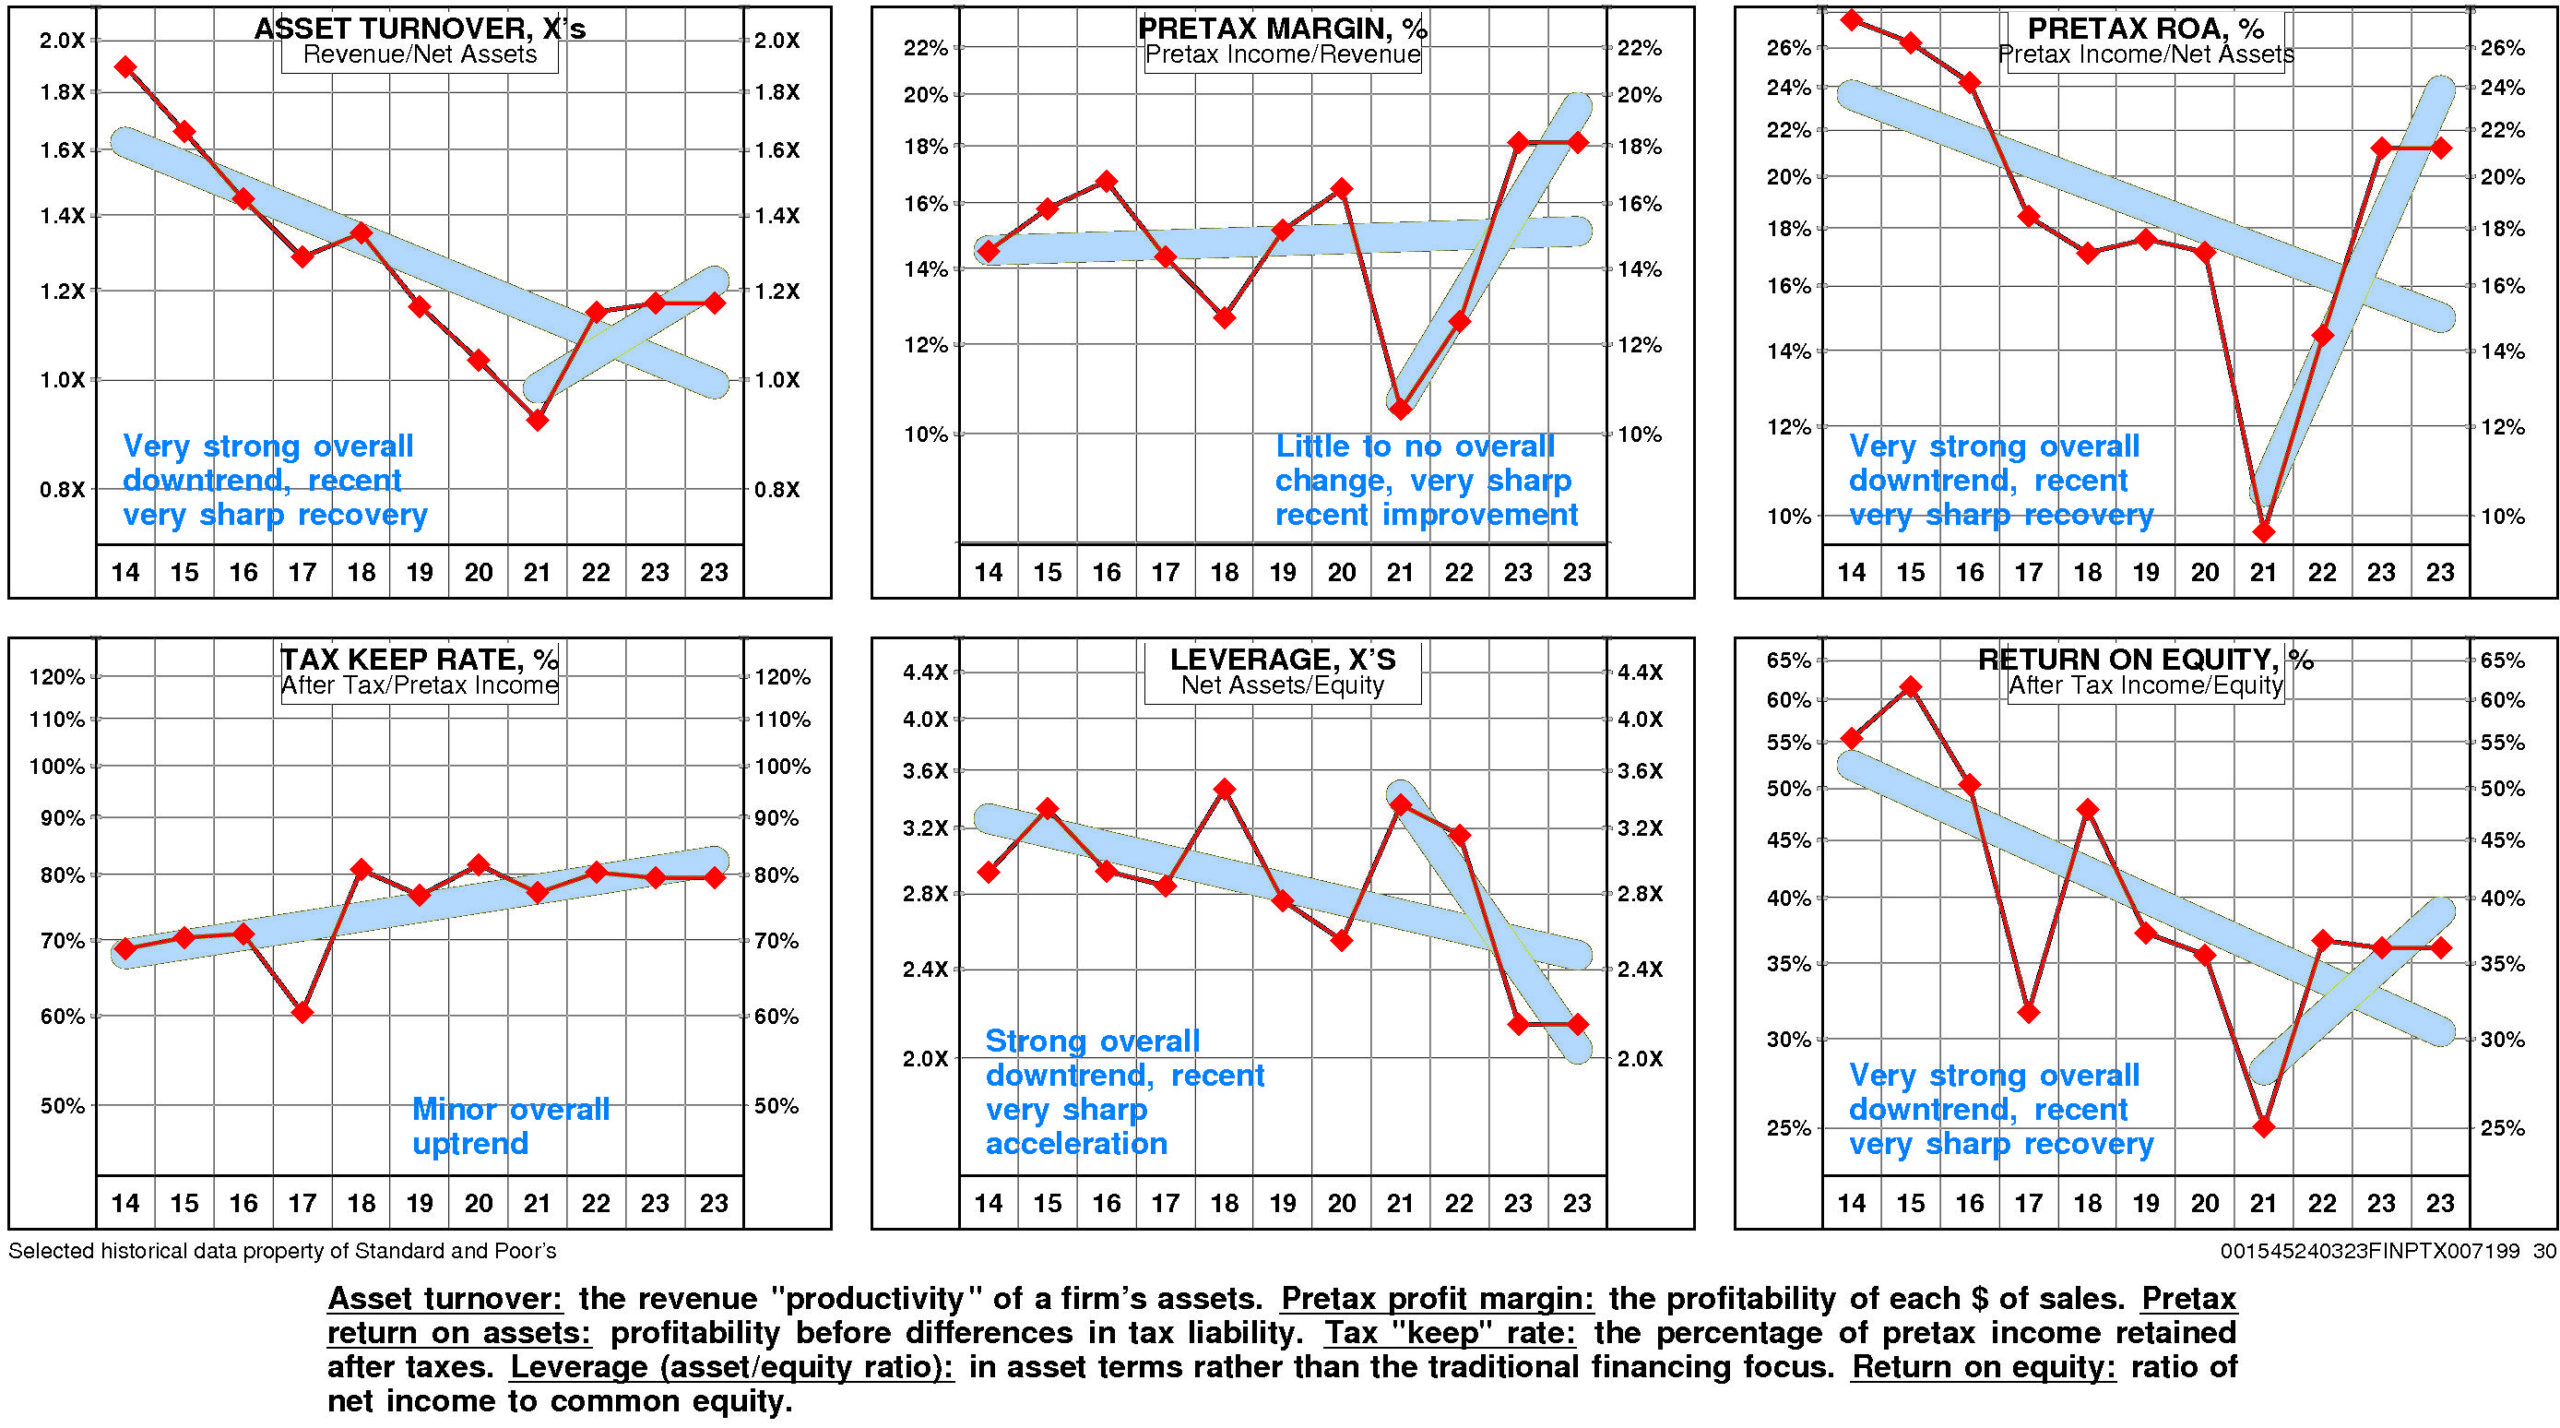
NewMarket's return on equity has eroded very significantly since 2014. The current level of 36.1% is 1.14X the low for the period and is -34.8% from the high.
This very significant erosion was due to very strong negative trend in pretax operating return and very small negative trend in non-operating factors.
The productivity of NewMarket's assets declined over the full period 2014-2023: asset turnover has suffered a very strong overall downtrend even as it experienced a very sharp recovery after the 2021 low.
Additionally, pretax margin has exhibited little to no overall change but it experienced very sharp improvement from the 2021 level.
Non-operating factors (income taxes and financial leverage) had a very small negative influence on return on equity.
NewMarket's return on equity is upper quartile (36.1%) for the four quarters ended December, 2023.
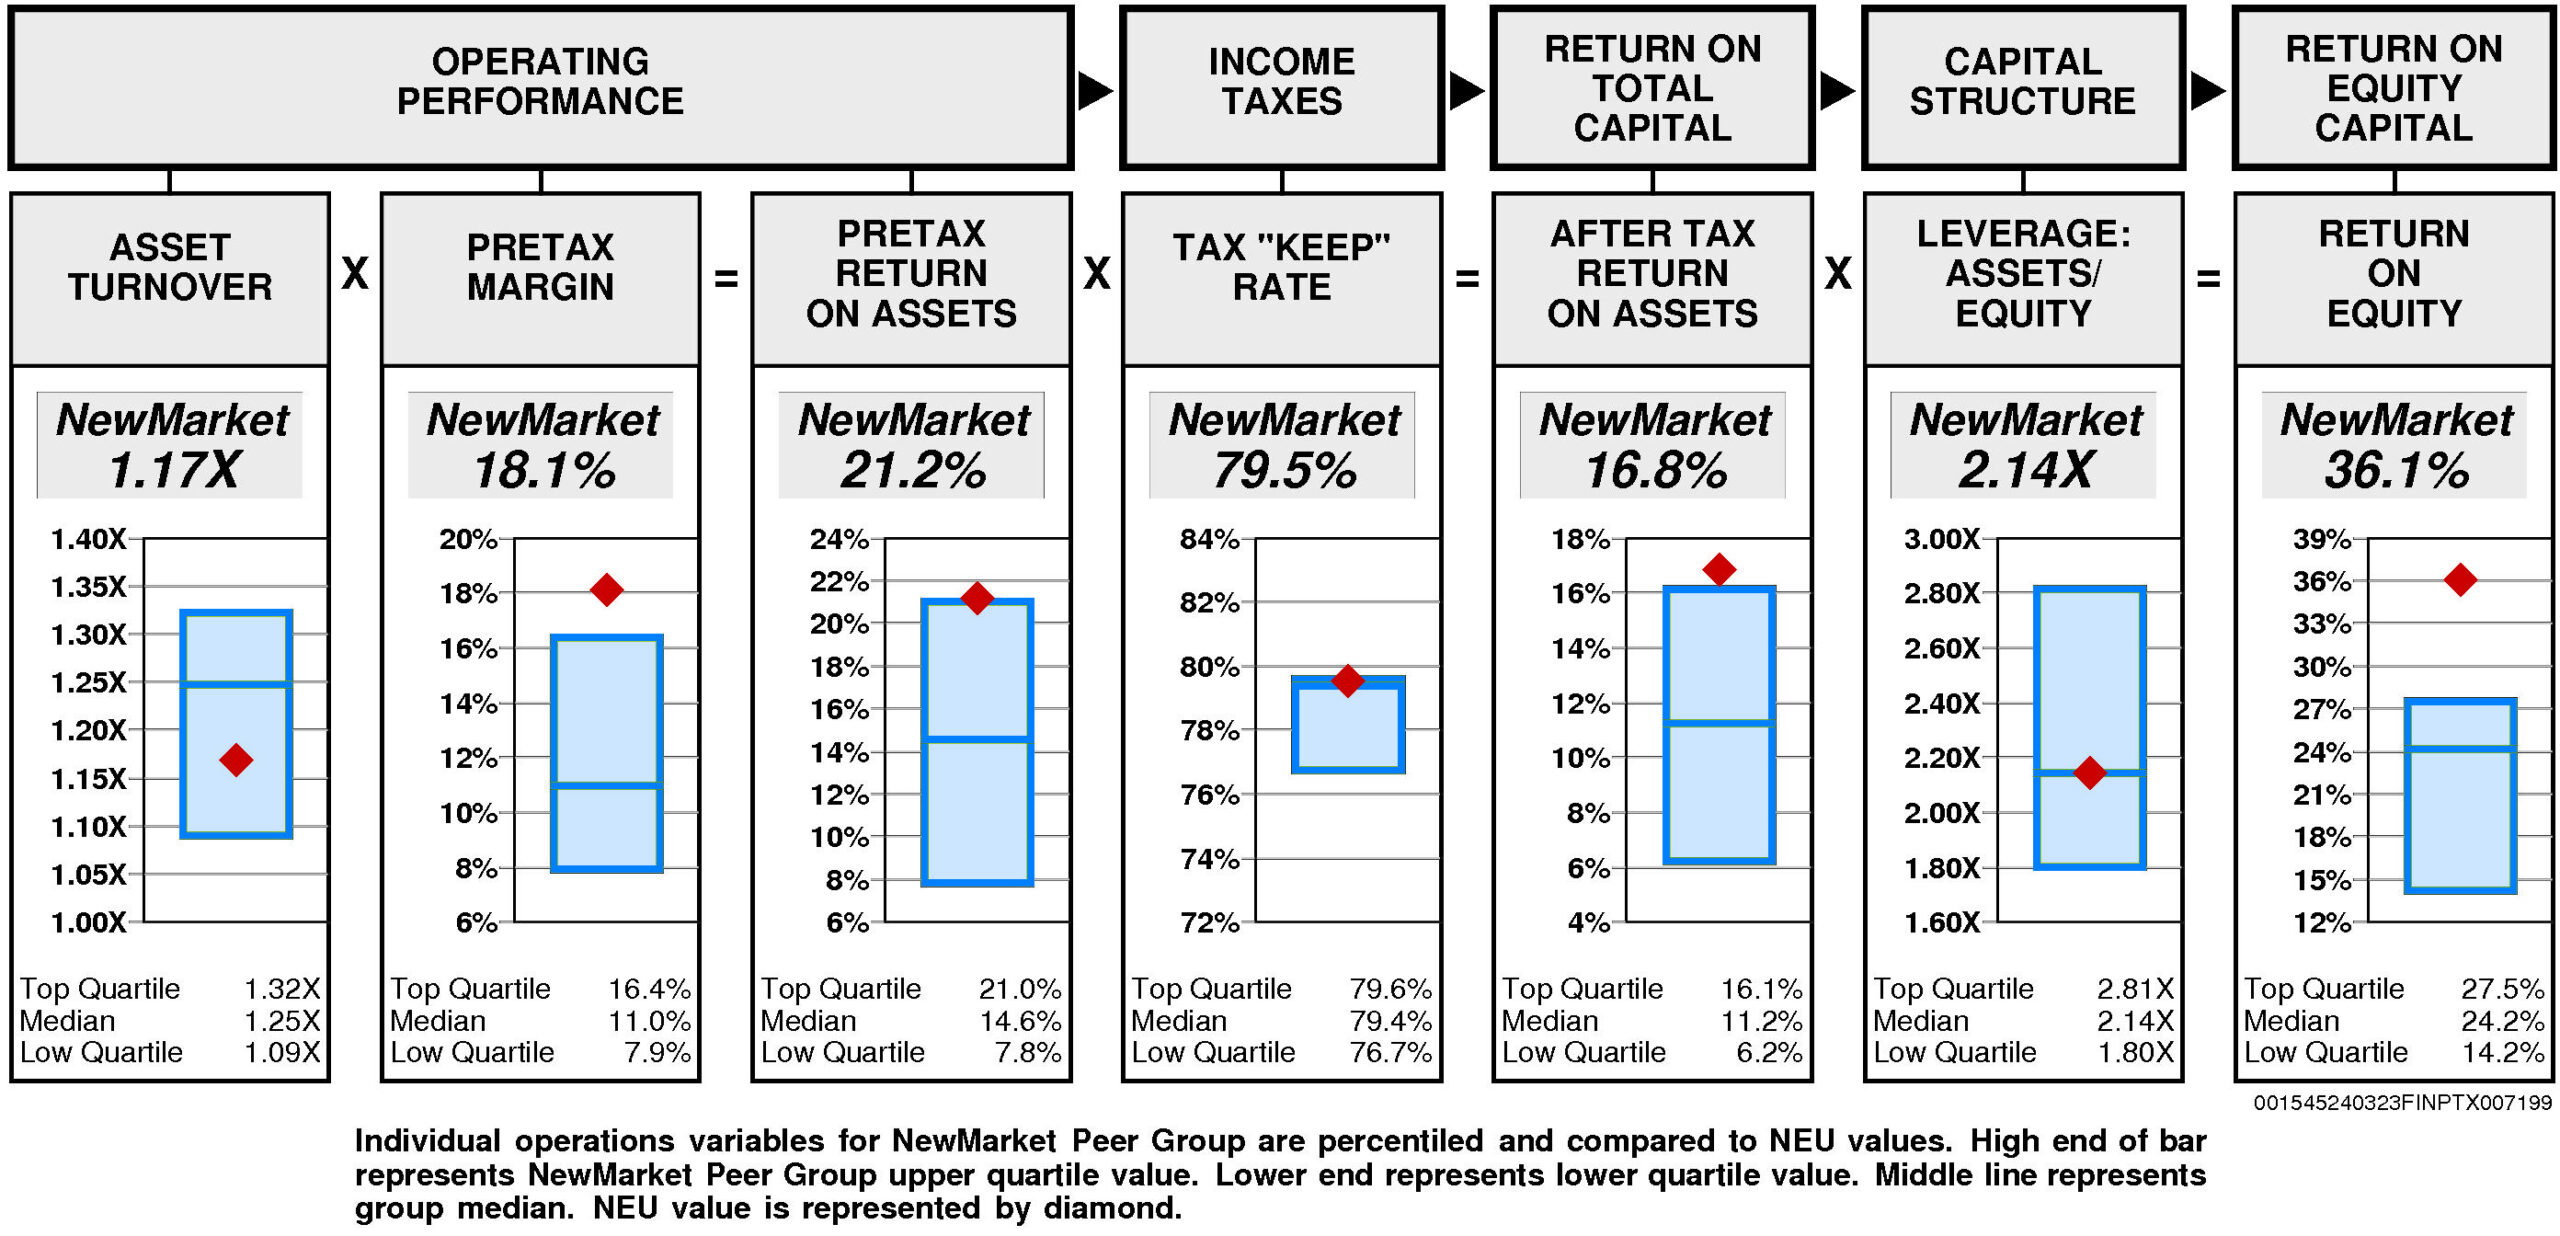
Operating performance (pretax return on assets) is at the upper quartile (21.2%) reflecting asset turnover that is below median (1.17X) and upper quartile pretax margin (18.1%).
Tax “keep” rate (income tax management) is at the upper quartile (79.5%) resulting in after tax return on assets that is upper quartile.
Financial leverage (leverage) is at median (2.14X).
GROWTH RATES
Overall, NewMarket's growth rate has slowed considerably in recent years.
NewMarket's historical income statement growth has been in line with balance sheet growth. Revenue growth has paralleled asset growth; earnings growth has paralleled equity growth.
Annual revenue growth
has been 4.9% per year.
Total asset growth
has been 10.2% per year. (More recently it has been -3.3%.)
Annual E.P.S. growth
has been 7.7% per year. (More recently it has been 33.4%.)
Equity growth
has been 13.3% per year.
No consensus growth rate forecast is available for NewMarket.
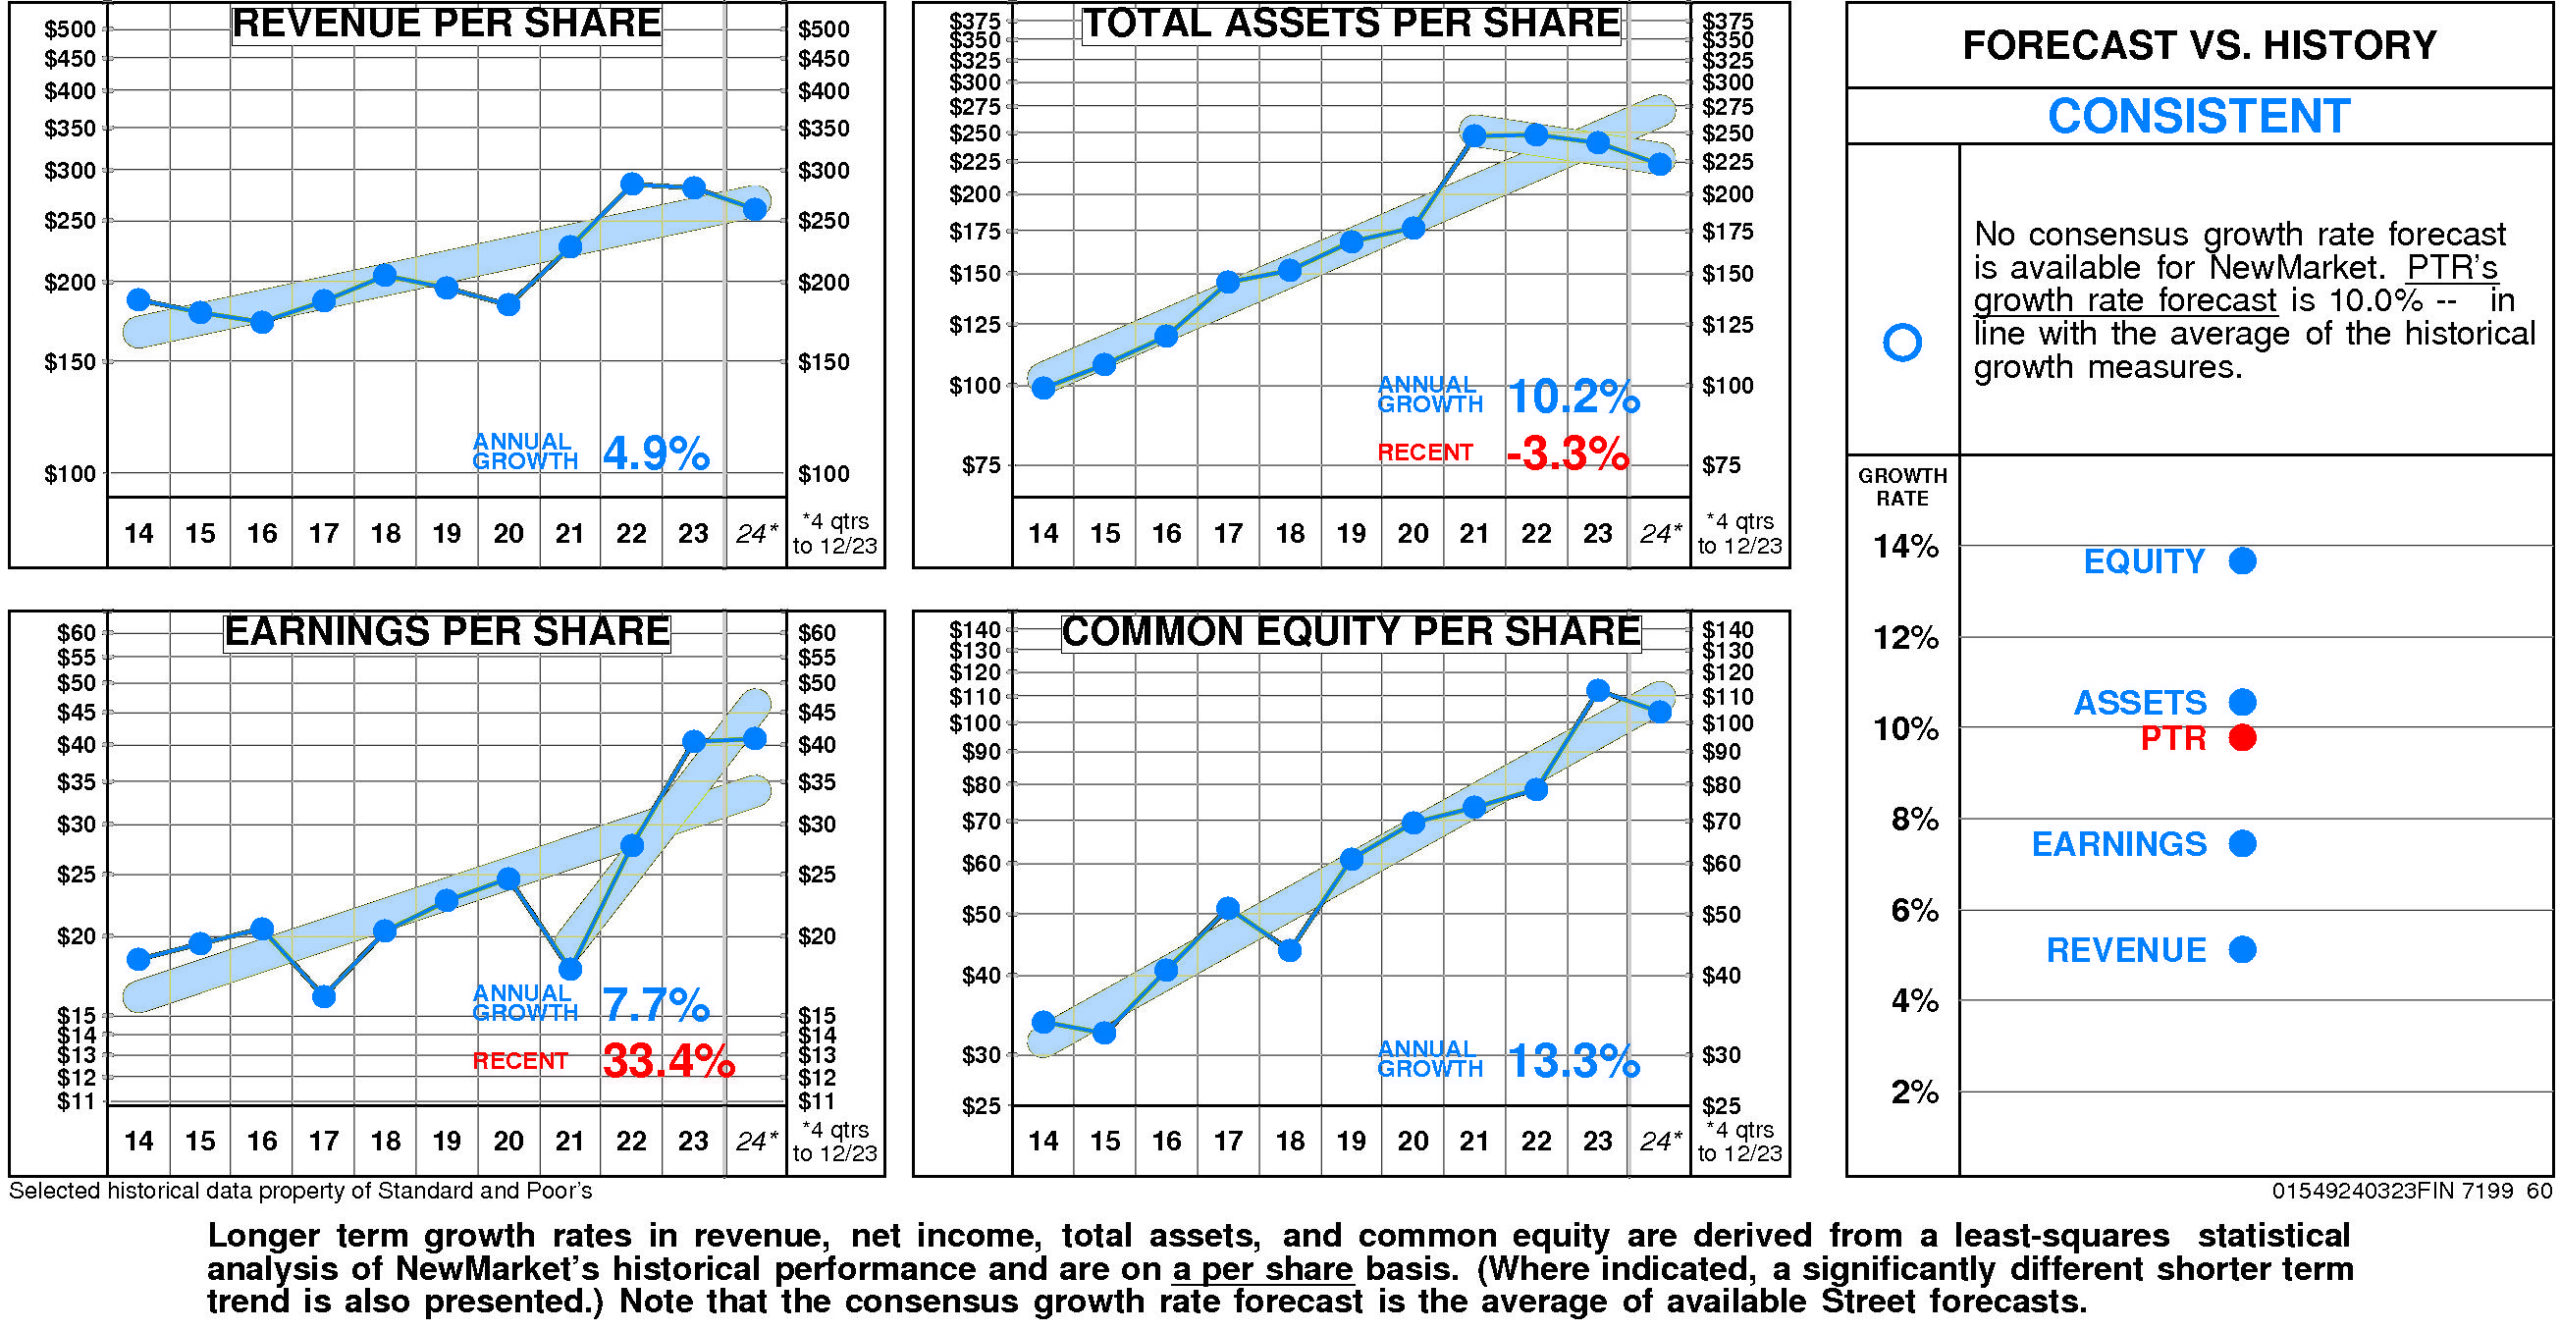
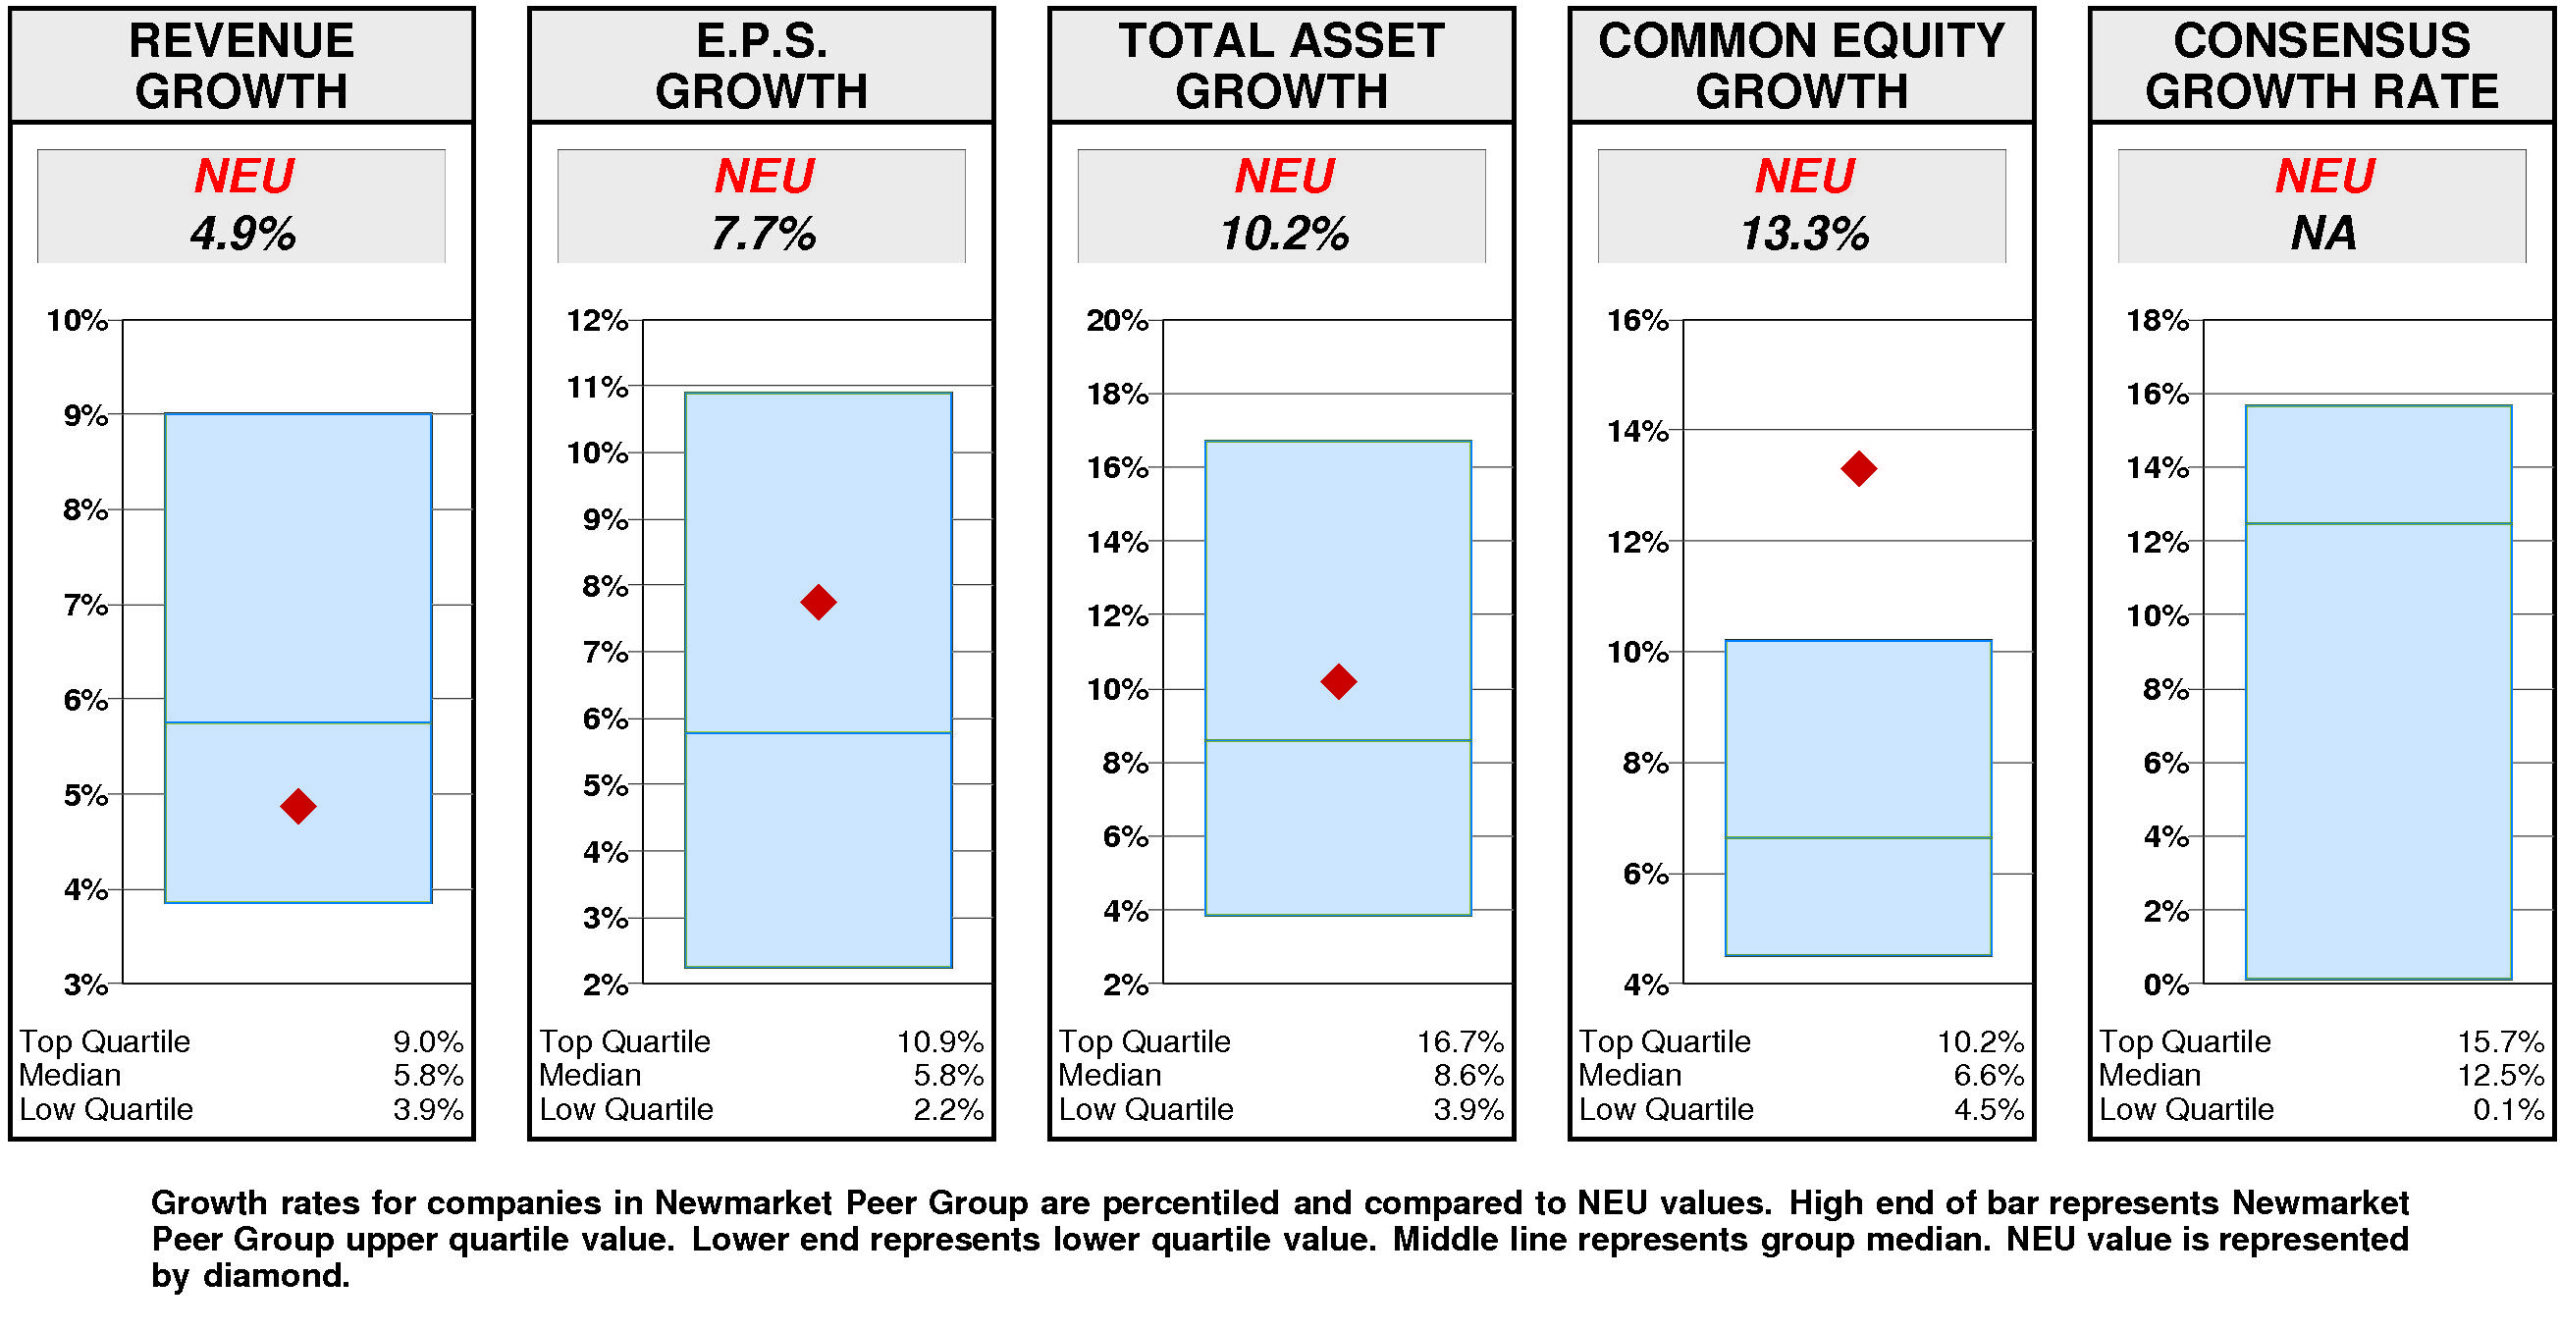
Relative to the Newmarket Peer Group, NewMarket's historical growth measures are erratic.
Equity growth (13.3%) has been upper quartile. Total asset growth (10.2%) has been slightly above median. E.P.S. growth (7.7%) has been above median. Revenue growth (4.9%) has been below median.
Consensus growth forecast is unavailable.
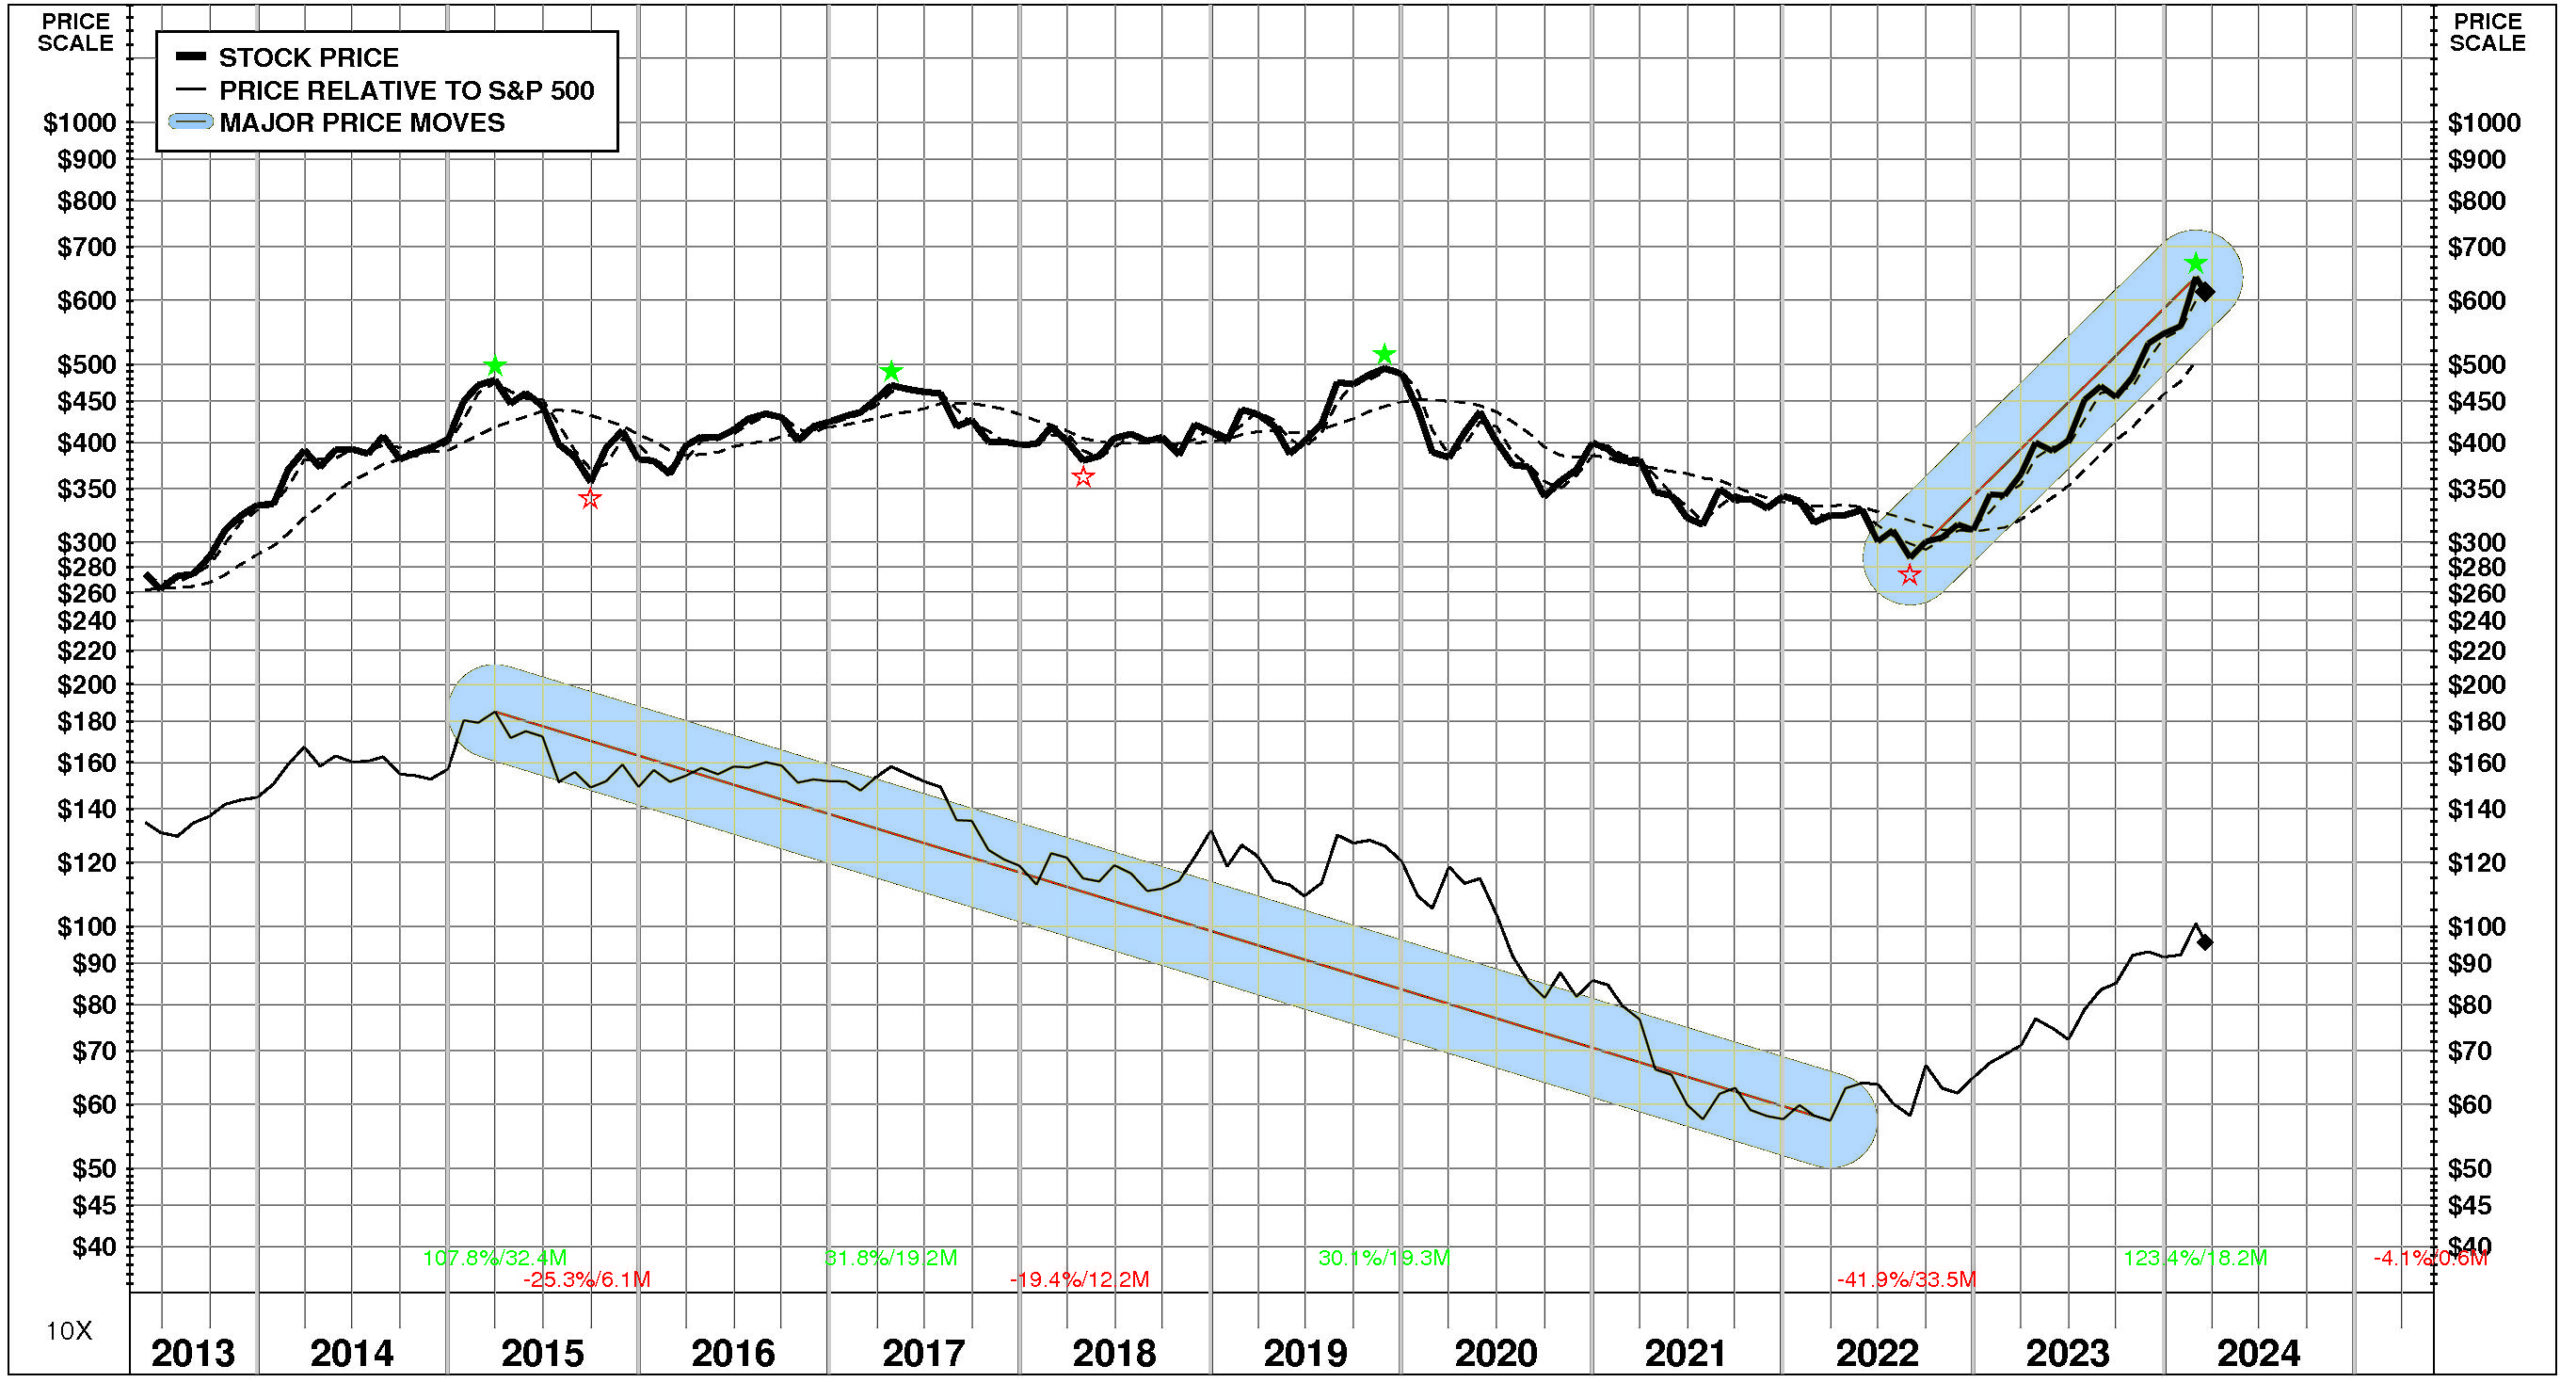
PRICE HISTORY
Over the full time period, NewMarket's stock price performance has been below market.
Between May, 2013 and March, 2024, NewMarket's stock price rose +124%; relative to the market, this was a -29% loss. Significant price move during the period: 1) August, 2022 – February, 2024: +123%.
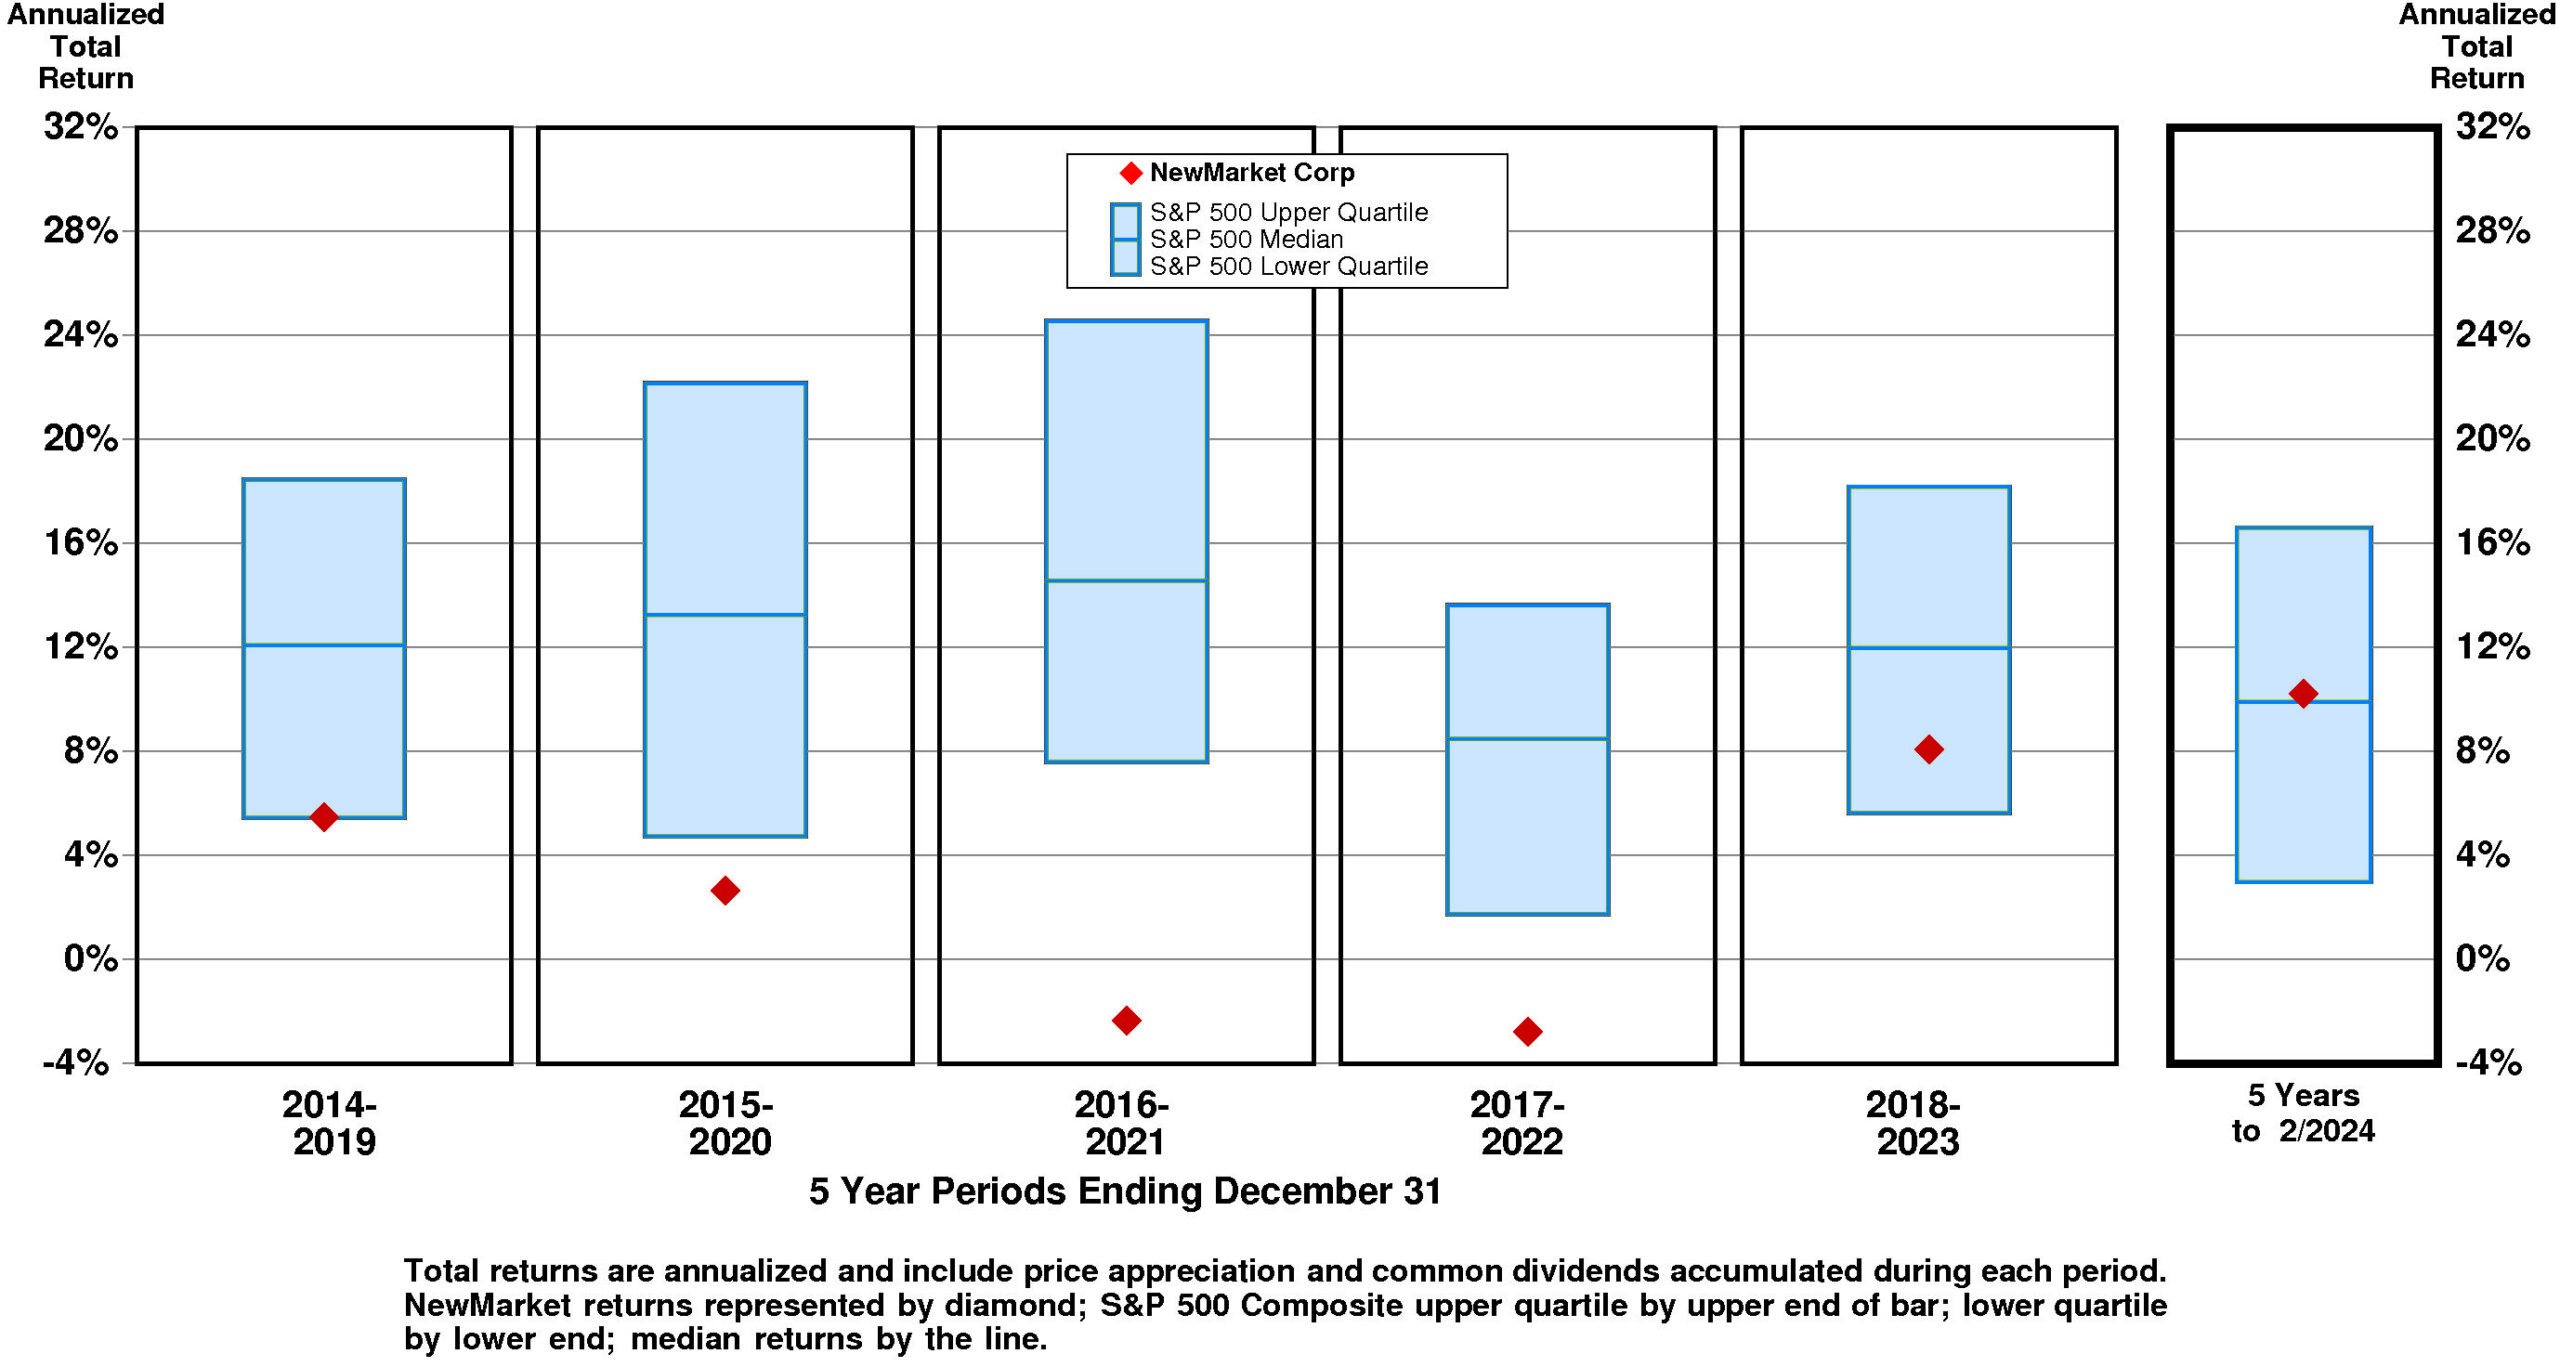
TOTAL INVESTMENT RETURNS
Current annual total return performance of 90.7% is upper quartile relative to the S&P 500 Composite.
In addition to being upper quartile relative to S&P 500 Composite, current annual total return performance through February, 2024 of 90.7% is upper quartile relative to NewMarket Corp Peer Group.
Current 5-year total return performance of 10.2% is slightly above median relative to the S&P 500 Composite.
Through February, 2024, with slightly above median current 5-year total return of 10.2% relative to S&P 500 Composite, NewMarket's total return performance is at the upper quartile relative to NewMarket Corp Peer Group.
VALUATION BENCHMARKS
Relative to S&P 500 Composite, NEU's overall valuation is low.
The highest factor, the ratio of enterprise value/assets, is near the upper quartile. Price/equity ratio is above median. Ratio of enterprise value/revenue is near the lower quartile. Price/earnings ratio is at the lower quartile. The lowest factor, the ratio of enterprise value/earnings before interest and taxes, is lower quartile.
Relative to NewMarket Peer Group, NEU's overall valuation is low.
The highest factor, the ratio of enterprise value/revenue, is at median. Ratio of enterprise value/assets is at median. Price/equity ratio is slightly below median. Ratio of enterprise value/earnings before interest and taxes is lower quartile. The lowest factor, the price/earnings ratio, is lower quartile.
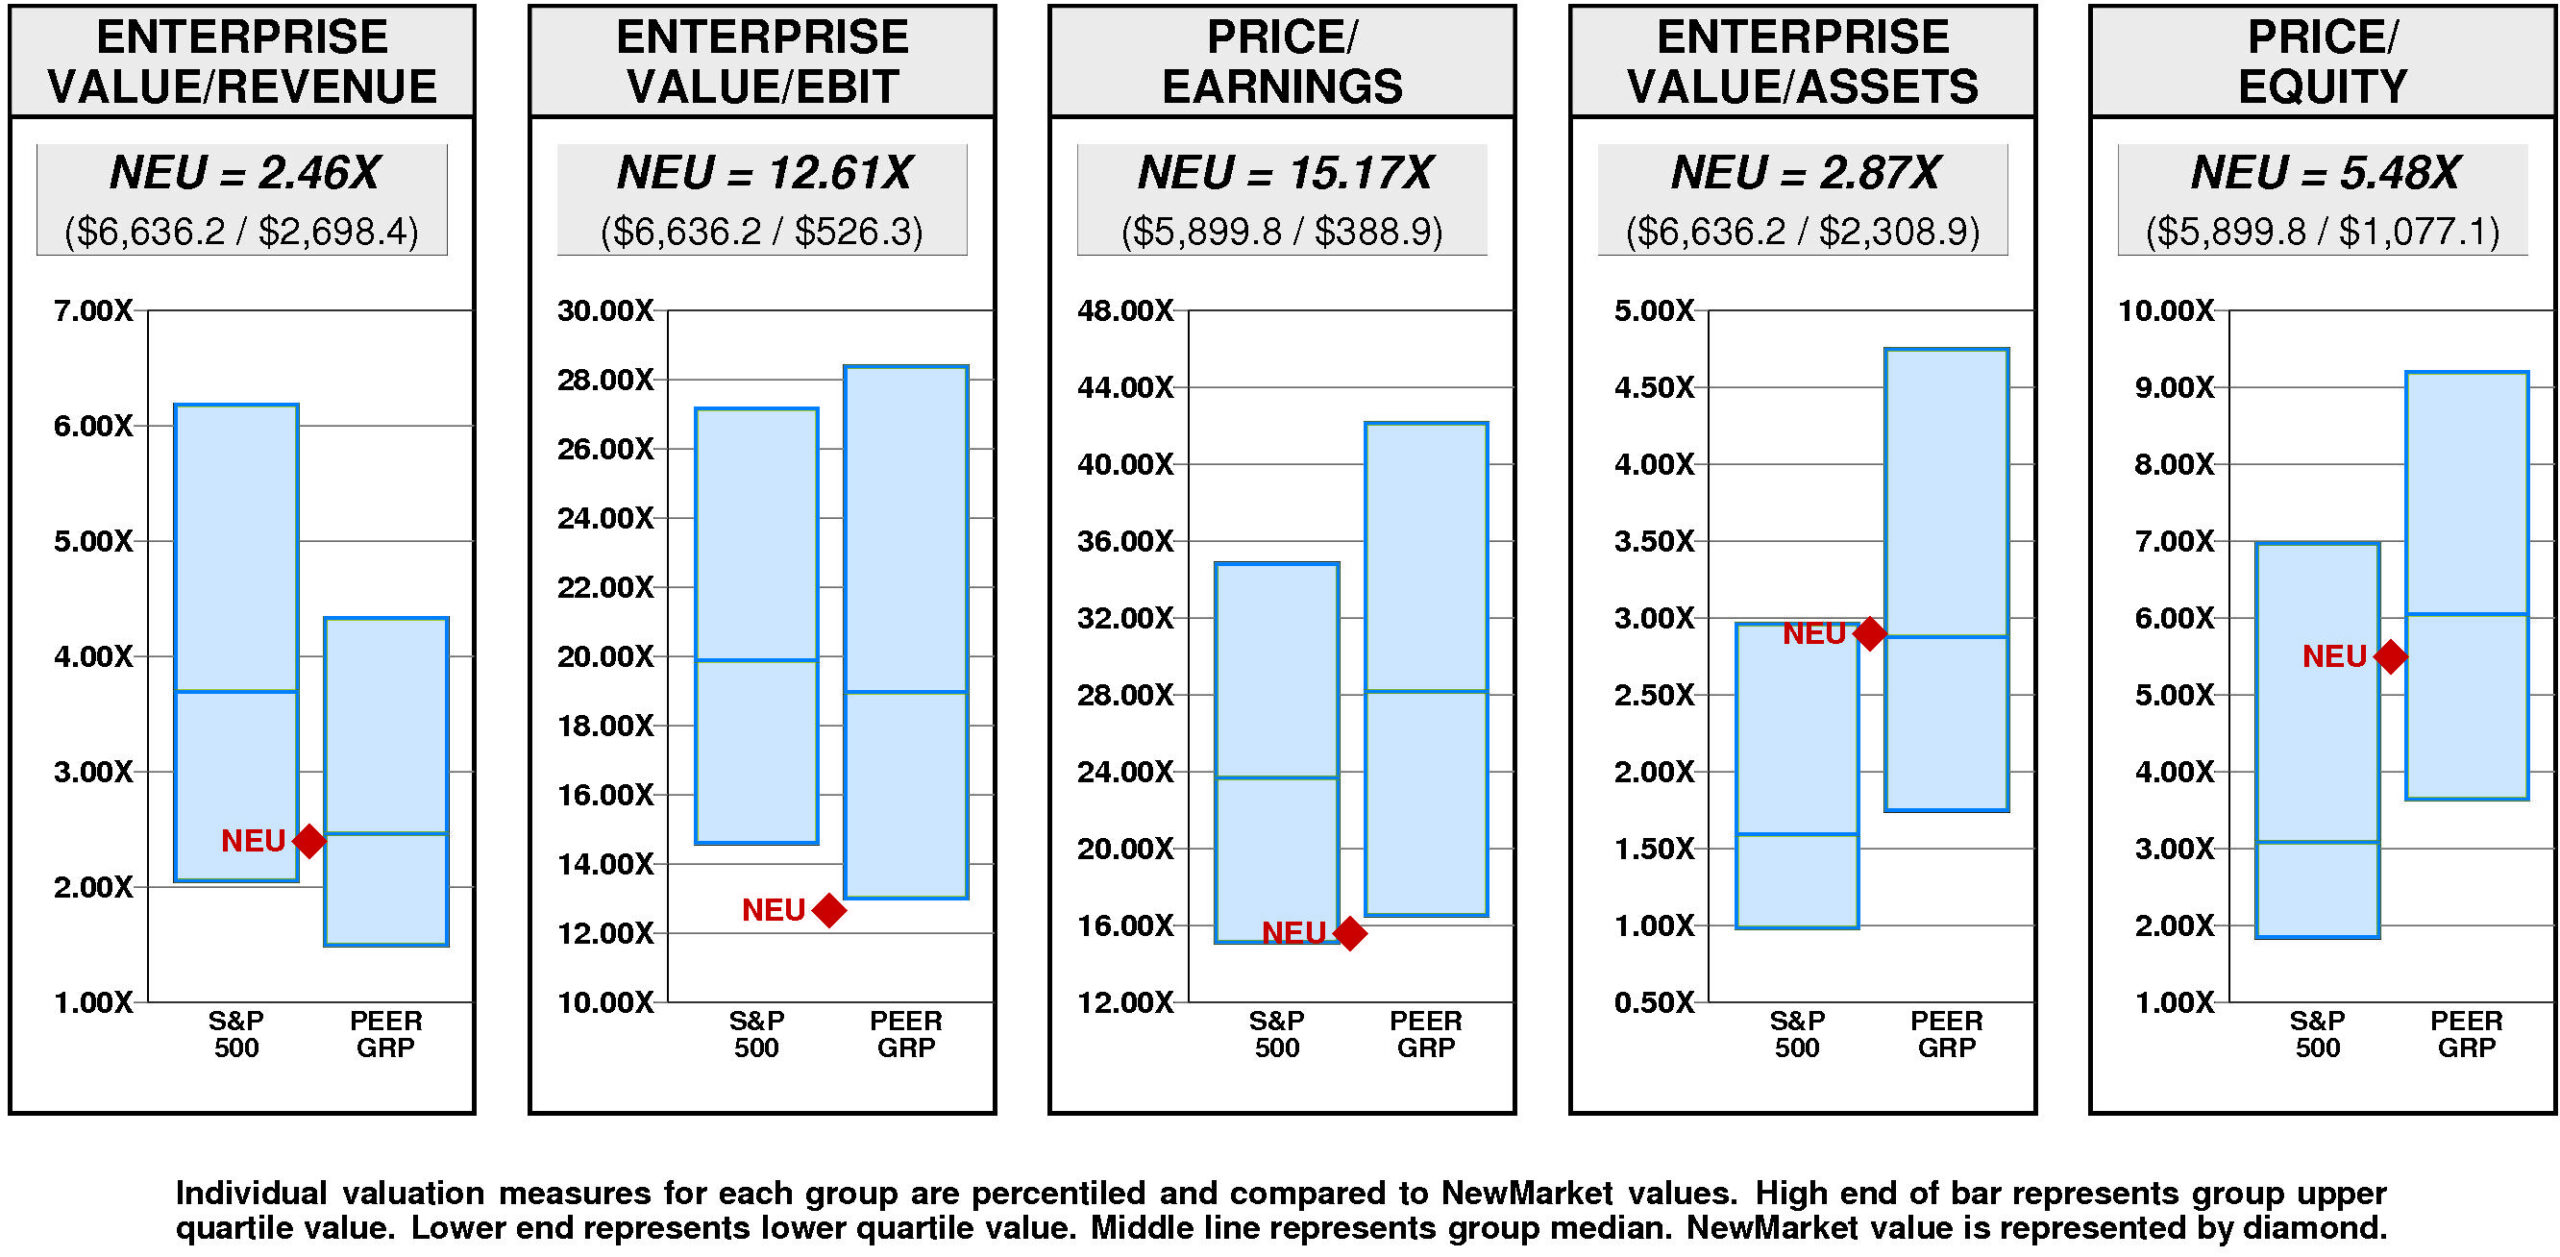
NewMarket has a major value gap compared to median valuation.
For NEU to fall to lower quartile valuation, its current ratio of enterprise value/revenue would have to decline from the current level of 2.46X to 1.50X. If NEU's ratio of enterprise value/revenue were to decline to 1.50X, its stock price would be lower by $-271 to $344.
For NEU to achieve upper quartile valuation relative to the NewMarket Peer Group, its current ratio of enterprise value/revenue would have to rise from the current level of 2.46X to 4.33X. If NEU's ratio of enterprise value/revenue were to rise to 4.33X, its stock price would increase by $526 from the current level of $615.
VALUE TARGETS
NEU's future returns on capital are forecasted to be above the cost of capital. Accordingly, the company is expected to continue to be a major Value Builder.
NewMarket's current Price Target of $634 is little changed from the current price of $615.20.
This moderately low appreciation potential results in an appreciation score of 35 (65% of the universe has greater appreciation potential.)
Notwithstanding this moderately low Appreciation Score of 35, the high Power Rating of 89 results in an Value Trend Rating of C.
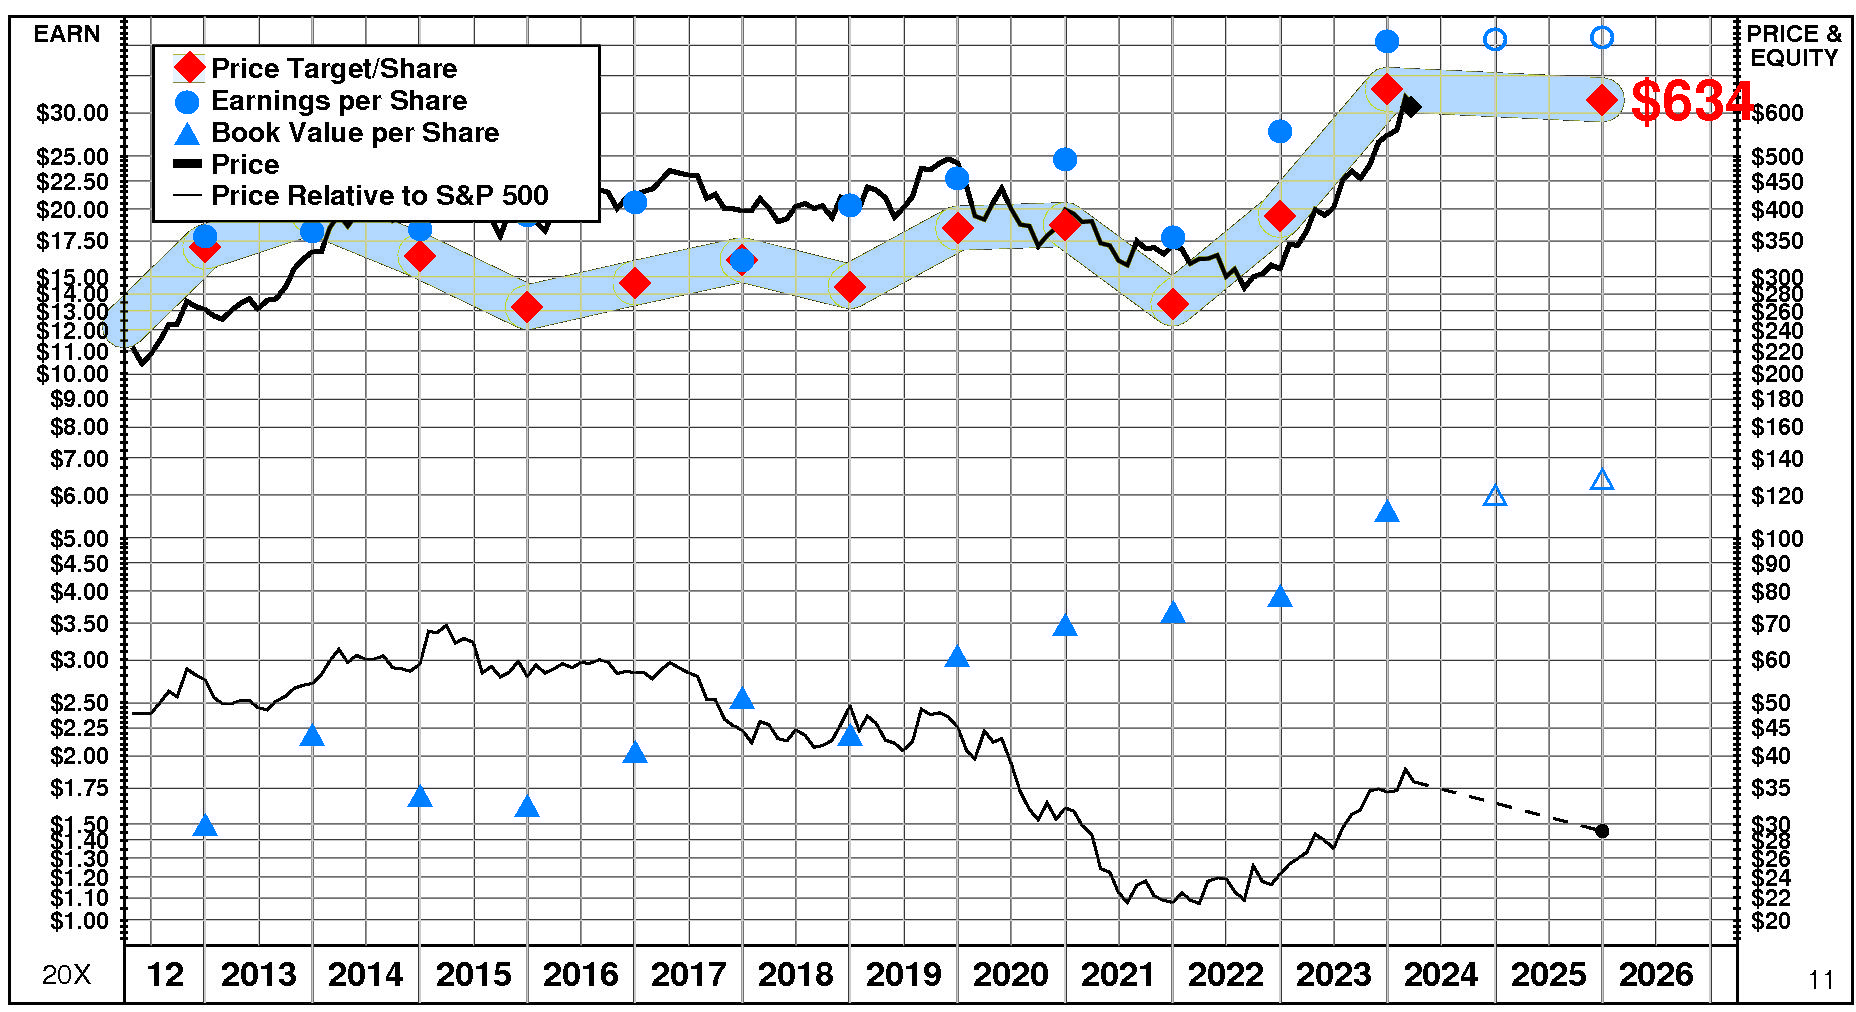
NewMarket's current Price Target is $634 (-4% from the 2023 Target of $662 but +3% from the 03/18/24 price of $615.20).
This plateau in the Target is the result of a +14% increase in the equity base and a -16% decrease in the price/equity multiple. The forecasted decline in growth has a large negative impact on the price/equity multiple and the forecasted decline in return on equity has a slight negative impact as well. Partially offsetting these Drivers, the forecasted decline in cost of equity has a slight positive impact.
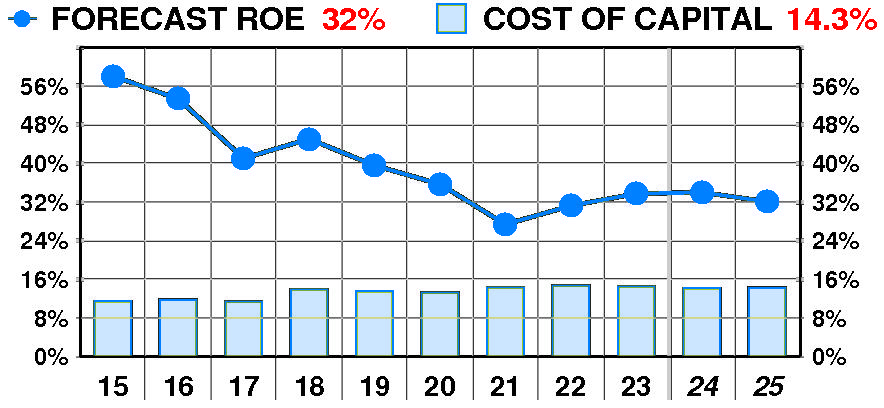
PTR's return on equity forecast is 32.1% — in line with our recent forecasts.
Forecasted return on equity suffered a dramatic, steady decline between 2015 and 2023. The current forecast is significantly below the 2015 peak of 58%.
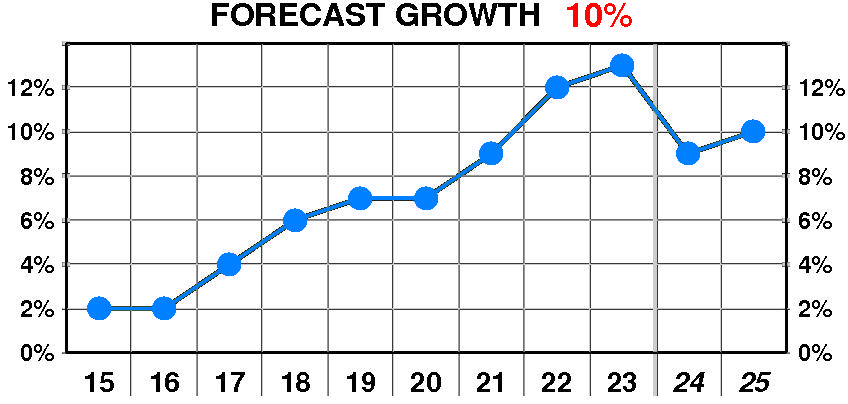
PTR's growth forecast is 10.0% — slightly below our recent forecasts.
Forecasted growth enjoyed a dramatic, steady increase between 2015 and 2023. The current forecast is well above the 2016 low of 2%.
PTR's cost of equity forecast is 14.3% — in line with recent levels.
Forecasted cost of equity suffered a dramatic, steady increase between 2015 and 2023. The current forecast is above the 2017 low of 11.4%.
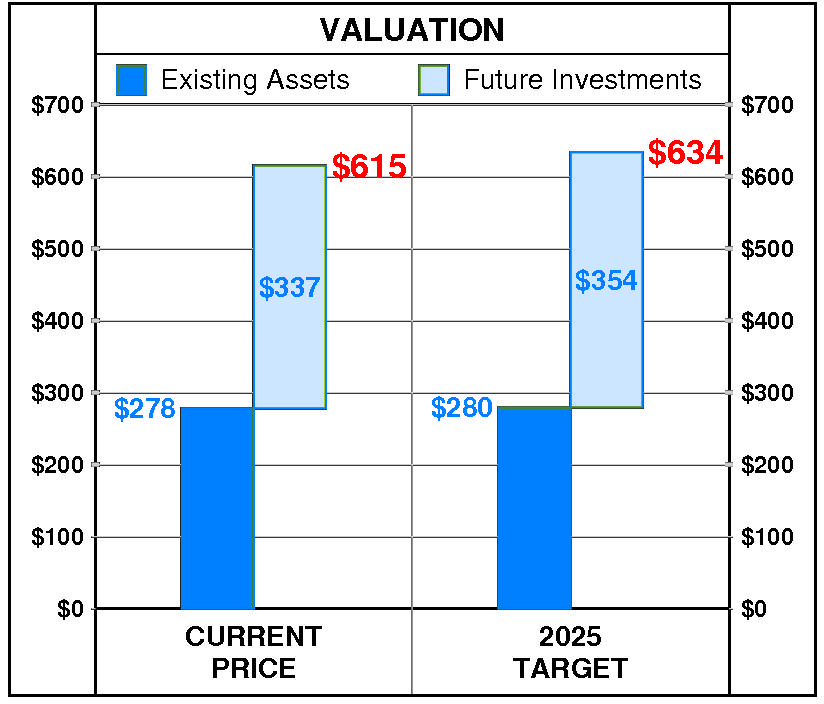
At NewMarket's current price of $615.20, investors are placing a positive value of $337 on its future investments. This view is consistent with the company's most recent performance that reflected a growth rate of 13.0% per year, and a return on equity of 33.7% versus a cost of equity of 14.6%.
PTR's 2025 Price Target of $634 is based on these forecasts and reflects an estimated value of existing assets of $280 and a value of future investments of $354.