BUSINESS
Ford Motor Company designs, manufactures, markets, and services a range of Ford trucks, cars, sport utility vehicles, electrified vehicles, and Lincoln luxury vehicles worldwide. It operates through three segments: Automotive, Mobility, and Ford Credit. The Automotive segment sells Ford and Lincoln vehicles, service parts, and accessories through distributors and dealers, as well as through dealerships to commercial fleet customers, daily rental car companies, and governments. The Mobility segment designs and builds mobility services; and provides self-driving systems development services. The Ford Credit segment primarily engages in vehicle-related financing and leasing activities to and through automotive dealers.
INVESTMENT RATING
Reflecting future returns on capital that are forecasted to be above the cost of capital, F is expected to continue to be a major Value Builder.
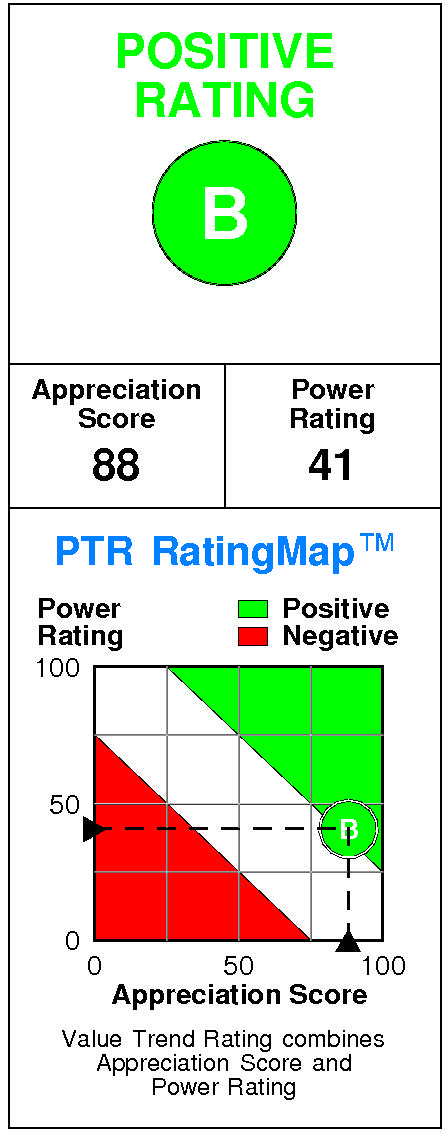
Ford Motor has a current Value Trend Rating of B (Positive).
This rating combines inconsistent signals from two proprietary PTR measures of a stock's attractiveness. Ford Motor has a very high Appreciation Score of 88 but a neutral Power Rating of 41, with the Positive Value Trend Rating the result.
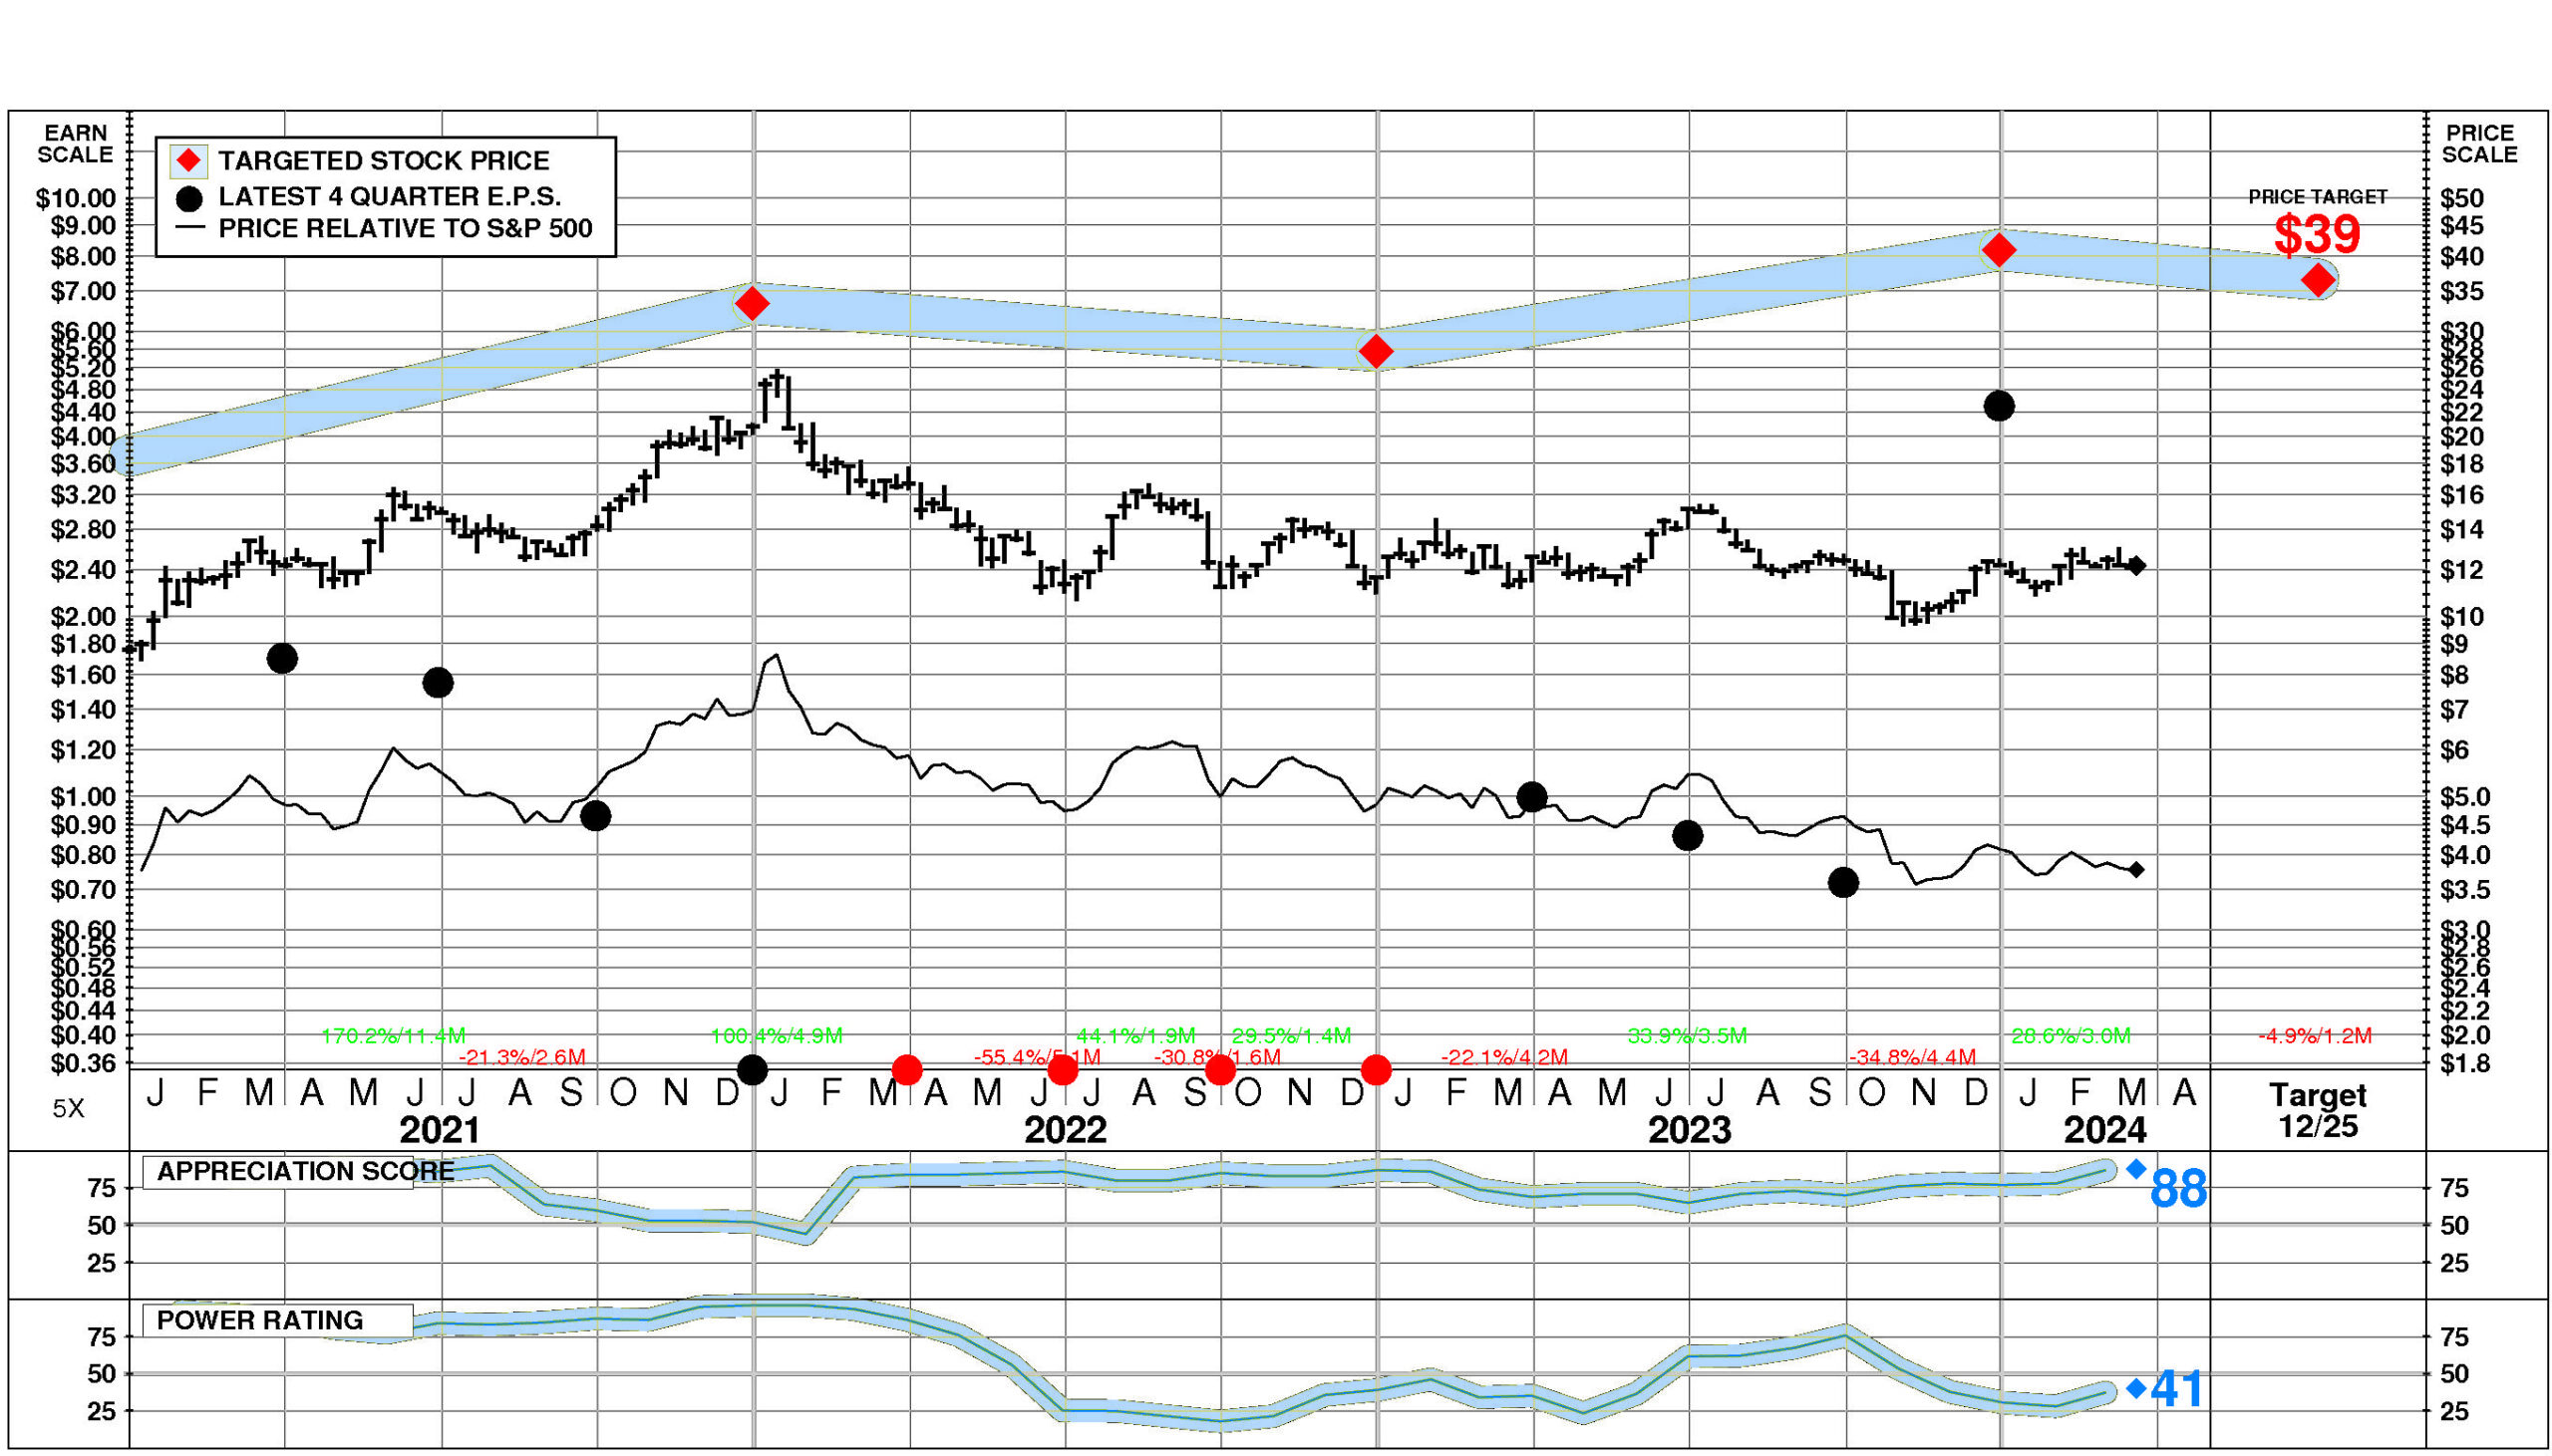
Ford Motor's stock is selling well below targeted value.
The current stock price of $12.18 compares to targeted value 12 months forward of $37.
Ford Motor's very high appreciation potential results in an appreciation score of 88 (only 12% of the universe has greater appreciation potential.)
Ford Motor has a Power Rating of 41.
(This neutral Power Rating indicates that F's chances of enjoying attractive investment performance over the near to intermediate term are only average.)
Factors contributing to this neutral Power Rating include: the Motor Vehicles & Car Bodies comparison group is in a slightly weakened position currently; and recent price action has been slightly unfavorable. An offsetting factor is the recent trend in F's earnings estimates has been extremely favorable.
INVESTMENT PROFILE
Ford Motor's financial strength is below average. Financial strength rating is 38.
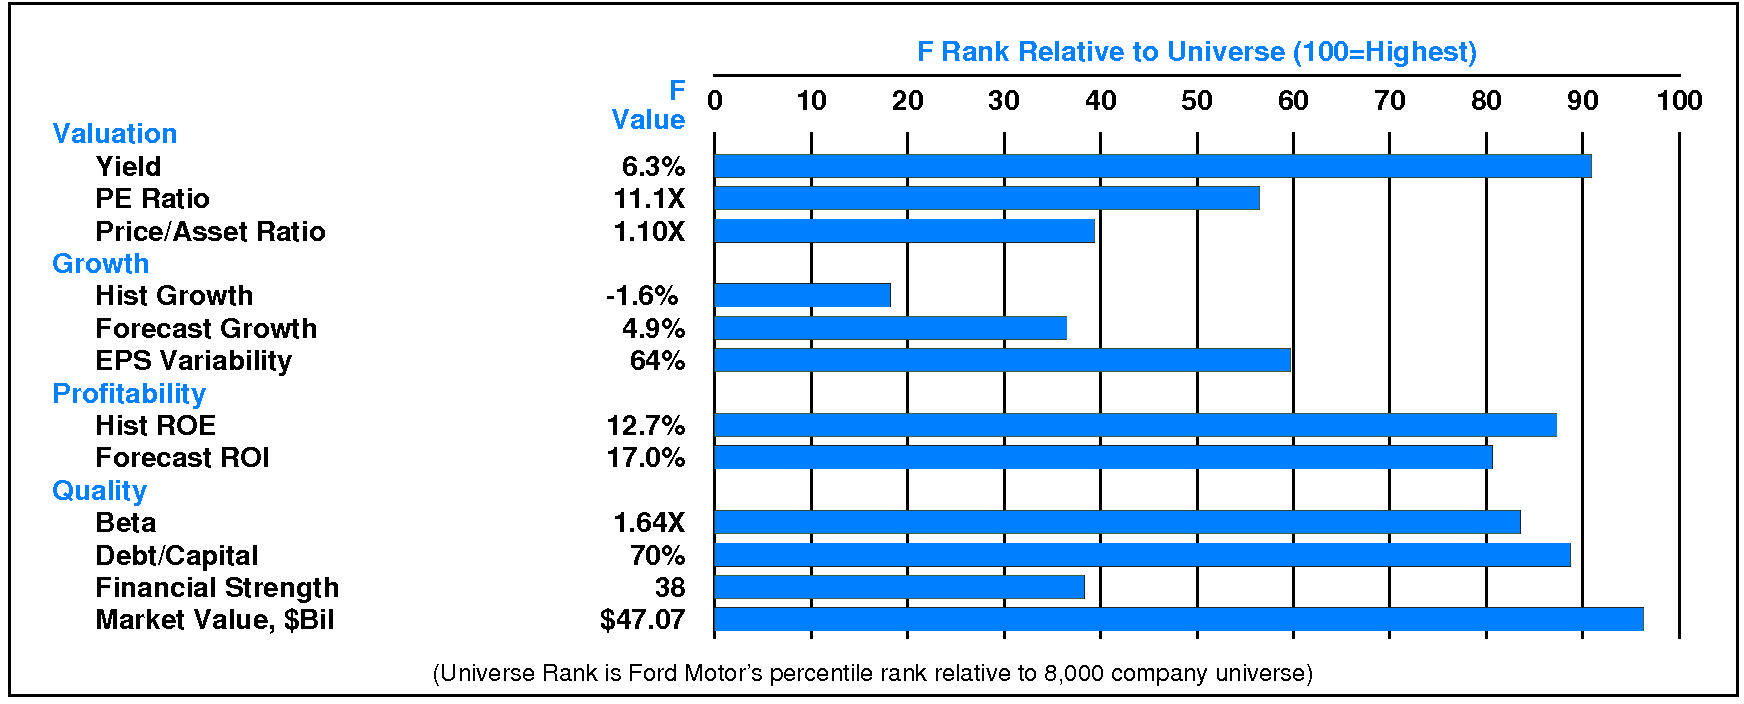
Relative to the S&P 500 Composite, Ford Motor Co has moderate Value characteristics; its appeal is likely to be to investors heavily oriented toward Income; the perception is that F is extremely high risk.
All factors are relative weaknesses. Relative weaknesses for Ford Motor include: low financial strength, high stock price volatility, high financial leverage, low expected growth, and low historical growth. Ford Motor's valuation is low: high dividend yield, low P/E ratio, and low price/book ratio. F has high market capitalization.
CURRENT SIGNALS
Ford Motor's current operations are eroding.
Return on equity is falling, reflecting: declining pretax margin; and falling leverage.
Ford Motor's current technical position is mixed.
The stock price is in a 3.0 month up move. The stock has appreciated 28.6% from its prior low. The 200 day moving average is in a downtrend. The stock price is above its 200 day moving average. The stock has just fallen below its 200 day moving average.
ALERTS
Ford Motor Co (NYSE: F) suffers from notable negative changes in investment behavior: the stock's recent price decline challenged its longer term uptrend.
The stock is currently rated B.
On 3/18/24, Ford Motor Co (NYSE: F) stock rose modestly by 1.0%, closing at $12.18. However, trading volume in this advance was unusually low at 66% of normal. The stock has been weak relative to the market over the last nine months but is unchanged during the last week.
CASH FLOW
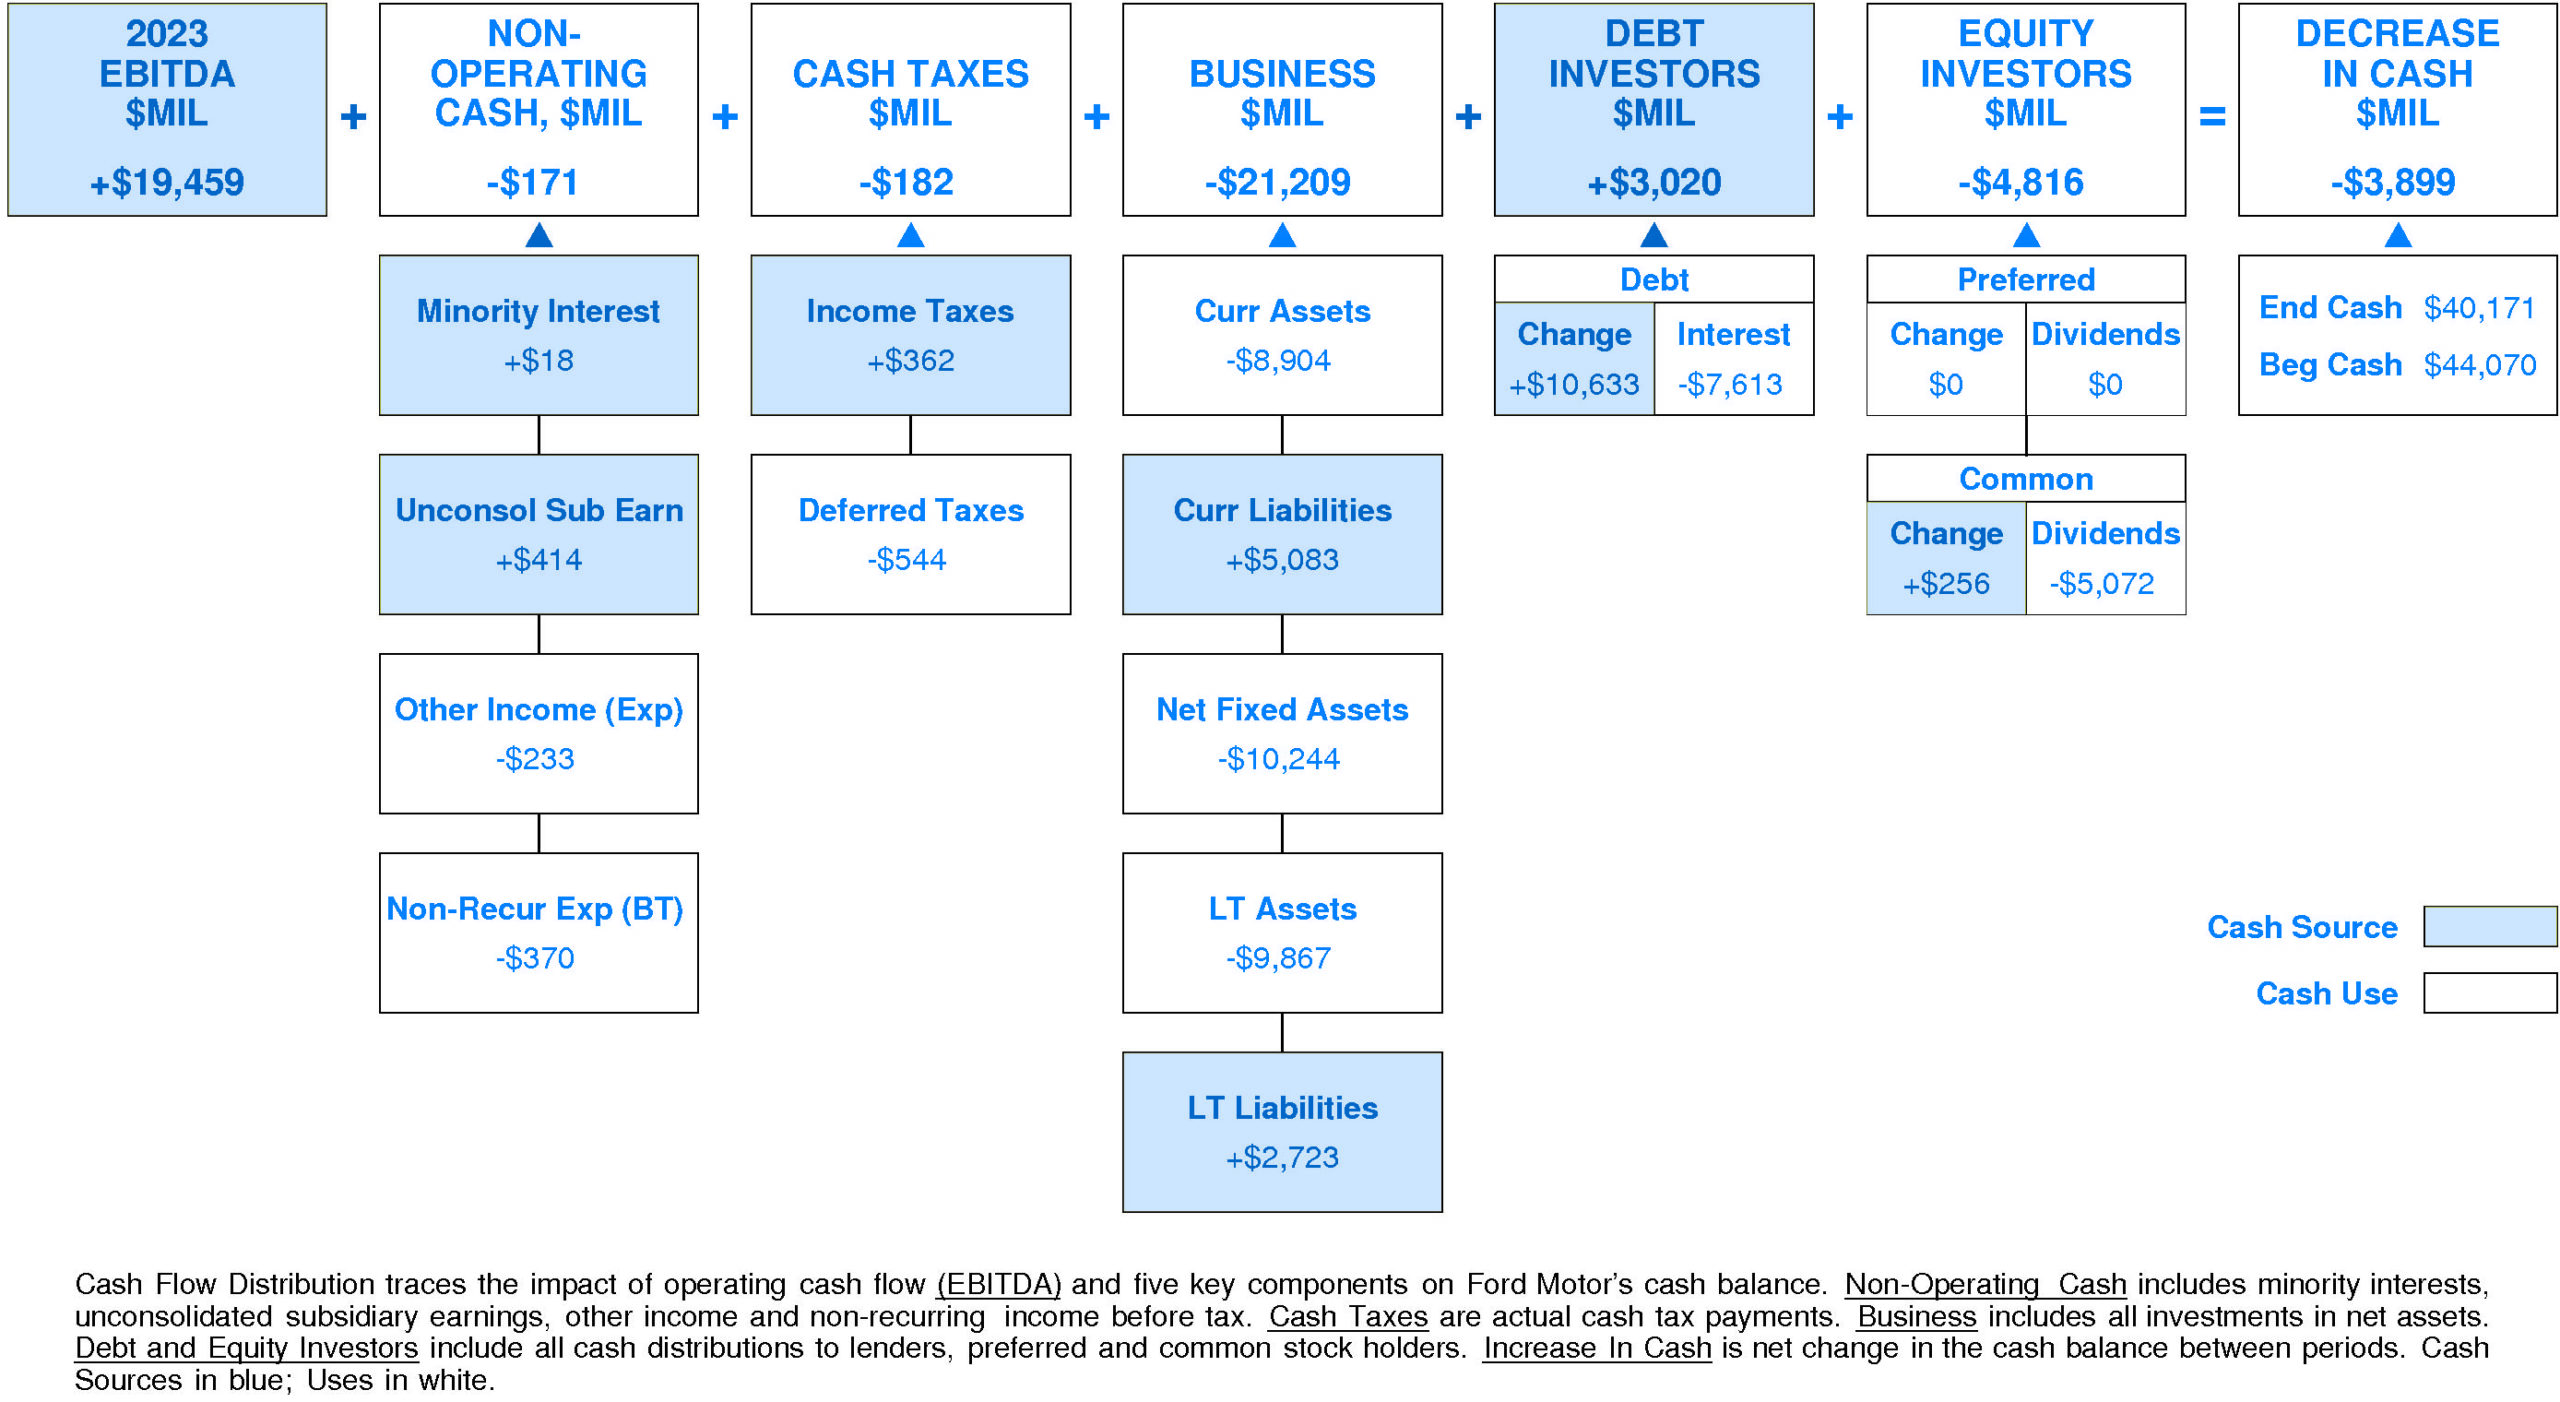
In 2023, Ford Motor experienced a slight decrease in cash of -$3,899 million (-9%). Sources of cash were slightly lower than uses.
Cash generated from 2023 EBITDA totaled +$19,459 million. Non-operating uses consumed -$171 million (-1% of EBITDA). Cash taxes consumed -$182 million (-1% of EBITDA). Re-investment in the business amounted to -$21,209 million (-109% of EBITDA). On a net basis, debt investors supplied +$3,020 million (+16% of EBITDA) while equity investors removed -$4,816 million (-25% of EBITDA).
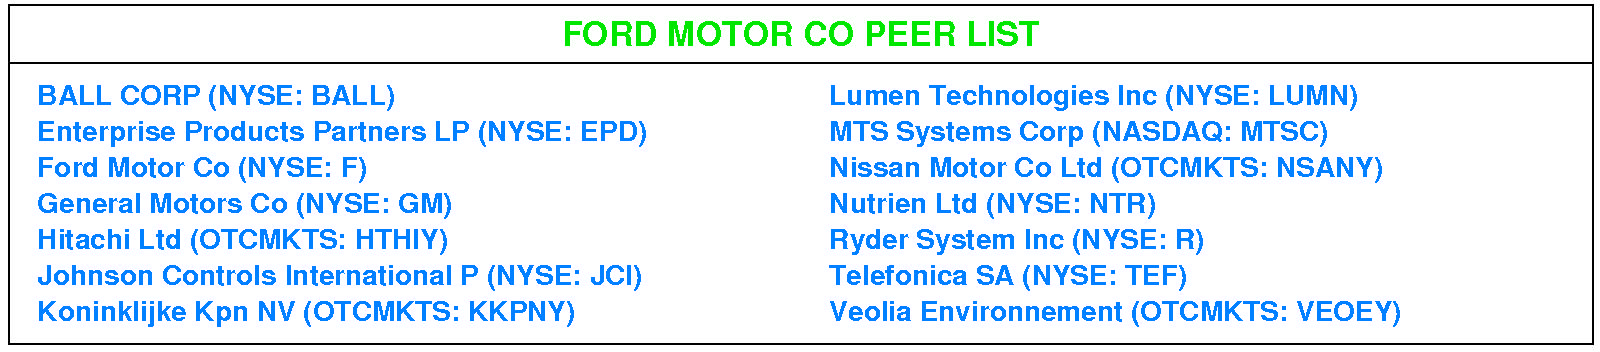
Ford Motor's Non-operating Income, %EBITDA has experienced a downtrend over the period.
This downtrend was accompanied by stability for the Ford Motor Peer Group. In most years, Ford Motor was in the top quartile. Currently, Ford Motor is slightly below median at -1% of EBITDA (-$171 million).
Ford Motor's Cash Taxes, %EBITDA has exhibited a minor overall uptrend over the period.
This improvement was accompanied by a similar trend for the Ford Motor Peer Group. (Since 2021 Cash Taxes, %EBITDA has experienced a very sharp decline.) In most years, Ford Motor was in the top quartile and second quartile. Currently, Ford Motor is at the upper quartile at -1% of EBITDA (-$182 million).
Ford Motor's Business Re-investment, %EBITDA has enjoyed a very strong overall uptrend over the period.
This improvement was accompanied by a similar trend for the Ford Motor Peer Group. (Since 2020 Business Re-investment, %EBITDA has experienced a very sharp decline.) In most years, Ford Motor was in the third quartile and top quartile. Currently, Ford Motor is lower quartile at -109% of EBITDA (-$21,209 million).
Ford Motor's Debt Investors, %EBITDA has experienced a volatile overall downtrend over the period.
This downtrend was accompanied by a similar trend for the Ford Motor Peer Group. (Since 2021 Debt Investors, %EBITDA has experienced a very sharp recovery.) In most years, Ford Motor was in the top quartile and second quartile. Currently, Ford Motor is at the upper quartile at +16% of EBITDA (+$3,020 million).
Ford Motor's Equity Investors, %EBITDA has exhibited a volatile overall uptrend over the period.
This improvement was accompanied by a similar trend for the Ford Motor Peer Group. (Since 2021 Equity Investors, %EBITDA has experienced a very sharp decline.) In most years, Ford Motor was in the third quartile and top quartile. Currently, Ford Motor is slightly below median at -25% of EBITDA (-$4,816 million).
Ford Motor's Change in Cash, %EBITDA has exhibited a volatile overall uptrend over the period.
This improvement was accompanied by an opposite trend for the Ford Motor Peer Group. In most years, Ford Motor was in the top quartile and lower quartile. Currently, Ford Motor is below median at -20% of EBITDA (-$3,899 million).
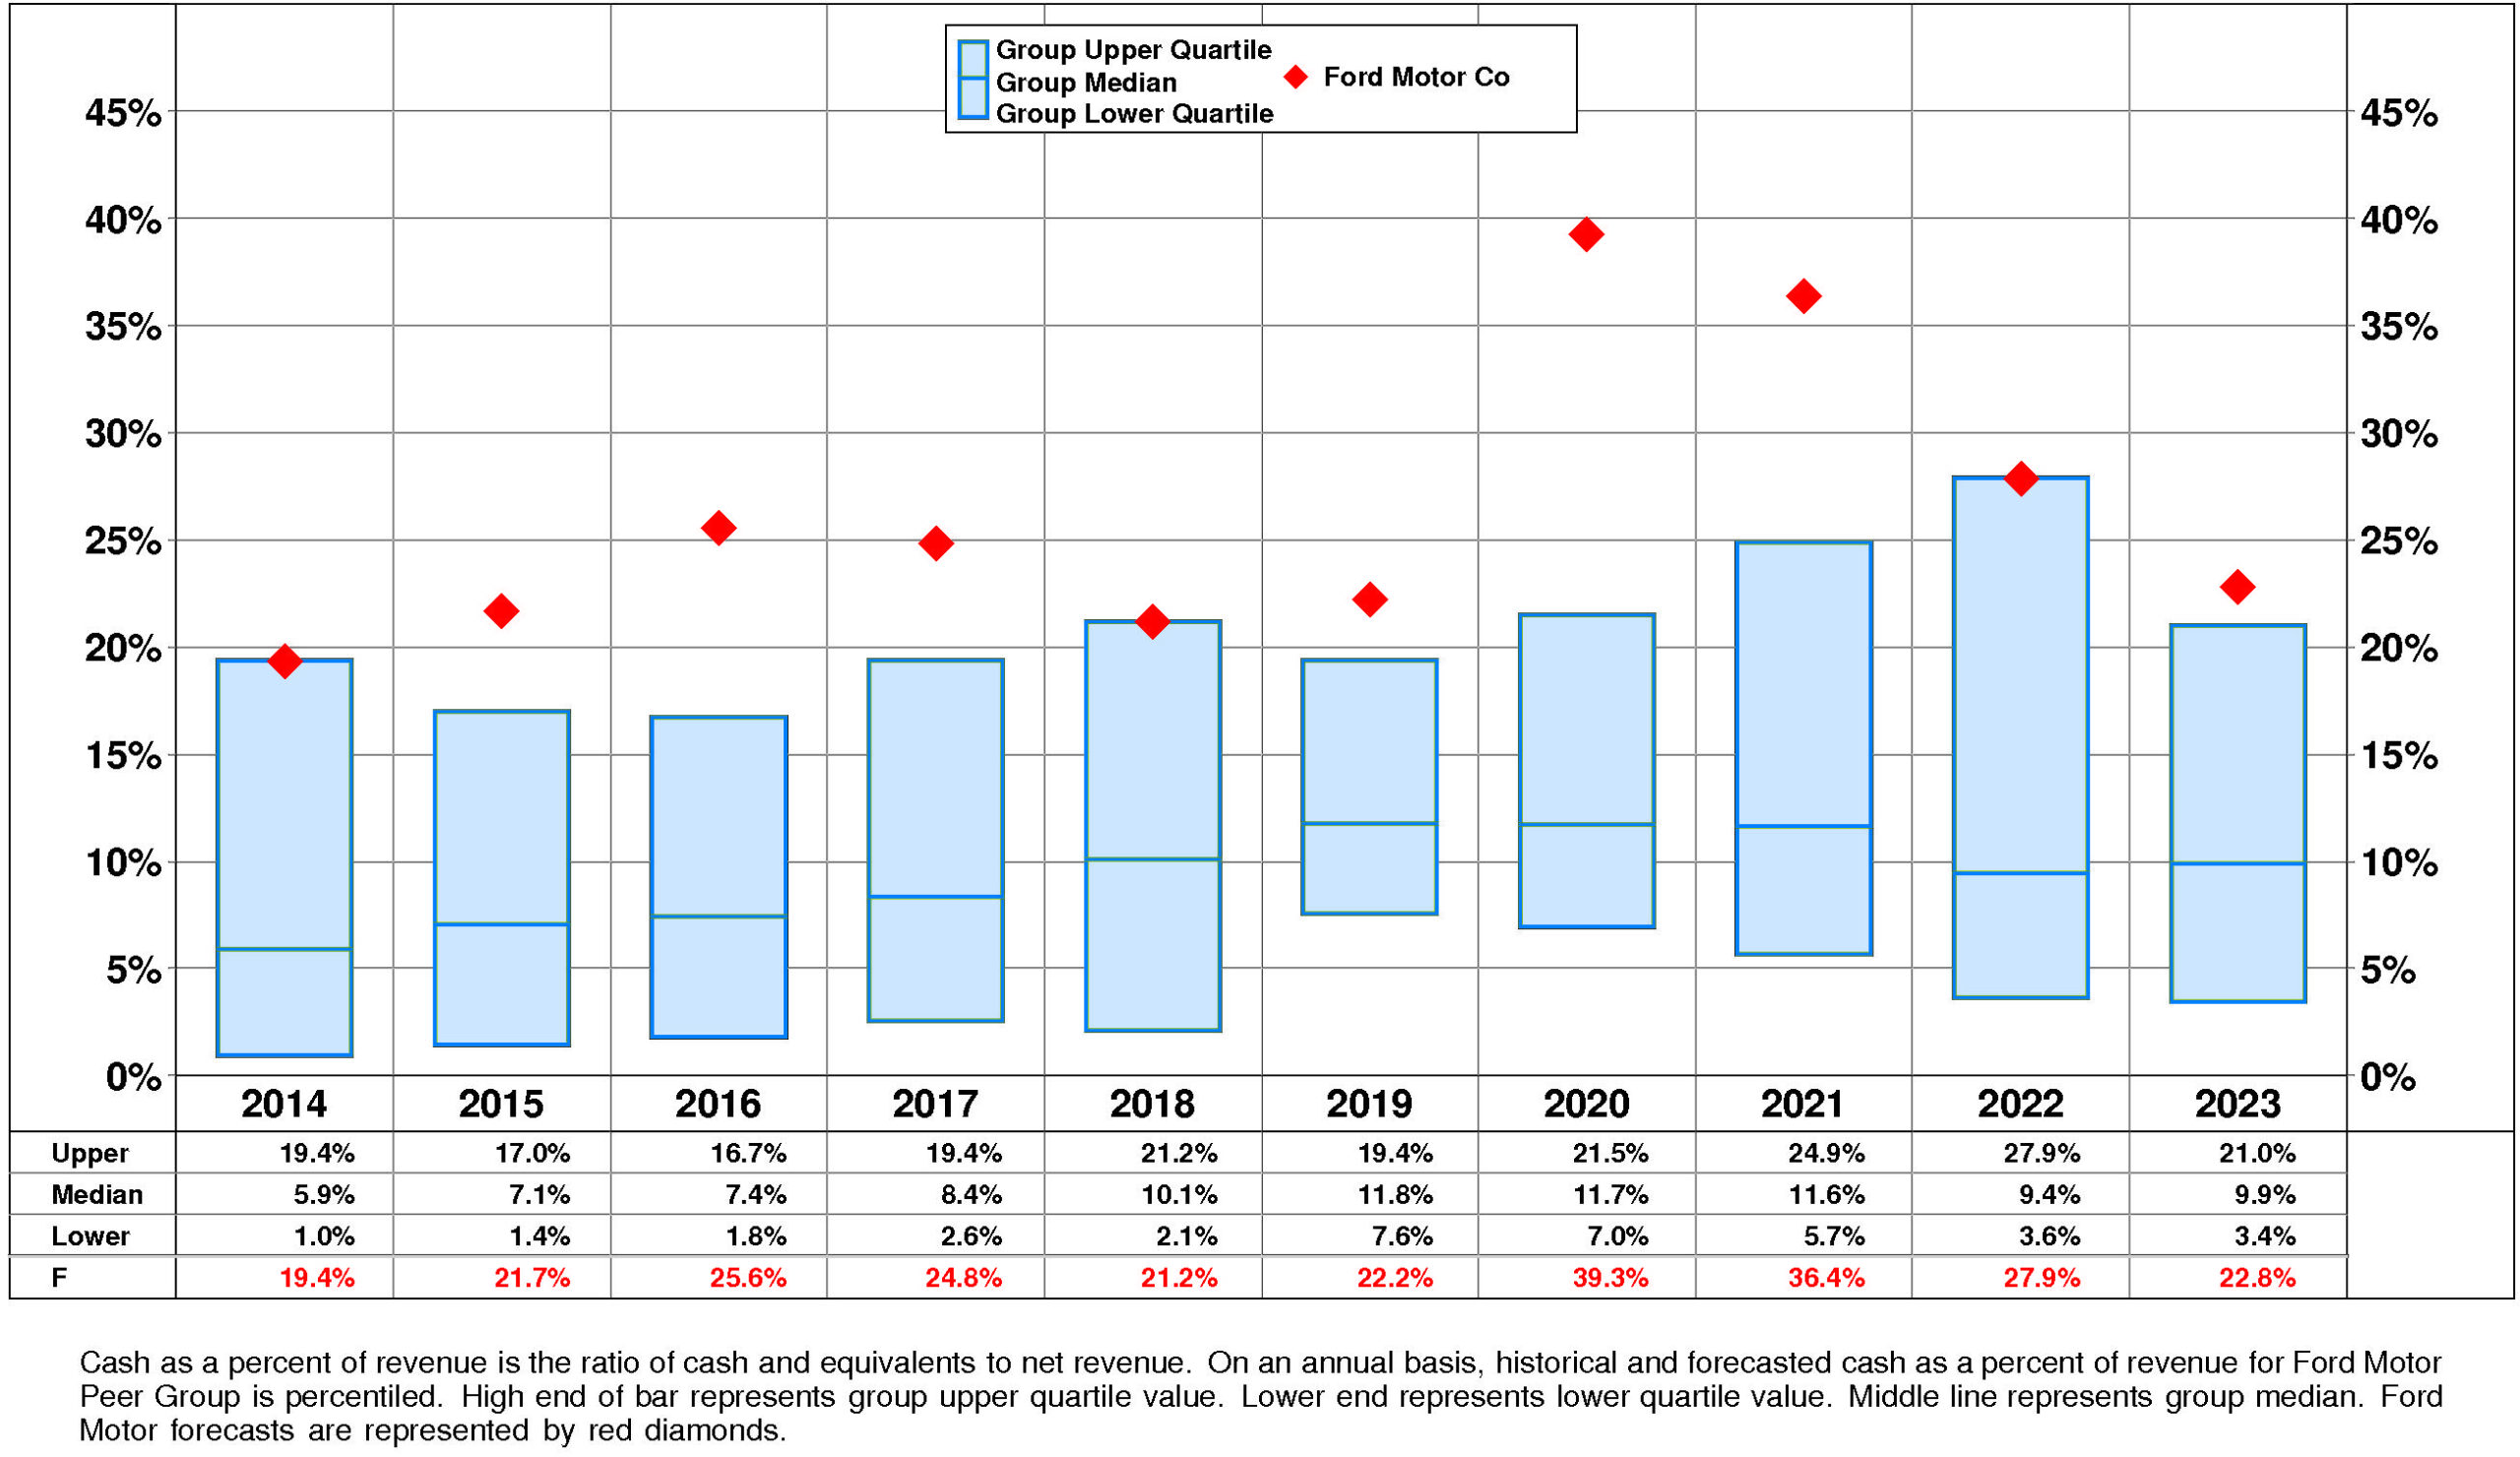
Ford Motor's Cash, %Revenue has exhibited a volatile overall uptrend over the period.
This improvement was accompanied by a similar trend for the Ford Motor Peer Group. (Since 2020 Cash, %Revenue has experienced a very sharp decline.) In most years, Ford Motor was in the top quartile. Currently, Ford Motor is upper quartile at +23%.
PROFITABILITY
Ford Motor's return on equity has eroded very significantly since 2014. The current level is 10.2% versus the high of 12.8% and the low of -4.6%.
Ford Motor's very strong negative trend in pretax operating return significantly augmented by a very strong negative trend in non-operating factors is a major performance consideration.
The productivity of Ford Motor's assets declined over the full period 2014-2023: asset turnover has experienced a downtrend.
Reinforcing this trend, pretax margin experienced a strong overall downtrend although it experienced a very sharp recovery after the 2020 low.
Non-operating factors (income taxes and financial leverage) had a significant negative influence on return on equity.
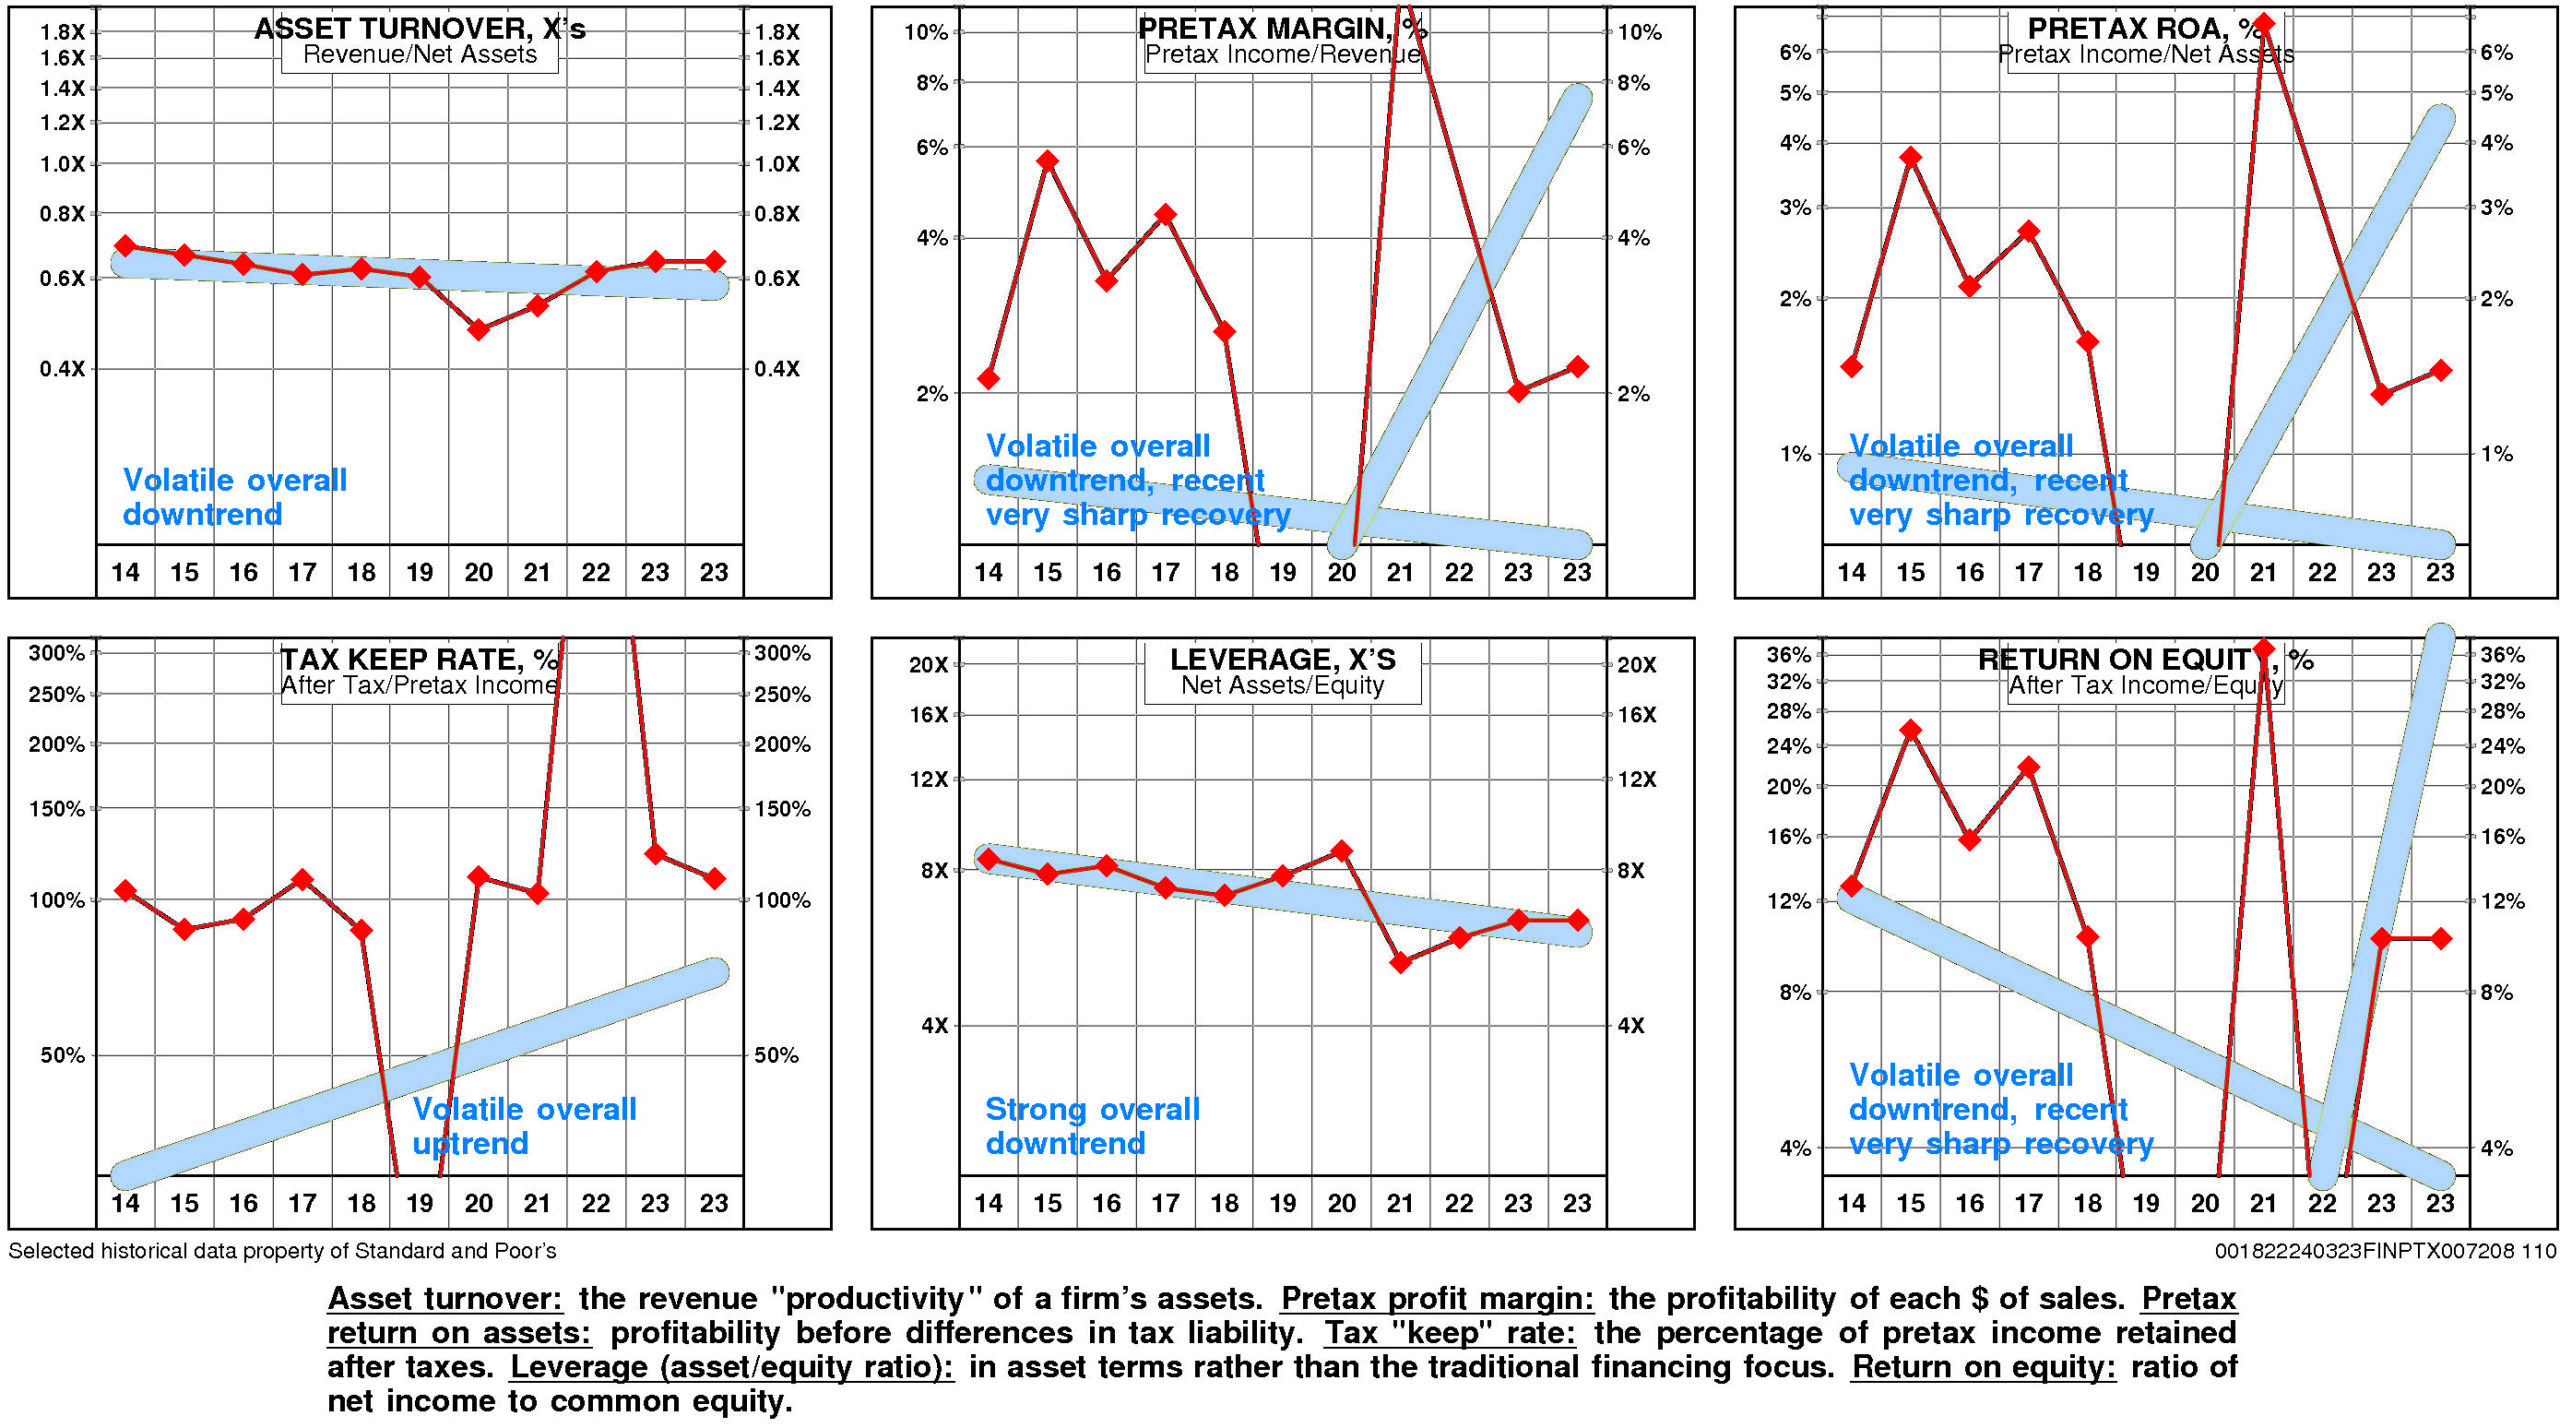
Ford Motor's return on equity is below median (10.2%) for the four quarters ended December, 2023.
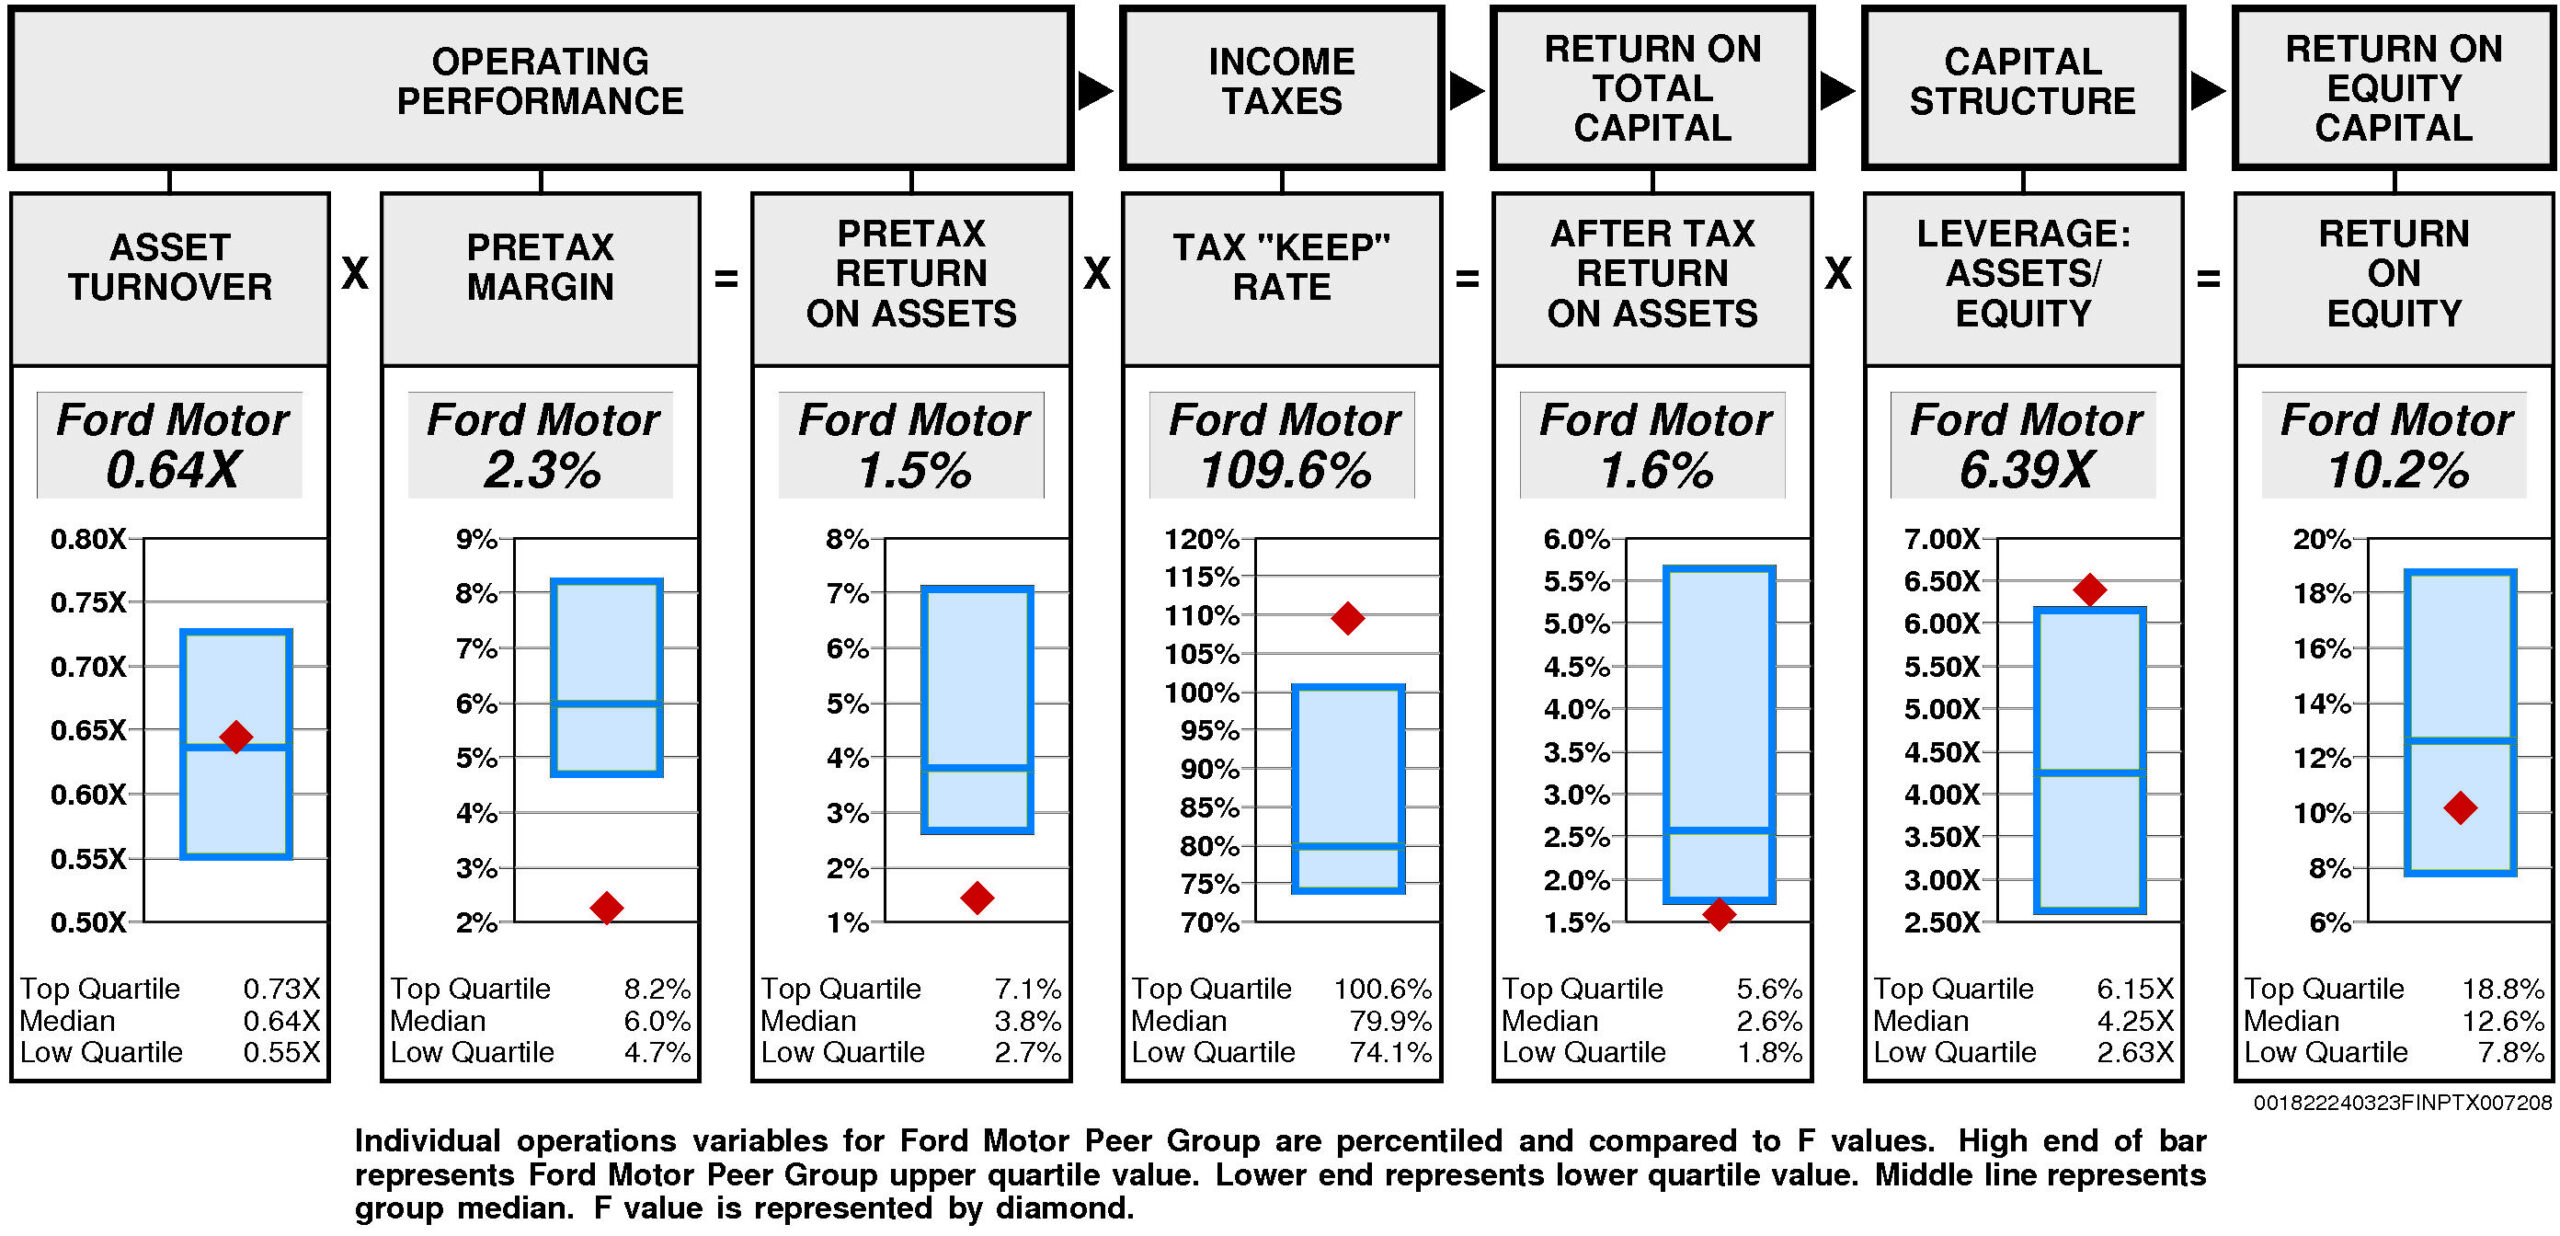
Operating performance (pretax return on assets) is lower quartile (1.5%) reflecting asset turnover that is at median (0.64X) and lower quartile pretax margin (2.3%).
Tax “keep” rate (income tax management) is upper quartile (109.6%) resulting in after tax return on assets that is lower quartile.
Financial leverage (leverage) is upper quartile (6.39X).
GROWTH RATES
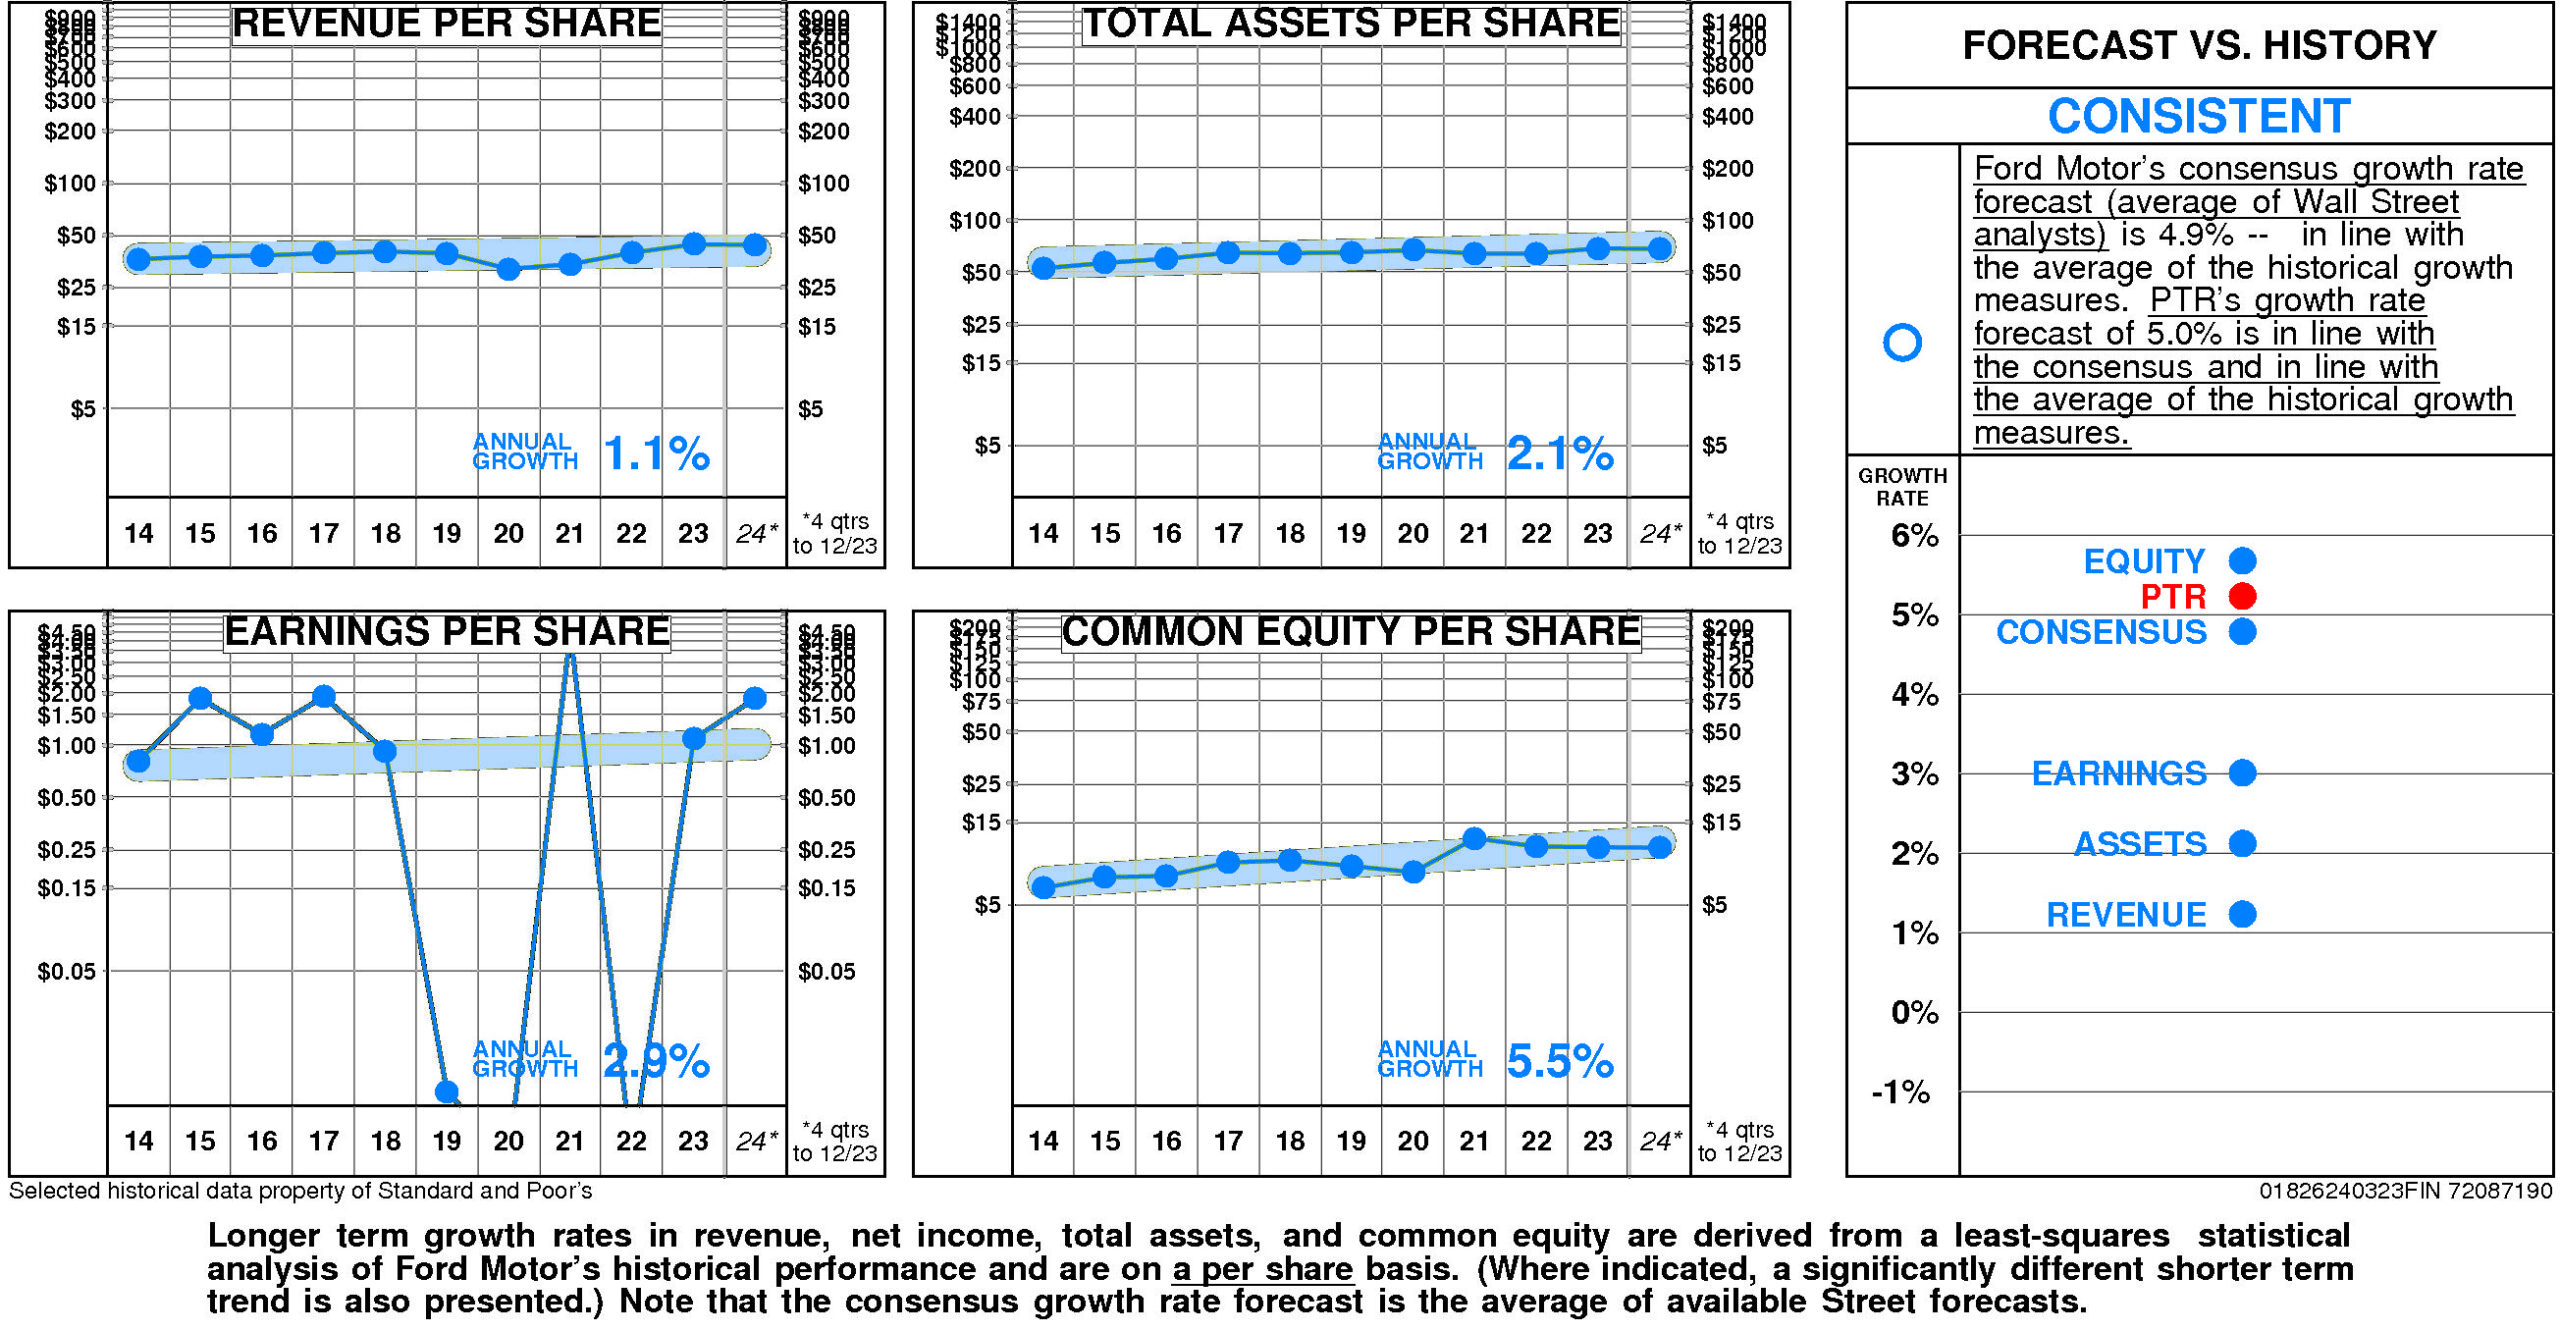
There are no significant differences between Ford Motor's longer term growth and growth in recent years.
Ford Motor's historical income statement growth has been in line with balance sheet growth. Revenue growth has paralleled asset growth; earnings growth has paralleled equity growth.
Annual revenue growth
has been 1.1% per year.
Total asset growth
has been 2.1% per year.
Annual E.P.S. growth
has been 2.9% per year.
Equity growth
has been 5.5% per year.
Ford Motor's consensus growth rate forecast (average of Wall Street analysts)
is 4.9% — in line with the average of the historical growth measures.
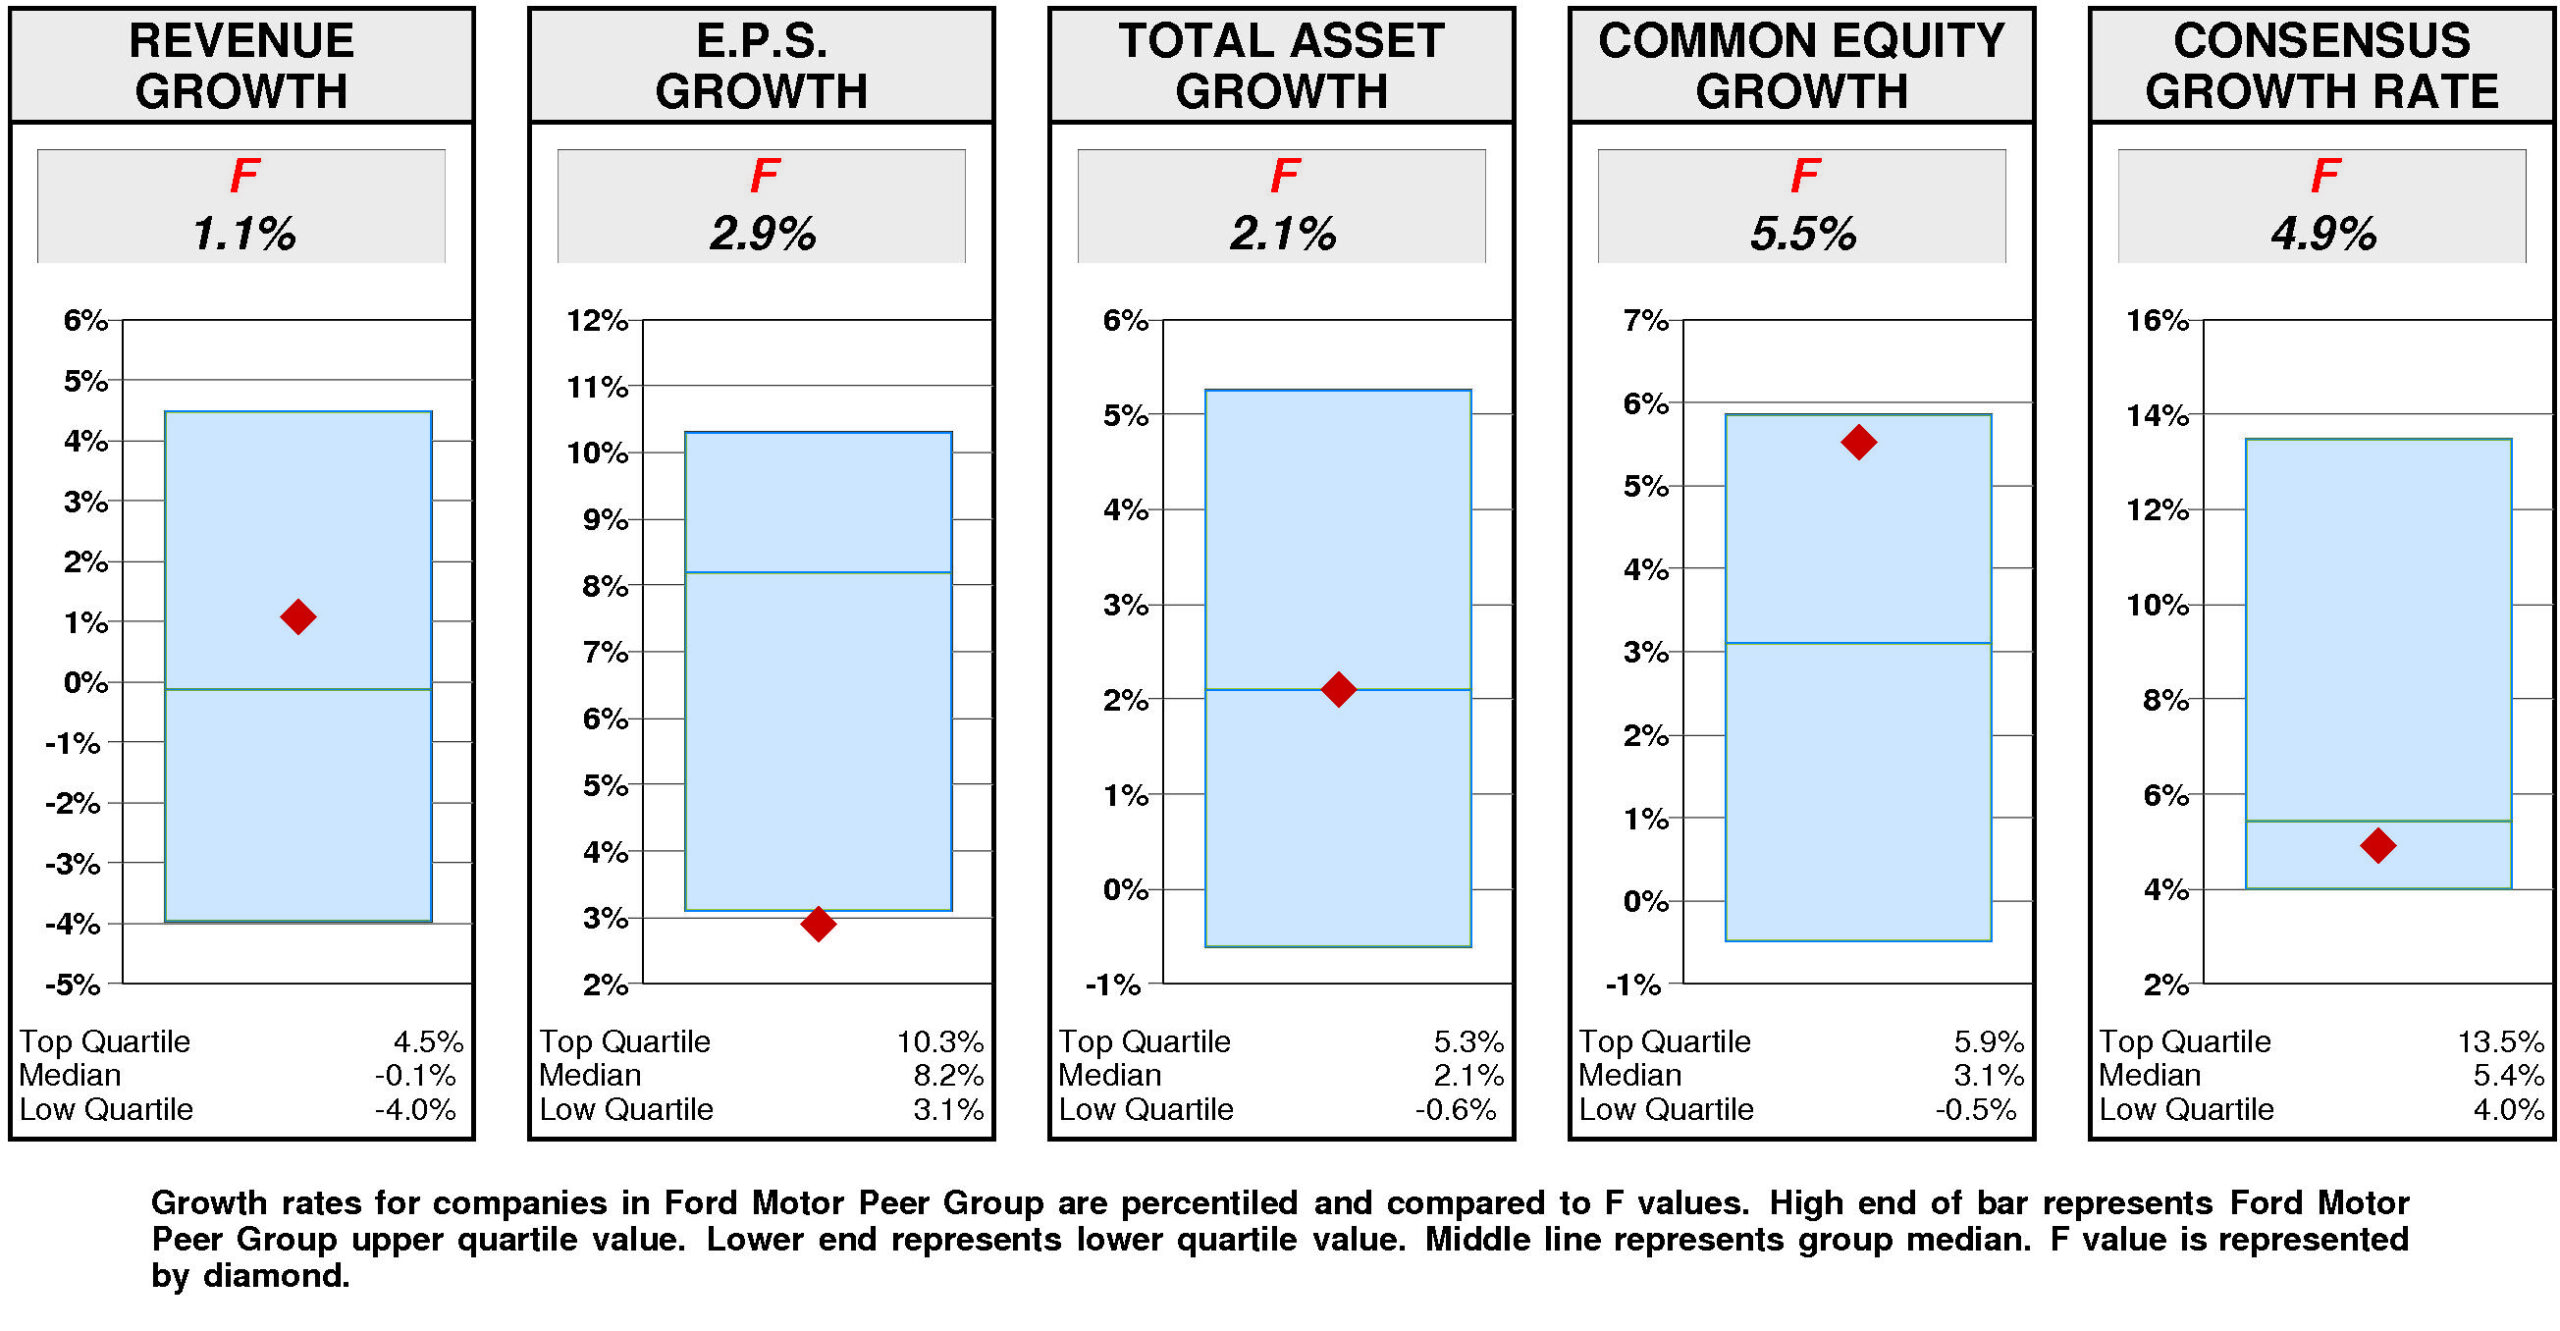
Relative to the Ford Motor Peer Group, Ford Motor's historical growth measures are generally second quartile.
Revenue growth (1.1%) has been above median. Equity growth (5.5%) has been substantially above median. Total asset growth (2.1%) has been at median. E.P.S. growth (2.9%) has been lower quartile.
Consistent with this pattern, consensus growth forecast (4.9%) is also below median.
PRICE HISTORY
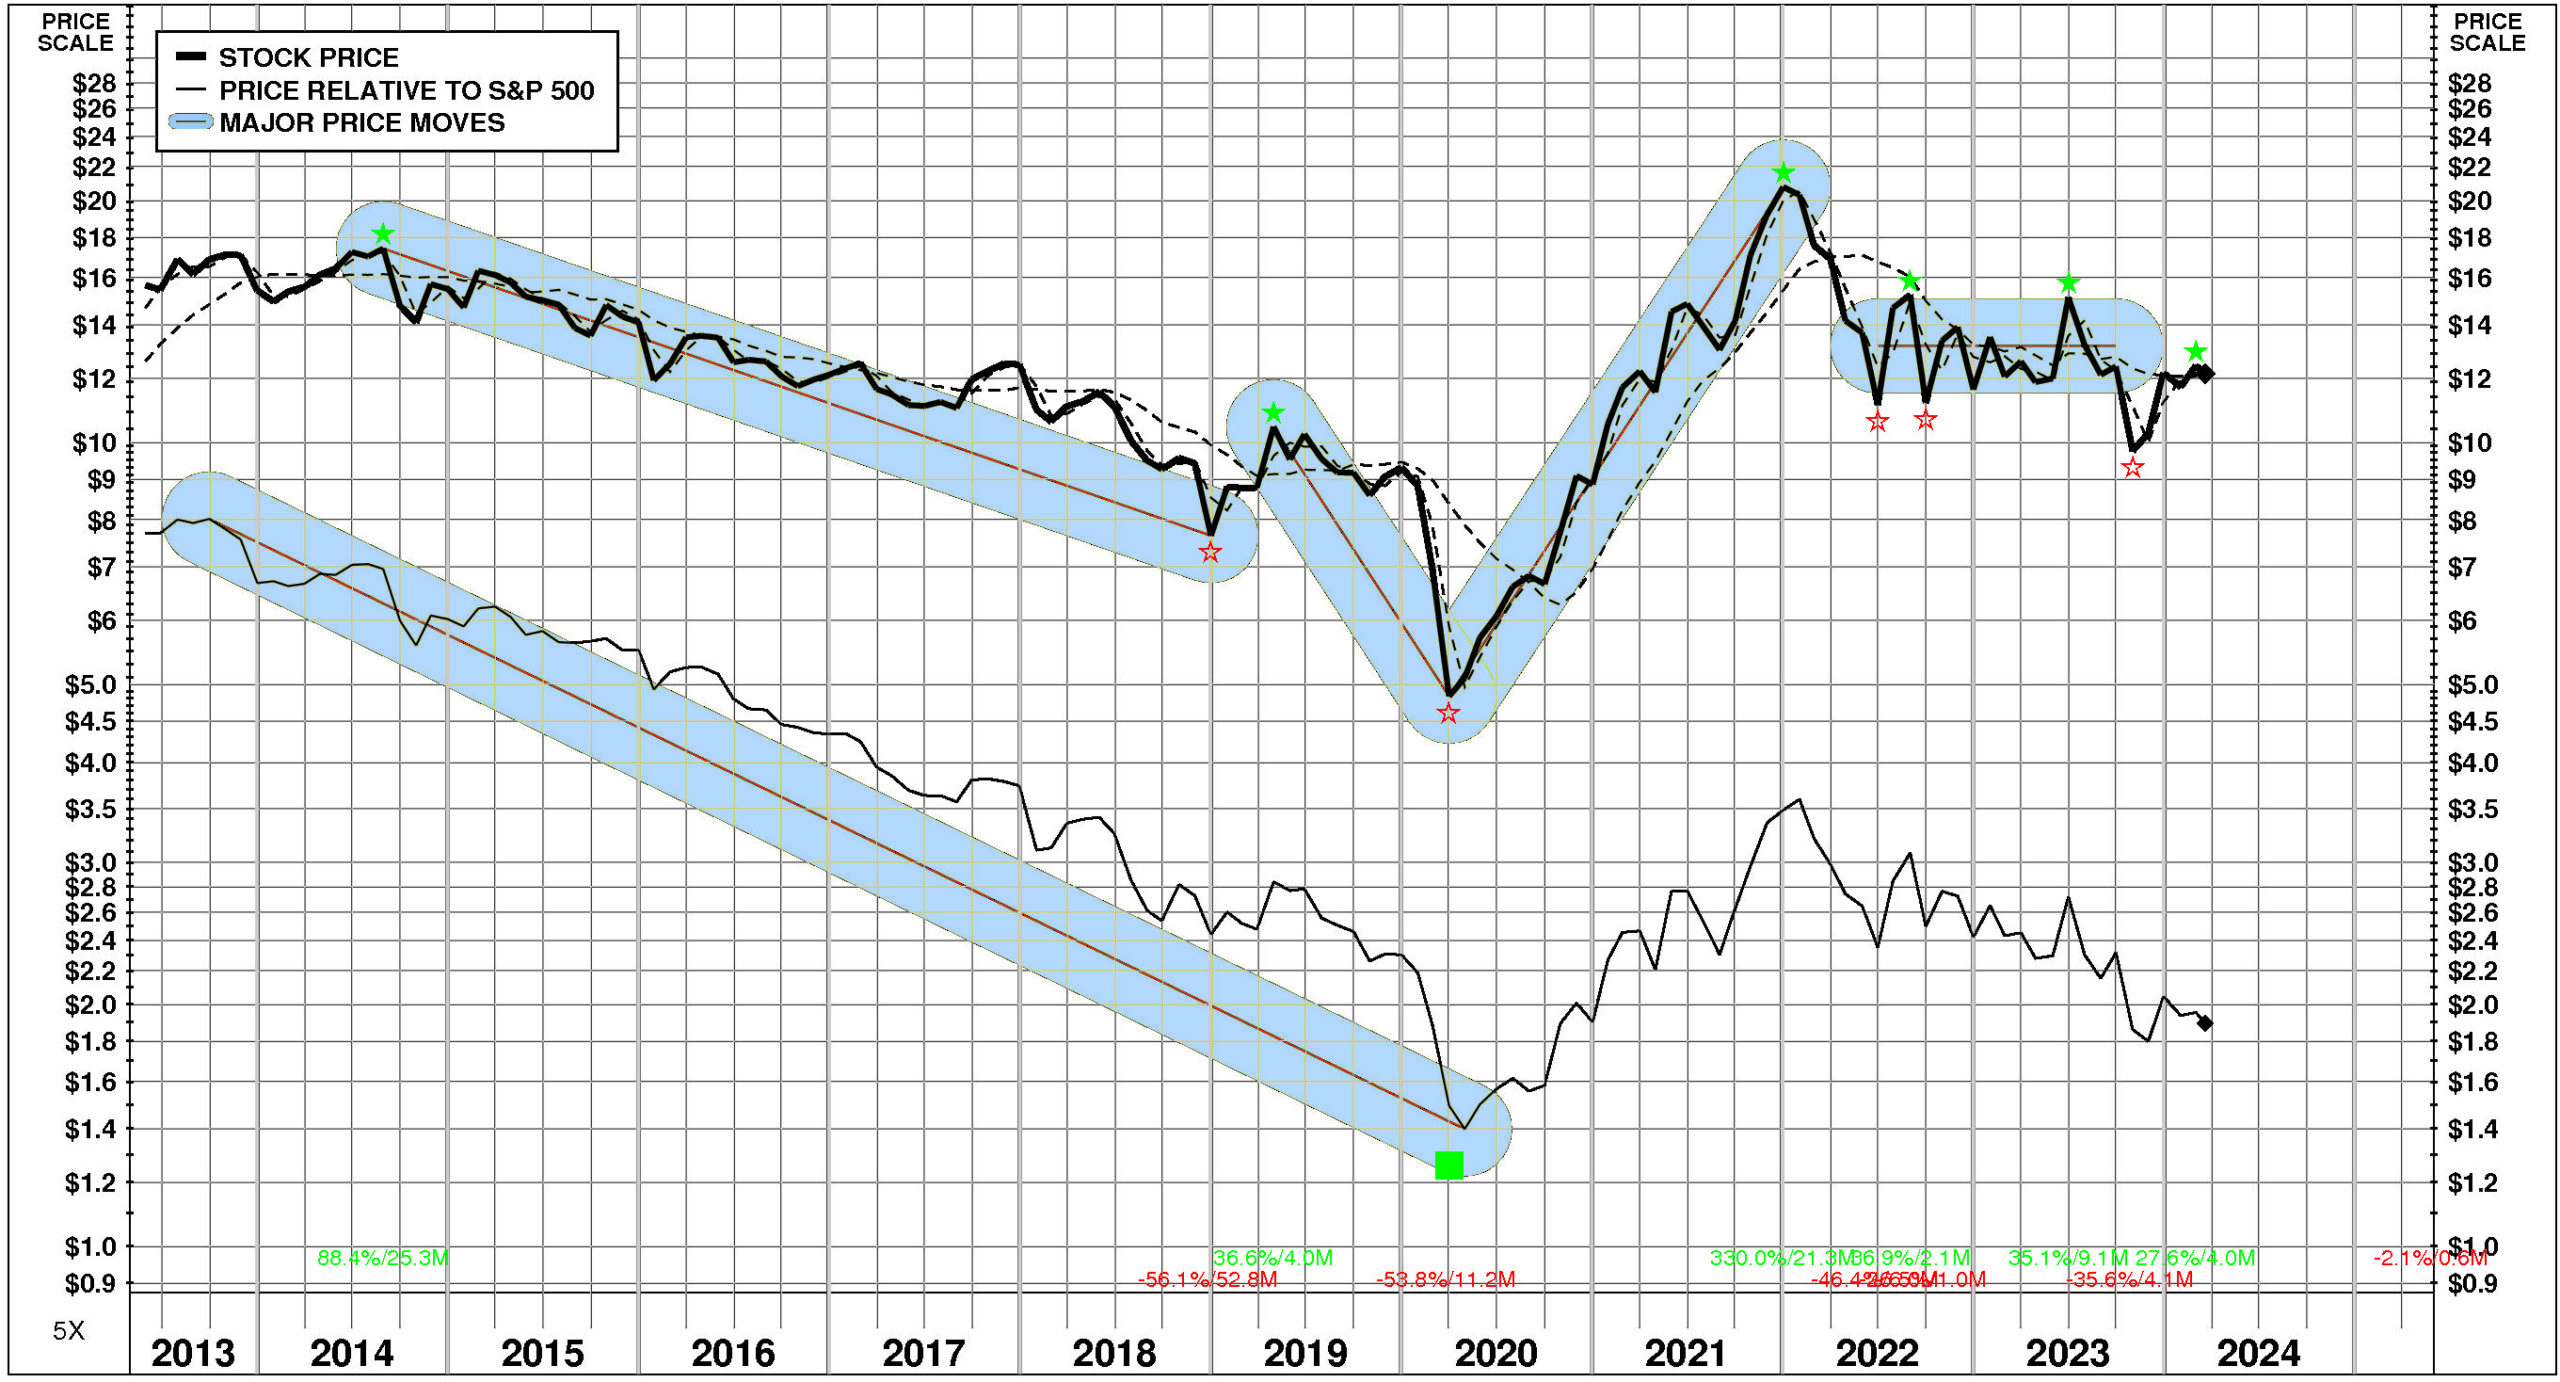
Over the full time period, Ford Motor's stock price performance has been variable and significantly below market.
Between May, 2013 and March, 2024, Ford Motor's stock price fell -22%; relative to the market, this was a -75% loss. Significant price moves during the period: 1) March, 2020 – December, 2021: +330%; 2) April, 2019 – March, 2020: -54%; and 3) August, 2014 – December, 2018: -56%.
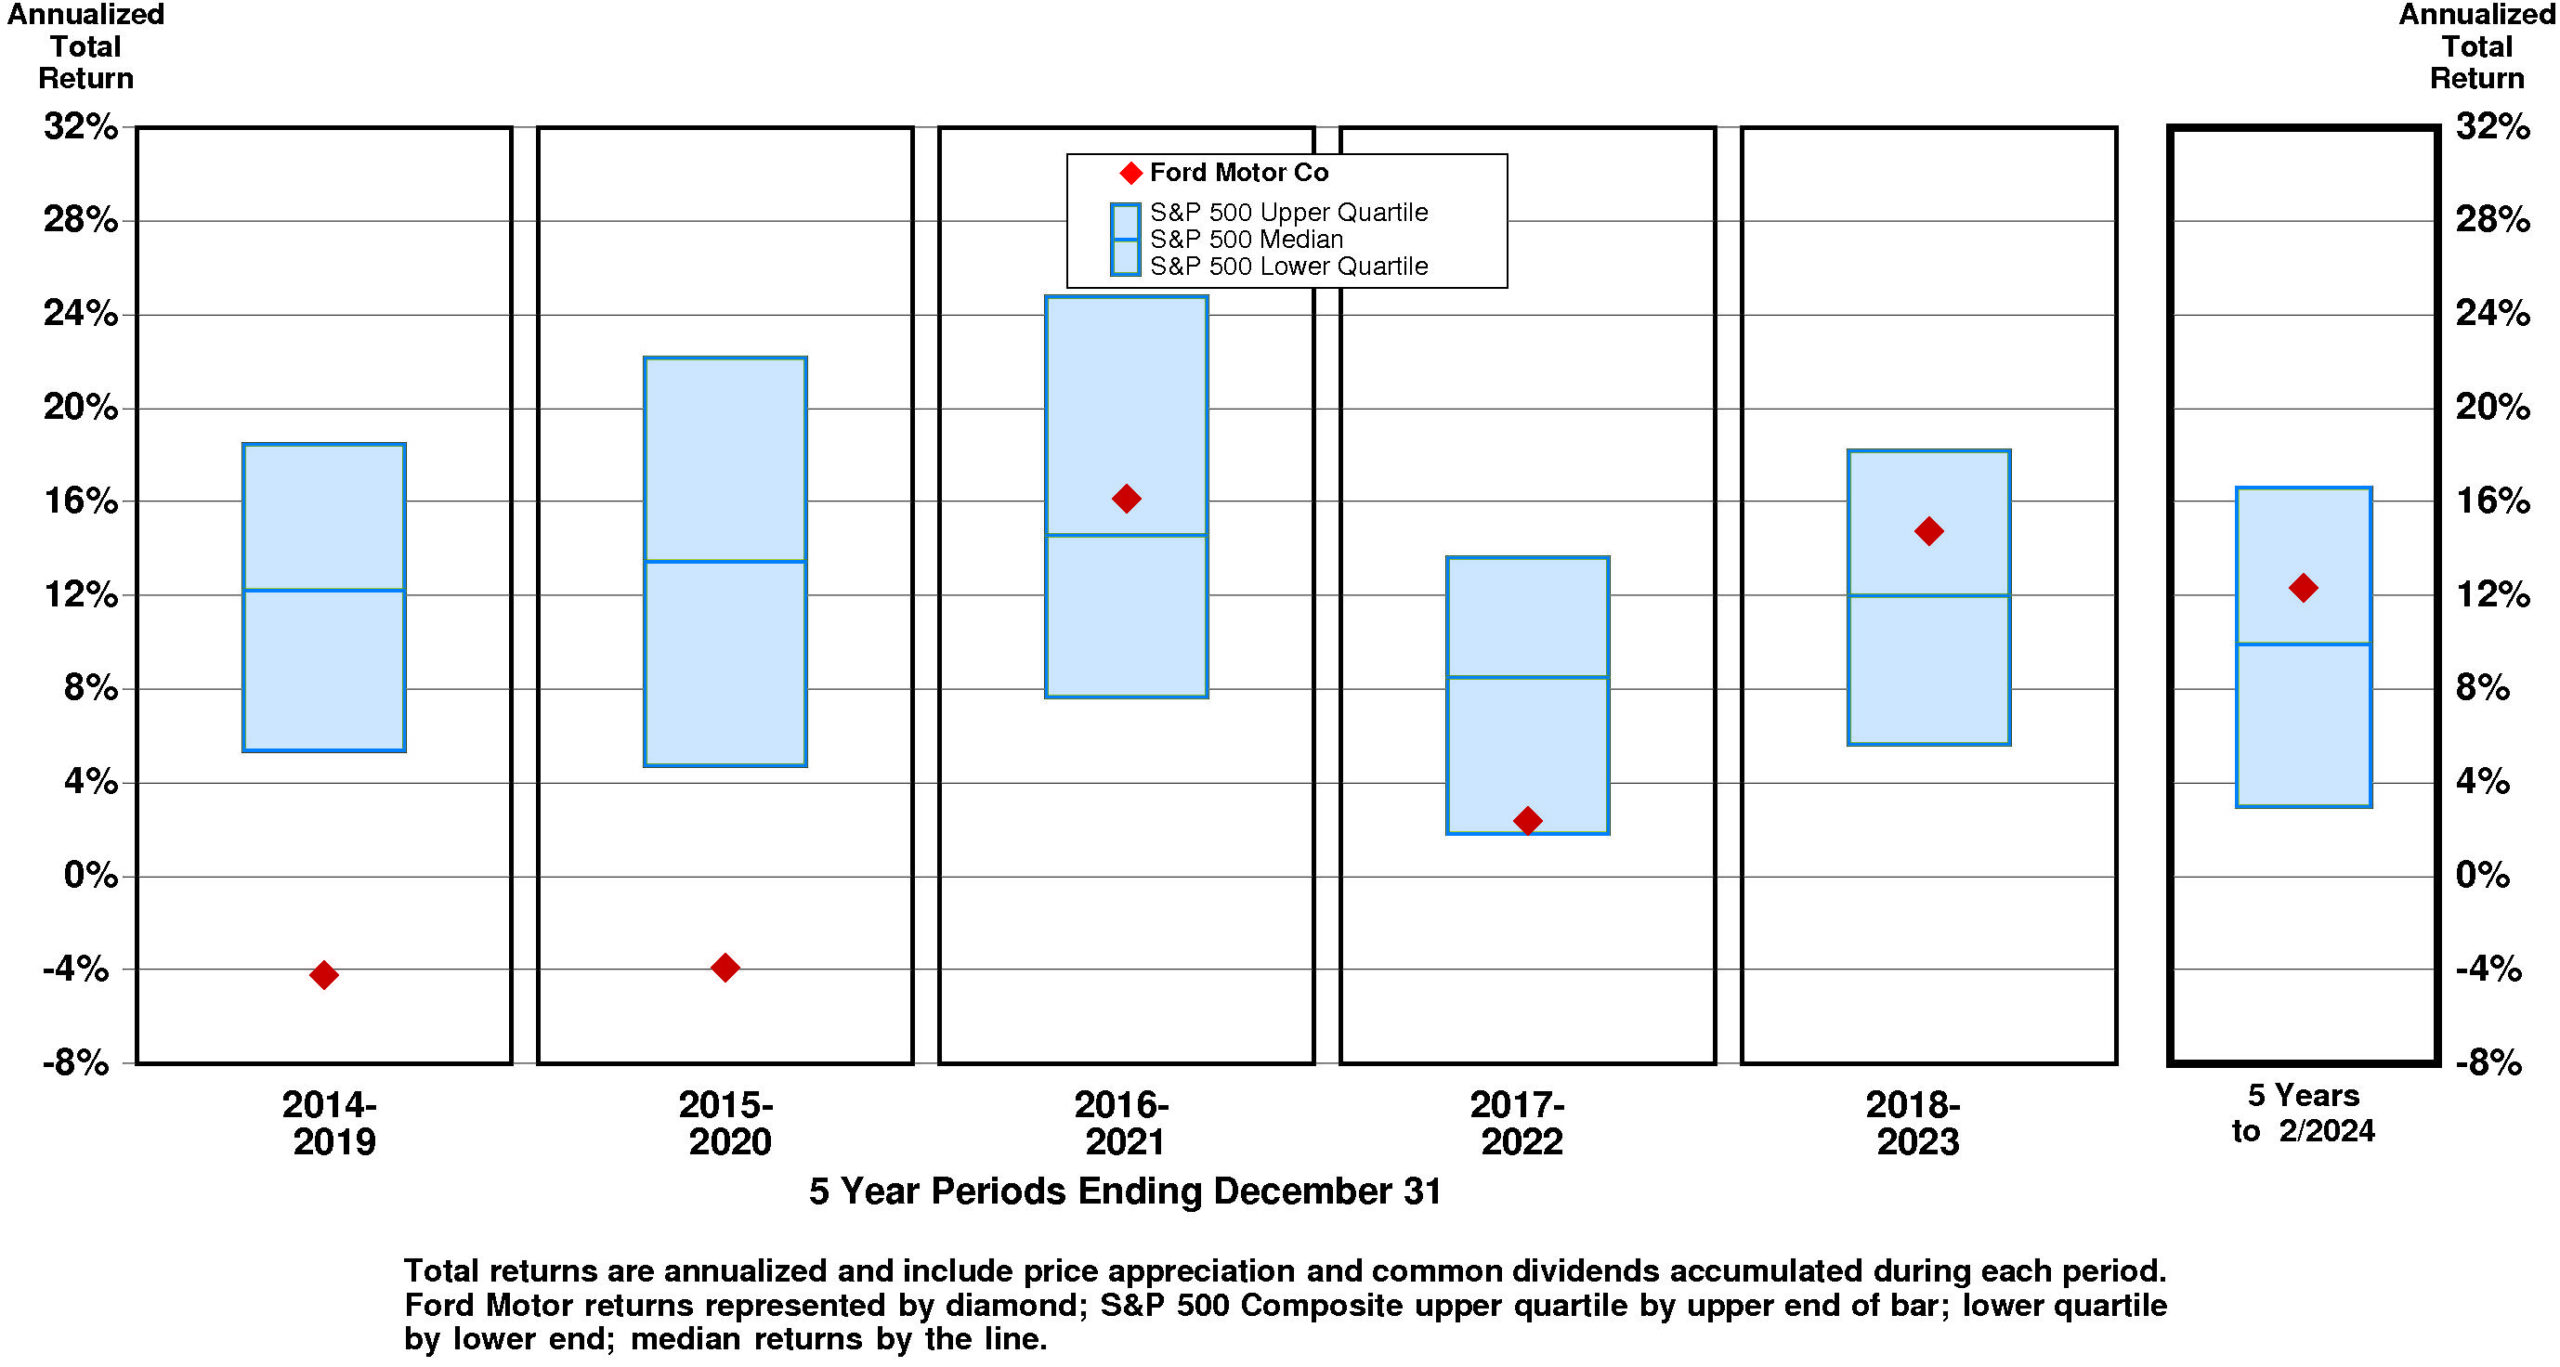
TOTAL INVESTMENT RETURNS
Current annual total return performance of 10.0% is slightly below median relative to the S&P 500 Composite.
In addition to being slightly below median relative to S&P 500 Composite, current annual total return performance through February, 2024 of 10.0% is slightly above median relative to Ford Motor Co Peer Group.
Current 5-year total return performance of 12.3% is above median relative to the S&P 500 Composite.
Through February, 2024, with above median current 5-year total return of 12.3% relative to S&P 500 Composite, Ford Motor's total return performance is substantially above median relative to Ford Motor Co Peer Group.
VALUATION BENCHMARKS
Relative to S&P 500 Composite, F's overall valuation is quite low.
Four of five factors are lower quartile. The highest factor is the ratio of enterprise value/earnings before interest and taxes, followed by the price/earnings ratio, then by the ratio of enterprise value/assets, then by the price/equity ratio. The lowest factor, ratio of enterprise value/revenue, is lower quartile.
Relative to Ford Motor Peer Group, F's overall valuation is low.
The highest factor, the ratio of enterprise value/earnings before interest and taxes, is at median. Price/earnings ratio is lower quartile. Ratio of enterprise value/assets is below median. Ratio of enterprise value/revenue is at the lower quartile. The lowest factor, the price/equity ratio, is near the lower quartile.

Ford Motor has a major value gap compared to the median.
For F to hit median valuation, its current ratio of enterprise value/revenue would have to rise from the current level of 1.13X to 1.57X. If F's ratio of enterprise value/revenue were to rise to 1.57X, its stock price would be higher by $20 to $32.
For F to achieve upper quartile valuation relative to the Ford Motor Peer Group, its current ratio of enterprise value/revenue would have to rise from the current level of 1.13X to 2.05X. If F's ratio of enterprise value/revenue were to rise to 2.05X, its stock price would increase by $42 from the current level of $12.
VALUE TARGETS
Reflecting future returns on capital that are forecasted to be above the cost of capital, F is expected to continue to be a major Value Builder.
Ford Motor's current Price Target of $39 represents a +217% change from the current price of $12.18.
This very high appreciation potential results in an appreciation score of 88 (only 12% of the universe has greater appreciation potential.)
With this high Appreciation Score of 88, the neutral Power Rating of 41 results in an Value Trend Rating of B.
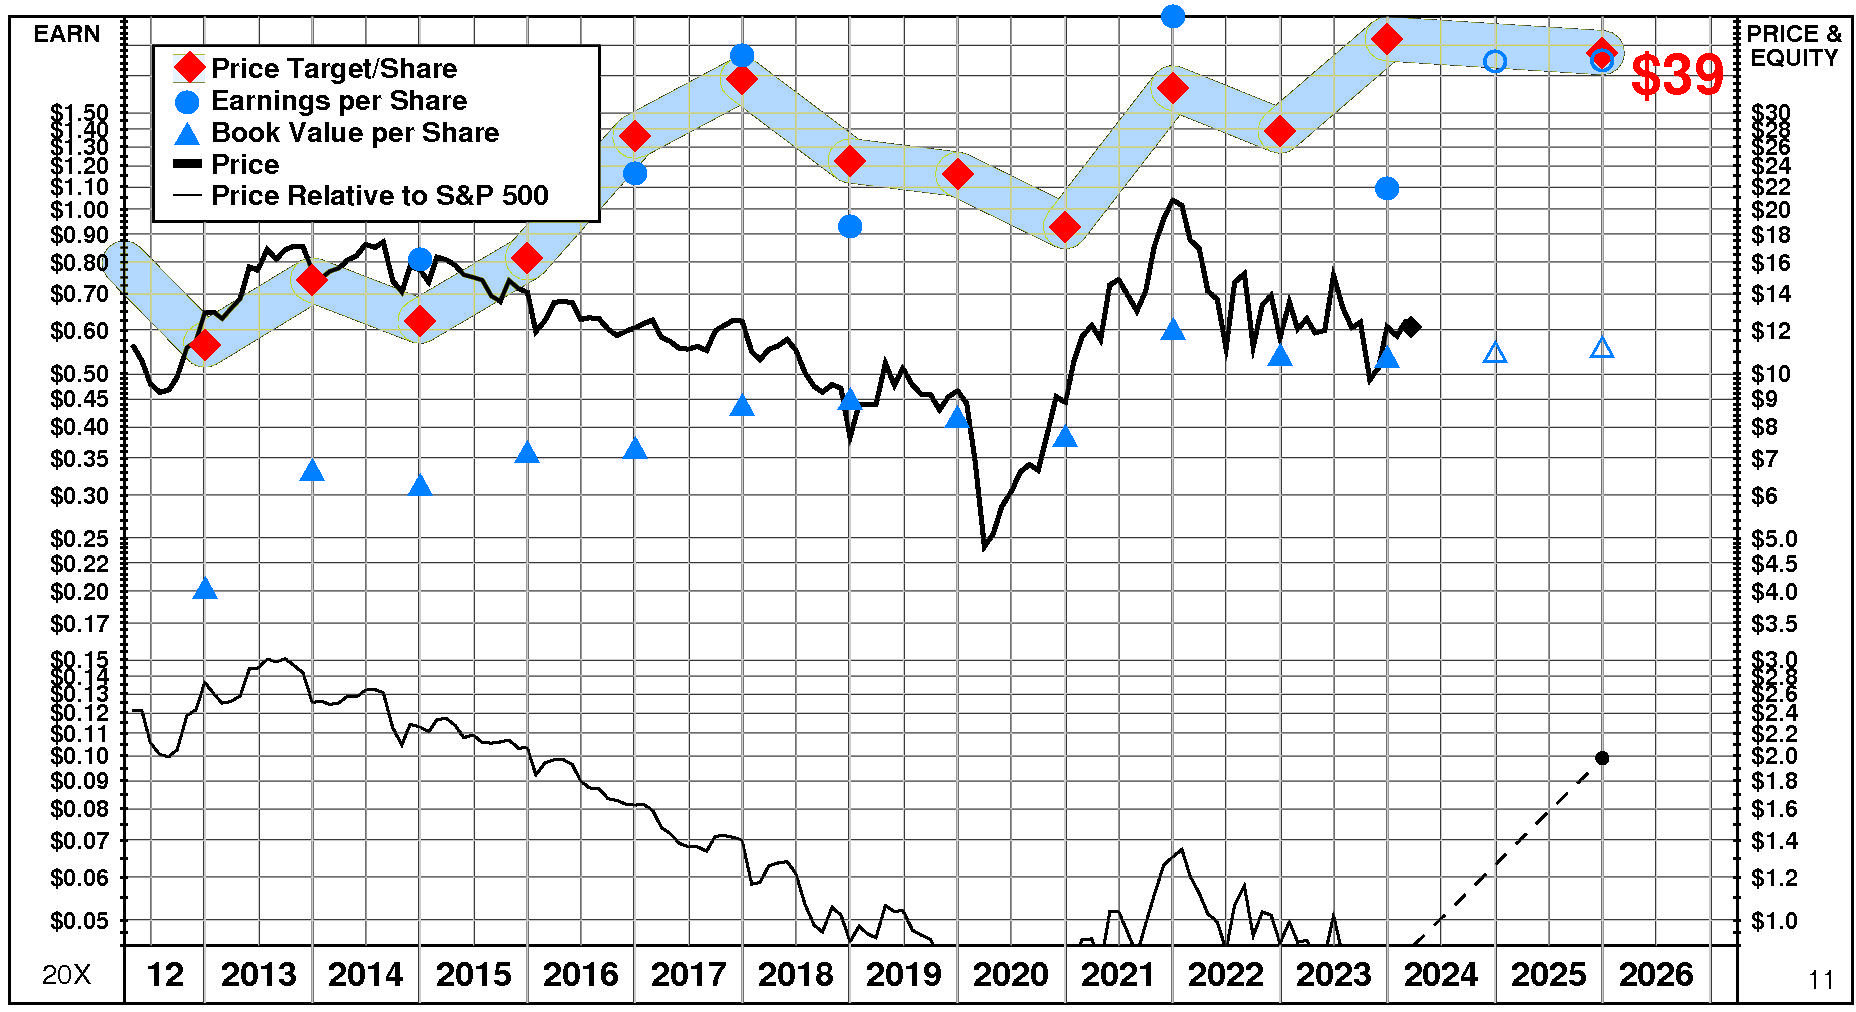
Ford Motor's current Price Target is $39 (-6% from the 2023 Target of $41 but +217% from the 03/18/24 price of $12.18).
This plateau in the Target is the result of a +5% increase in the equity base and a -10% decrease in the price/equity multiple. The forecasted decline in growth has a large negative impact on the price/equity multiple and the forecasted increase in cost of equity has a slight negative impact as well. Partially offsetting these Drivers, the forecasted increase in return on equity has a large positive impact.
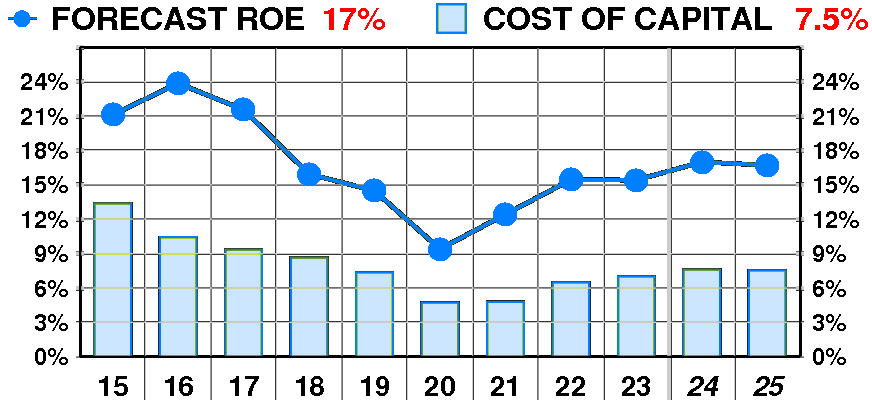
PTR's return on equity forecast is 16.7% — in line with our recent forecasts.
Forecasted return on equity suffered a dramatic, erratic decline between 2015 and 2023. The current forecast is well above the 2020 low of 9%.
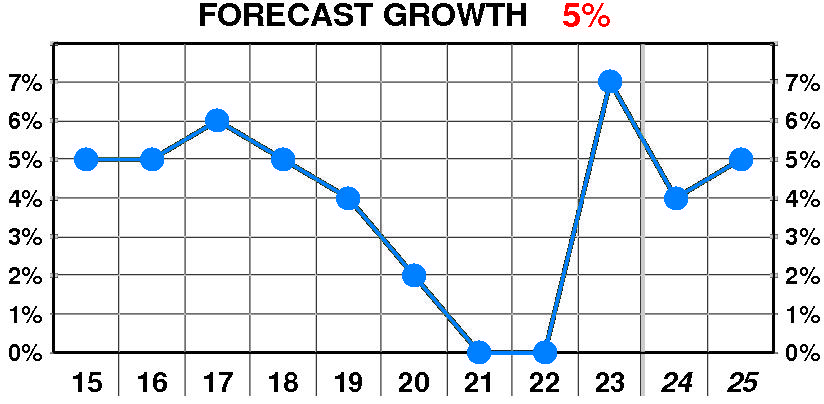
PTR's growth forecast is 5.0% — slightly above our recent forecasts.
Forecasted growth exhibited a slight, erratic decline between 2015 and 2023. The current forecast is above the 2022 low of 0%.
PTR's cost of equity forecast is 7.5% — in line with recent levels.
Forecasted cost of equity enjoyed a dramatic, variable decline between 2015 and 2023. The current forecast is well below the 2015 peak of 13.4%.
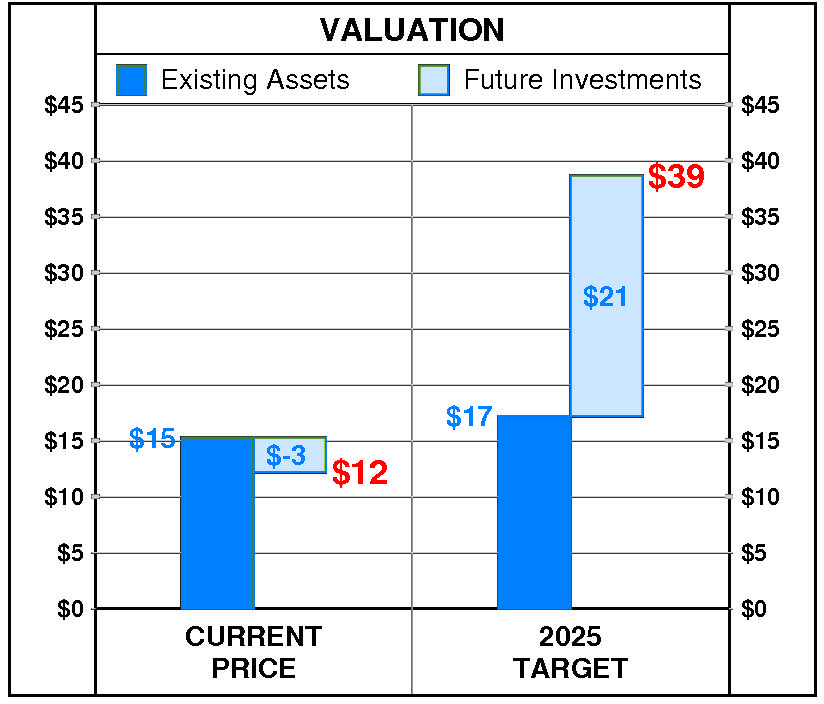
At Ford Motor's current price of $12.18, investors are placing a negative value of $-3 on its future investments. This view is not supported by the company's most recent performance that reflected a growth rate of 7.0% per year, and a return on equity of 15.4% versus a cost of equity of 7.0%.
PTR's 2025 Price Target of $39 is based on these forecasts and reflects an estimated value of existing assets of $17 and a value of future investments of $21.