
BUSINESS
Kennametal Inc. engages in development and application of tungsten carbides, ceramics, and super-hard materials and solutions for use in metal cutting and extreme wear applications to enable customers work against corrosion and high temperatures conditions worldwide. The company operates through two segments, Metal Cutting and Infrastructure. It offers standard and custom products, including turning, milling, hole making, tooling systems, and services, as well as specialized wear components and metallurgical powders for manufacturers engaged in various industries, such as the manufacturers of transportation vehicles and components, machine tools, and light and heavy machinery; airframe and aerospace components; and energy-related components for the oil and gas industry, as well as power generation.
INVESTMENT RATING
KMT's future returns on capital are forecasted to exceed the cost of capital. Accordingly, the company is expected to continue to be a Value Builder.
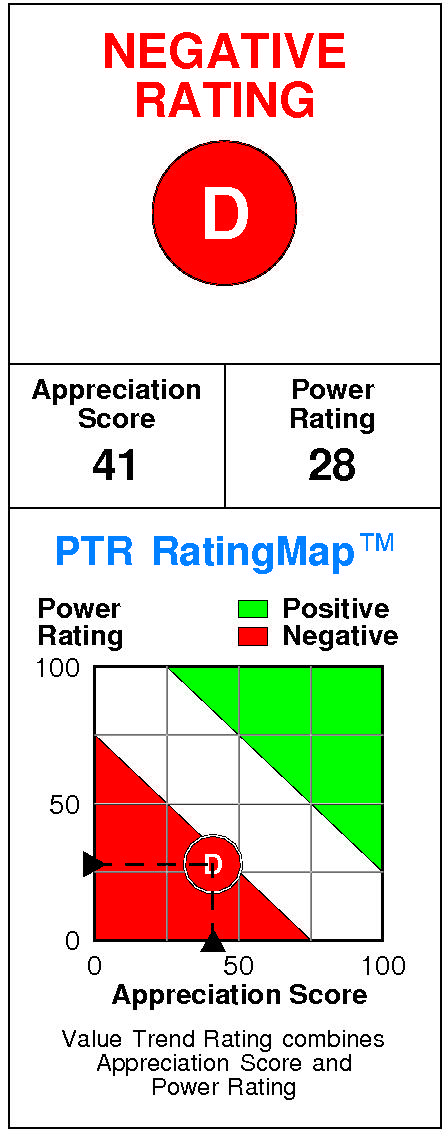
Kennametal has a current Value Trend Rating of D (Negative).
This rating combines inconsistent signals from two proprietary PTR measures of a stock's attractiveness. Kennametal has a neutral Appreciation Score of 41 but a poor Power Rating of 28, leading to the Negative Value Trend Rating.
Kennametal's stock is selling below targeted value.
The current stock price of $23.93 compares to targeted value 12 months forward of $27.
This neutral appreciation potential results in an appreciation score of 41 (59% of the universe has greater appreciation potential.)
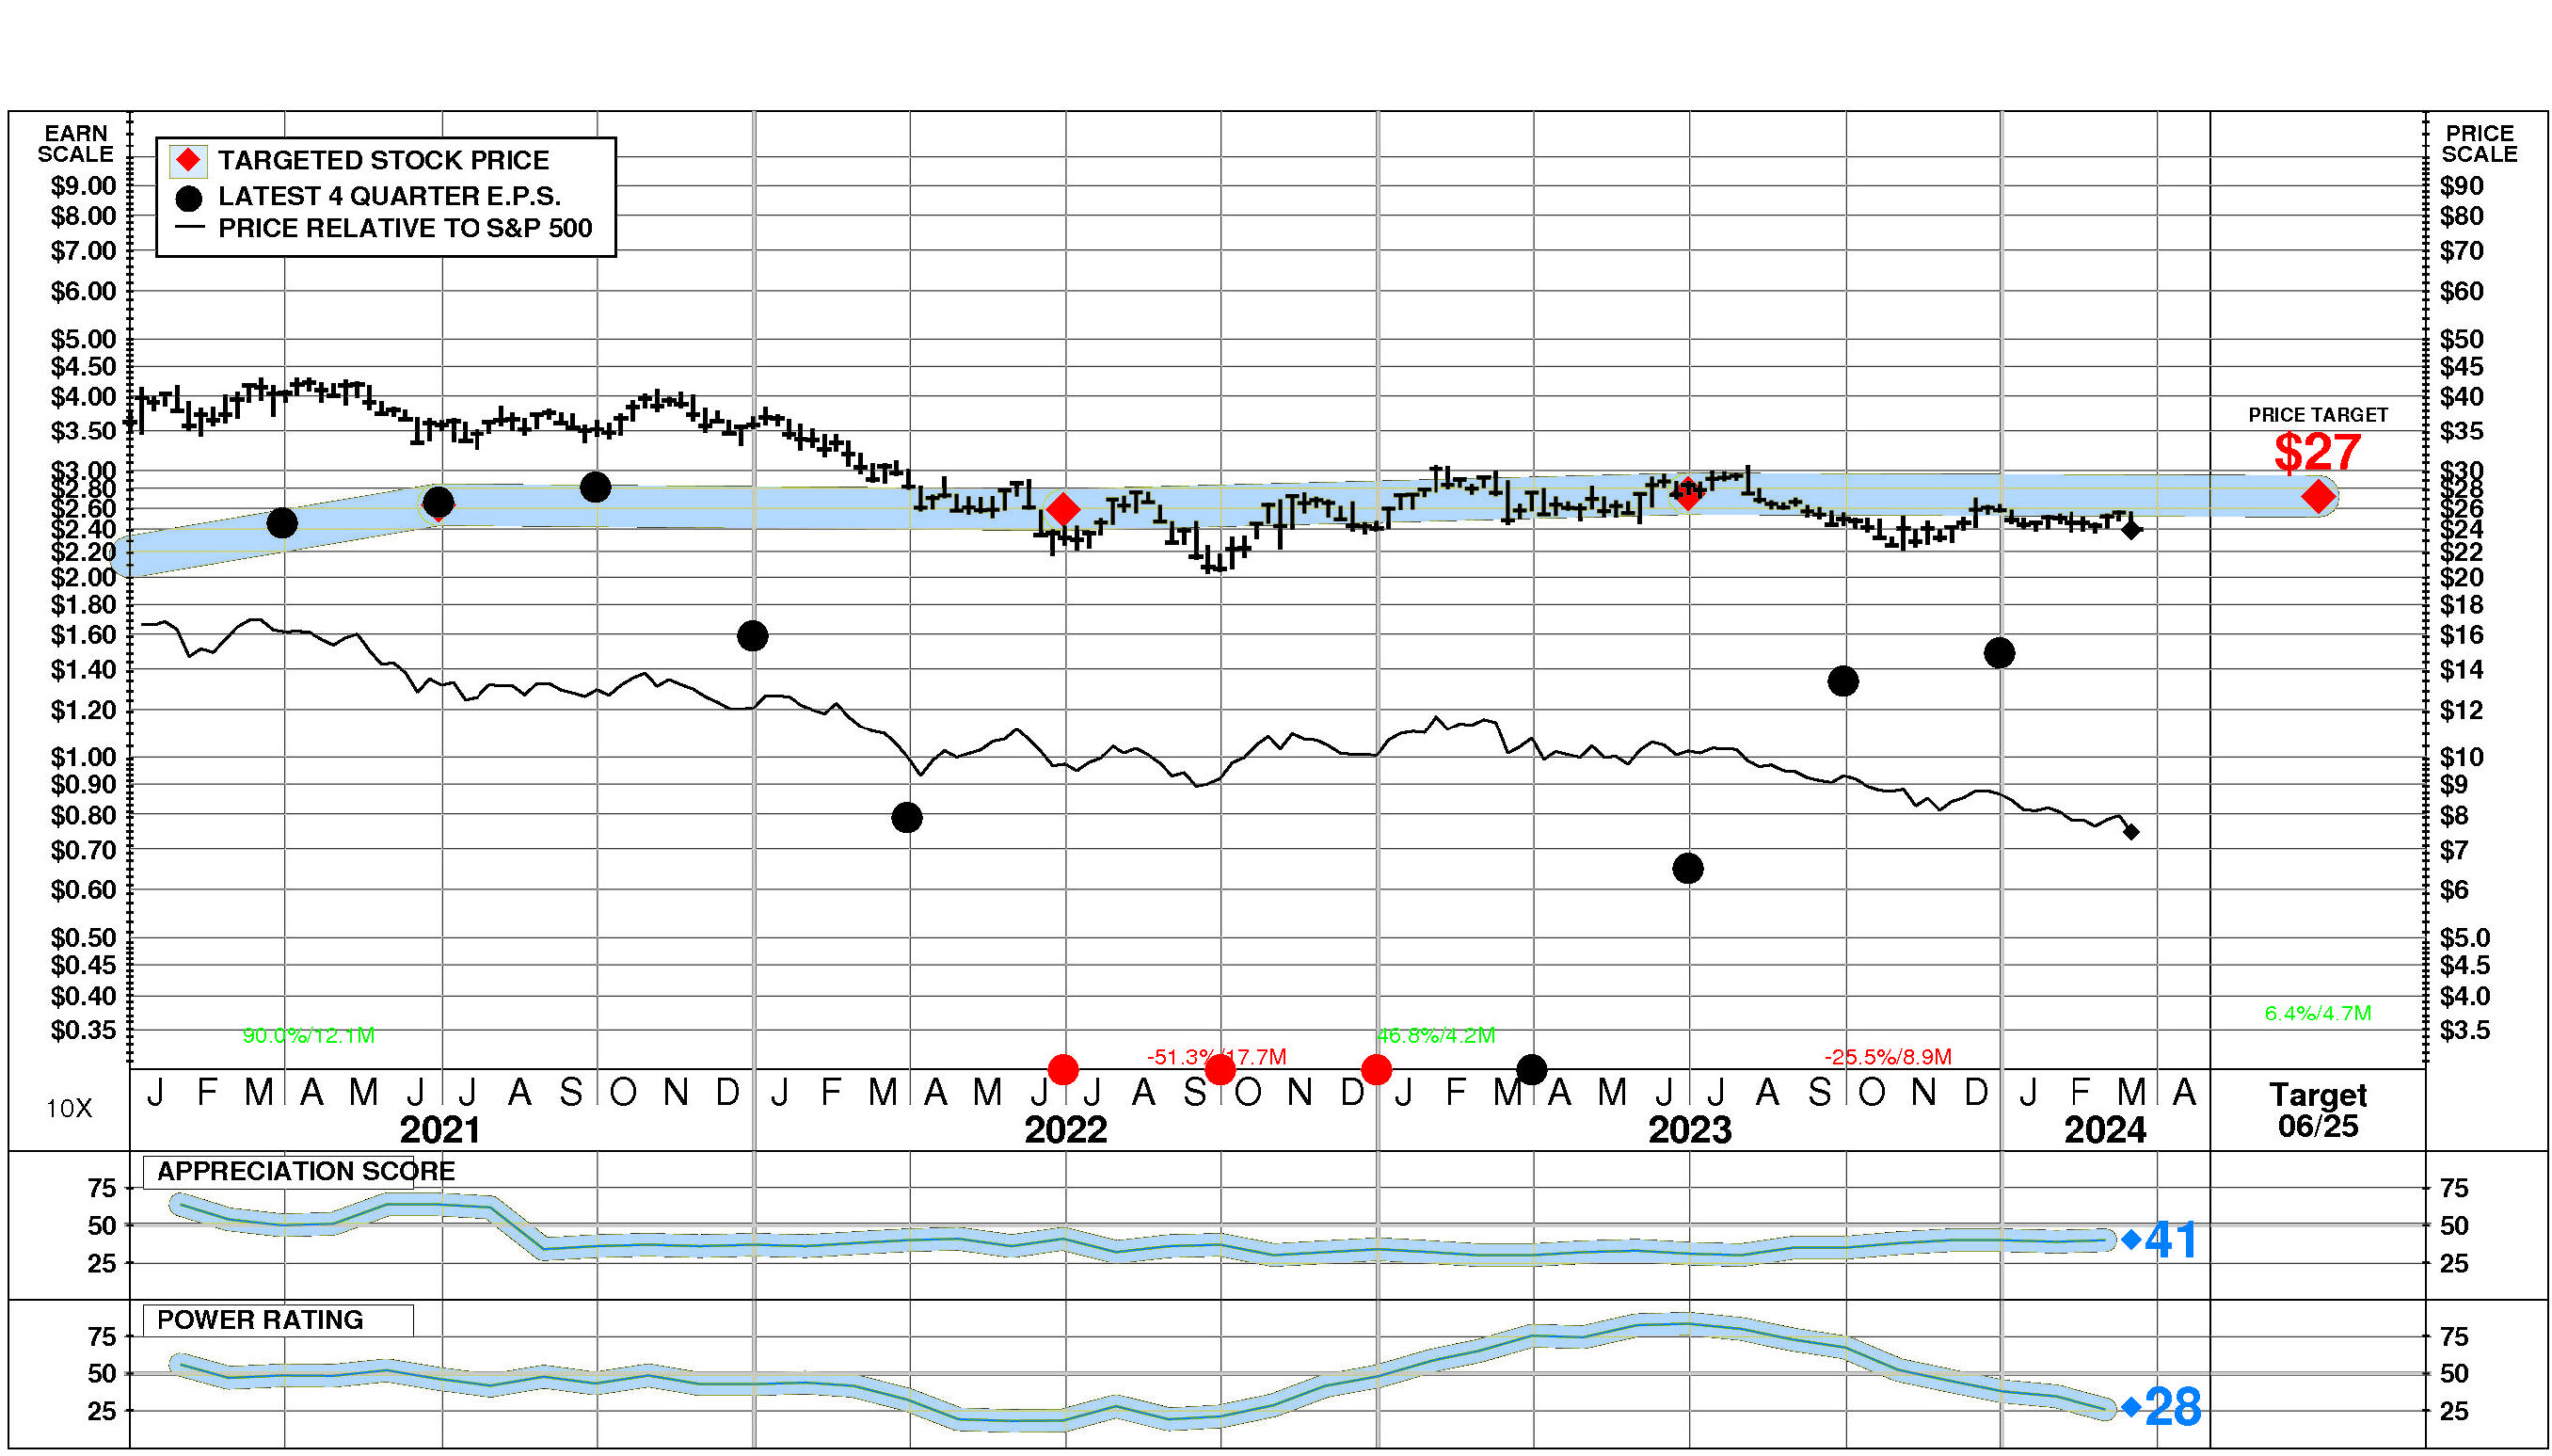
Kennametal has a Power Rating of 28.
(This poor Power Rating indicates that KMT only has a better chance of achieving attractive investment performance over the near to intermediate term than 28% of companies in the universe.)
Factors contributing to this poor Power Rating include: the trend in KMT's earnings estimates has been unfavorable in recent months; recent price action has been slightly unfavorable; and the Metalworking Machinery & Equipment comparison group is in a slightly weakened position currently.
INVESTMENT PROFILE
Kennametal's financial strength is low. Financial strength rating is 14.
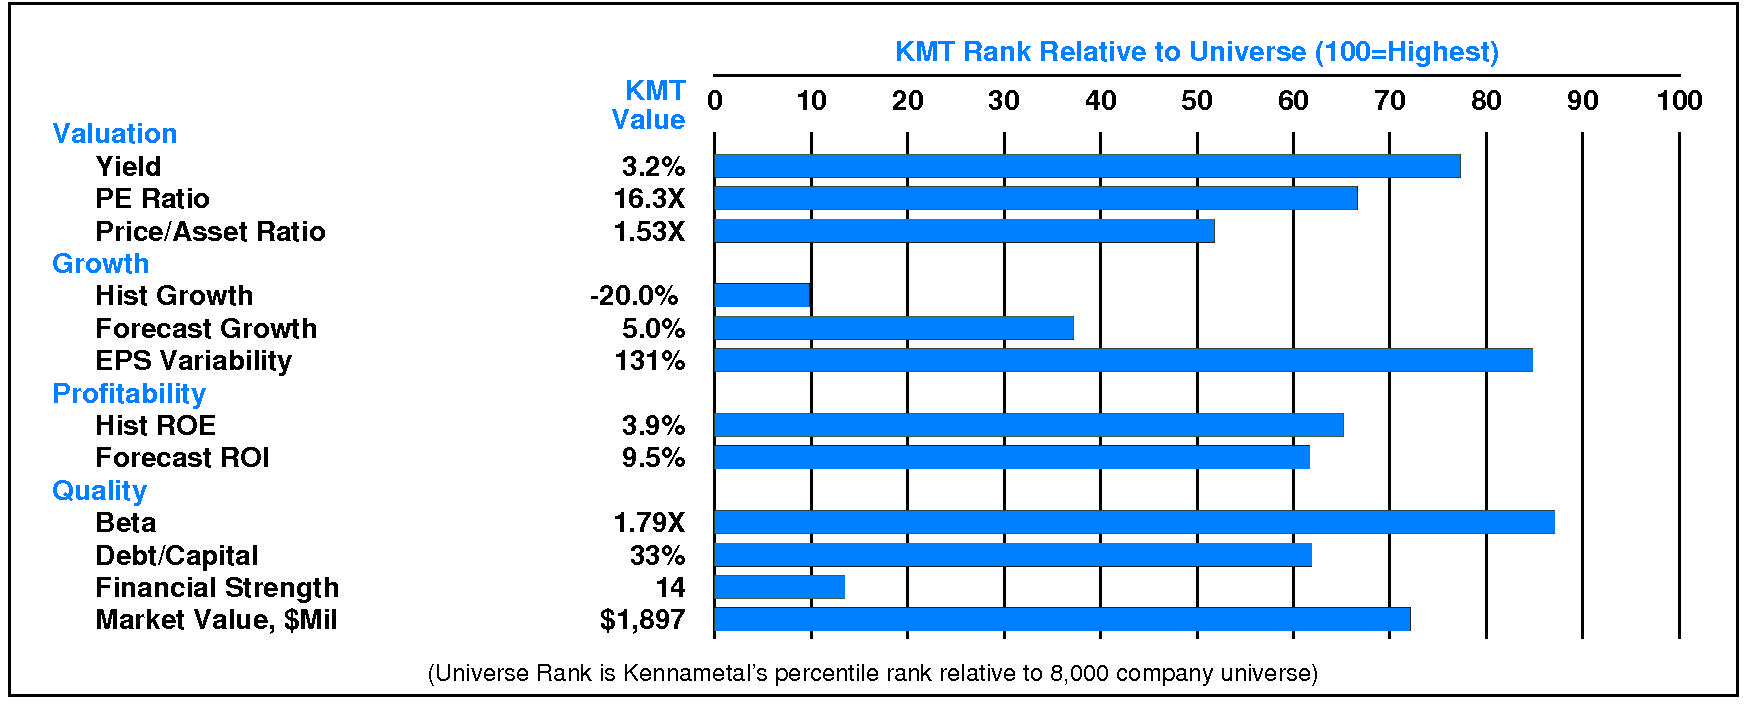
Relative to the S&P 500 Composite, Kennametal Inc. has significant Value characteristics; its appeal is likely to be to Income-oriented investors; the perception is that KMT is higher risk.
Low financial leverage is a positive for Kennametal. Relative weaknesses include: low forecasted profitability, low historical profitability, low financial strength, high stock price volatility, low expected growth, low historical growth, and high earnings variability. Kennametal's valuation is low: high dividend yield, moderate P/E ratio, and low price/book ratio. KMT has unusually low market capitalization.
CURRENT SIGNALS
Kennametal's current operations are eroding.
Return on equity is falling, reflecting: declining pretax margin; and falling leverage.
Kennametal's current technical position is very weak.
The stock price is in a 8.9 month down move. The stock has declined 20.4% from its prior high. The stock price is below its 200 day moving average which is in a downtrend.
ALERTS
Slight positive changes in fundamentals have recently occurred for Kennametal Inc. (NYSE: KMT): significant quarterly earnings acceleration occurred.
The stock is currently rated D.
Kennametal Inc. (NYSE: KMT) stock declined slightly by -0.4% on 3/15/24. The stock closed at $23.93. Moreover, trading volume in this decline was unusually high at 196% of normal. The stock has been weak relative to the market over the last nine months and has declined -5.7% during the last week.
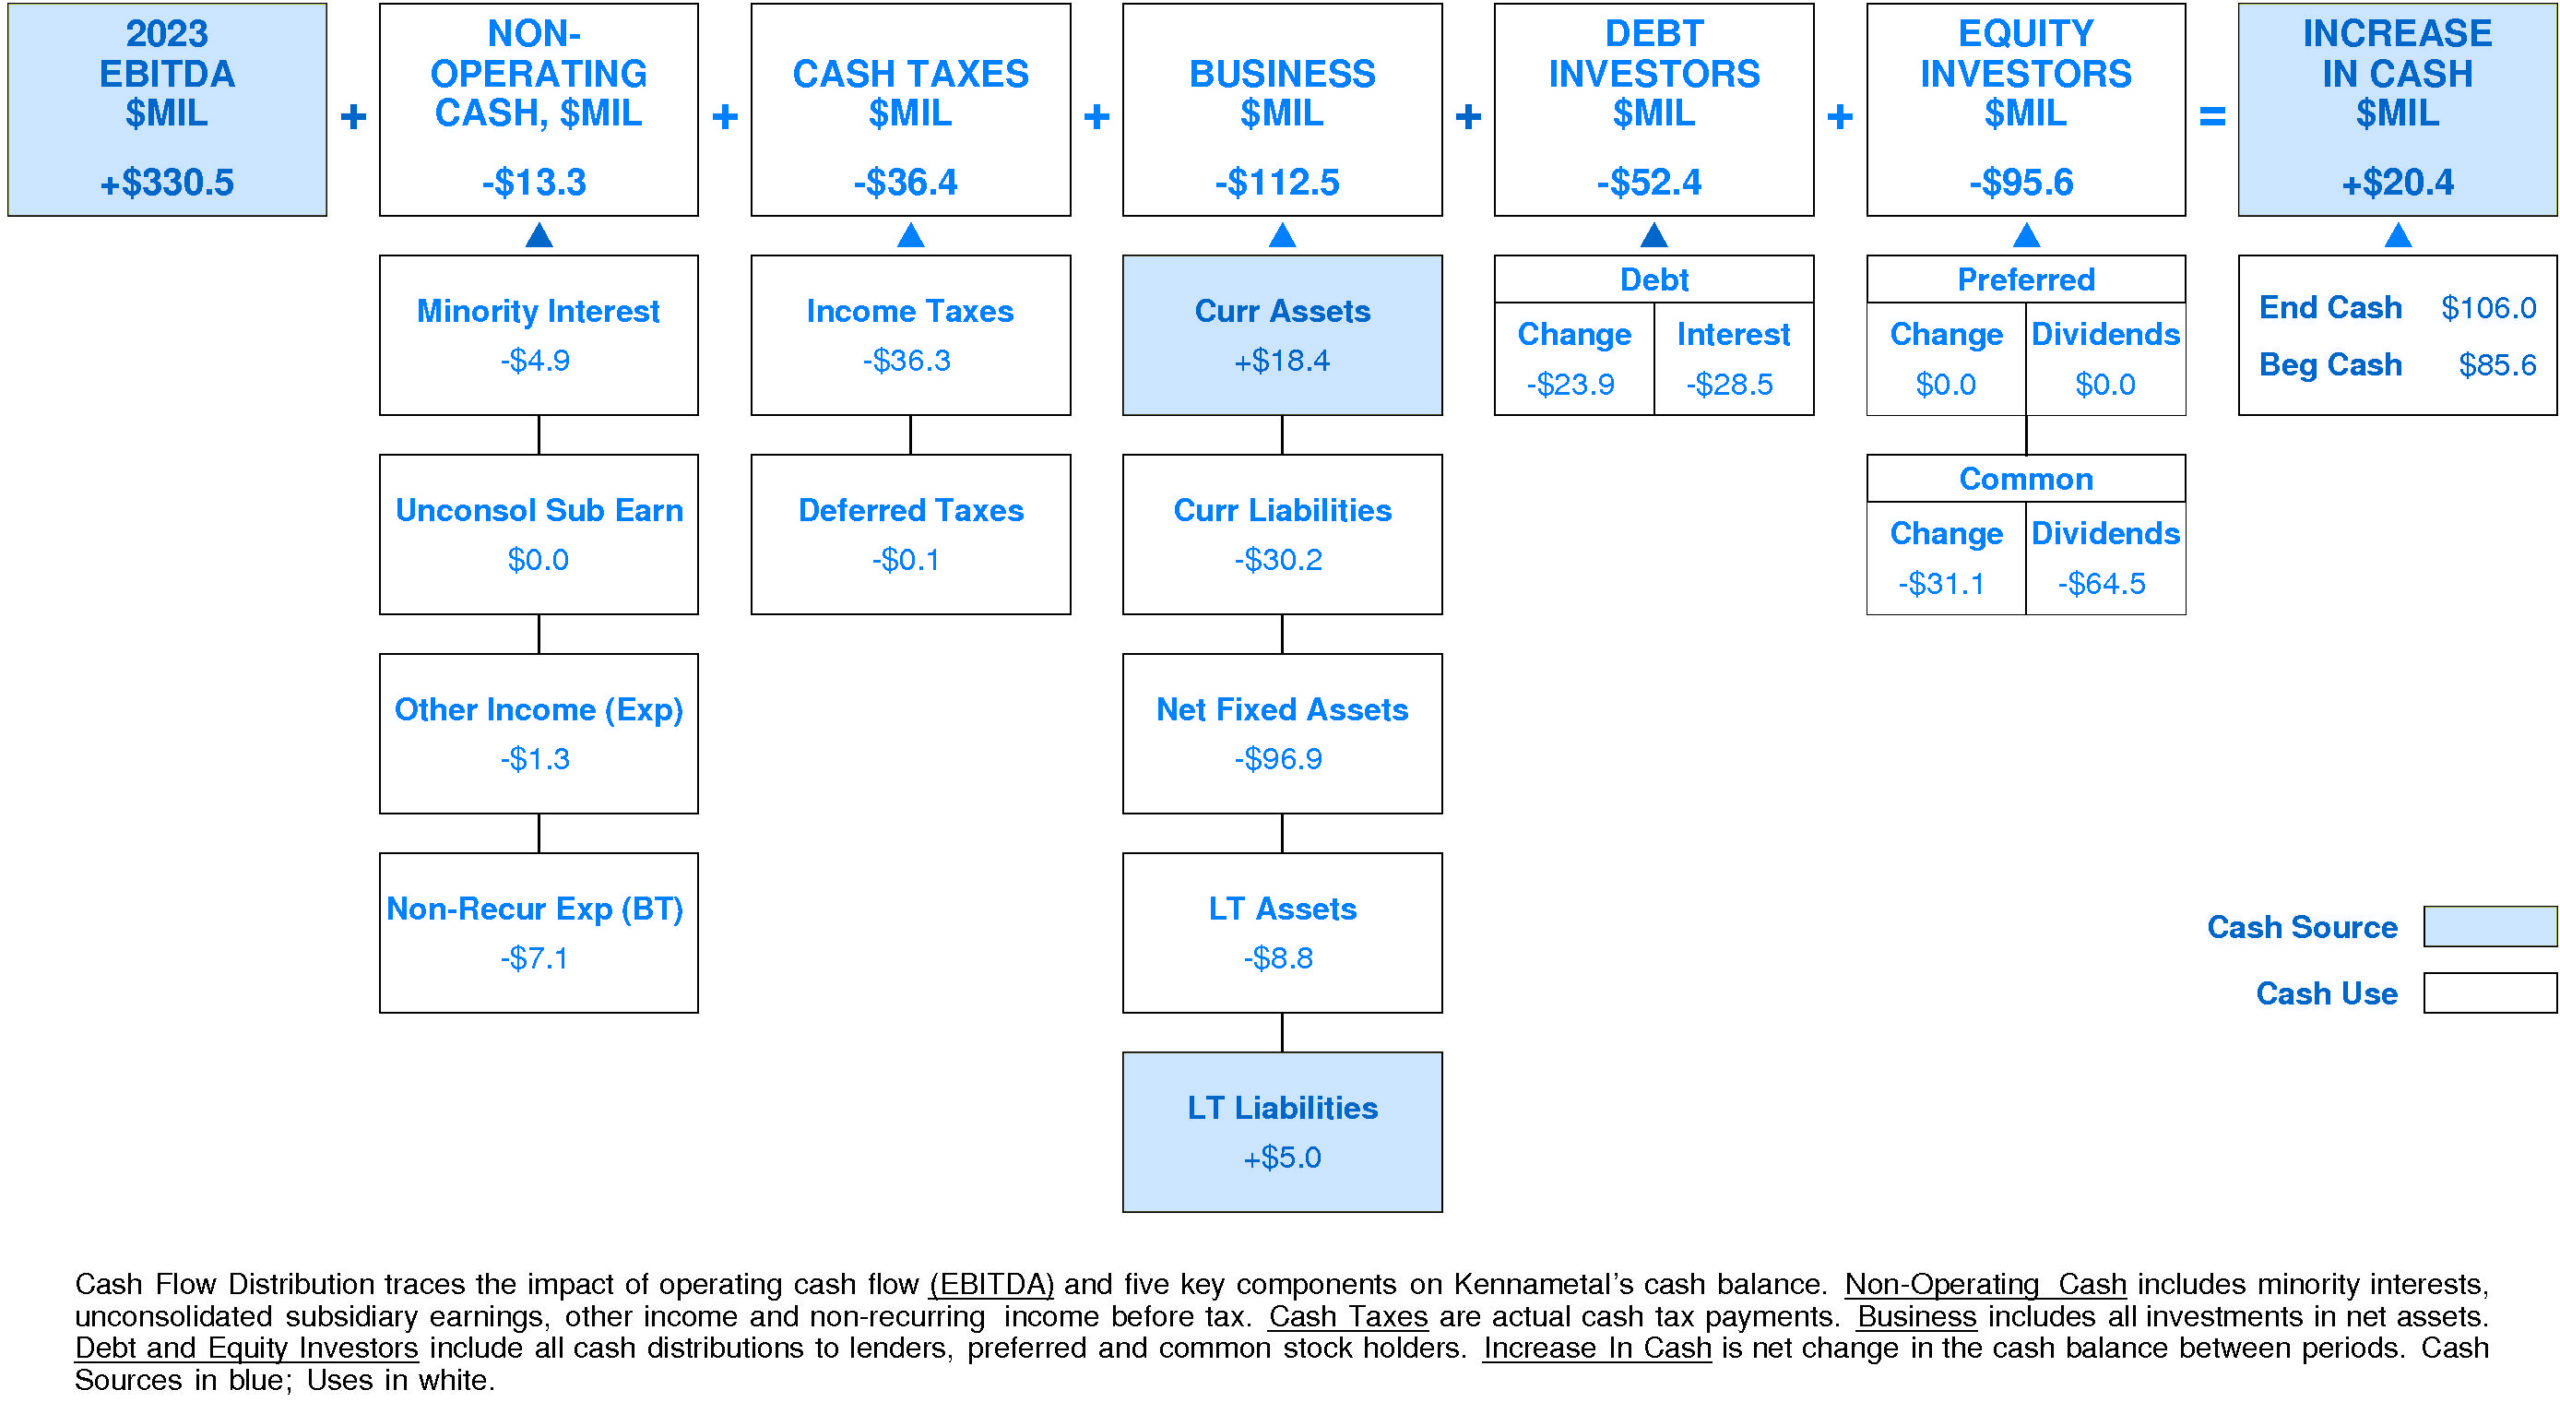
CASH FLOW
In 2023, Kennametal generated a significant increase in cash of +$20.4 million (+24%). Sources of cash were larger than uses.
Cash generated from 2023 EBITDA totaled +$330.5 million. Non-operating uses consumed -$13.3 million (-4% of EBITDA). Cash taxes consumed -$36.4 million (-11% of EBITDA). Re-investment in the business amounted to -$112.5 million (-34% of EBITDA). On a net basis, debt investors received -$52.4 million (-16% of EBITDA) while equity investors removed -$95.6 million (-29% of EBITDA).
Kennametal's Non-operating Income, %EBITDA has enjoyed a very strong overall uptrend over the period.
This improvement was accompanied by a similar trend for the Kennametal Peer Group. In most years, Kennametal was in the lower quartile and second quartile. Currently, Kennametal is above median at -4% of EBITDA (-$13.3 million).
Kennametal's Cash Taxes, %EBITDA has exhibited a volatile overall uptrend over the period.
This improvement was accompanied by a similar trend for the Kennametal Peer Group. In most years, Kennametal was in the top quartile and second quartile. Currently, Kennametal is at median at -11% of EBITDA (-$36.4 million).
Kennametal's Business Re-investment, %EBITDA has suffered a volatile overall downtrend over the period.
This downtrend was accompanied by a similar trend for the Kennametal Peer Group. (Since 2021 Business Re-investment, %EBITDA has experienced a very sharp recovery.) In most years, Kennametal was in the second quartile and top quartile. Currently, Kennametal is slightly above median at -34% of EBITDA (-$112.5 million).
Kennametal's Debt Investors, %EBITDA has experienced a volatile overall downtrend over the period.
This downtrend was accompanied by stability for the Kennametal Peer Group. In most years, Kennametal was in the top quartile and lower quartile. Currently, Kennametal is slightly above median at -16% of EBITDA (-$52.4 million).
Kennametal's Equity Investors, %EBITDA has exhibited little to no overall change over the period.
This stability was accompanied by an uptrend for the Kennametal Peer Group. In most years, Kennametal was in the third quartile and top quartile. Currently, Kennametal is slightly below median at -29% of EBITDA (-$95.6 million).
Kennametal's Change in Cash, %EBITDA has experienced a downtrend over the period.
This downtrend was accompanied by an opposite trend for the Kennametal Peer Group. (Since 2021 Change in Cash, %EBITDA has experienced a very sharp recovery.) In most years, Kennametal was in the top quartile and lower quartile. Currently, Kennametal is slightly above median at +6% of EBITDA (+$20.4 million).
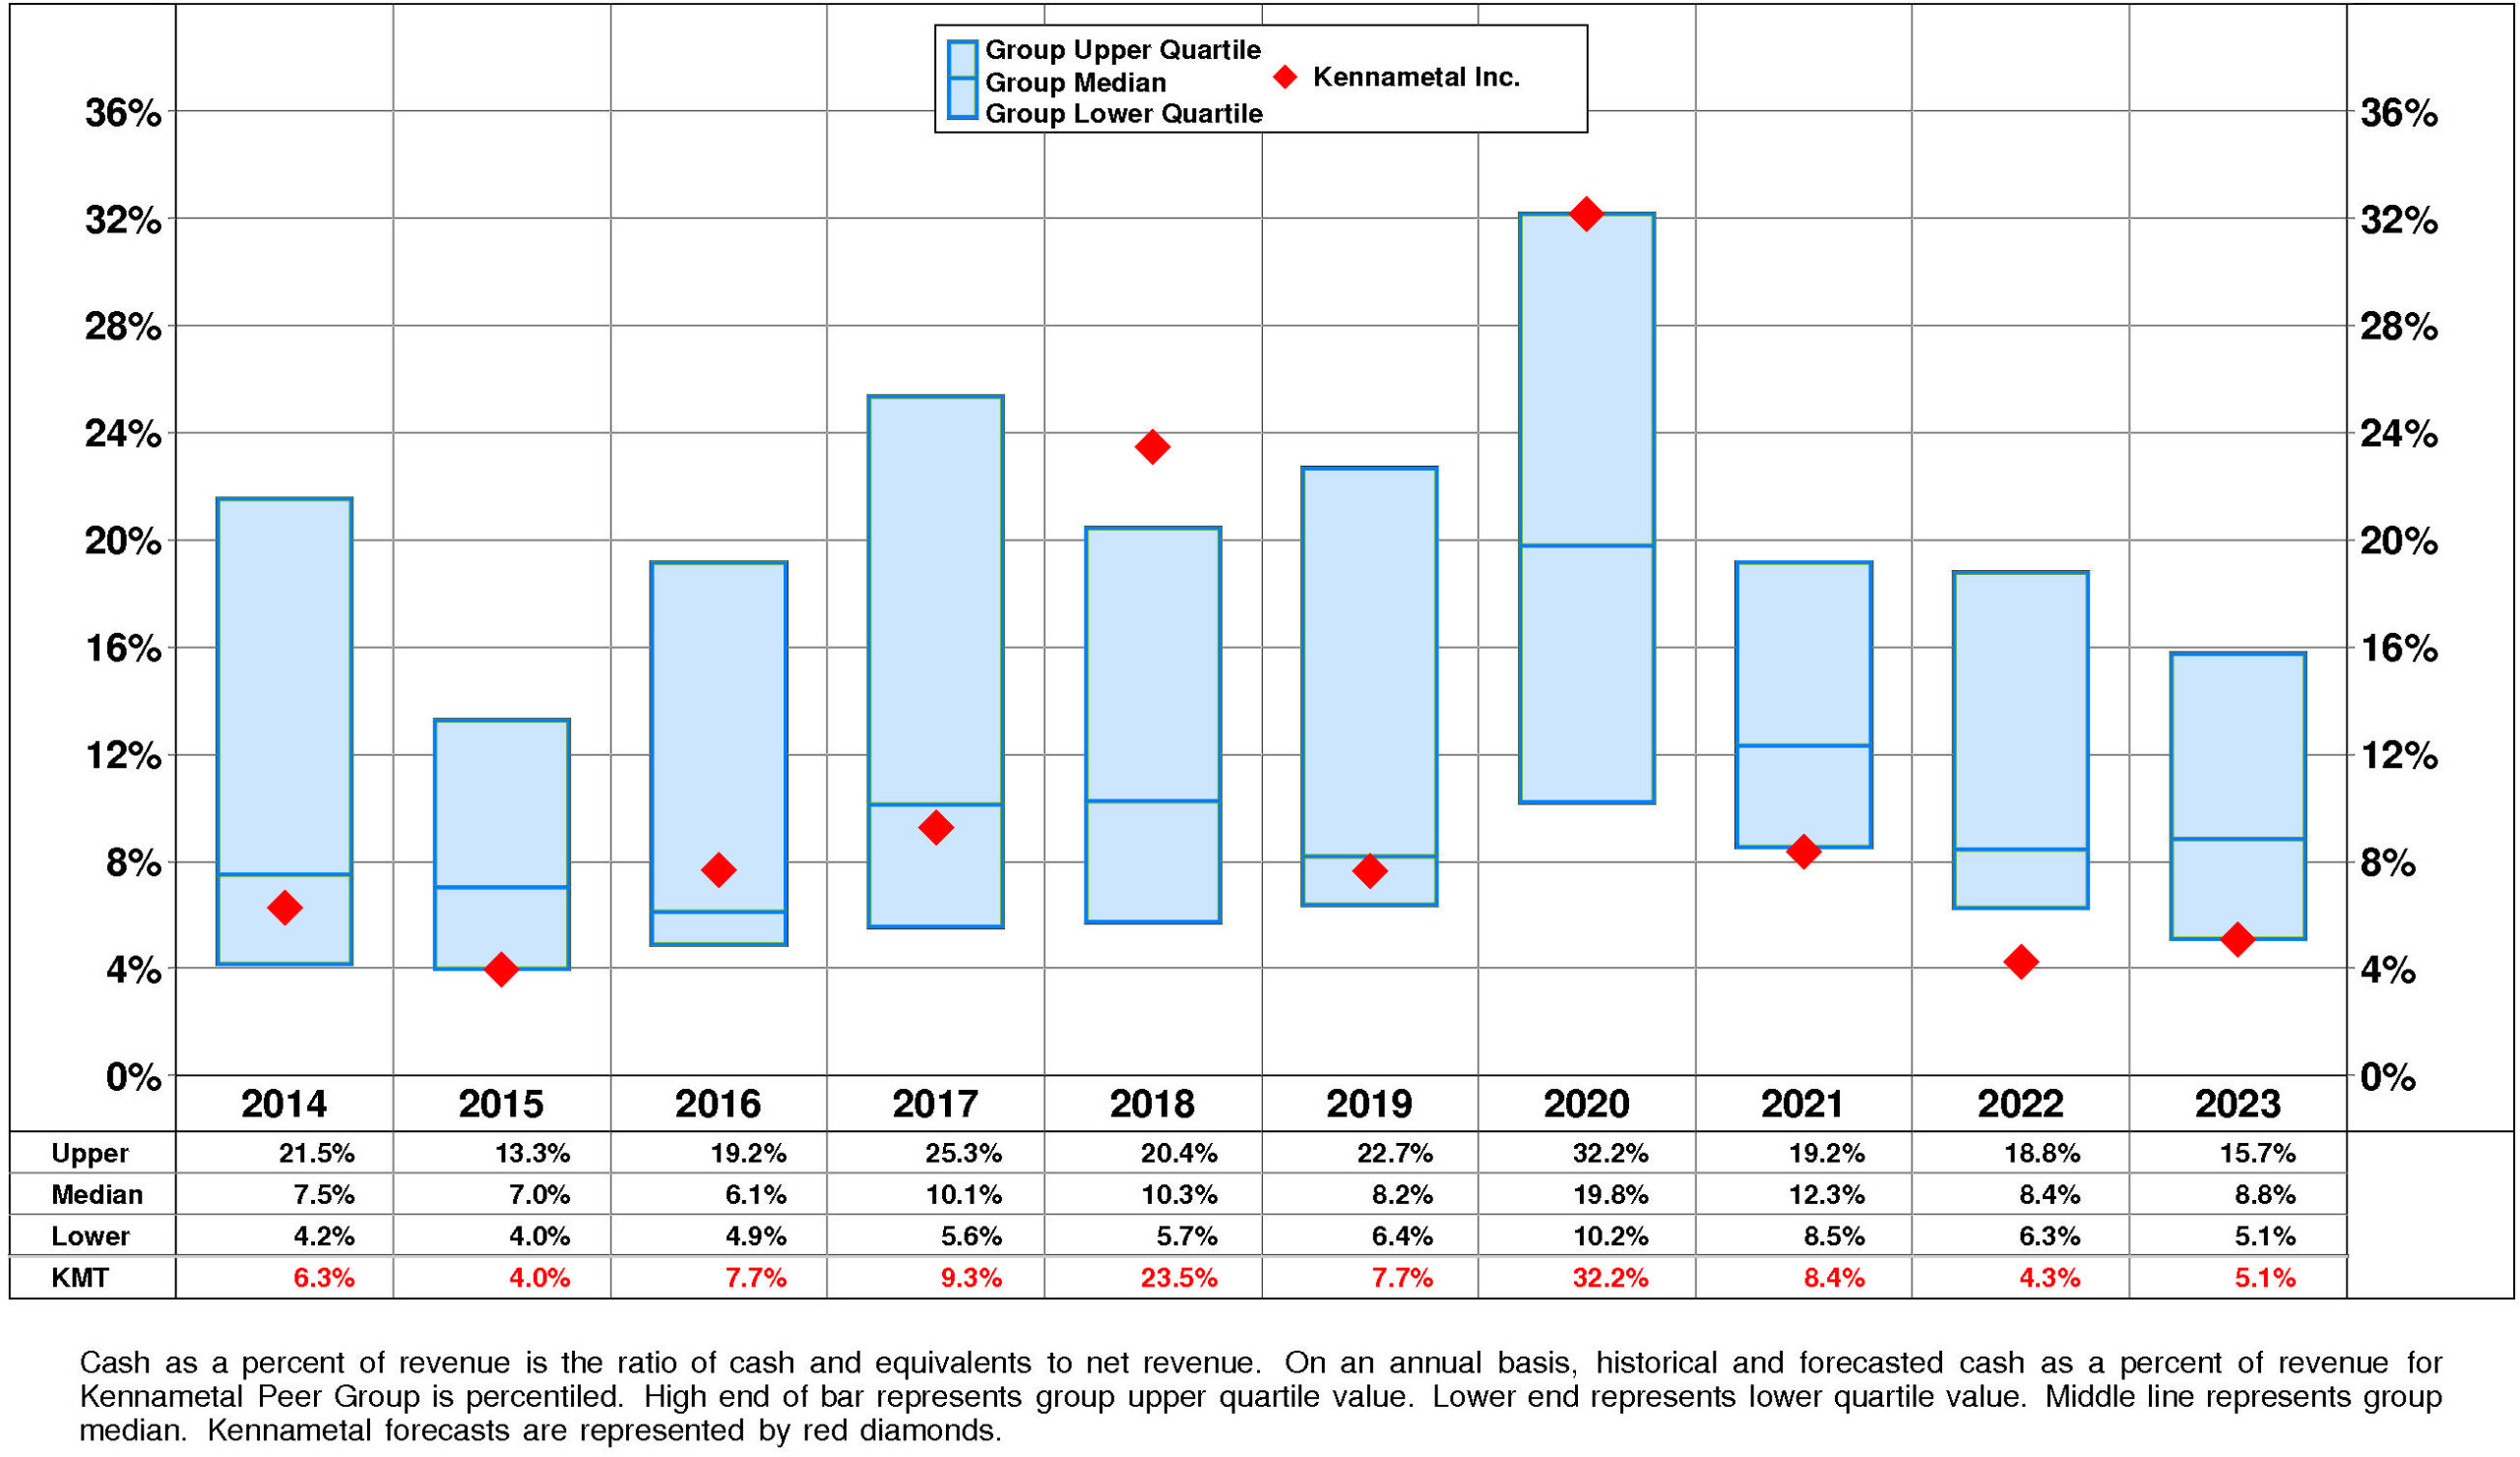
Kennametal's Cash, %Revenue has exhibited little to no overall change over the period.
This stability was accompanied by stability for the Kennametal Peer Group as well. (Since 2020 Cash, %Revenue has experienced a very sharp decline.) In most years, Kennametal was in the third quartile and top quartile. Currently, Kennametal is at the lower quartile at +5%.
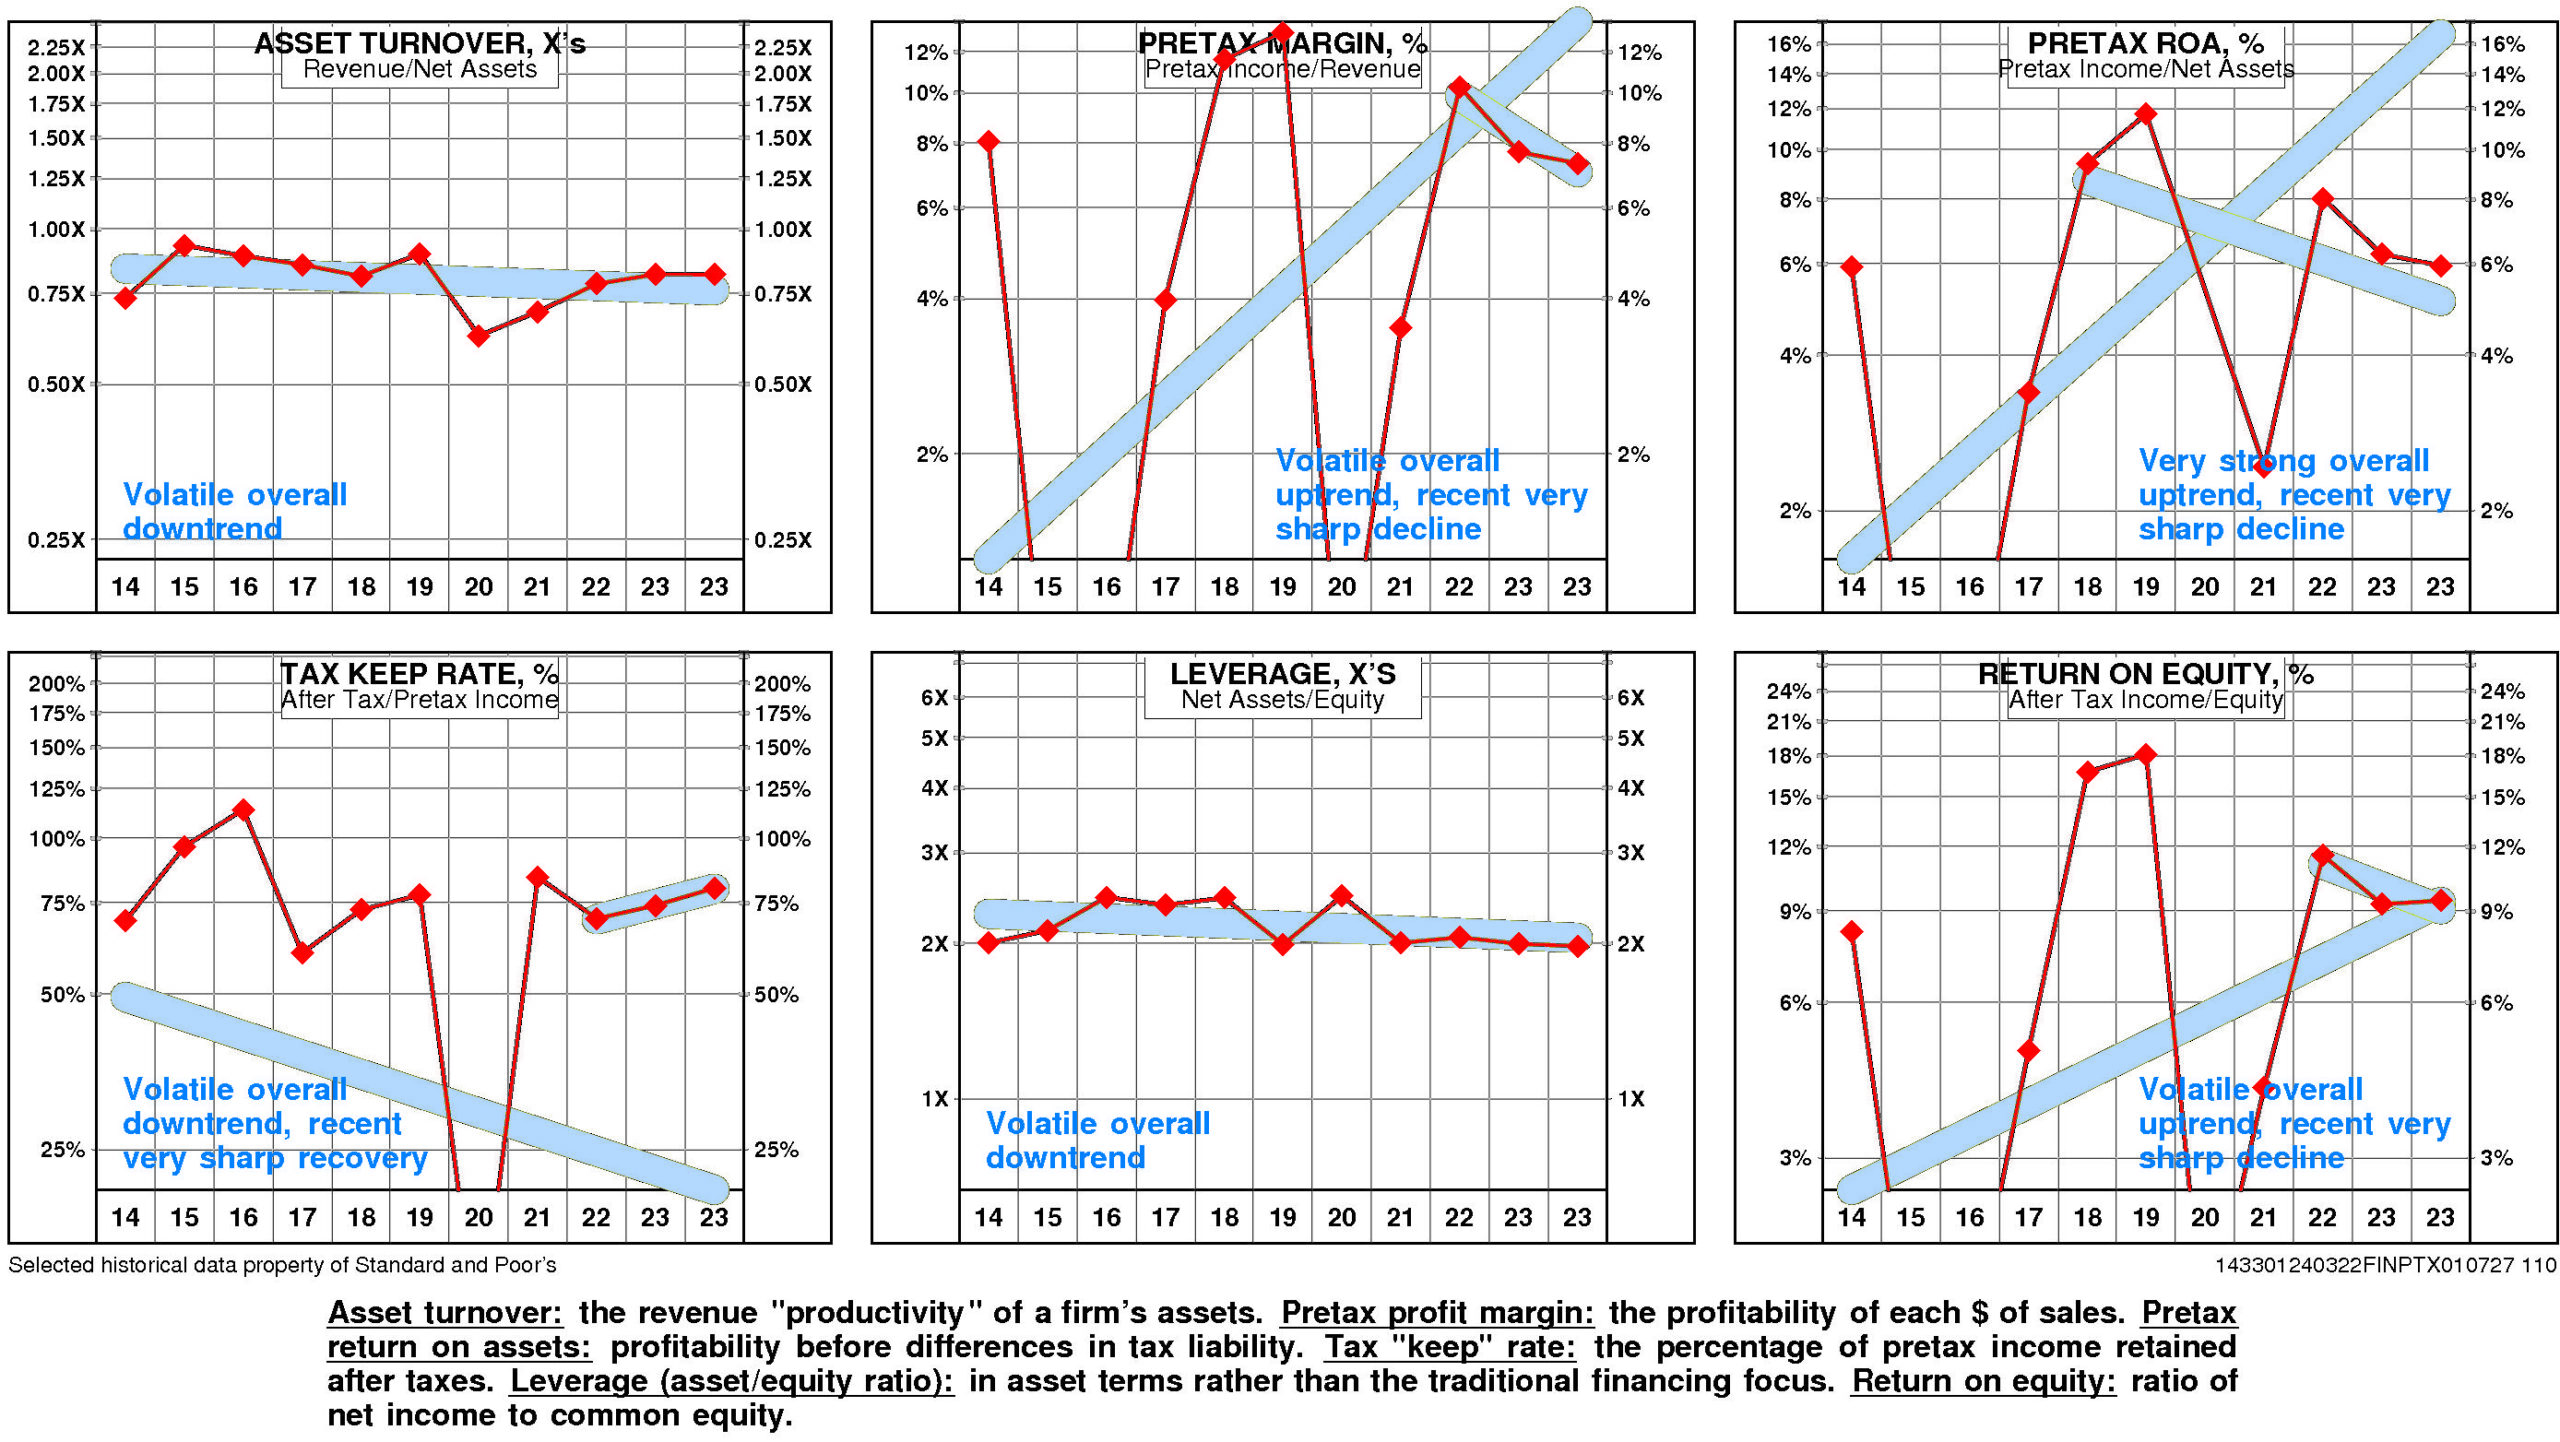
PROFITABILITY
Kennametal's return on equity has improved very significantly since 2014. The current level of 9.4% is 1.15X the low for the period and is -43.7% from the high.
The key to the story for KMT is a very strong positive trend in pretax operating return significantly offset by a very strong negative trend in non-operating factors.
The productivity of Kennametal's assets declined over the full period 2014-2023: asset turnover has experienced a downtrend.
More than offsetting this trend, however, pretax margin enjoyed a volatile overall uptrend but it experienced a very sharp decline after the 2022 high.
Non-operating factors (income taxes and financial leverage) had a significant negative influence on return on equity.
Kennametal's return on equity is at median (9.4%) for the four quarters ended December, 2023.
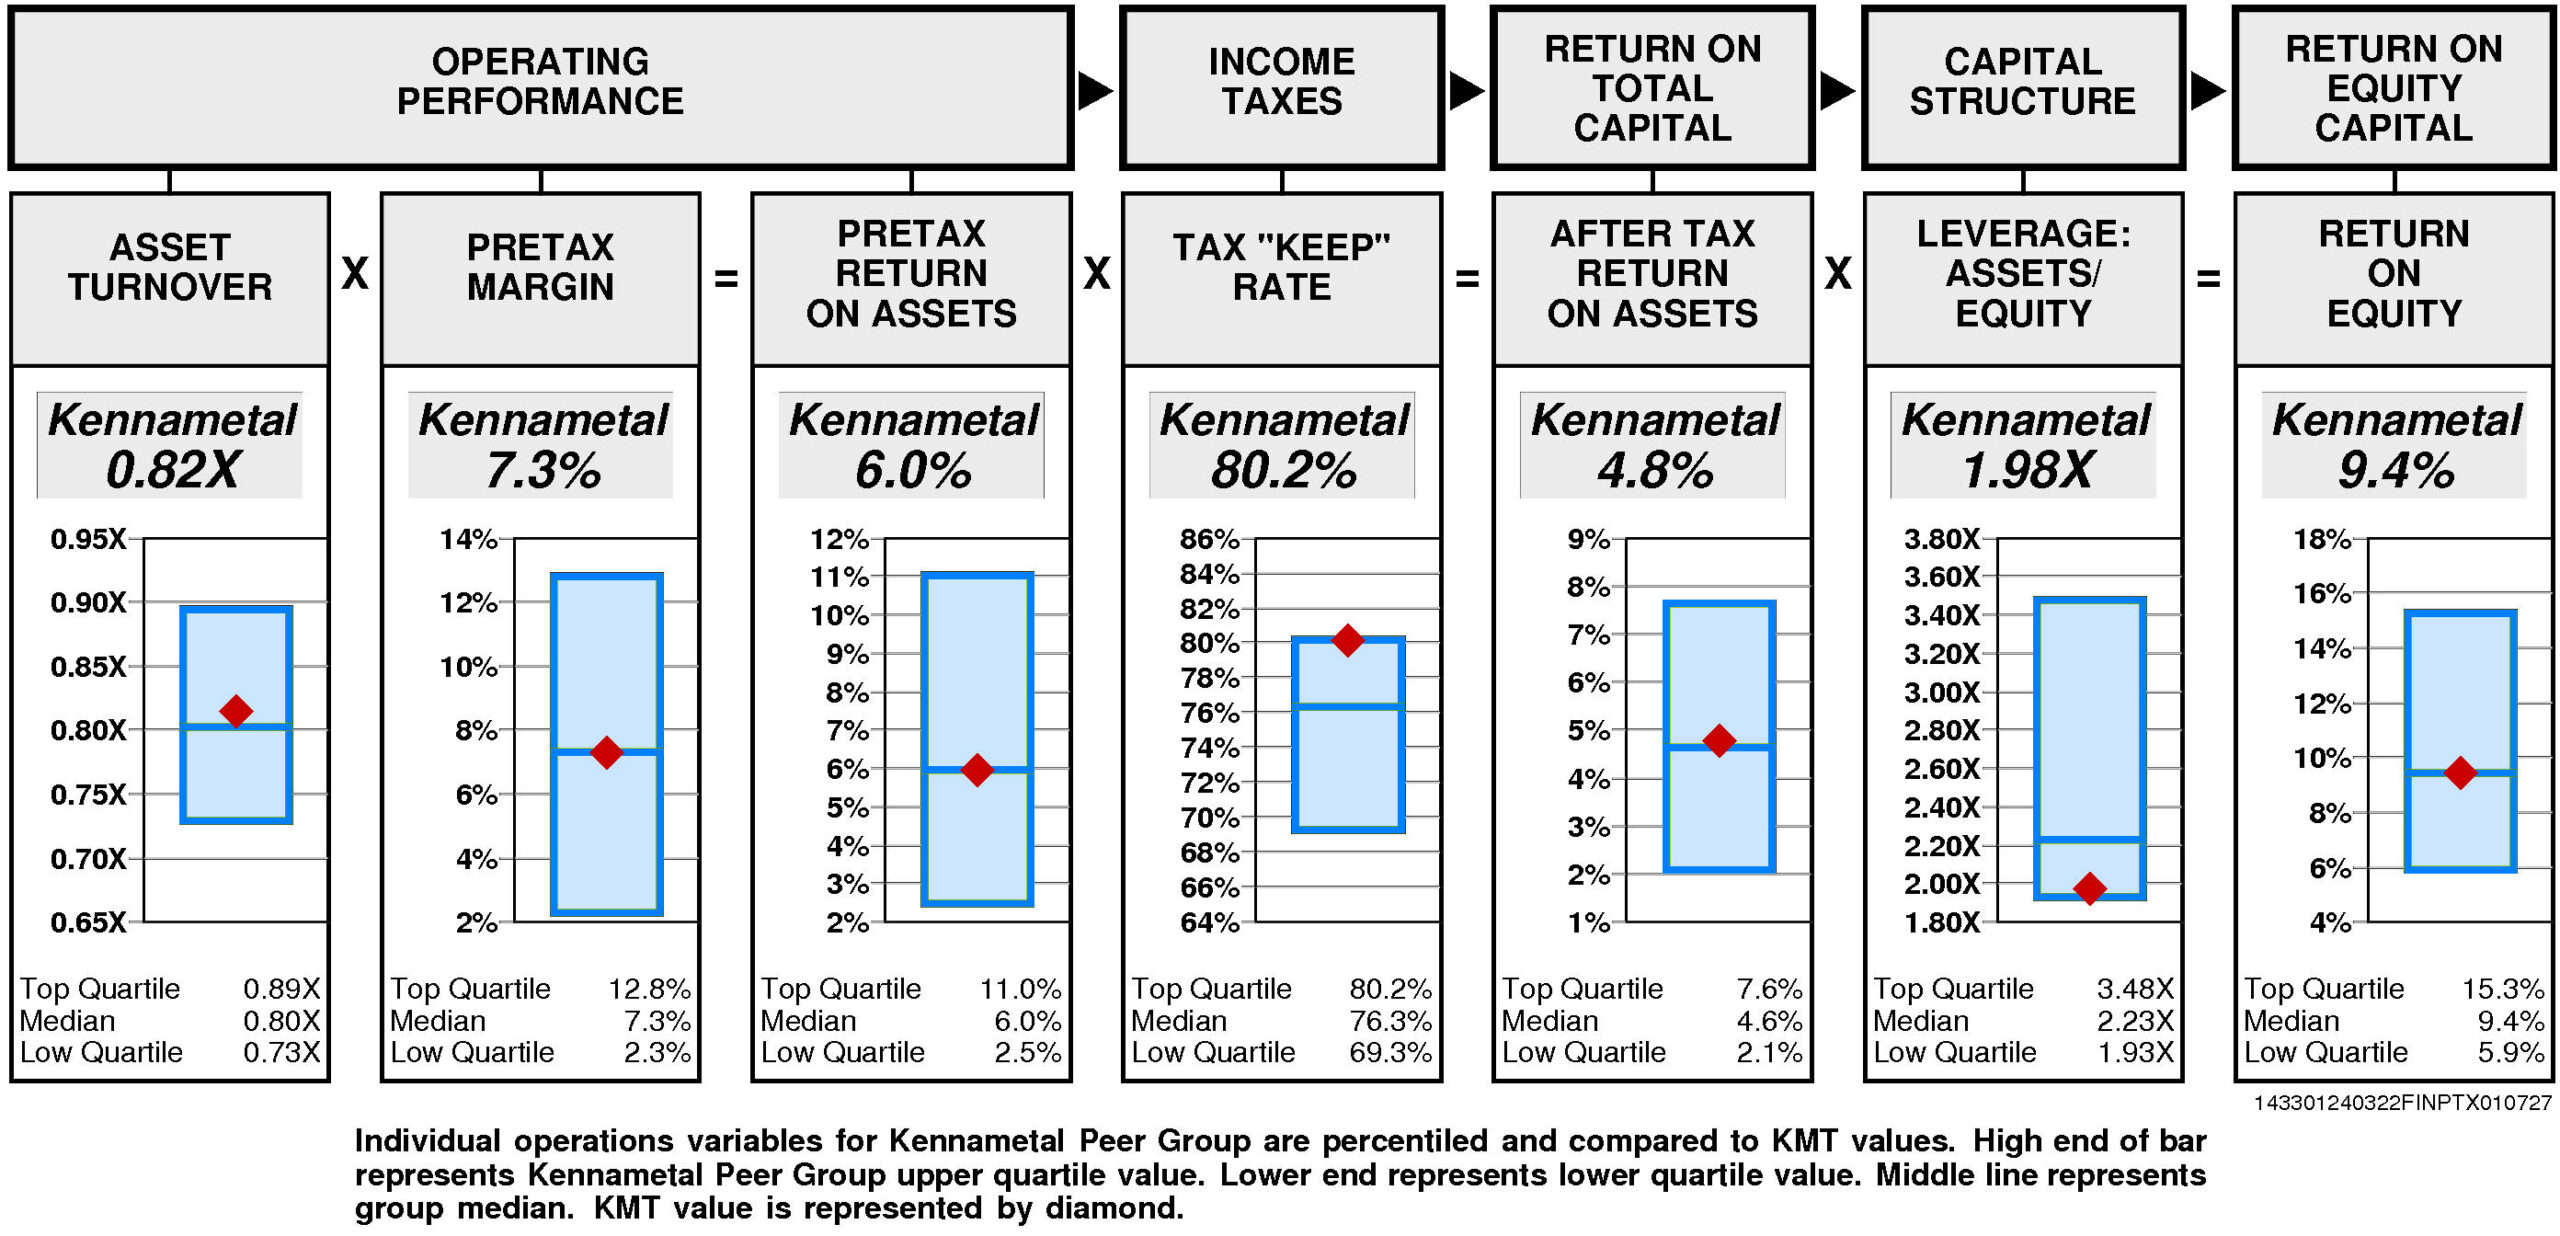
Operating performance (pretax return on assets) is at median (6.0%) reflecting asset turnover that is at median (0.82X) and at median pretax margin (7.3%).
Tax “keep” rate (income tax management) is at the upper quartile (80.2%) resulting in after tax return on assets that is slightly above median.
Financial leverage (leverage) is substantially below median (1.98X).
GROWTH RATES
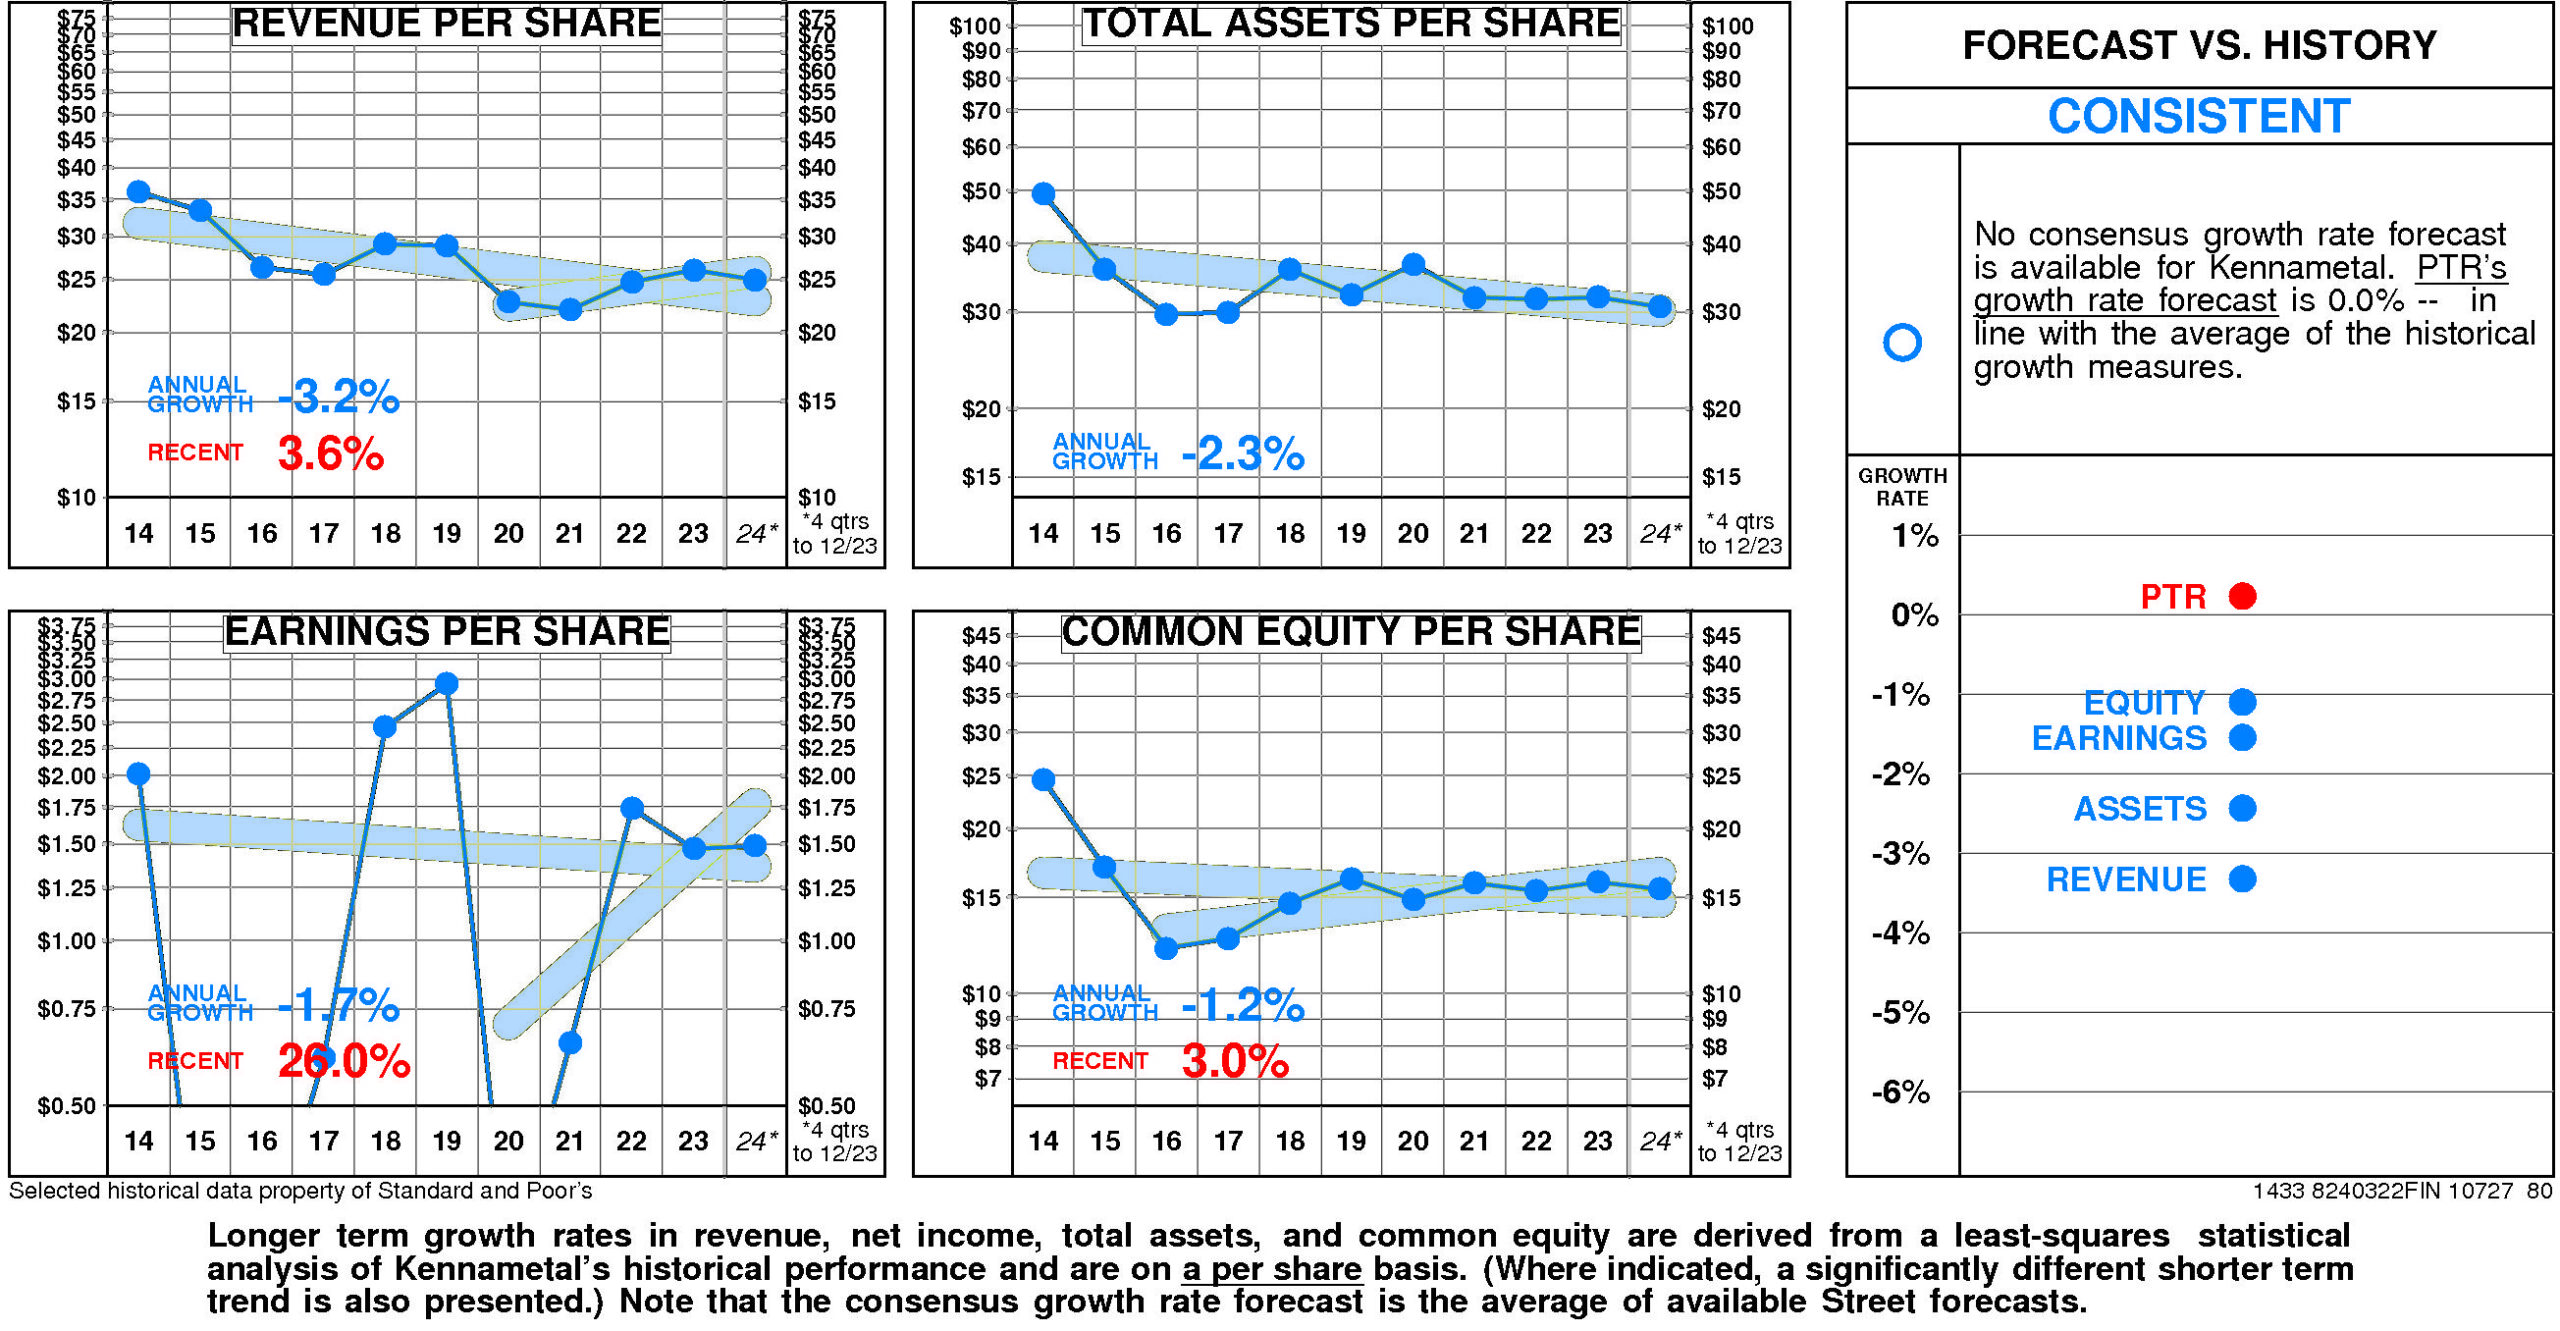
There are no significant differences between Kennametal's longer term growth and growth in recent years.
Kennametal's historical income statement growth has been in line with balance sheet growth. Revenue growth has paralleled asset growth; earnings growth has paralleled equity growth.
Annual revenue growth
has been -3.2% per year. (More recently it has been 3.6%.)
Total asset growth
has been -2.3% per year.
Annual E.P.S. growth
has been -1.7% per year. (More recently it has been 26.0%.)
Equity growth
has been -1.2% per year. (More recently it has been 3.0%.)
No consensus growth rate forecast is available for Kennametal.
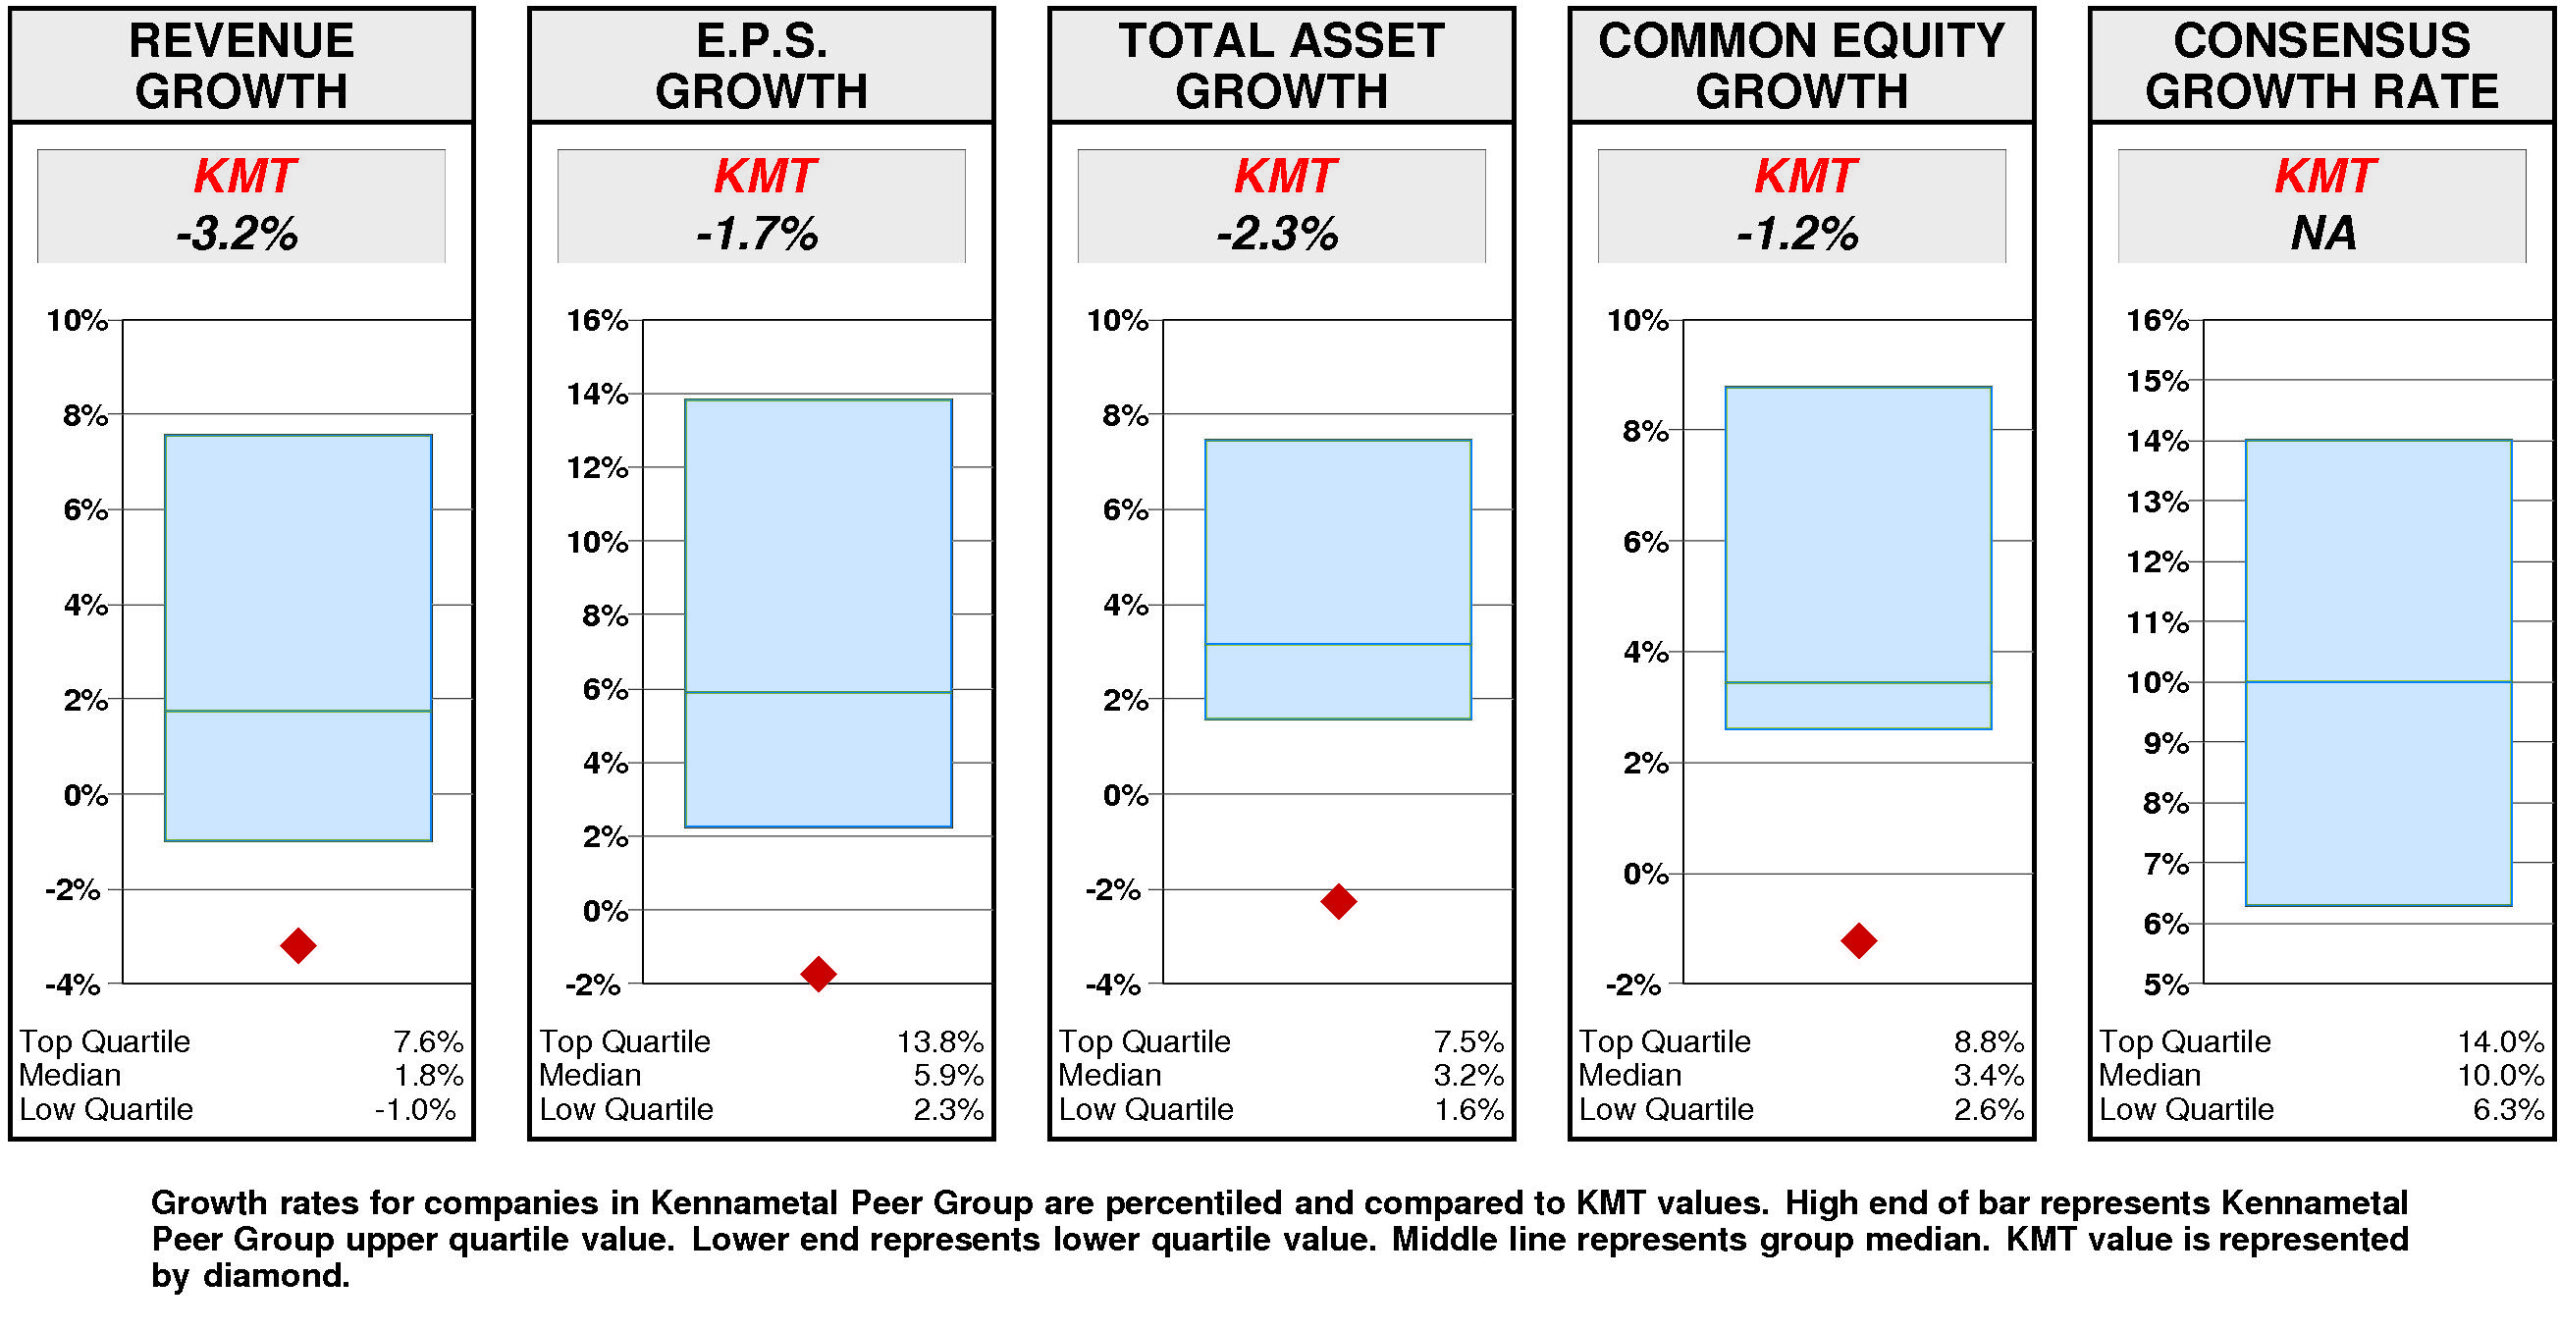
Relative to the Kennametal Peer Group, Kennametal's historical growth measures are consistently lower quartile.
Revenue growth (-3.2%) has been lower quartile. Total asset growth (-2.3%) has been lower quartile. E.P.S. growth (-1.7%) has been lower quartile. Equity growth (-1.2%) has been lower quartile.
Consensus growth forecast is unavailable.
PRICE HISTORY
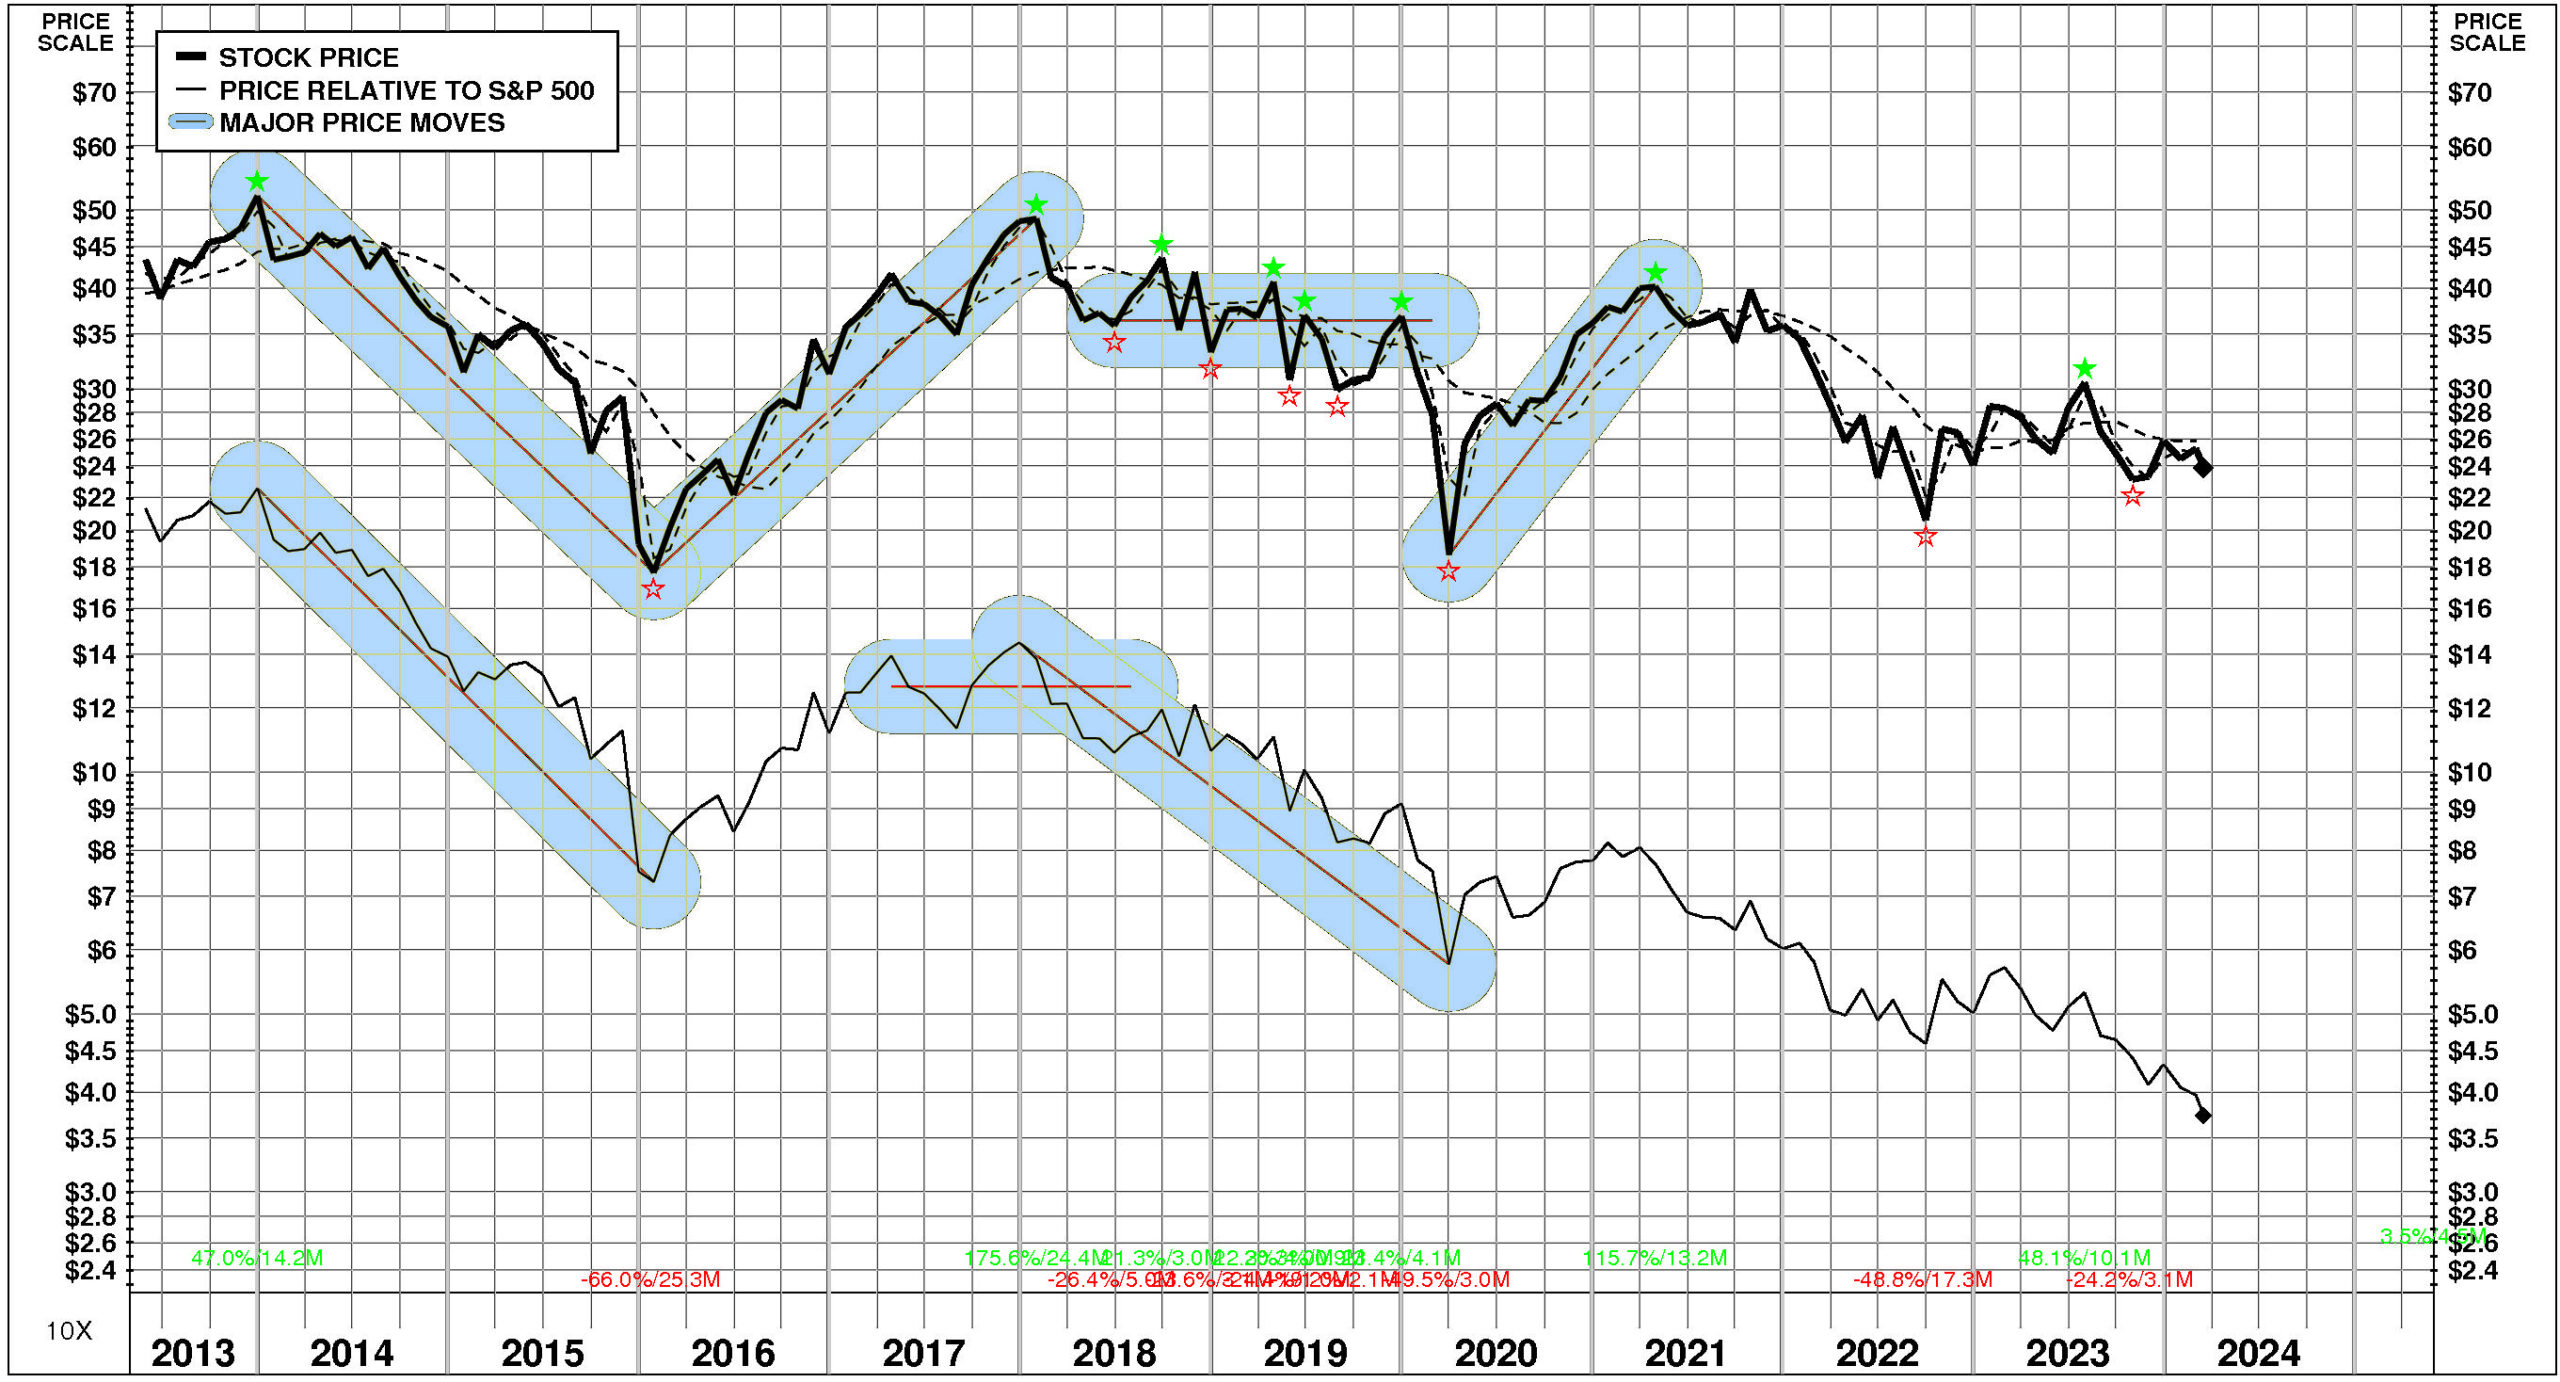
Over the full time period, Kennametal's stock price performance has been variable and significantly below market.
Between May, 2013 and March, 2024, Kennametal's stock price fell -45%; relative to the market, this was a -82% loss. Significant price moves during the period: 1) March, 2020 – April, 2021: +116%; 2) January, 2016 – January, 2018: +176%; and 3) December, 2013 – January, 2016: -66%.
TOTAL INVESTMENT RETURNS
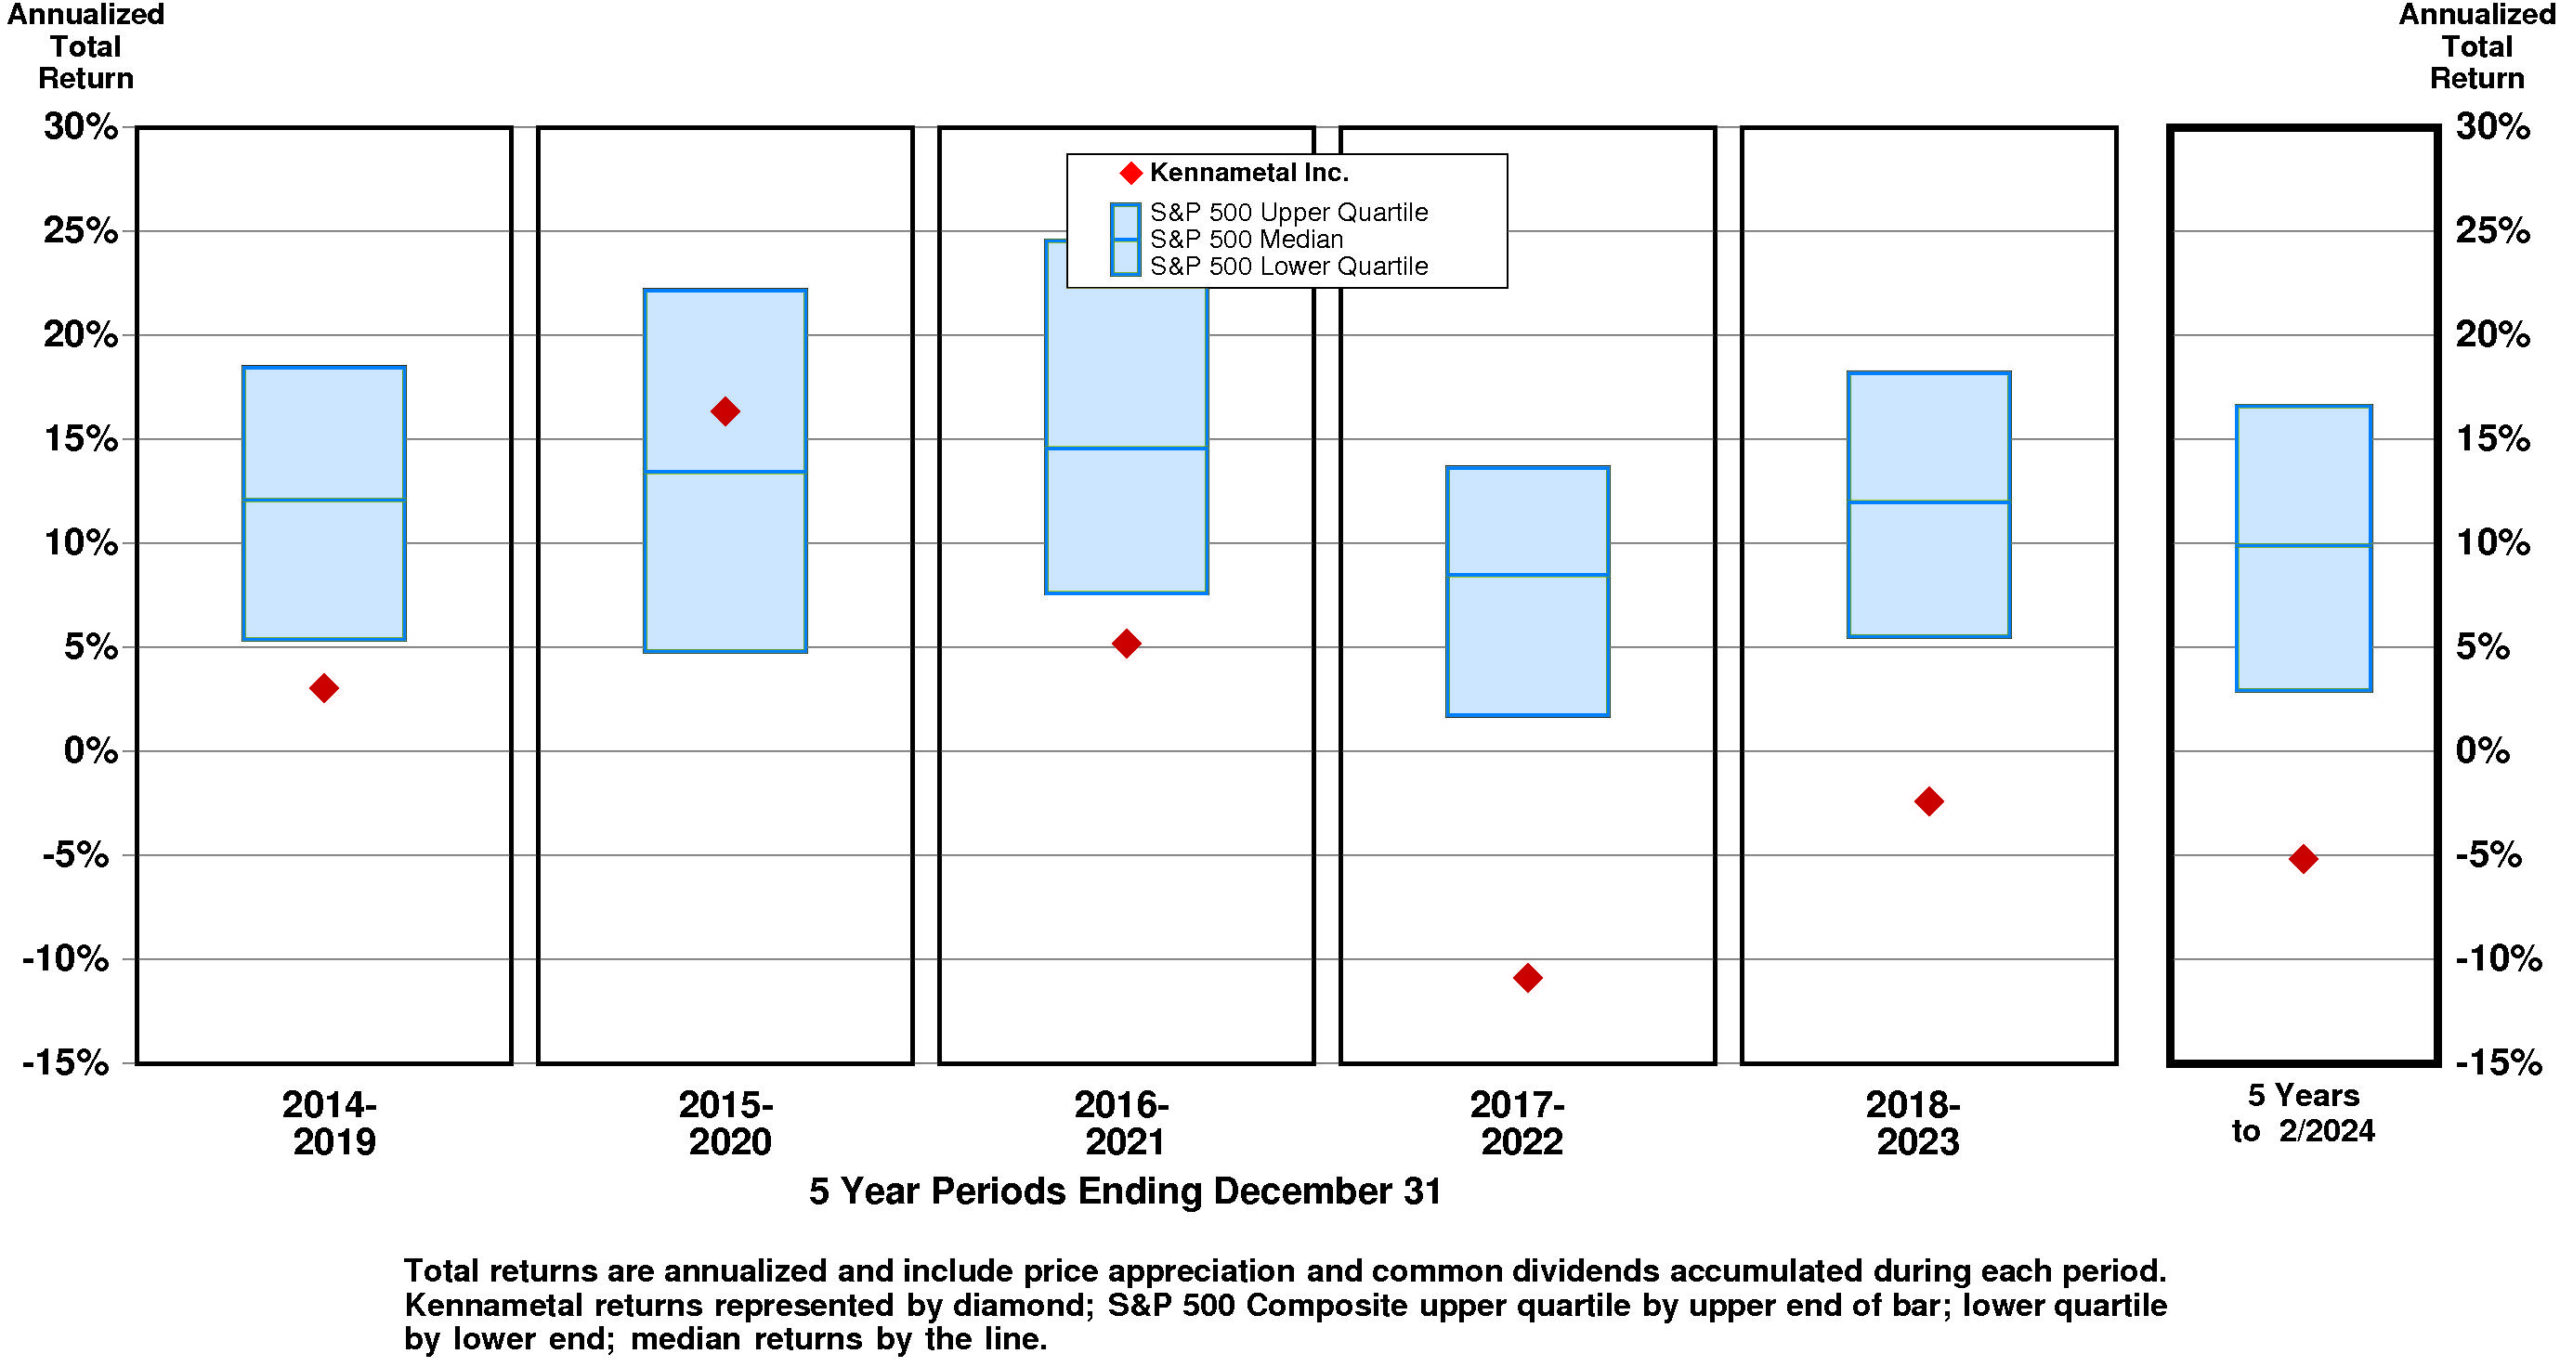
Current annual total return performance of -8.0% is lower quartile relative to the S&P 500 Composite.
In addition to being lower quartile relative to S&P 500 Composite, current annual total return performance through February, 2024 of -8.0% is slightly above median relative to Kennametal Inc. Peer Group.
Current 5-year total return performance of -5.2% is lower quartile relative to the S&P 500 Composite.
Through February, 2024, with lower quartile current 5-year total return of -5.2% relative to S&P 500 Composite, Kennametal's total return performance is substantially below median relative to Kennametal Inc. Peer Group.
VALUATION BENCHMARKS
Relative to S&P 500 Composite, KMT's overall valuation is quite low.
The highest factor, the ratio of enterprise value/earnings before interest and taxes, is lower quartile. Price/earnings ratio is near the lower quartile. Ratio of enterprise value/assets is near the lower quartile. Price/equity ratio is lower quartile. The lowest factor, the ratio of enterprise value/revenue, is lower quartile.
Relative to Kennametal Peer Group, KMT's overall valuation is low.
The highest factor, the ratio of enterprise value/assets, is below median. Price/earnings ratio is at the lower quartile. Price/equity ratio is near the lower quartile. Ratio of enterprise value/revenue is below median. The lowest factor, the ratio of enterprise value/earnings before interest and taxes, is near the lower quartile.
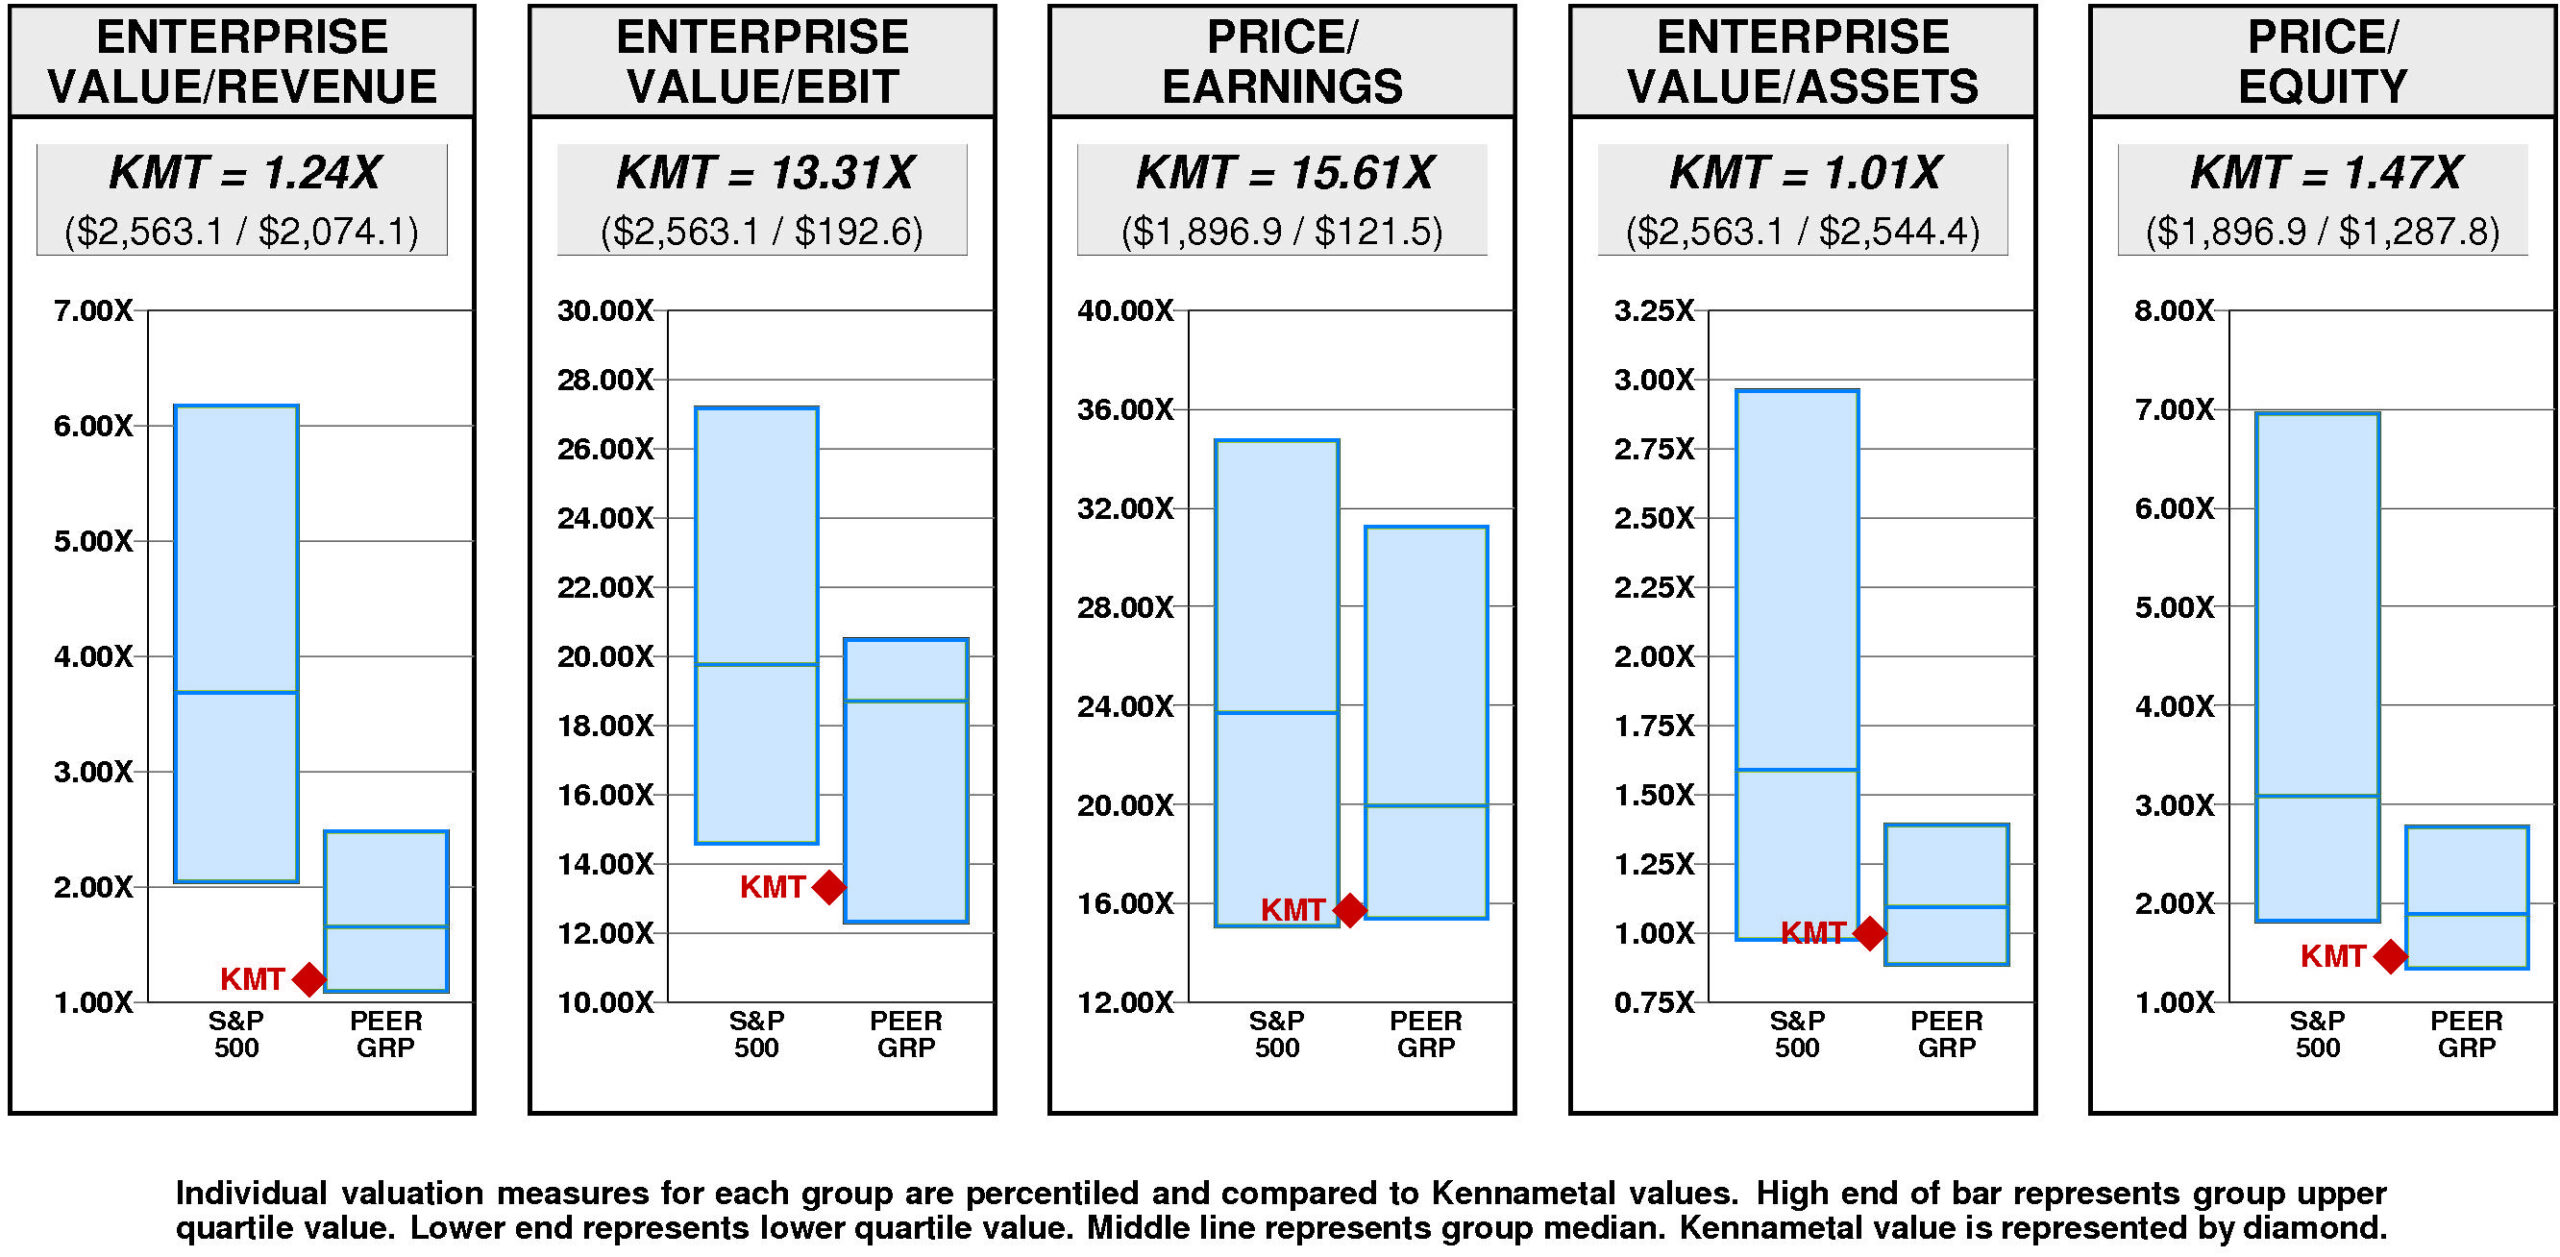
Kennametal has a major value gap compared to the median valuation.
For KMT to rise to median valuation, its current ratio of enterprise value/revenue would have to rise from the current level of 1.24X to 1.65X. If KMT's ratio of enterprise value/revenue were to rise to 1.65X, its stock price would be lower by $11 to $35.
For KMT to hit lower quartile valuation relative to the Kennametal Peer Group, its current ratio of enterprise value/revenue would have to fall from the current level of 1.24X to 1.10X. If KMT's ratio of enterprise value/revenue were to fall to 1.10X, its stock price would decline by $-4 from the current level of $24.
VALUE TARGETS
KMT's future returns on capital are forecasted to exceed the cost of capital. Accordingly, the company is expected to continue to be a Value Builder.
Kennametal's current Price Target of $27 represents a +14% change from the current price of $23.93.
This neutral appreciation potential results in an appreciation score of 41 (59% of the universe has greater appreciation potential.)
With this neutral Appreciation Score of 41, the low Power Rating of 28 results in an Value Trend Rating of D.
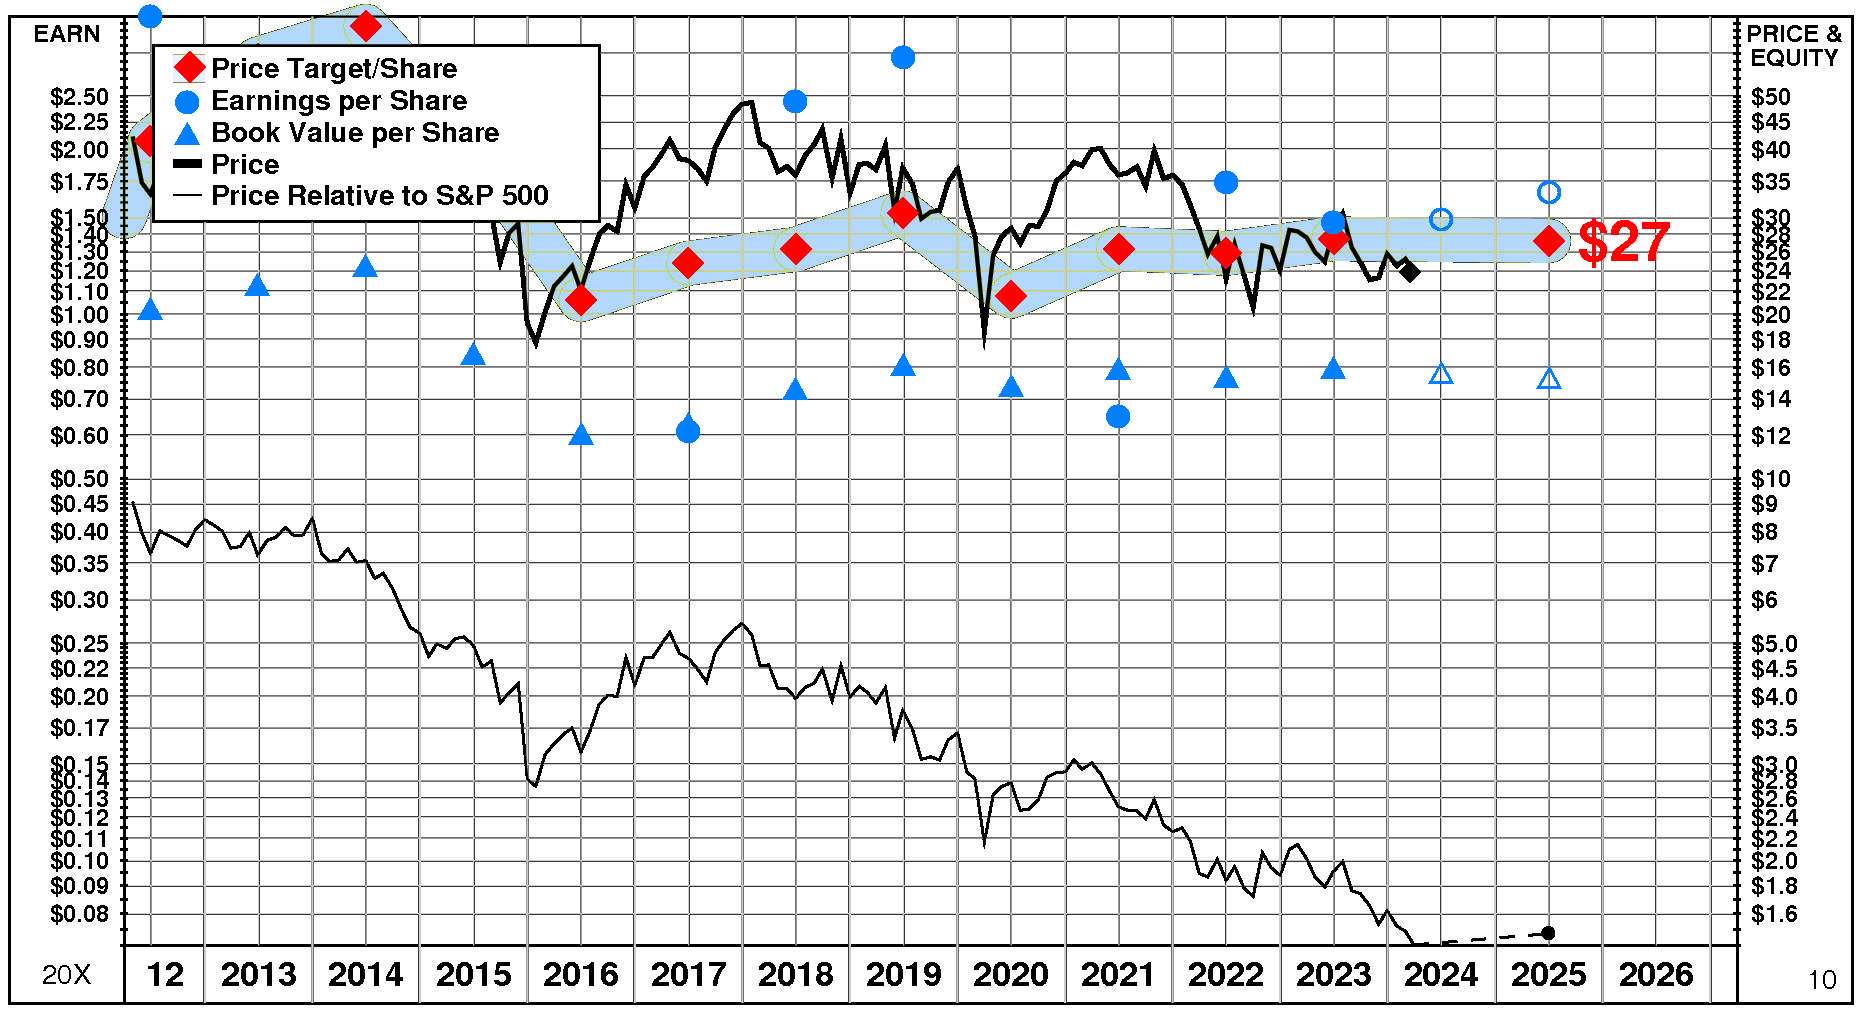
Kennametal's current Price Target is $27 (-1% from the 2023 Target of $27 but +14% from the 03/15/24 price of $23.93).
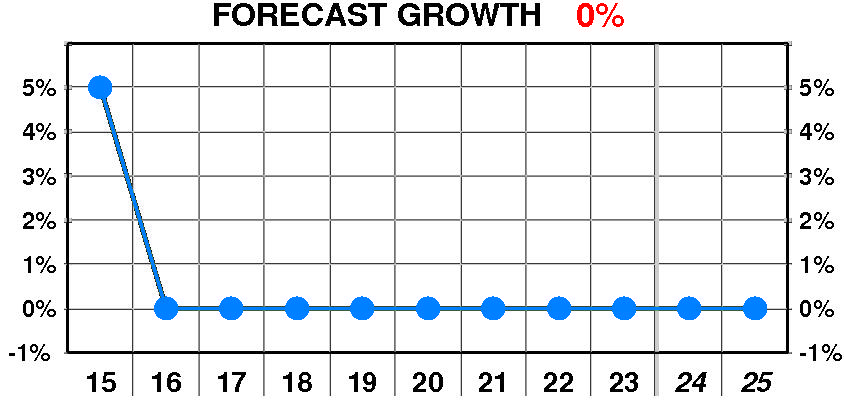
This plateau in the Target is the result of a -3% decrease in the equity base and a +2% increase in the price/equity multiple. One Driver has a positive impact on the price/equity multiple, one has a negative impact, and one has no effect. The forecasted increase in return on equity has a very large positive impact on the price/equity multiple. The forecasted growth has no impact. The forecasted increase in cost of equity has a very large negative impact.
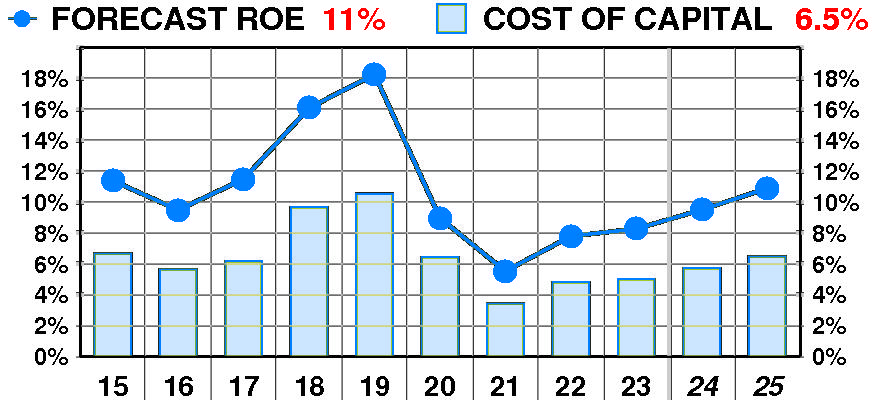
PTR's return on equity forecast is 10.9% — slightly above our recent forecasts.
Forecasted return on equity suffered a dramatic, erratic decline between 2015 and 2023. The current forecast is well below the 2019 peak of 18%.
PTR's growth forecast is 0.0% — in line with our recent forecasts.
Forecasted growth erratic between 2015 and 2023. The current forecast is well below the 2015 peak of 5%.
PTR's cost of equity forecast is 6.5% — in line with recent levels.
Forecasted cost of equity enjoyed a dramatic, erratic decline between 2015 and 2023. The current forecast is below the 2019 peak of 10.5%.
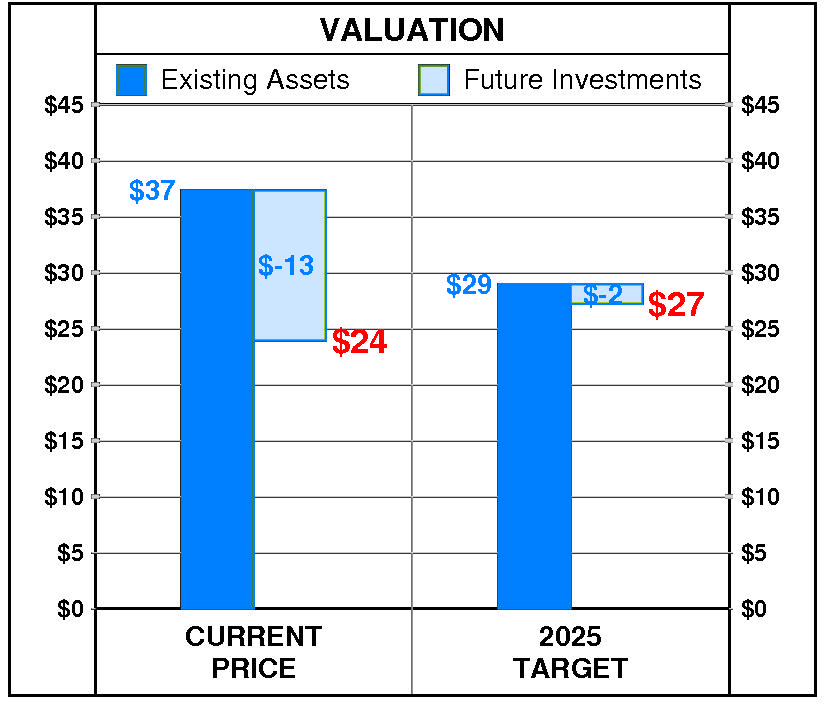
At Kennametal's current price of $23.93, investors are placing a negative value of $-13 on its future investments. This view is not supported by the company's most recent performance that reflected a growth rate of 0.0% per year, and a return on equity of 8.3% versus a cost of equity of 5.0%.
PTR's 2025 Price Target of $27 is based on these forecasts and reflects an estimated value of existing assets of $29 and a value of future investments of $-2.