BUSINESS
Fresh Del Monte Produce Inc., through its subsidiaries, produces, markets, and distributes fresh and fresh-cut fruits and vegetables in North America, Europe, the Middle East, Africa, Asia, and internationally. It operates through three segments: Fresh and Value-Added Products, Banana, and Other Products and Services. It offers pineapples, fresh-cut fruit, fresh-cut vegetables, melons, and vegetables; non-tropical fruits, such as grapes, apples, citrus, blueberries, strawberries, pears, peaches, plums, nectarines, cherries, and kiwis; other fruit and vegetables, and avocados; and prepared fruit and vegetables, juices, other beverages, and meals and snacks. The company also engages in the sale of poultry and meat products; and third-party freight services business. In addition, it manufactures and sells plastic and box products, such as bins, trays, bags, and boxes.
INVESTMENT RATING
Reflecting future returns on capital that are forecasted to be above the cost of capital, FDP is expected to continue to be a modest Value Builder.
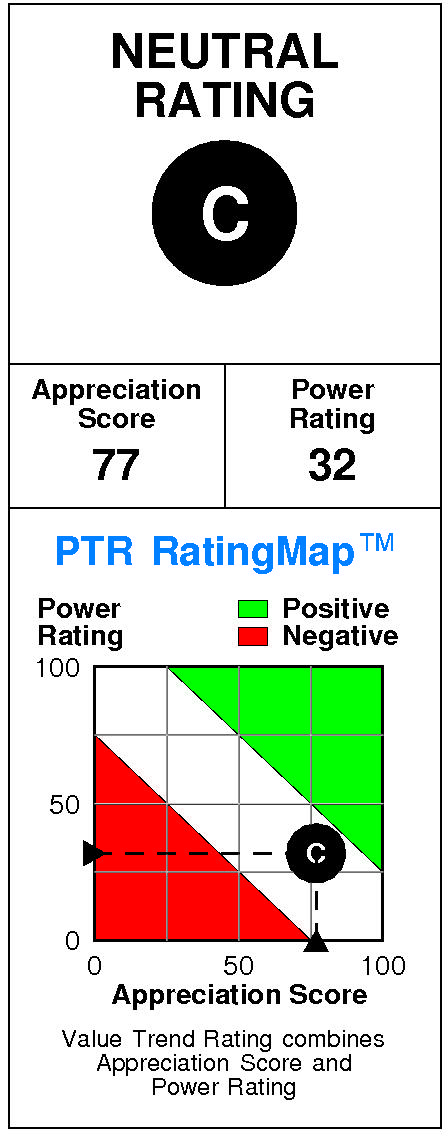
Fresh Del Monte Produce has a current Value Trend Rating of C (Neutral).
With this rating, PTR's two proprietary measures of a stock's current attractiveness are providing contradictory signals. Fresh Del Monte Produce has a good Appreciation Score of 77 but a slightly negative Power Rating of 32, triggering the Neutral Value Trend Rating.
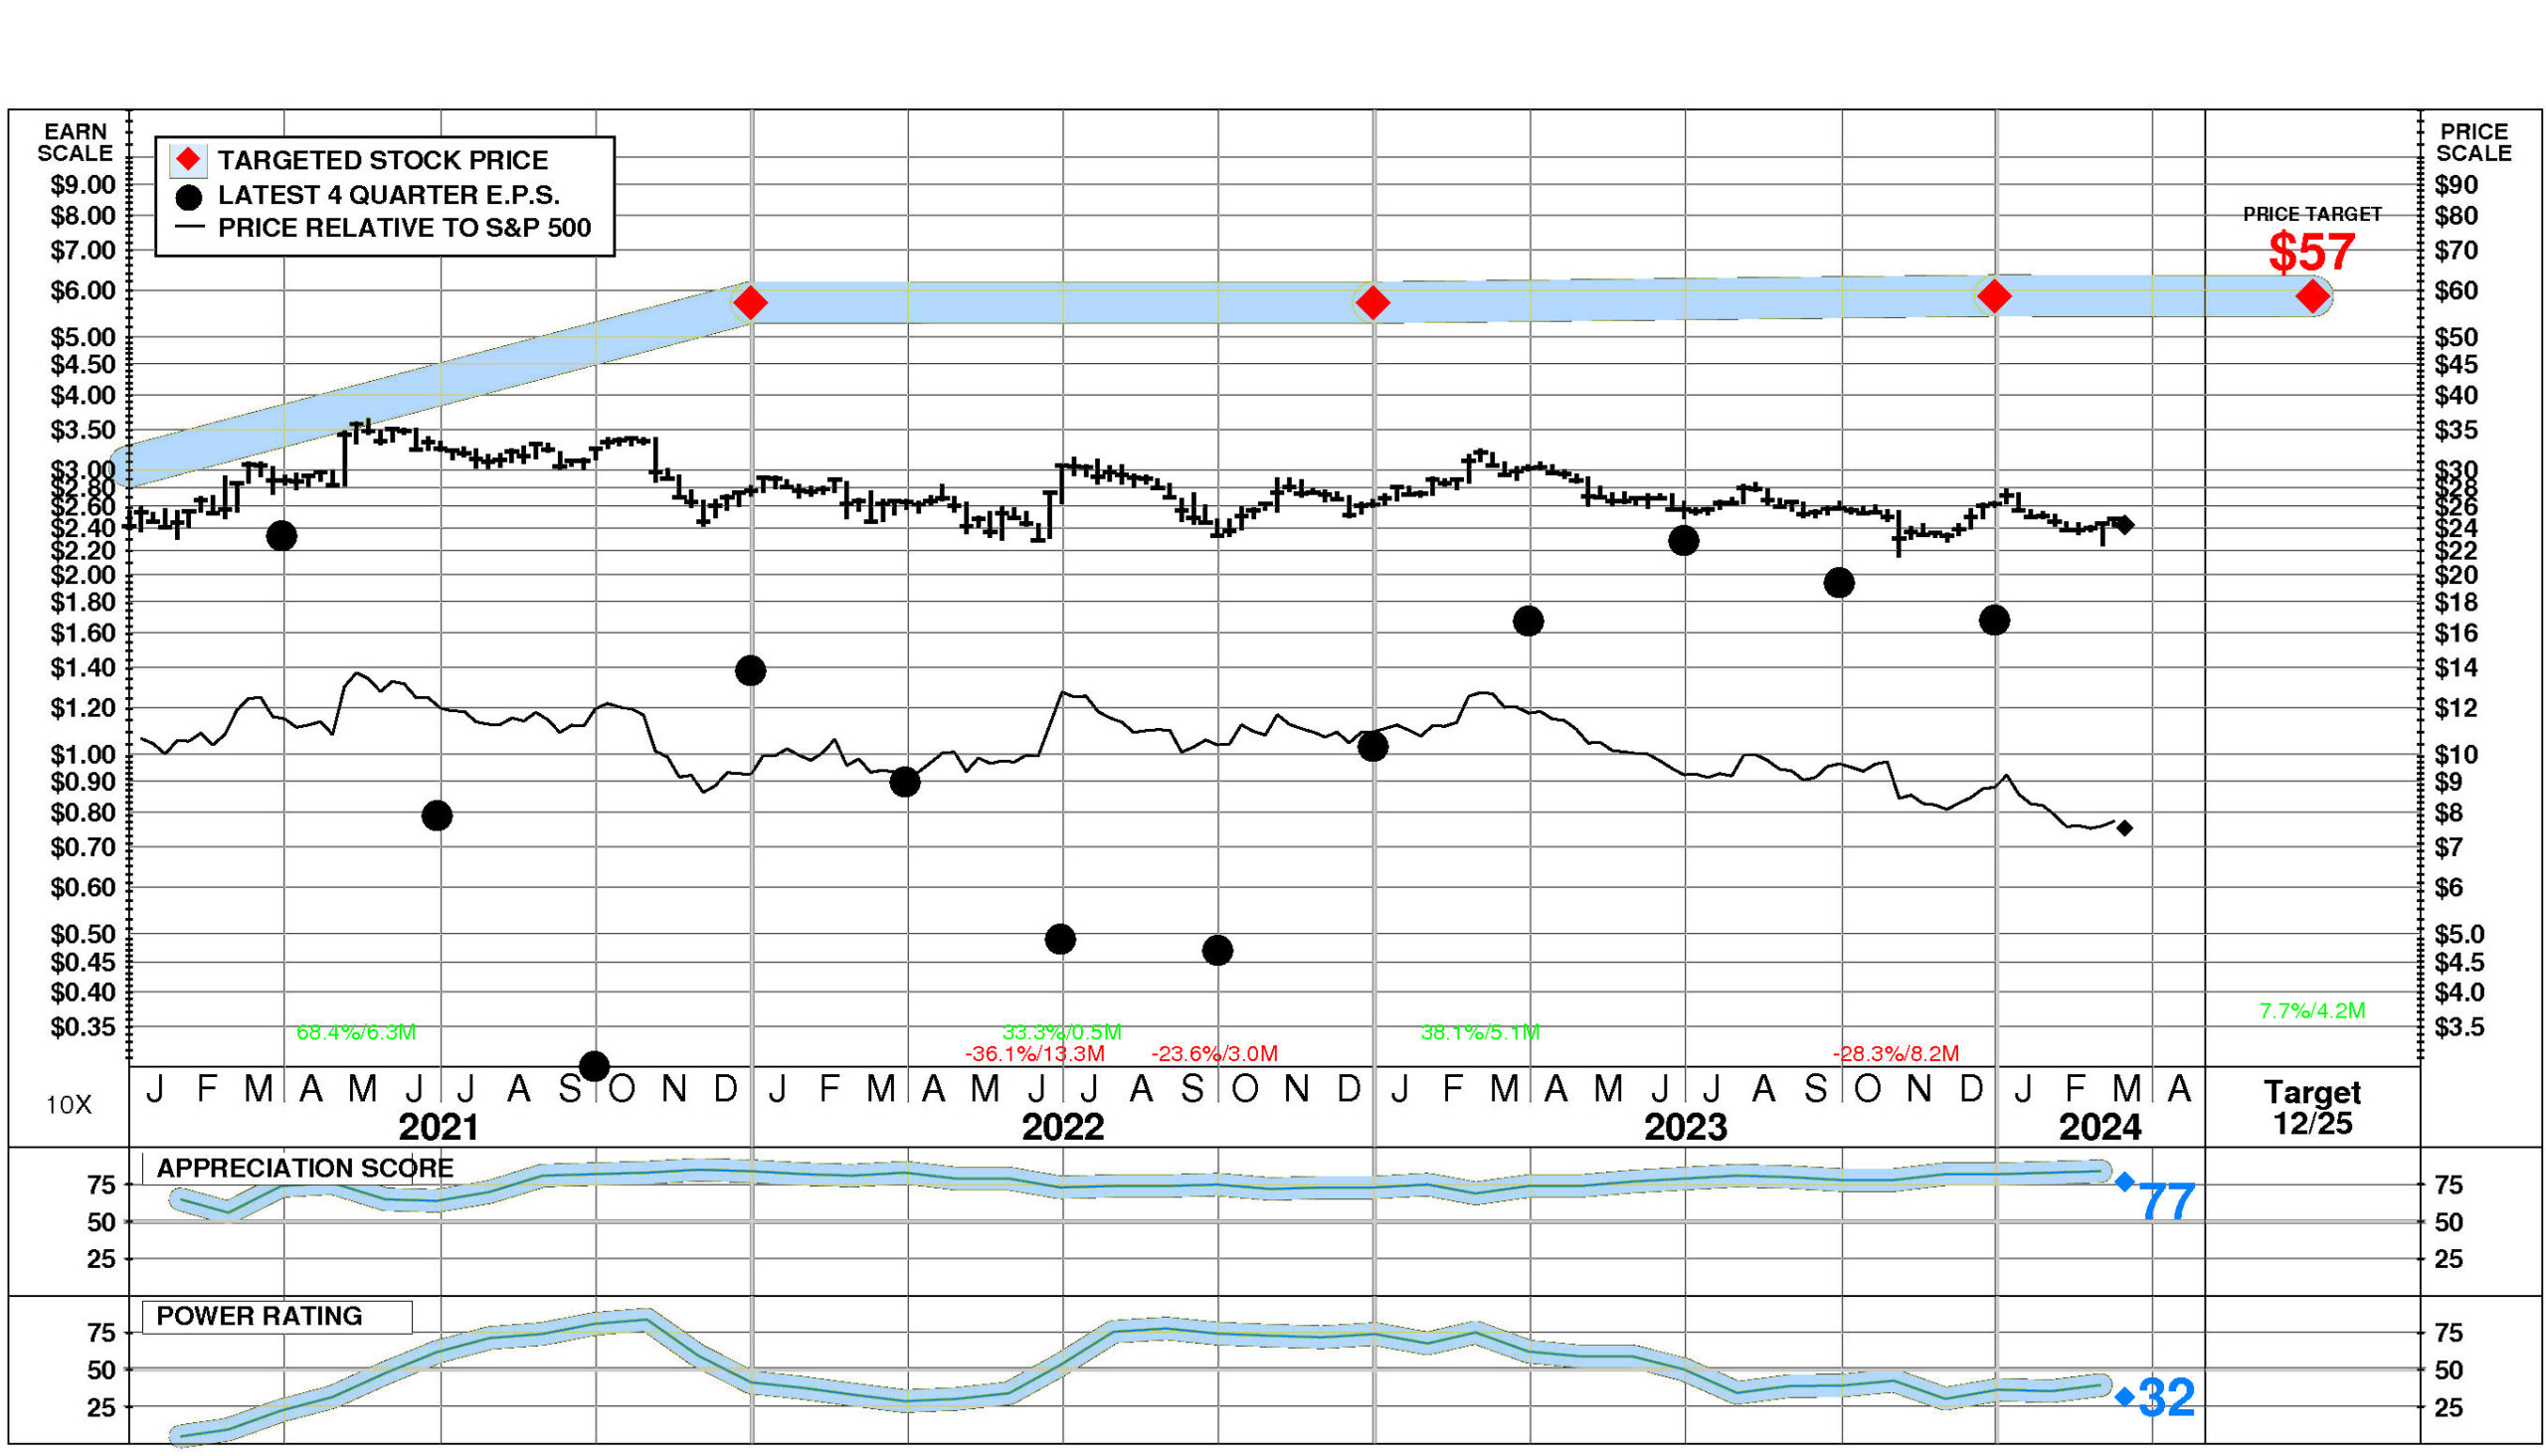
Fresh Del Monte Produce's stock is selling well below targeted value.
The current stock price of $24.26 compares to targeted value 12 months forward of $59.
Fresh Del Monte Produce's high appreciation potential results in an appreciation score of 77 (only 23% of the universe has greater appreciation potential.)
Fresh Del Monte Produce has a Power Rating of 32.
(This slightly negative Power Rating indicates that FDP only has a better chance of achieving attractive investment performance over the near to intermediate term than 32% of companies in the universe.)
Factors contributing to this slightly negative Power Rating include: the trend in FDP's earnings estimates has been unfavorable in recent months; recent price action has been slightly unfavorable; and the Agriculture Production – Crops comparison group is in a slightly weakened position currently.
INVESTMENT PROFILE
FDP's financial strength is poor. Financial strength rating is 7.
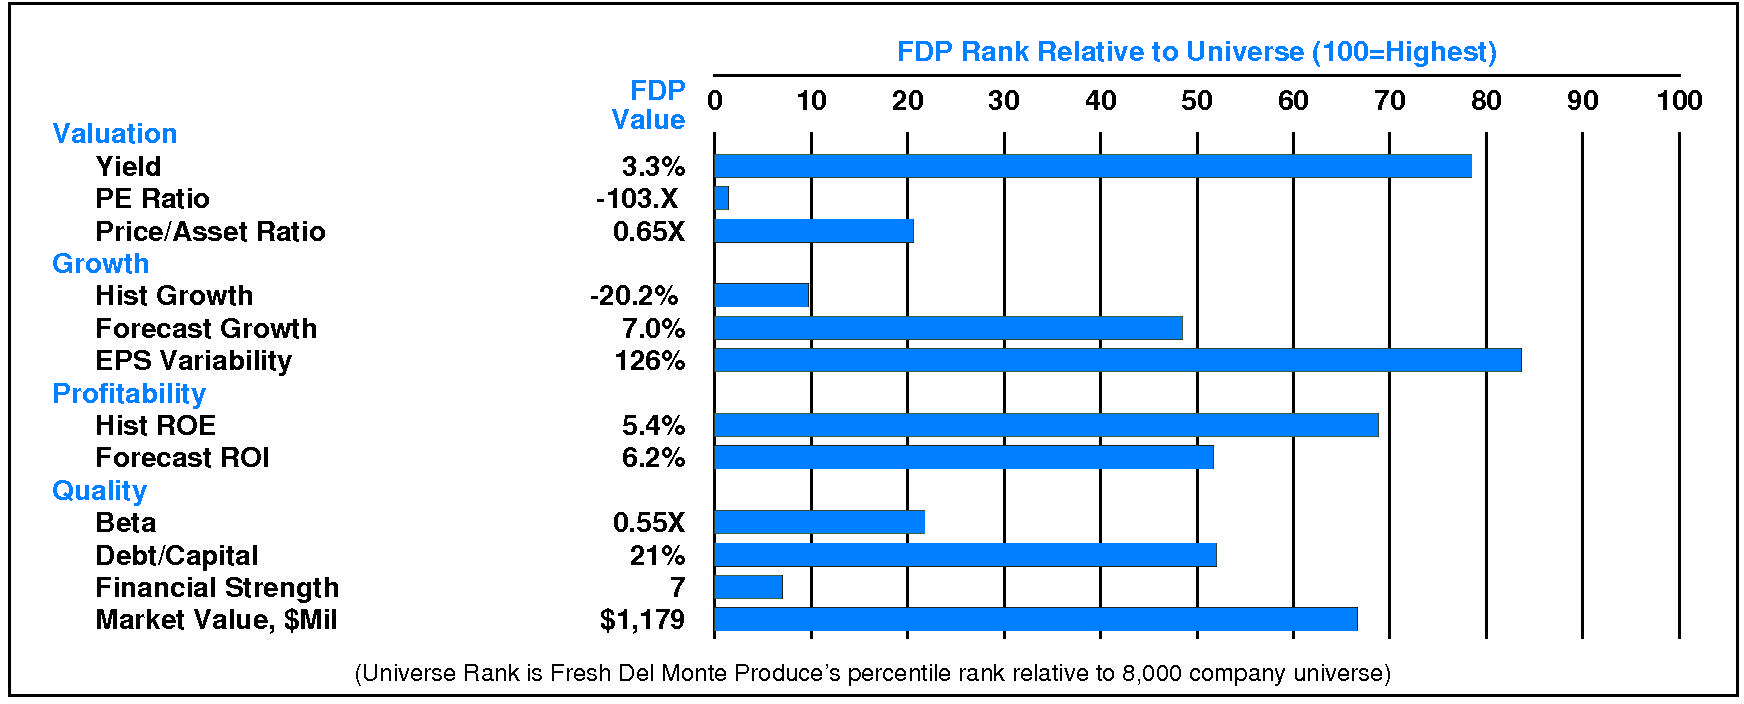
Relative to the S&P 500 Composite, Fresh Del Monte Produce Inc. has significant Value characteristics; its appeal is likely to be to investors heavily oriented toward Income; the perception is that FDP is normal risk.
Relative weaknesses include: low forecasted profitability, low historical profitability, low financial strength, low historical growth, and high earnings variability. FDP's valuation is low: high dividend yield, low P/E ratio, and low price/book ratio. FDP has unusually low market capitalization.
CURRENT SIGNALS
Fresh Del Monte Produce's current operations are strong.
Return on equity is rising, reflecting: and improving asset utilization.
Fresh Del Monte Produce's current technical position is very weak.
The stock price is in a 8.2 month down move. The stock has declined 22.1% from its prior high. The stock price is below its 200 day moving average which is in a downtrend.
ALERTS
Recent minimal negative changes in fundamentals have affected Fresh Del Monte Produce Inc. (NYSE: FDP): significant quarterly earnings deceleration occurred.
The stock is currently rated C.
Fresh Del Monte Produce Inc. (NYSE: FDP) stock closed at $24.26 on 3/14/24 after a modest decline of -1.8%. NORMAL trading volume accompanied the decline. The stock is unchanged during the last week but has been weak relative to the market over the last nine months.
CASH FLOW
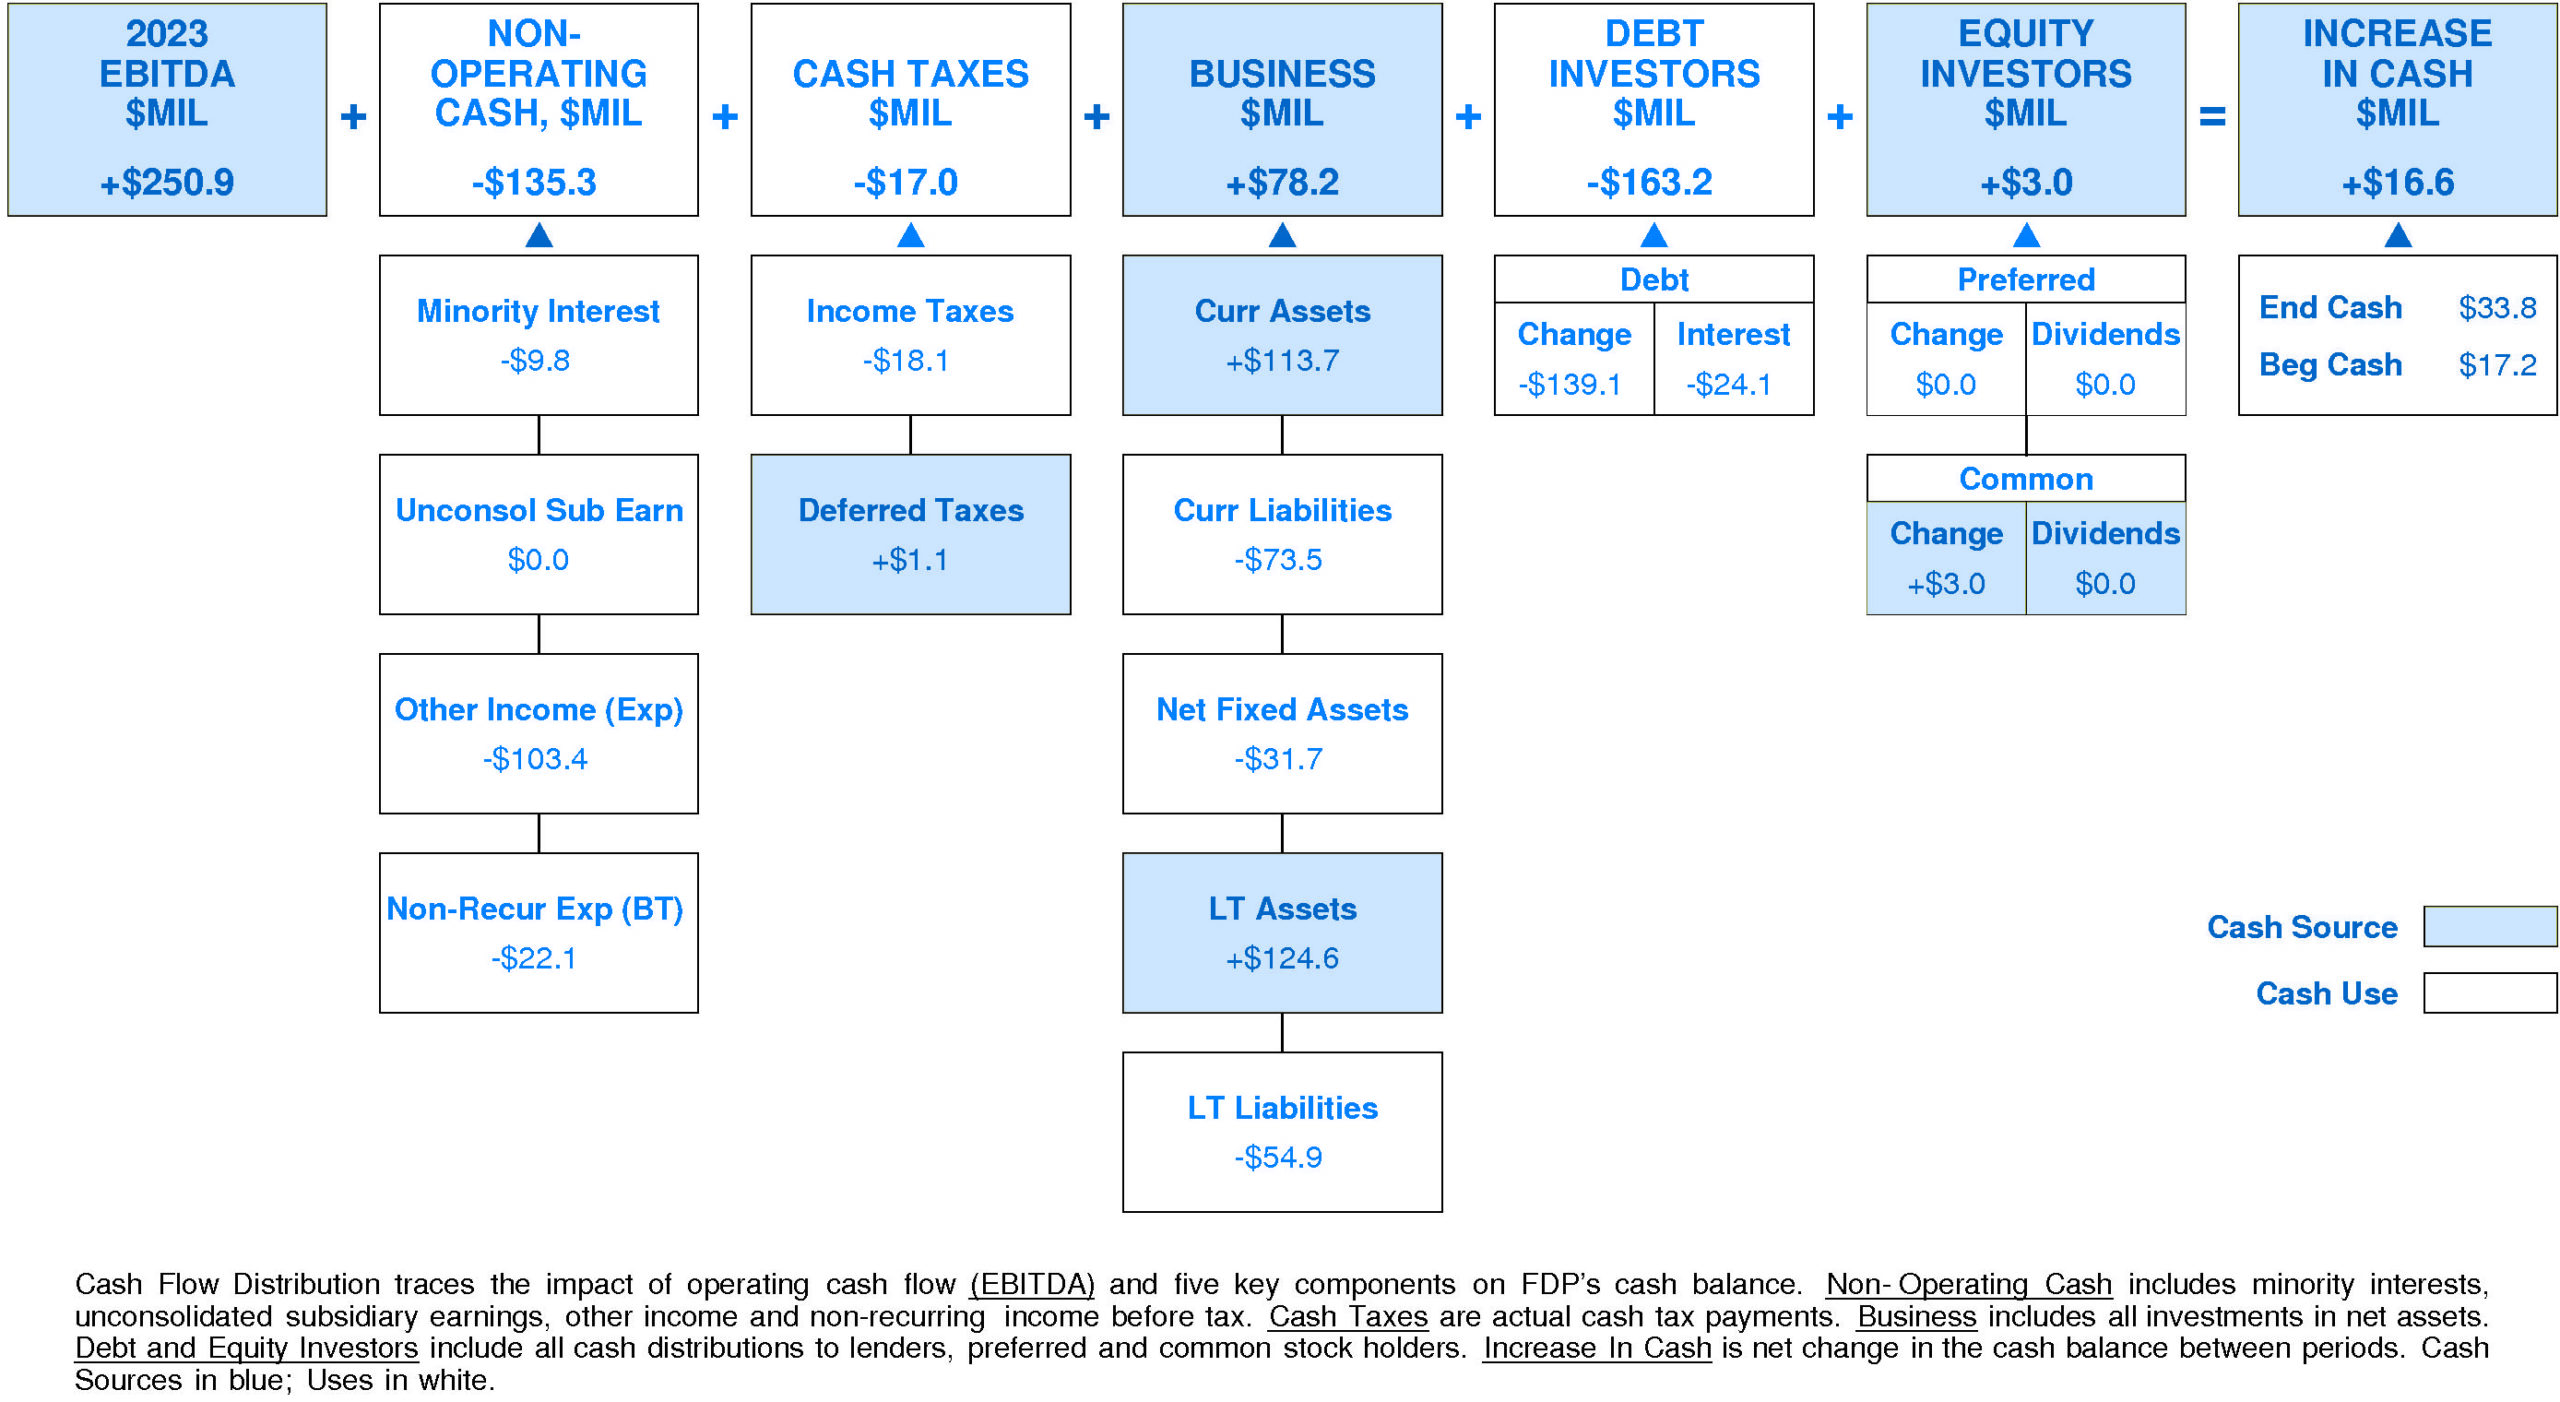
In 2023, Fresh Del Monte Produce generated a very significant increase in cash of +$16.6 million (+97%). Sources of cash were much larger than uses.
Cash generated from 2023 EBITDA totaled +$250.9 million. Non-operating uses consumed -$135.3 million (-54% of EBITDA). Cash taxes consumed -$17.0 million (-7% of EBITDA). Withdrawal of investment from the business totaled +$78.2 million (+31% of EBITDA). On a net basis, debt investors removed -$163.2 million (-65% of EBITDA) while equity investors provided +$3.0 million (+1% of EBITDA).
FDP's Non-operating Income, %EBITDA has experienced a downtrend over the period.
This downtrend was accompanied by stability for the Fresh Del Monte Produce Peer Group. (Since 2021 Non-operating Income, %EBITDA has accelerated very sharply.) In most years, Fresh Del Monte Produce was in the third quartile and second quartile. Currently, Fresh Del Monte Produce is substantially below median at -54% of EBITDA (-$135.3 million).
FDP's Cash Taxes, %EBITDA has experienced a downtrend over the period.
This downtrend was accompanied by stability for the Fresh Del Monte Produce Peer Group. (Since 2021 Cash Taxes, %EBITDA has experienced a very sharp recovery.) In most years, Fresh Del Monte Produce was in the top quartile and second quartile. Currently, Fresh Del Monte Produce is above median at -7% of EBITDA (-$17.0 million).
FDP's Business Re-investment, %EBITDA has exhibited a volatile overall uptrend over the period.
This improvement was accompanied by stability for the Fresh Del Monte Produce Peer Group. In most years, Fresh Del Monte Produce was in the third quartile and second quartile. Currently, Fresh Del Monte Produce is at median at +31% of EBITDA (+$78.2 million).
FDP's Debt Investors, %EBITDA has experienced a volatile overall downtrend over the period.
This downtrend was accompanied by stability for the Fresh Del Monte Produce Peer Group. In most years, Fresh Del Monte Produce was in the second quartile and top quartile. Currently, Fresh Del Monte Produce is below median at -65% of EBITDA (-$163.2 million).
FDP's Equity Investors, %EBITDA has enjoyed a very strong overall uptrend over the period.
This improvement was accompanied by a similar trend for the Fresh Del Monte Produce Peer Group. In most years, Fresh Del Monte Produce was in the second quartile and lower quartile. Currently, Fresh Del Monte Produce is at median at +1% of EBITDA (+$3.0 million).
FDP's Change in Cash, %EBITDA has exhibited a volatile overall uptrend over the period.
This improvement was accompanied by stability for the Fresh Del Monte Produce Peer Group. (Since 2020 Change in Cash, %EBITDA has accelerated.) In most years, Fresh Del Monte Produce was in the third quartile. Currently, Fresh Del Monte Produce is below median at +7% of EBITDA (+$16.6 million).
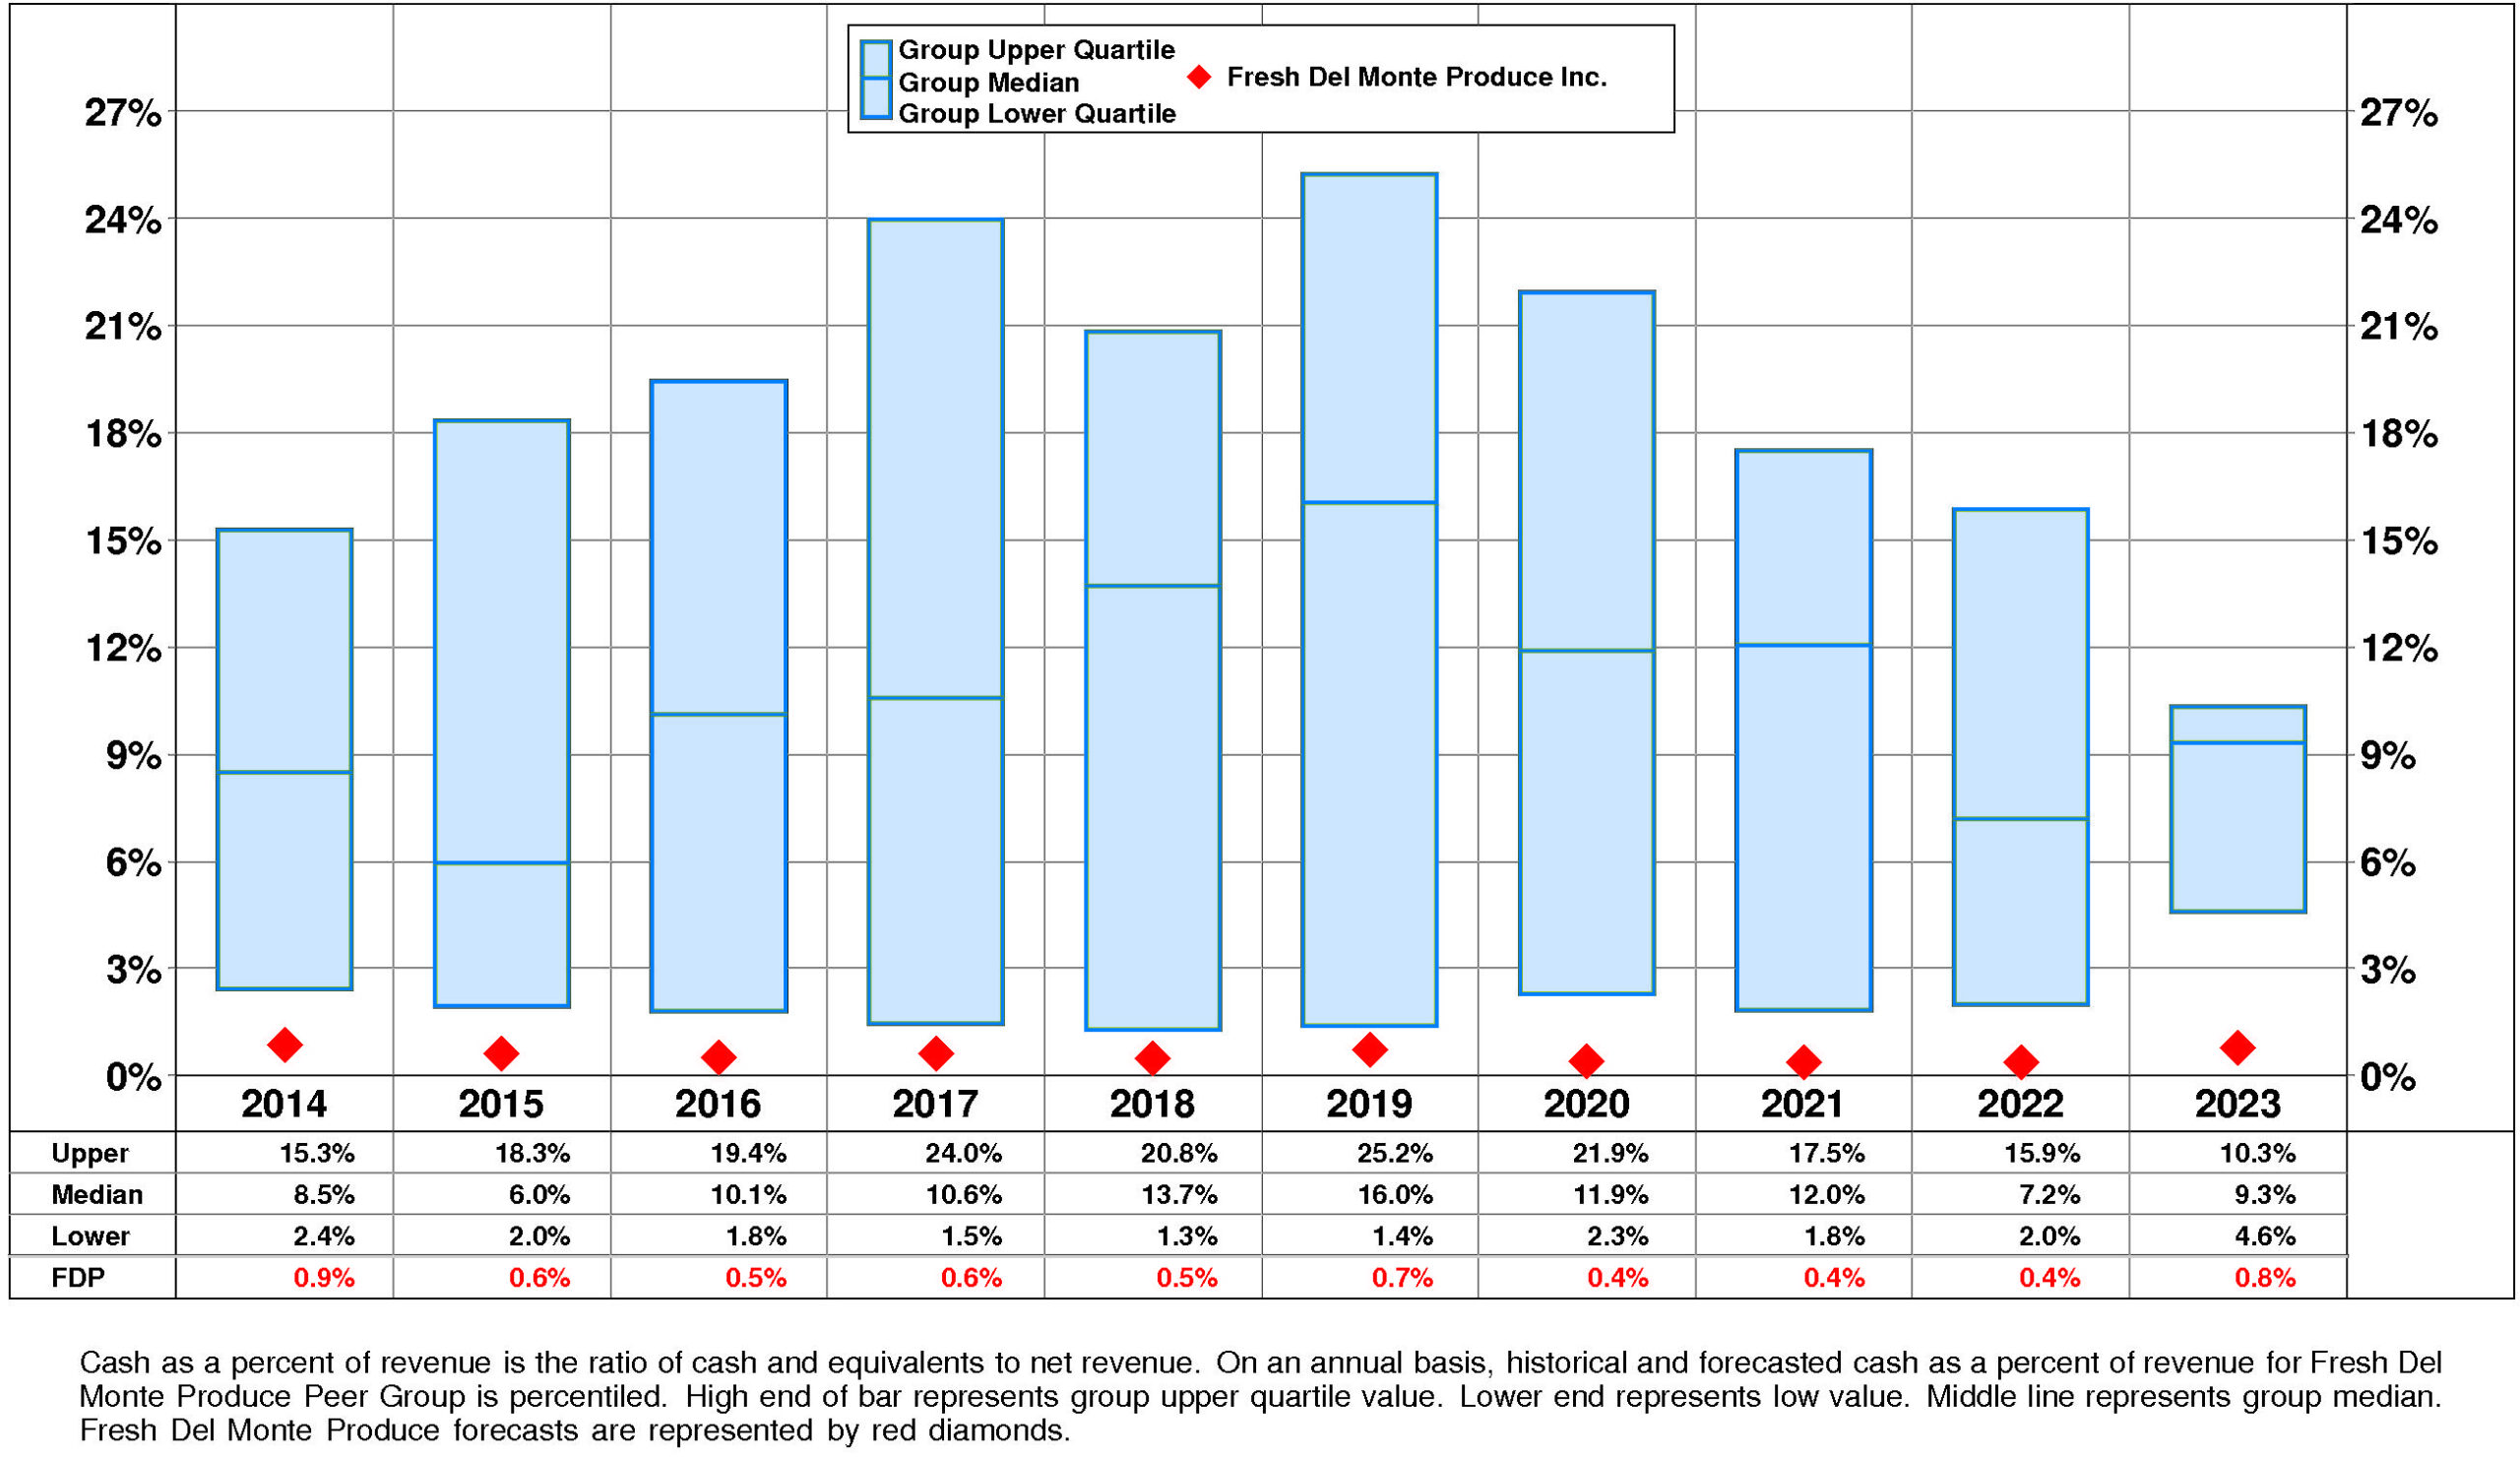
FDP's Cash, %Revenue has exhibited little to no overall change over the period.
This stability was accompanied by stability for the Fresh Del Monte Produce Peer Group as well. In most years, Fresh Del Monte Produce was in the lower quartile. Currently, Fresh Del Monte Produce is lower quartile at +1%.
PROFITABILITY
FDP's return on equity has eroded very significantly since 2014. The current level is -0.6% versus the high of 8.1% and the low of -1.3%.
FDP's very strong negative trend in pretax operating return significantly augmented by a very strong negative trend in non-operating factors is a major performance consideration.
The productivity of FDP's assets declined over the full period 2014-2023: asset turnover has experienced a minor downtrend.
Reinforcing this trend, pretax margin experienced a very strong overall downtrend that accelerated very sharply from the 2022 level.
Non-operating factors (income taxes and financial leverage) had a significant negative influence on return on equity.
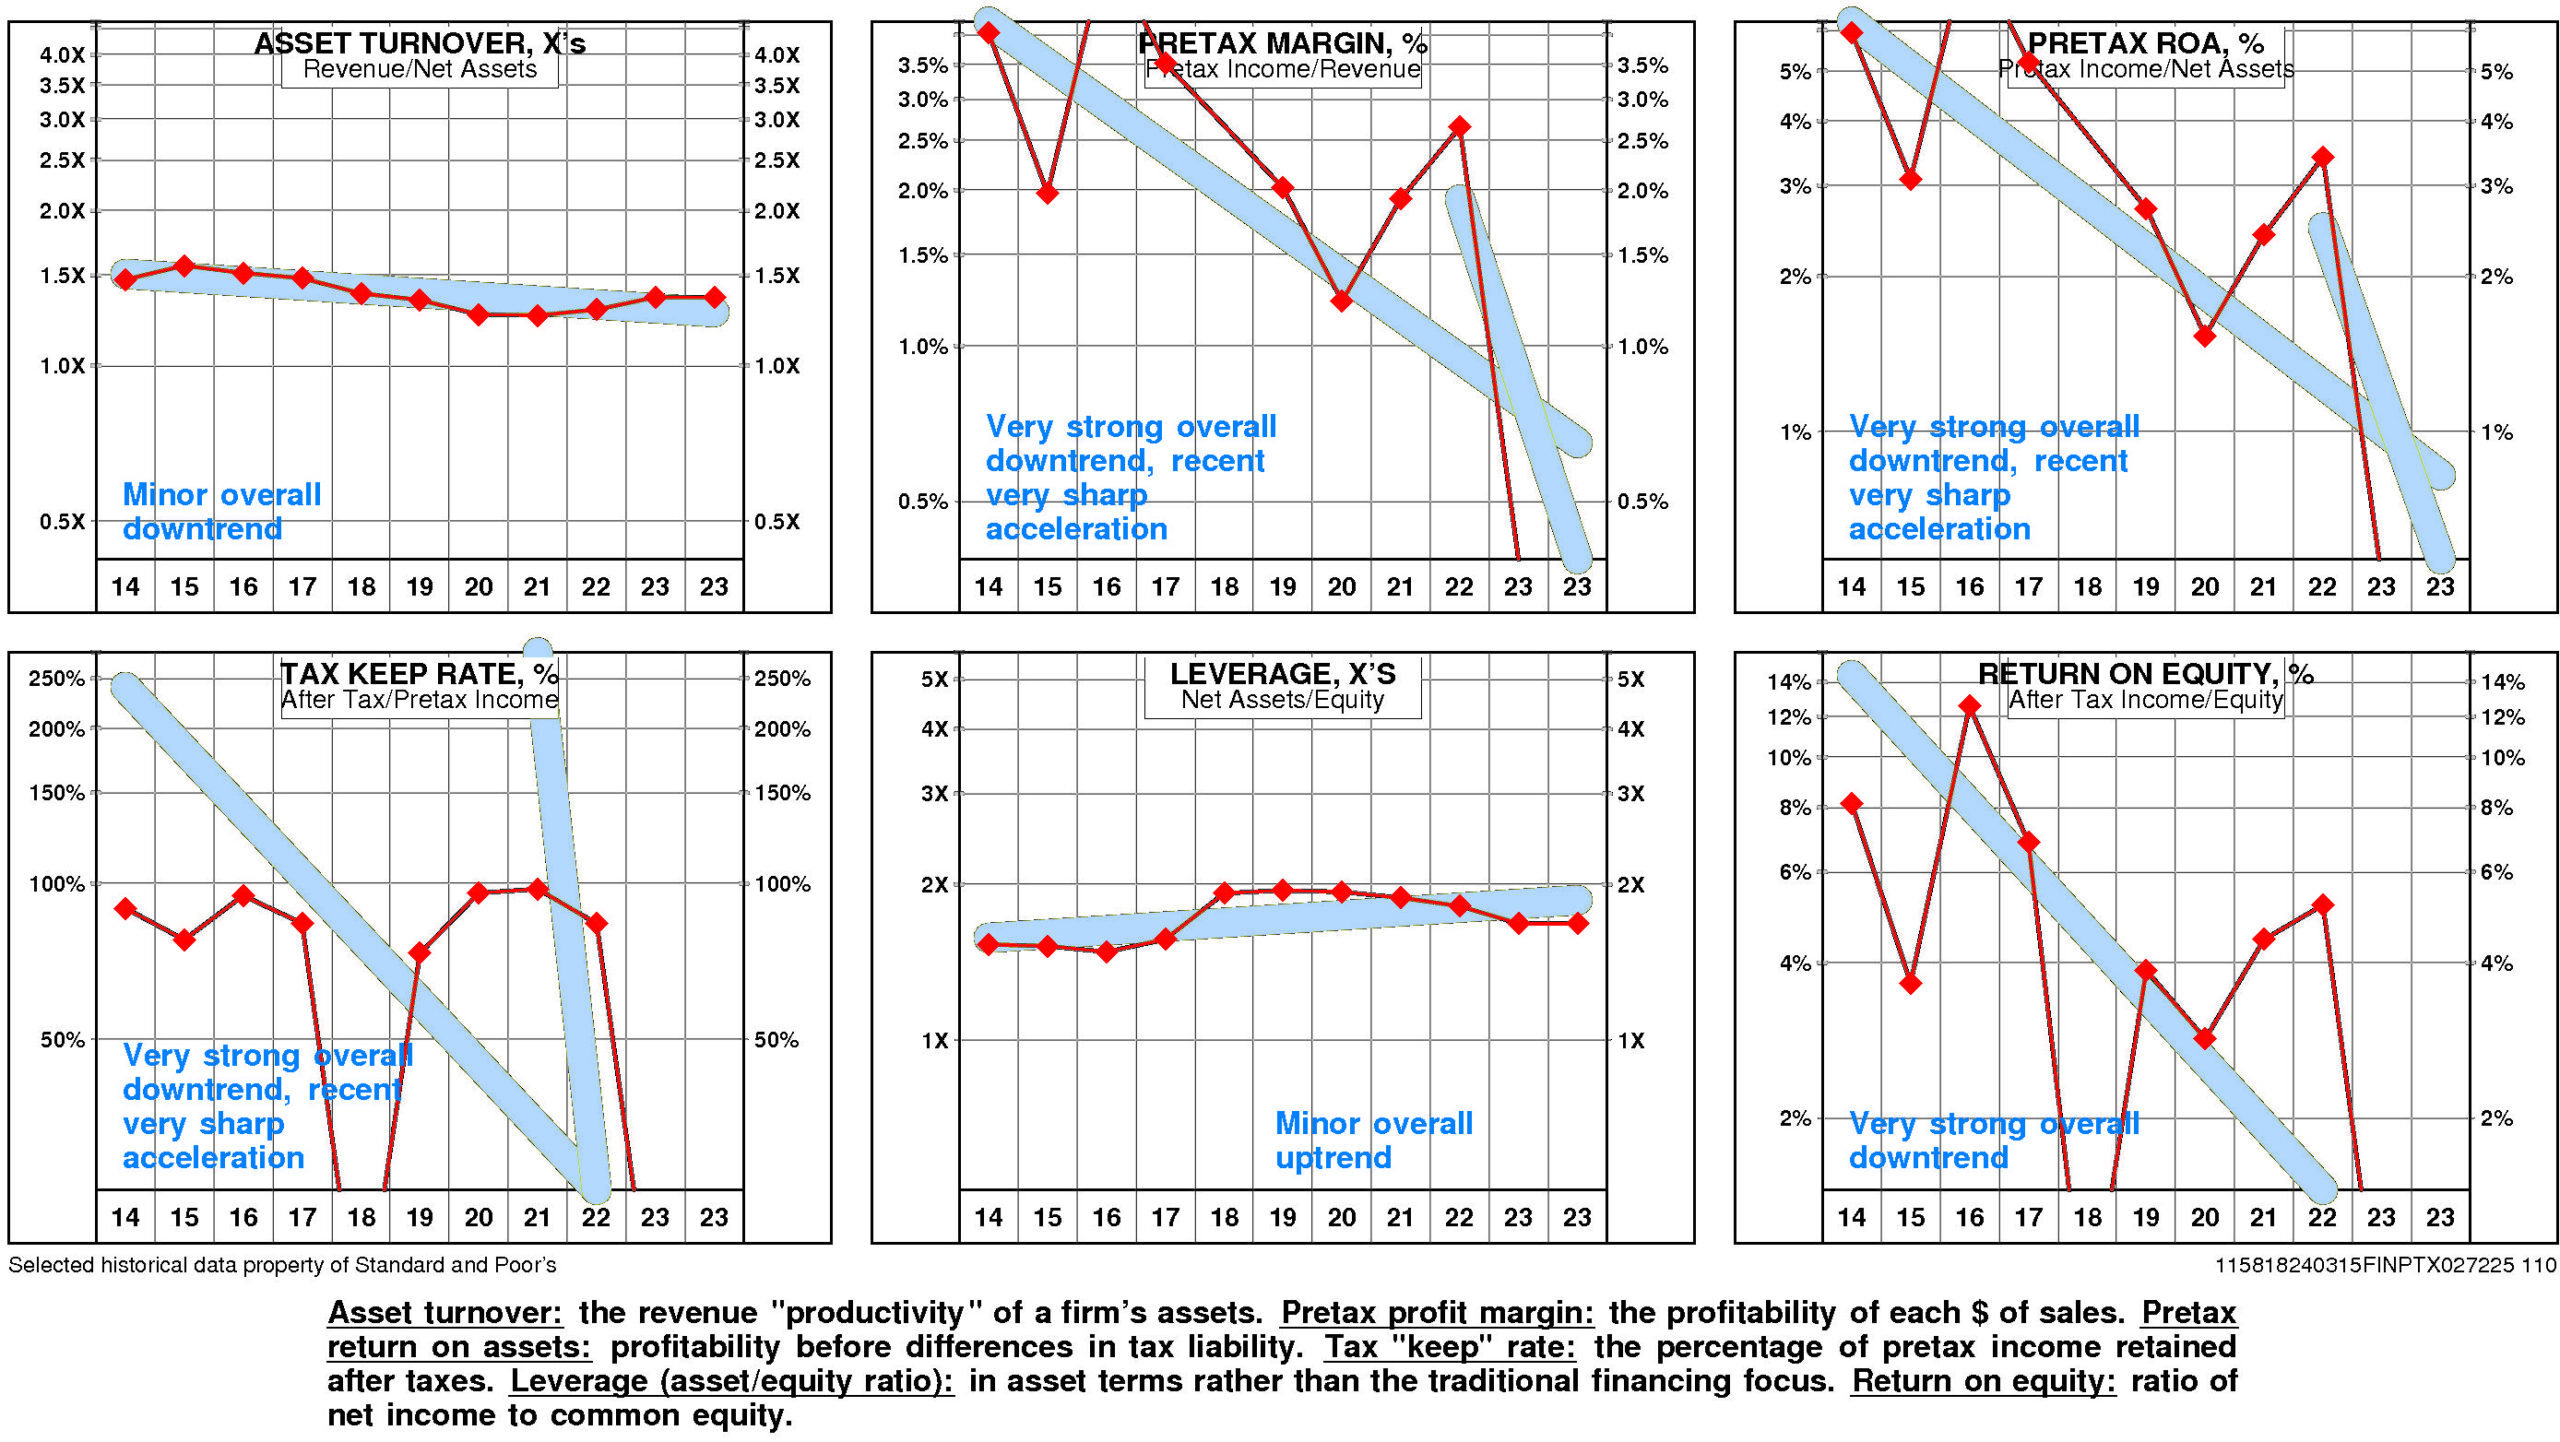
FDP's return on equity is substantially below median (-0.6%) for the four quarters ended December, 2023.
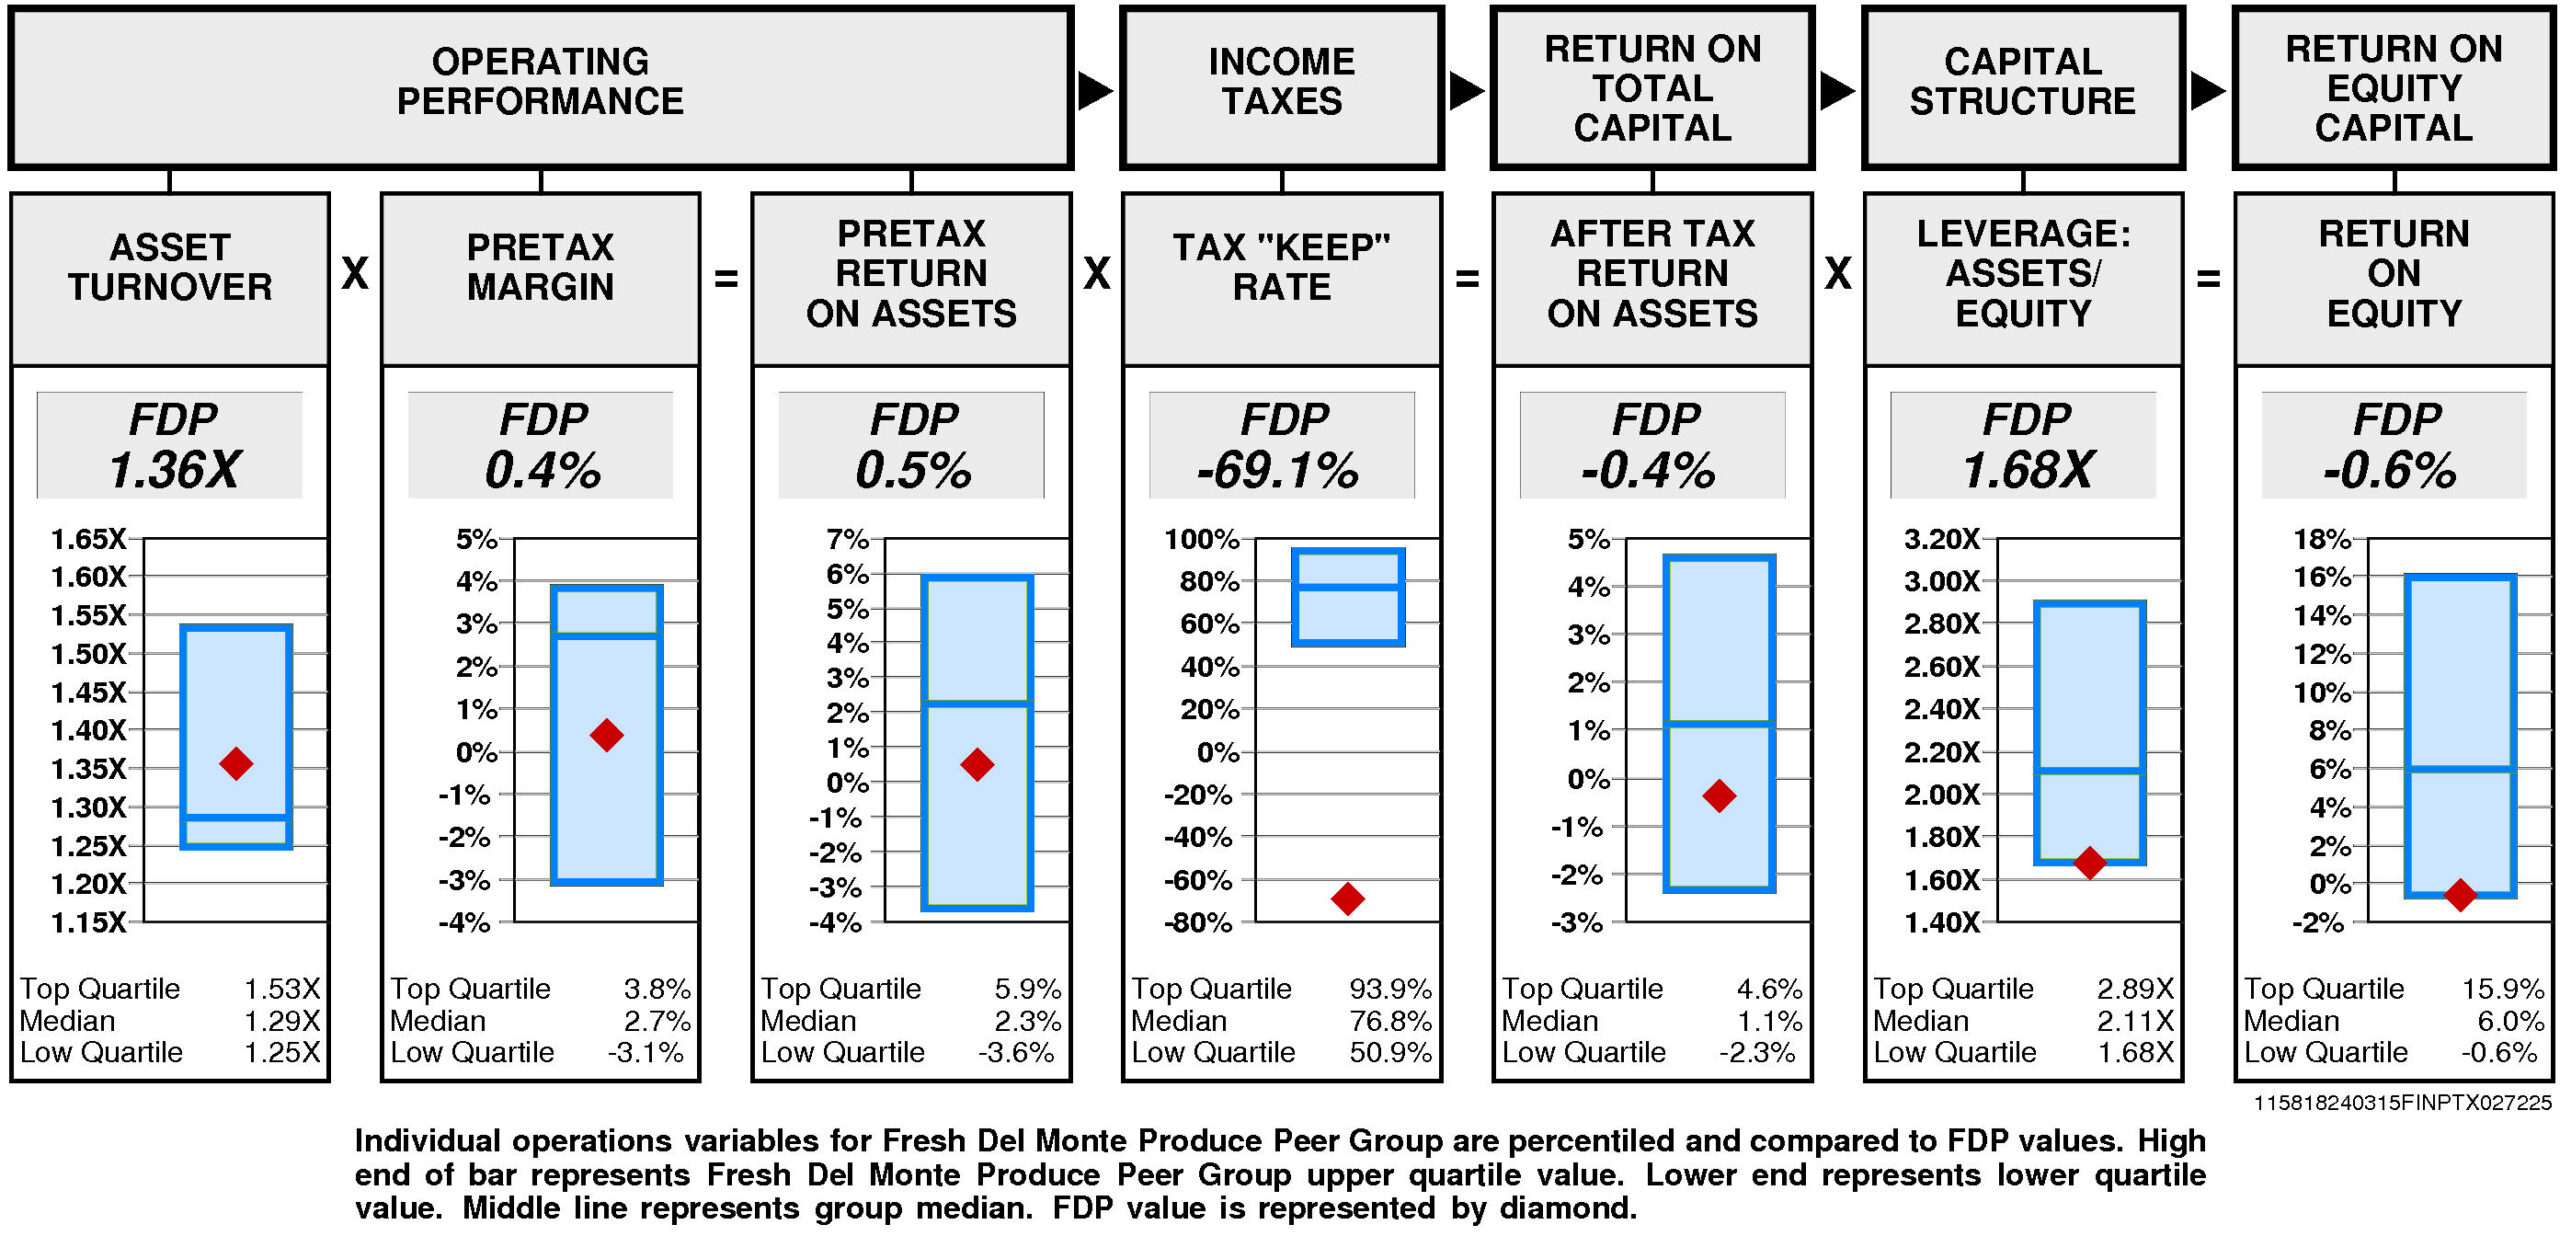
Operating performance (pretax return on assets) is below median (0.5%) reflecting asset turnover that is above median (1.36X) and below median pretax margin (0.4%).
Tax “keep” rate (income tax management) is lower quartile (-69.1%) resulting in after tax return on assets that is below median.
Financial leverage (leverage) is at the lower quartile (1.68X).
GROWTH RATES
Overall, Fresh Del Monte Produce's growth rate has slowed considerably in recent years.
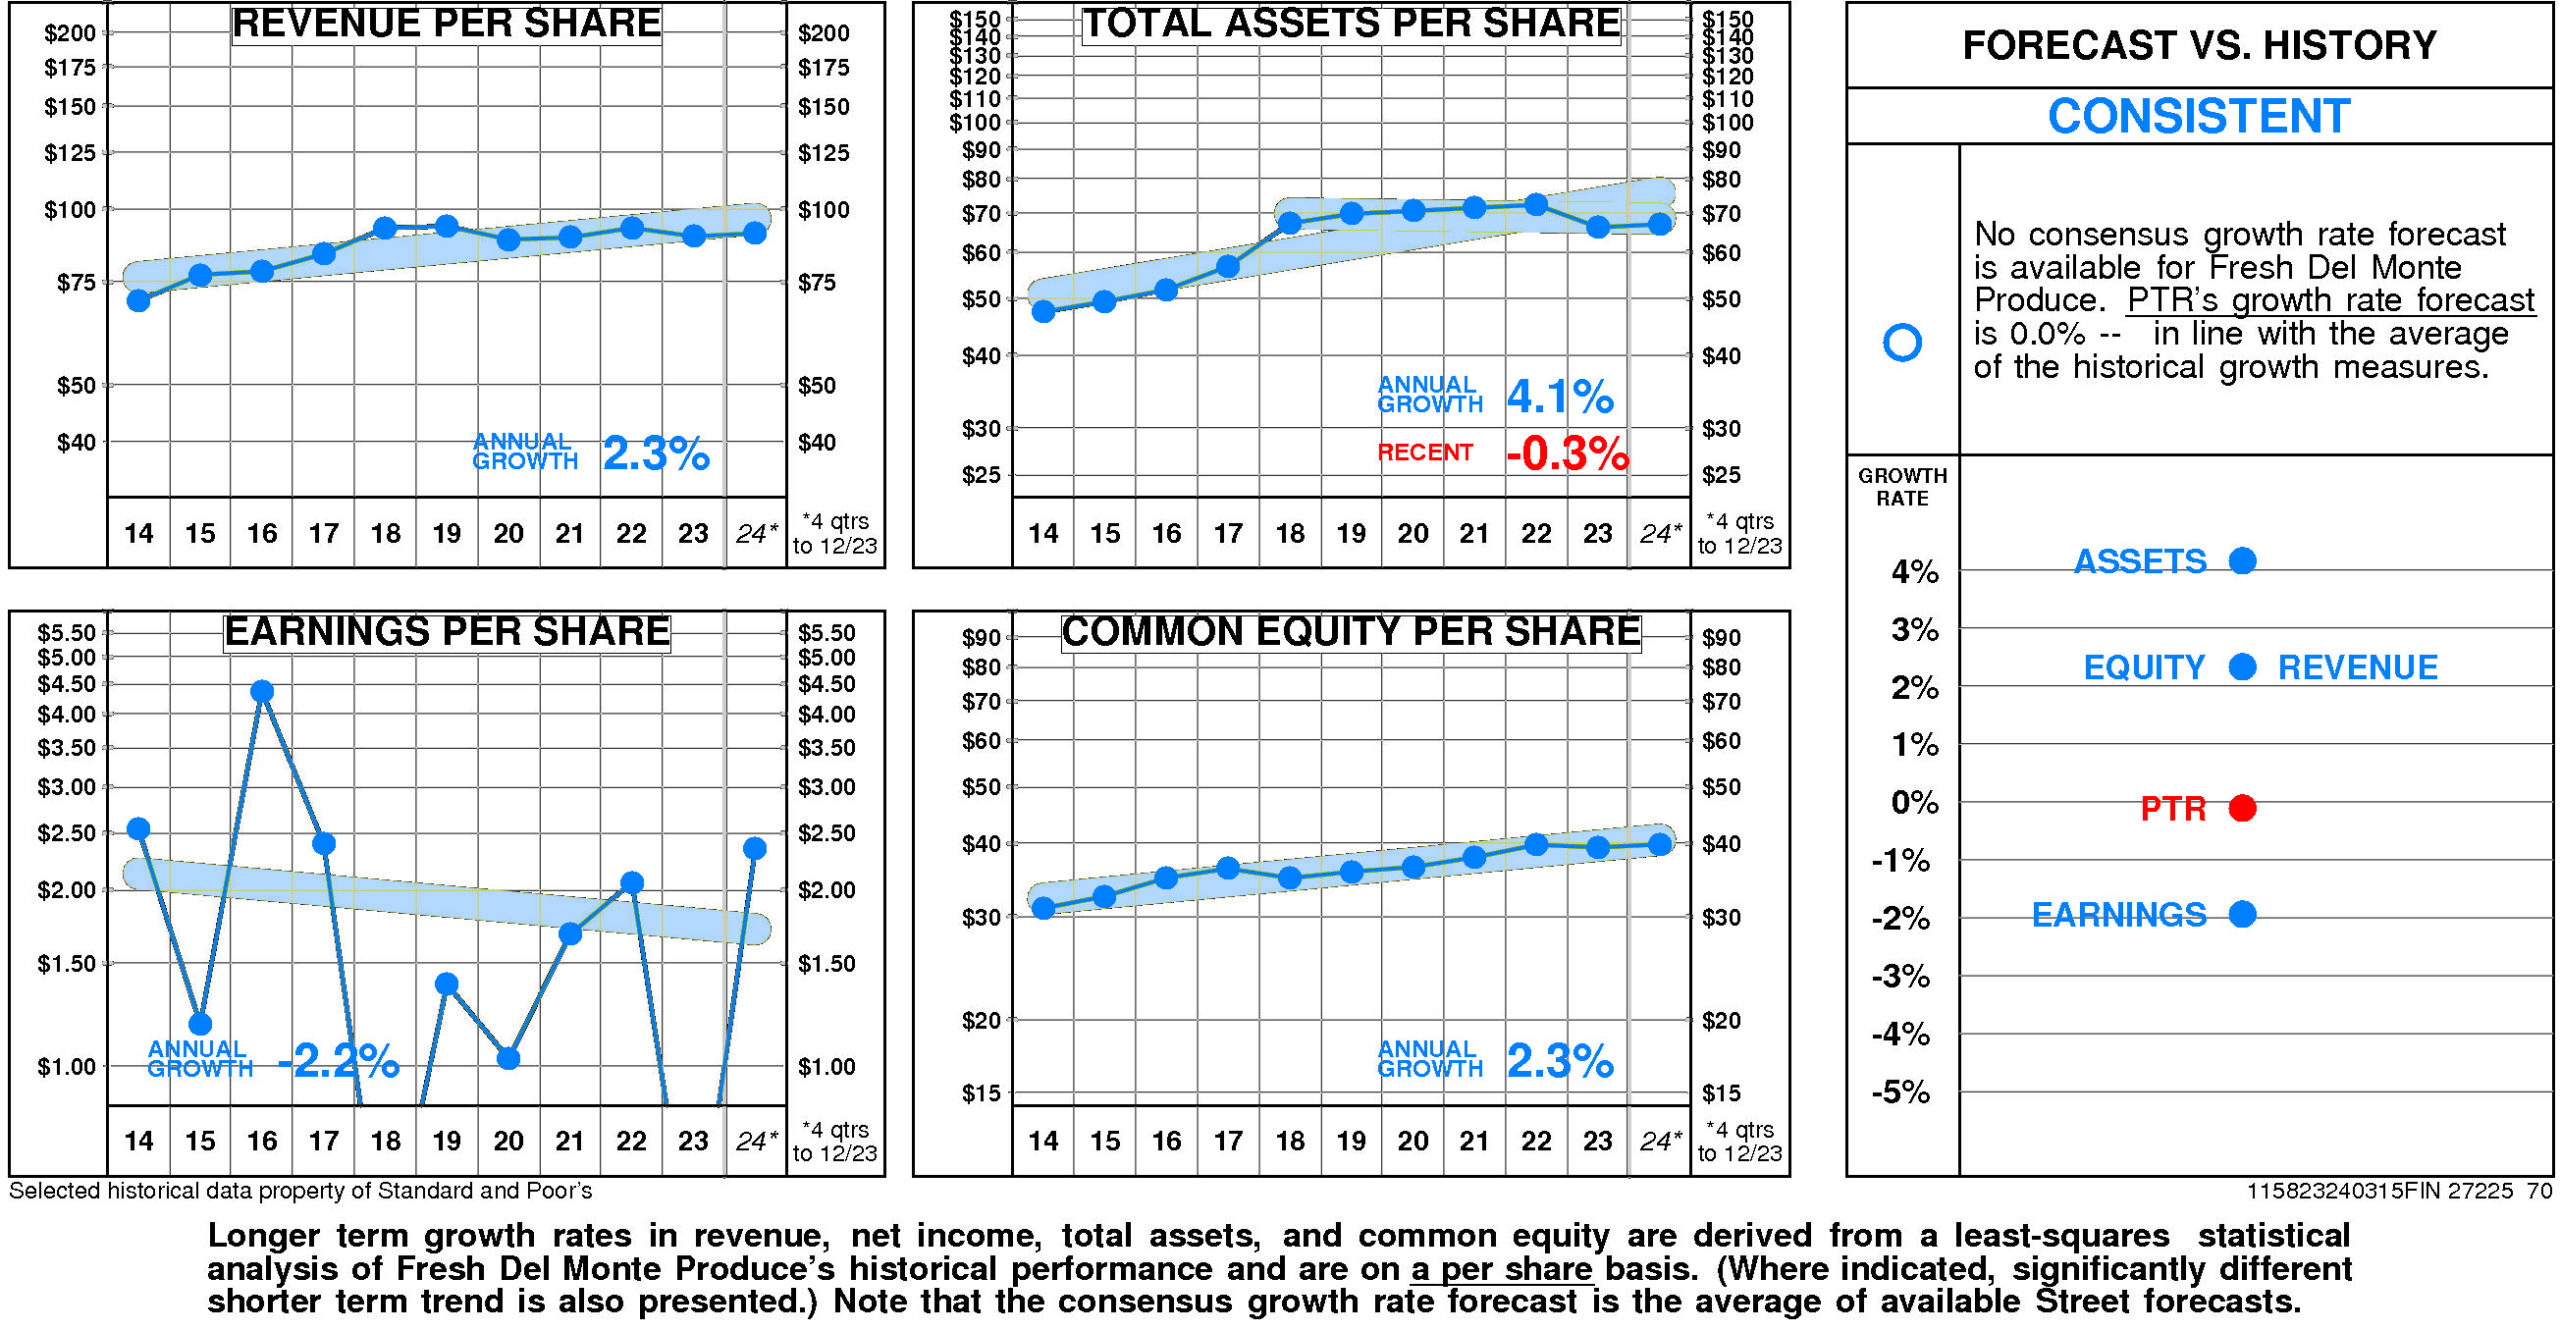
Fresh Del Monte Produce's historical income statement growth has been in line with balance sheet growth. Revenue growth has paralleled asset growth; earnings growth has paralleled equity growth.
Annual revenue growth
has been 2.3% per year.
Total asset growth
has been 4.1% per year. (More recently it has been -0.3%.)
Annual E.P.S. growth
has been -2.2% per year.
Equity growth
has been 2.3% per year.
No consensus growth rate forecast is available for Fresh Del Monte Produce.
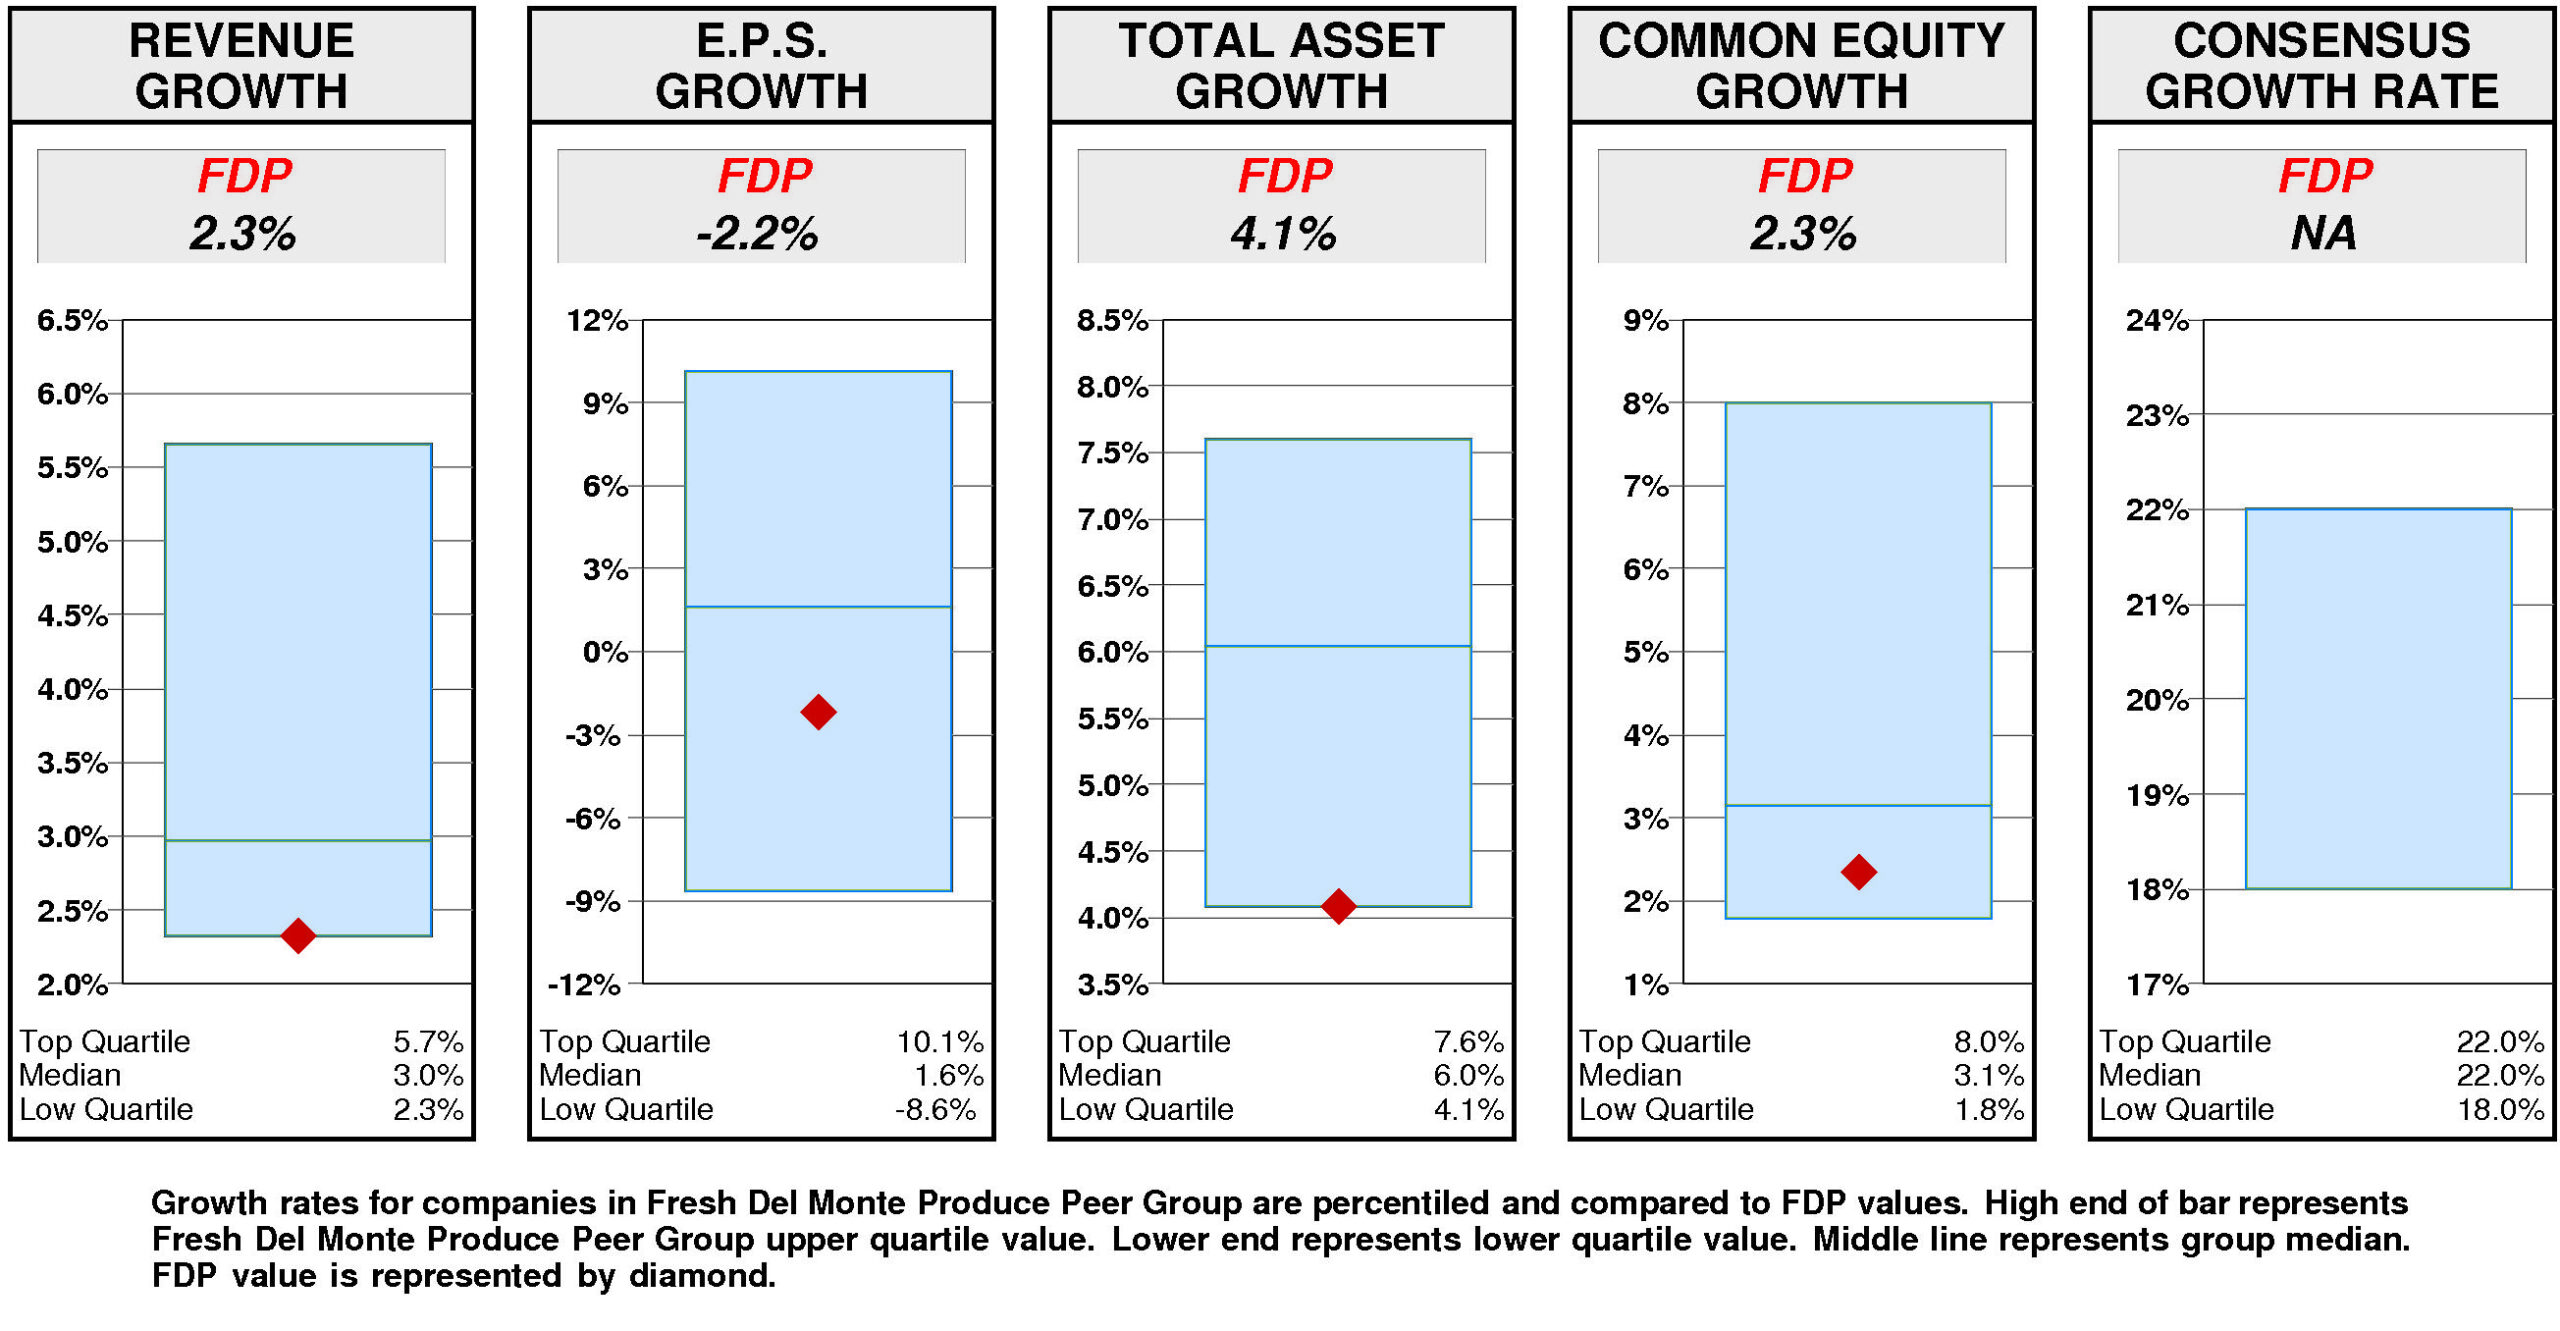
Relative to the Fresh Del Monte Produce Peer Group, Fresh Del Monte Produce's historical growth measures are consistently third quartile.
E.P.S. growth (-2.2%) has been below median. Equity growth (2.3%) has been below median. Revenue growth (2.3%) has been at the lower quartile. Total asset growth (4.1%) has been at the lower quartile.
Consensus growth forecast is unavailable.
PRICE HISTORY
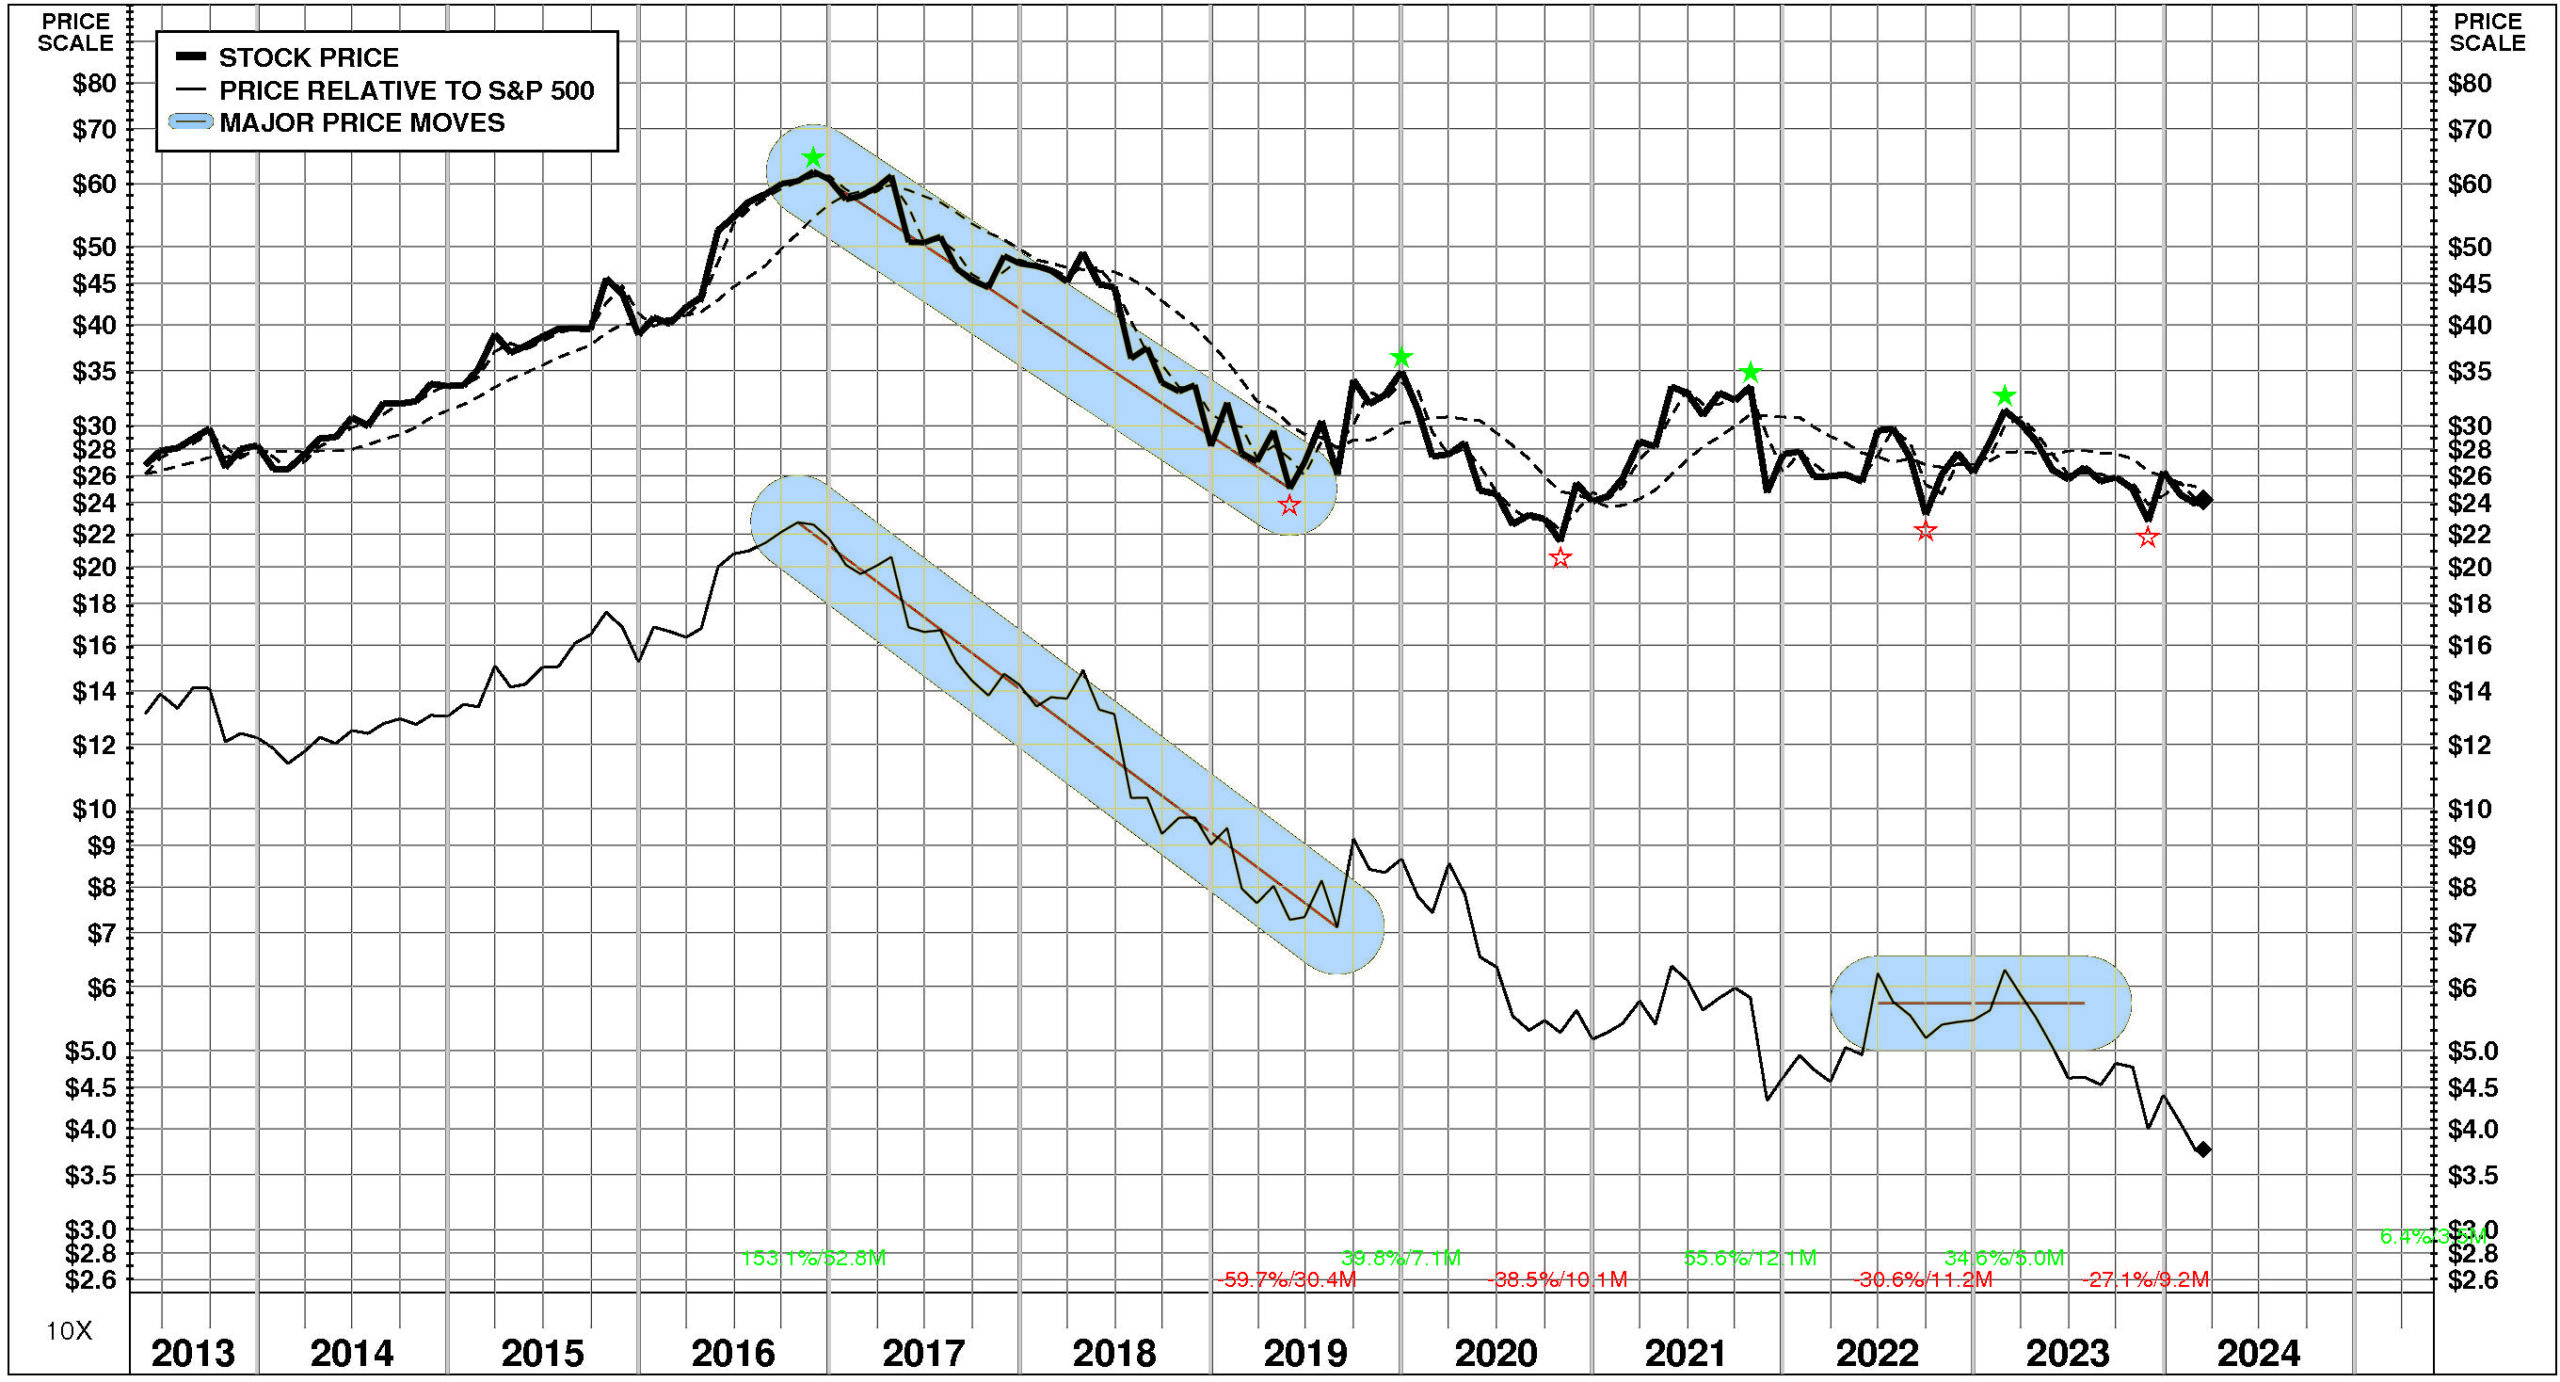
Over the full time period, Fresh Del Monte Produce's stock price performance has been significantly below market.
Between May, 2013 and March, 2024, Fresh Del Monte Produce's stock price fell -9%; relative to the market, this was a -71% loss. Significant price move during the period: 1) November, 2016 – May, 2019: -60%.
TOTAL INVESTMENT RETURNS
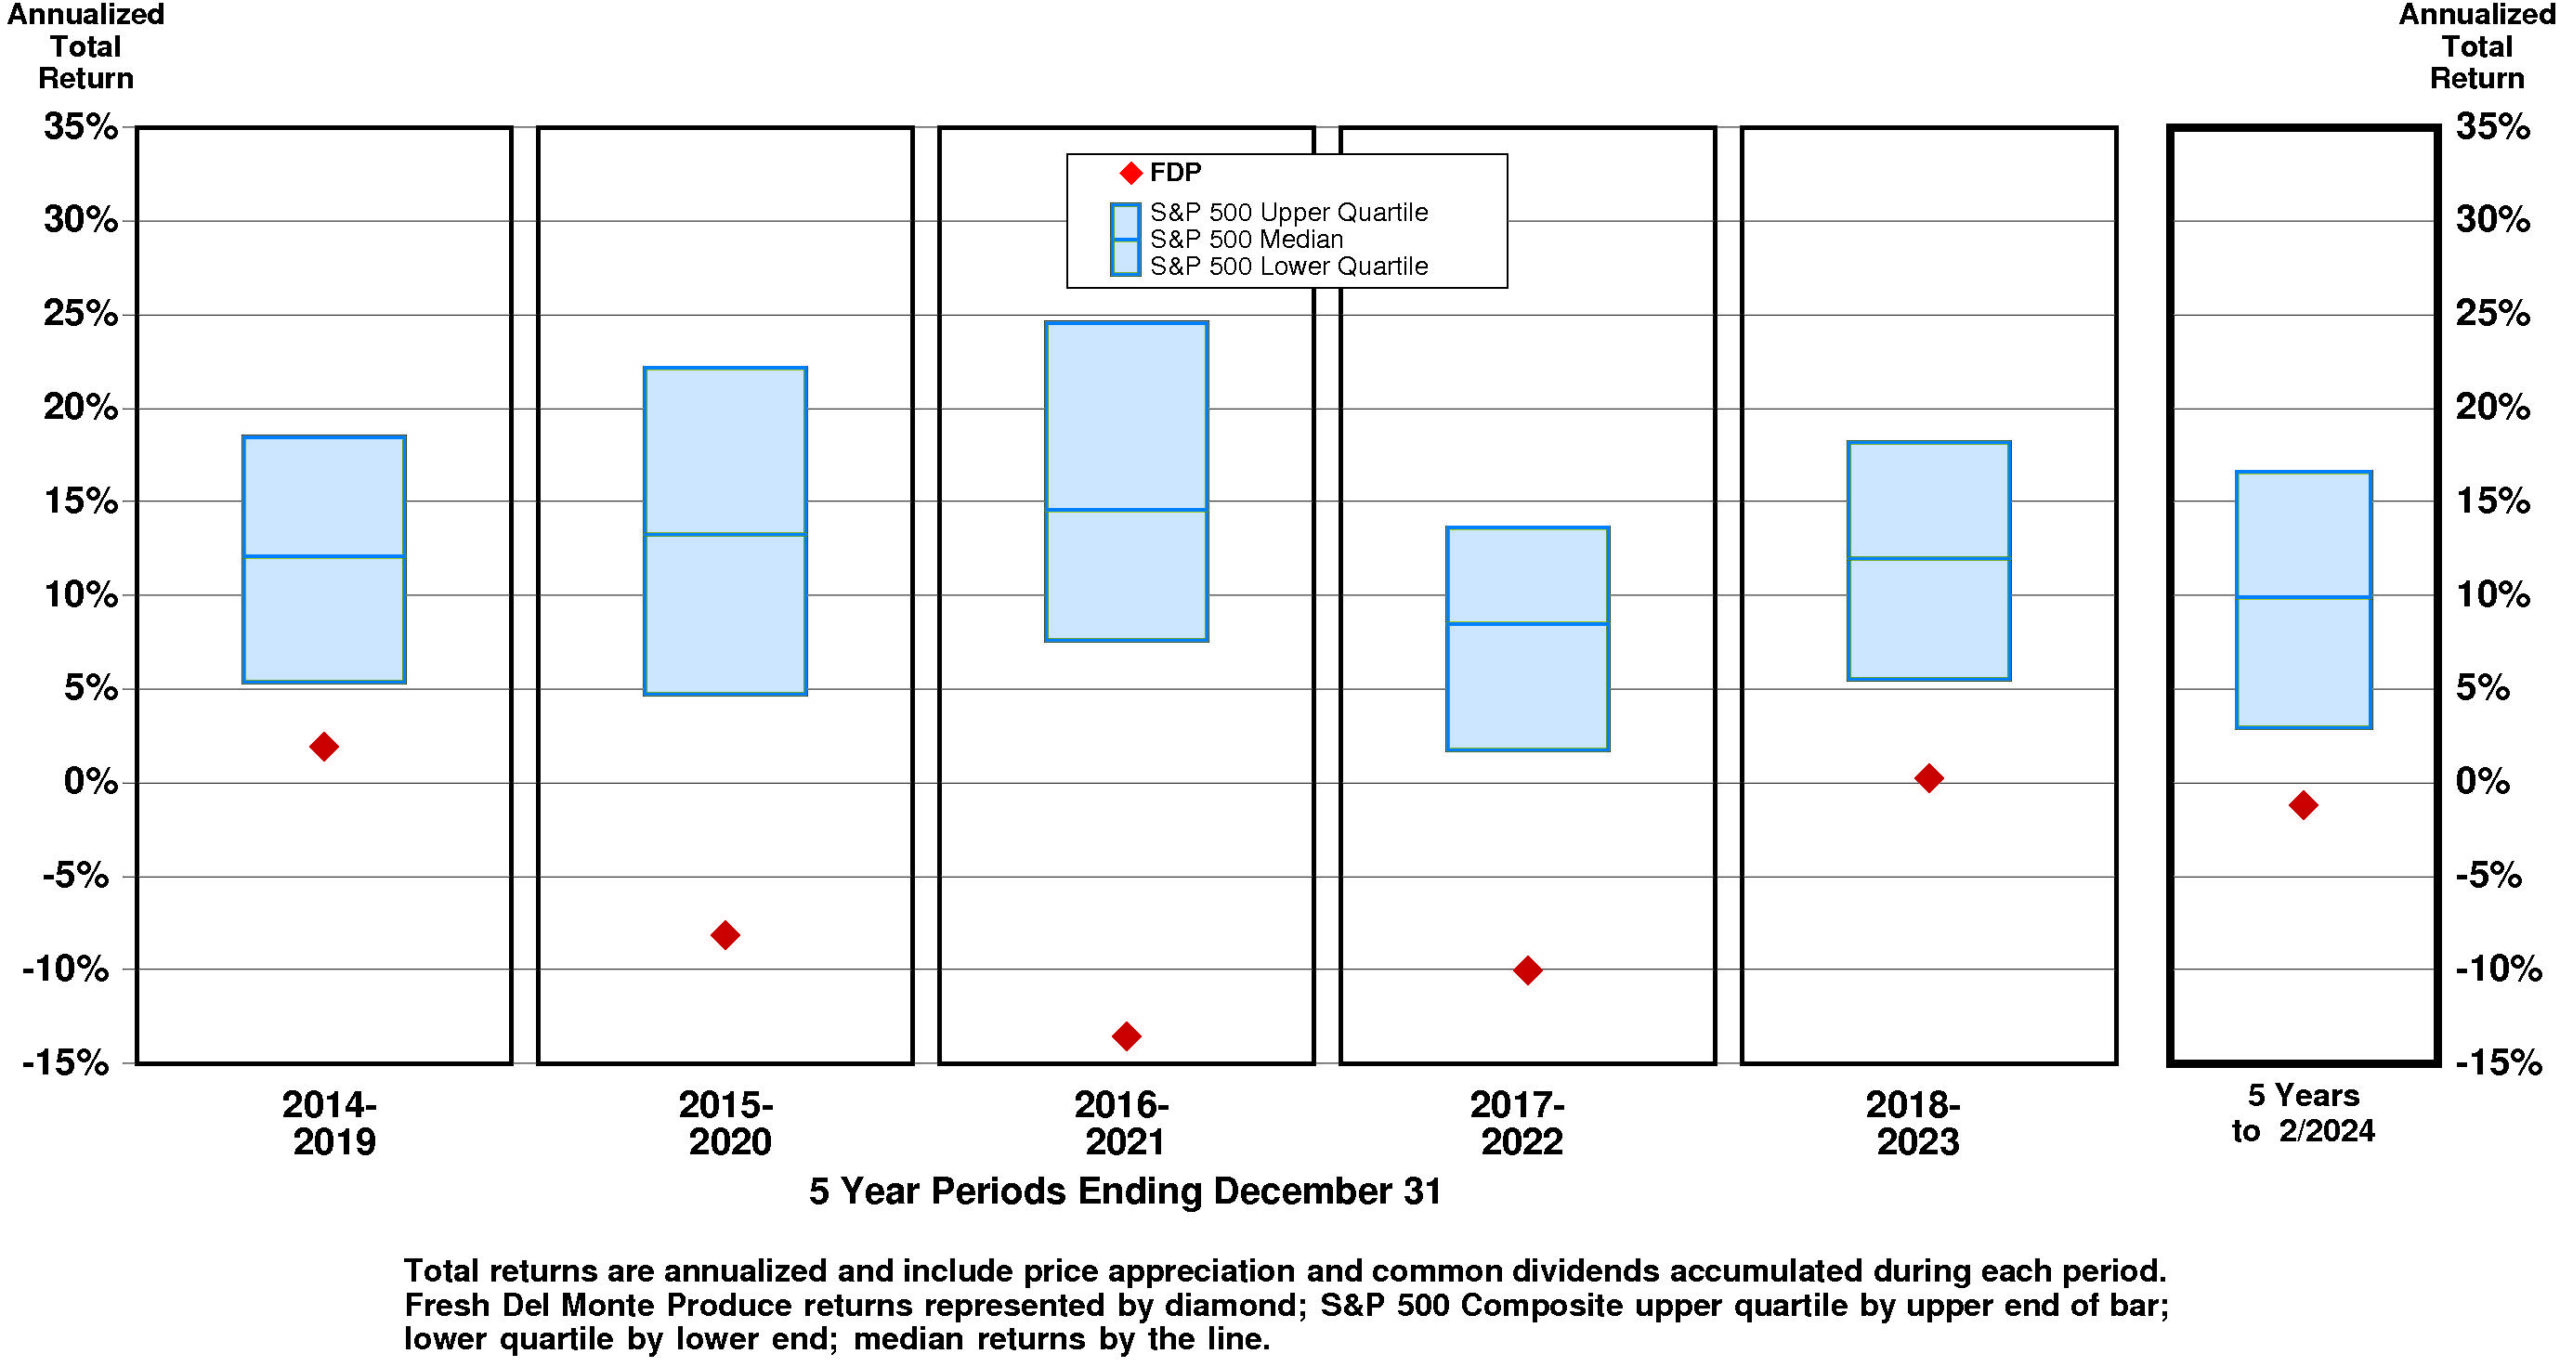
Current annual total return performance of -21.2% is lower quartile relative to the S&P 500 Composite.
In addition to being lower quartile relative to S&P 500 Composite, current annual total return performance through February, 2024 of -21.2% is lower quartile relative to Fresh Del Monte Produce Inc. Peer Group.
Current 5-year total return performance of -1.2% is lower quartile relative to the S&P 500 Composite.
Through February, 2024, with lower quartile current 5-year total return of -1.2% relative to S&P 500 Composite, Fresh Del Monte Produce's total return performance is substantially below median relative to Fresh Del Monte Produce Inc. Peer Group.
VALUATION BENCHMARKS
Relative to S&P 500 Composite, FDP's overall valuation is exceptionally low.
All five factors are lower quartile. The highest factor is the ratio of enterprise value/earnings before interest and taxes, followed by the price/earnings ratio, then by the ratio of enterprise value/assets, then by the price/equity ratio. The lowest factor is the ratio of enterprise value/revenue.
Relative to Fresh Del Monte Produce Peer Group, FDP's overall valuation is exceptionally low.
All five factors are lower quartile. The highest factor is the ratio of enterprise value/revenue, followed by the ratio of enterprise value/assets, then by the price/equity ratio, then by the ratio of enterprise value/earnings before interest and taxes. The lowest factor is the price/earnings ratio.
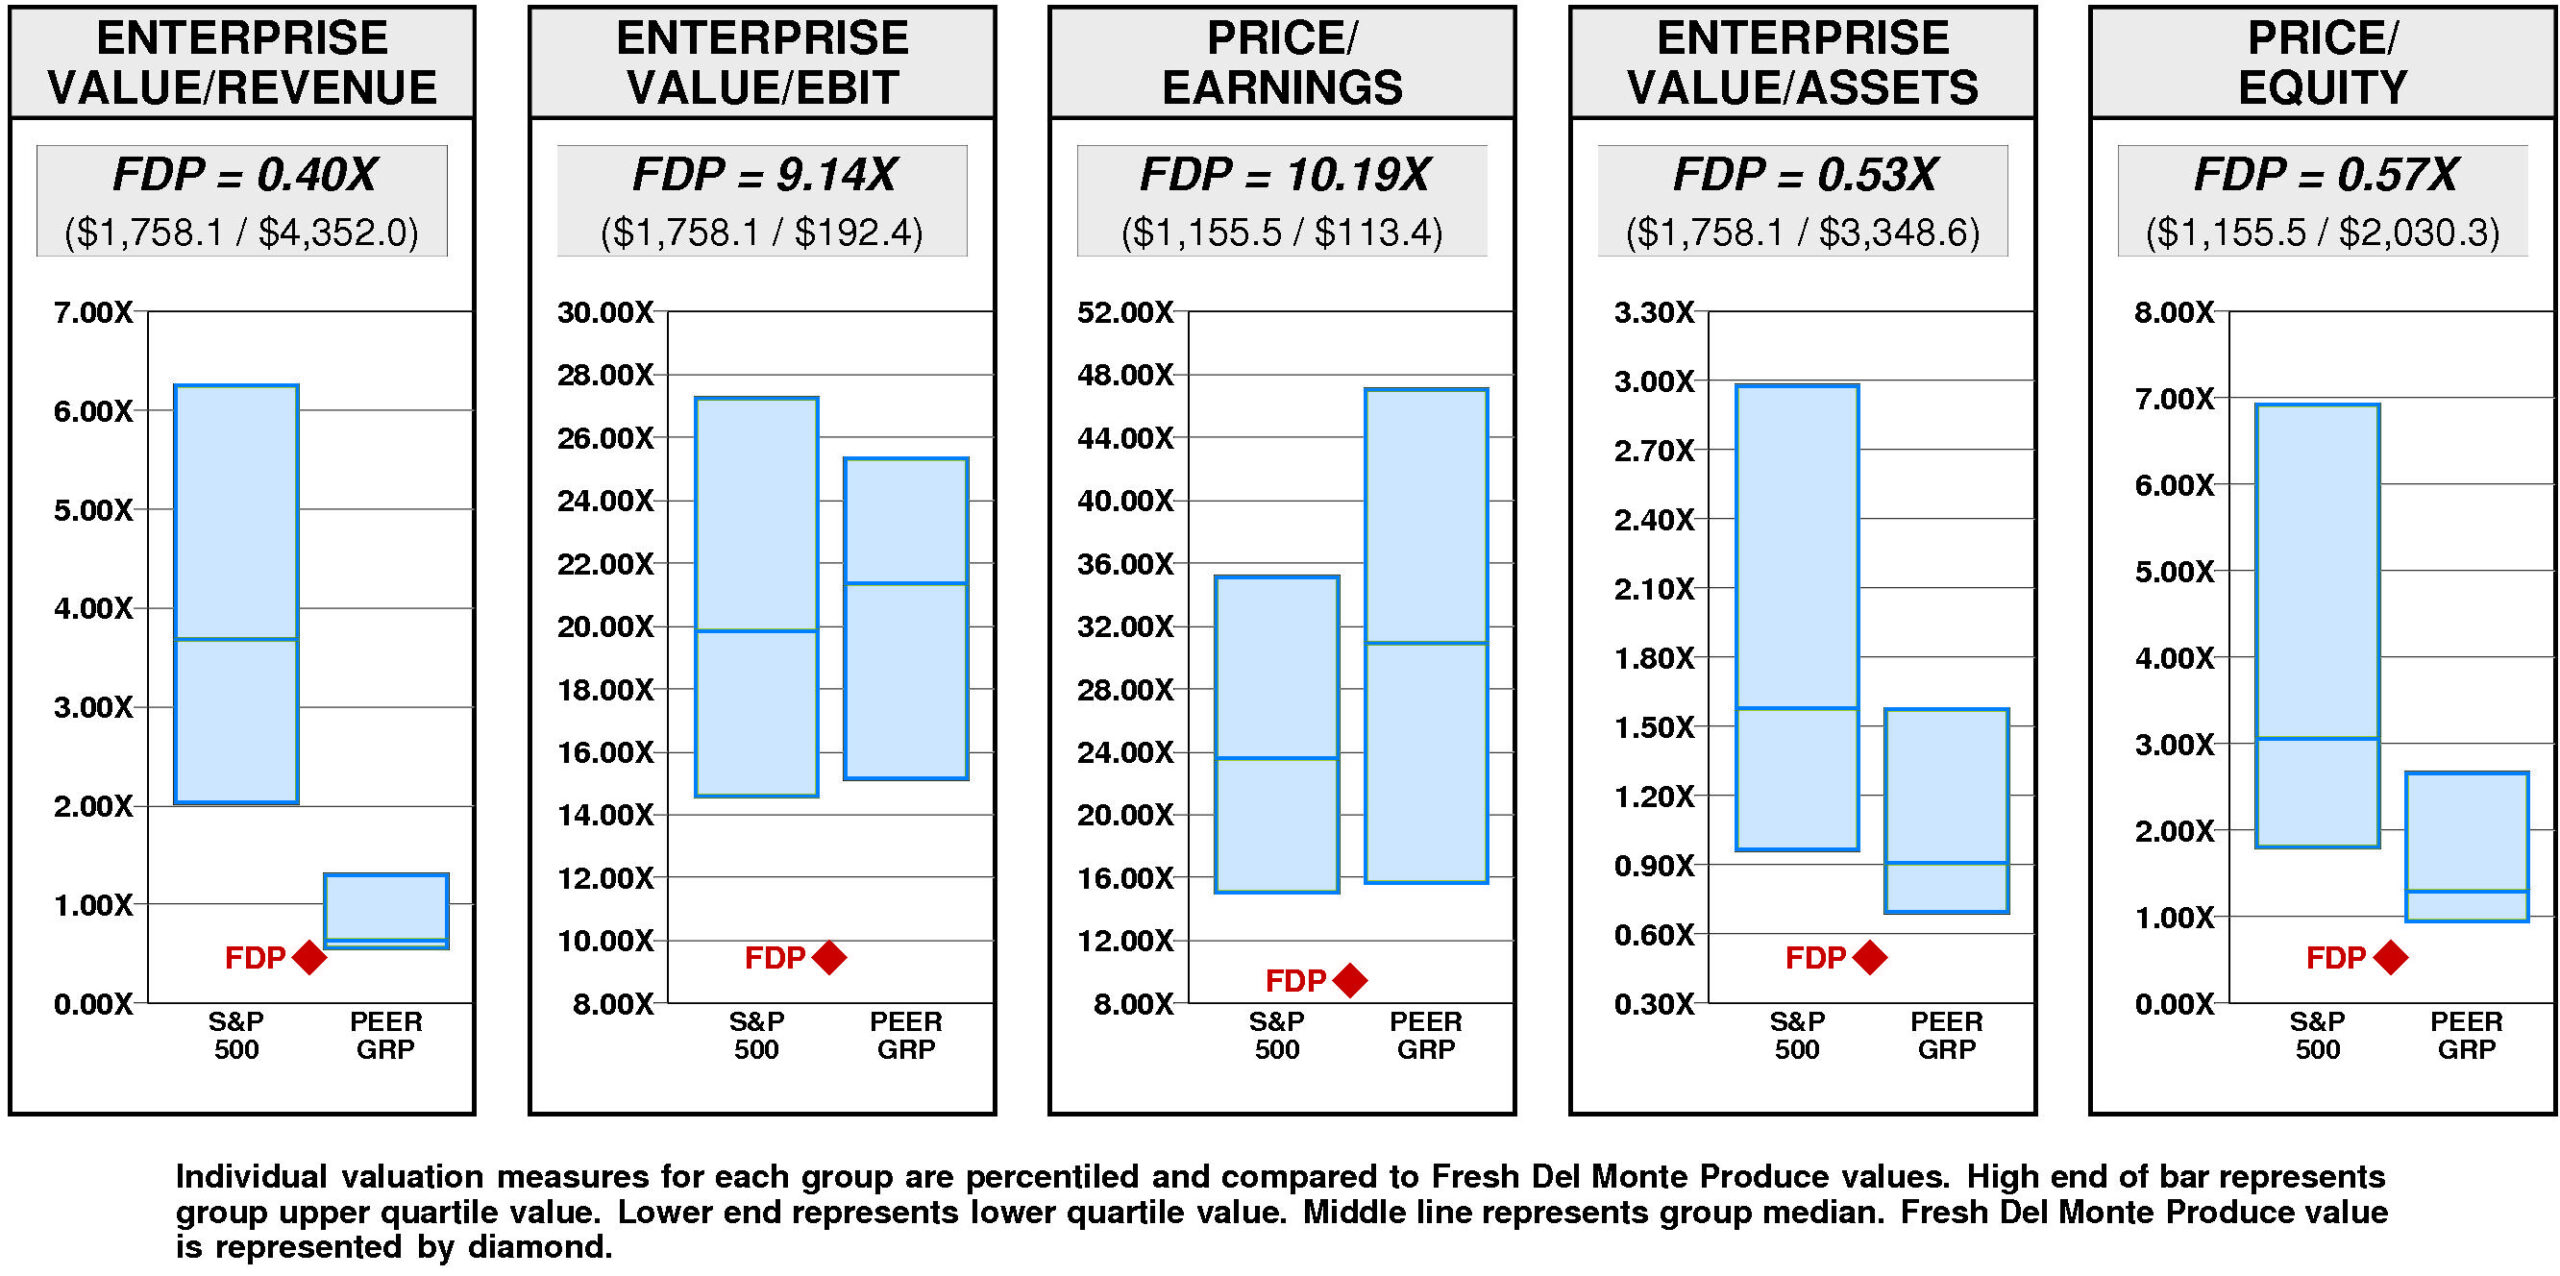
Fresh Del Monte Produce has a major value gap compared to the median.
For FDP to hit median valuation, its current ratio of enterprise value/revenue would have to rise from the current level of 0.40X to 0.64X. If FDP's ratio of enterprise value/revenue were to rise to 0.64X, its stock price would be higher by $21 to $45.
For FDP to achieve upper quartile valuation relative to the Fresh Del Monte Produce Peer Group, its current ratio of enterprise value/revenue would have to rise from the current level of 0.40X to 1.30X. If FDP's ratio of enterprise value/revenue were to rise to 1.30X, its stock price would increase by $82 from the current level of $24.
VALUE TARGETS
Reflecting future returns on capital that are forecasted to be above the cost of capital, FDP is expected to continue to be a modest Value Builder.
Fresh Del Monte Produce's current Price Target of $57 represents a +136% change from the current price of $24.26.
This high appreciation potential results in an appreciation score of 77 (only 23% of the universe has greater appreciation potential.)
Notwithstanding this high Appreciation Score of 77, the moderately low Power Rating of 32 results in an Value Trend Rating of C.
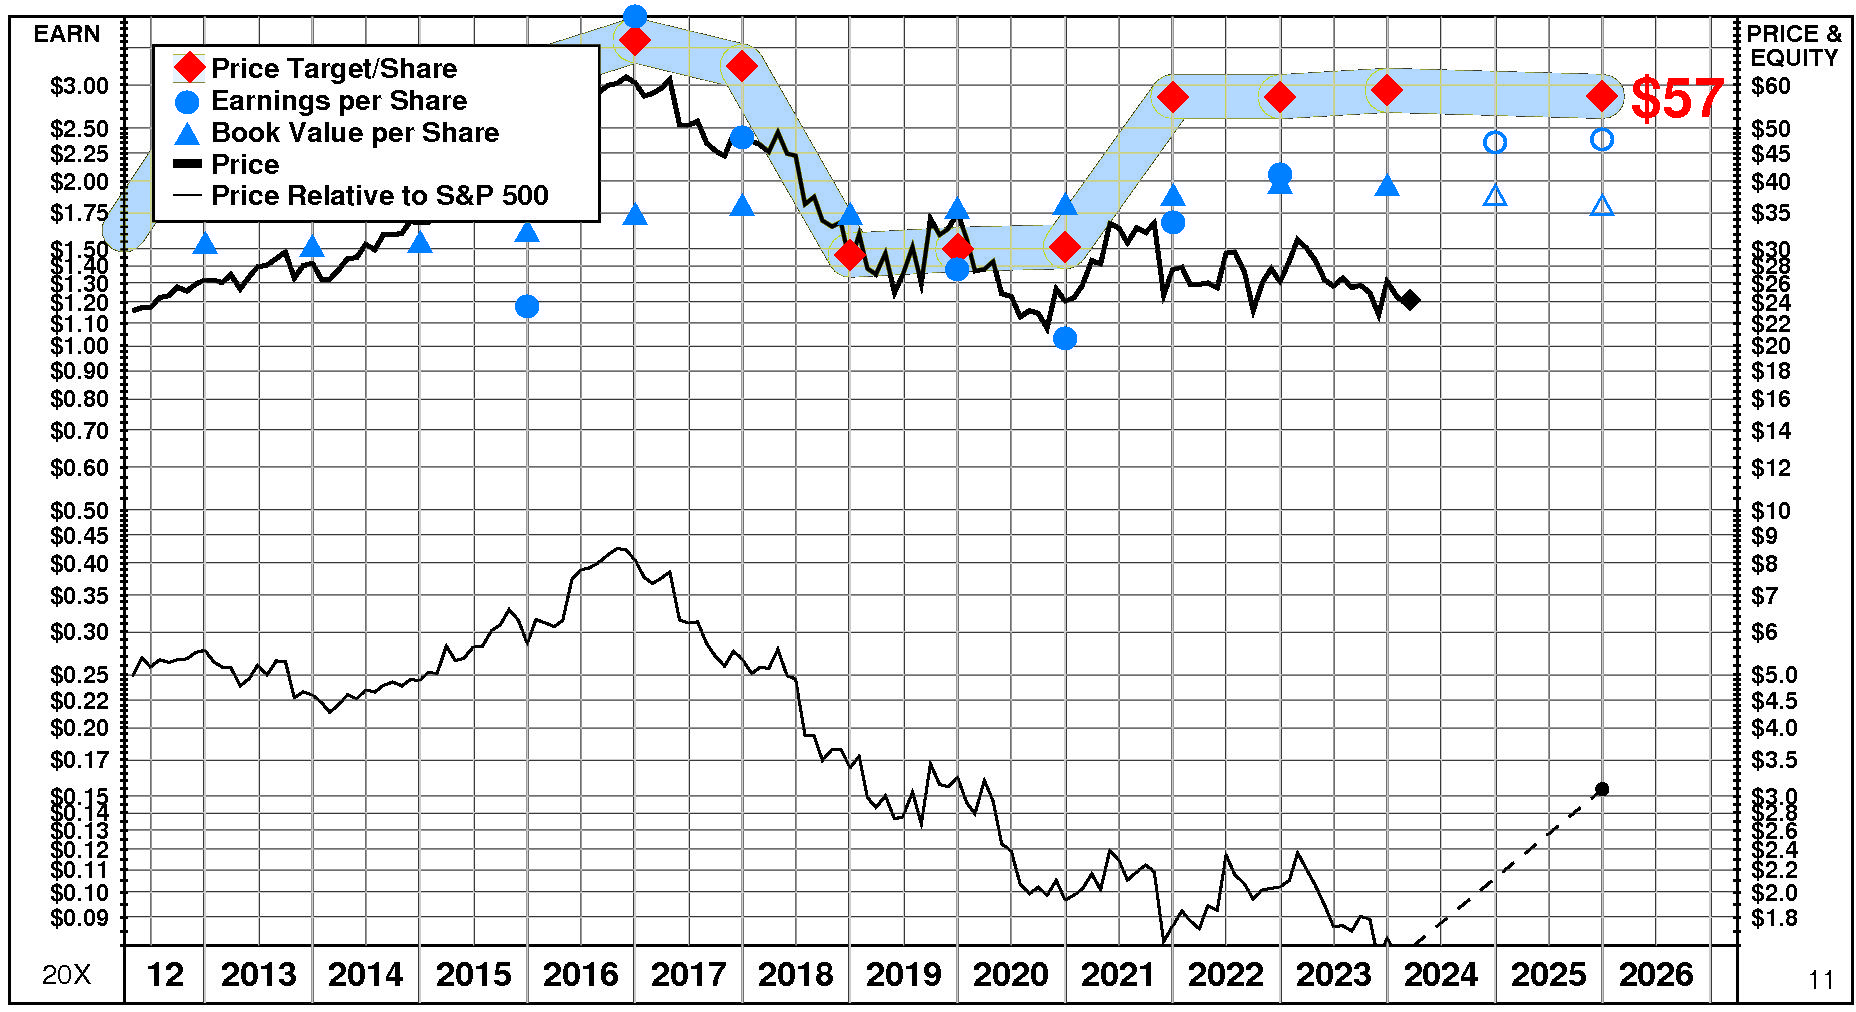
Fresh Del Monte Produce's current Price Target is $57 (-3% from the 2023 Target of $59 but +136% from the 03/14/24 price of $24.26).
This plateau in the Target is the result of a -7% decrease in the equity base and a +5% increase in the price/equity multiple. One Driver has a positive impact on the price/equity multiple, one has a negative impact, and one has no effect. The forecasted increase in return on equity has a very large positive impact on the price/equity multiple. The forecasted growth has no impact. The forecasted increase in cost of equity has a large negative impact.
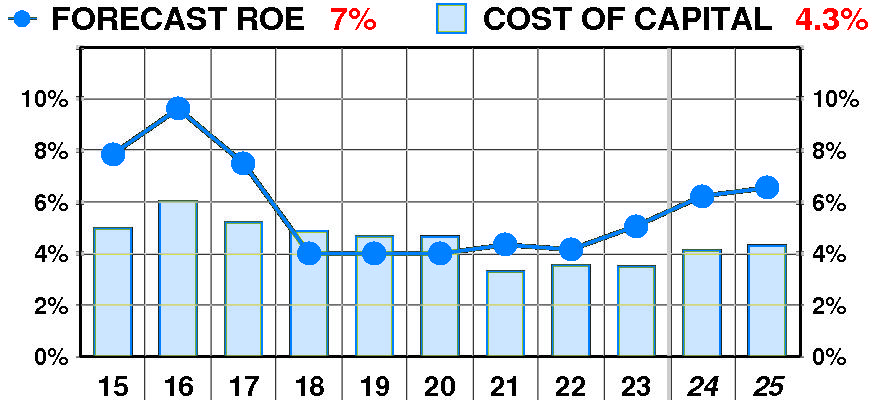
PTR's return on equity forecast is 6.6% — in line with our recent forecasts.
Forecasted return on equity suffered a dramatic, erratic decline between 2015 and 2023. The current forecast is below the 2016 peak of 10%.
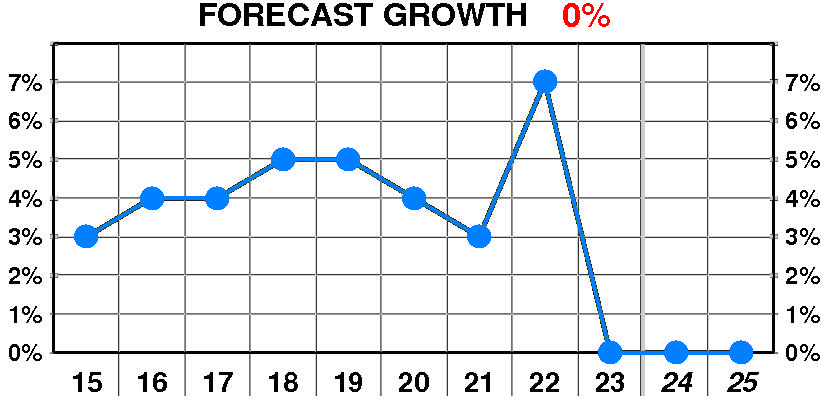
PTR's growth forecast is 0.0% — in line with our recent forecasts.
Forecasted growth enjoyed a dramatic, erratic increase between 2015 and 2023. The current forecast is well below the 2022 peak of 7%.
PTR's cost of equity forecast is 4.3% — in line with recent levels.
Forecasted cost of equity enjoyed a dramatic, variable decline between 2015 and 2023. The current forecast is steady at the 2016 peak of 6.0%.
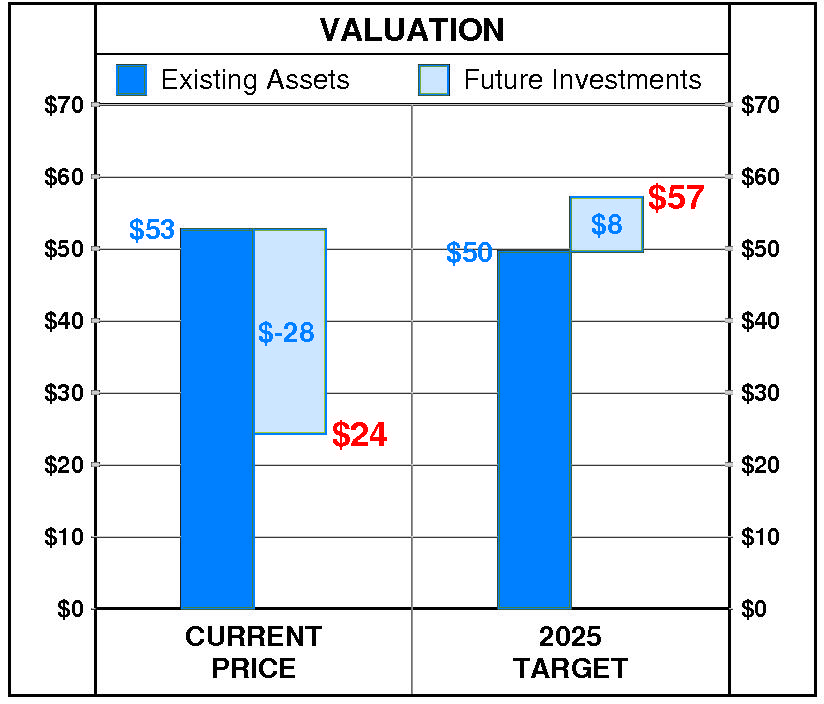
At Fresh Del Monte Produce's current price of $24.26, investors are placing a negative value of $-28 on its future investments. This view is not supported by the company's most recent performance that reflected a growth rate of 0.0% per year, and a return on equity of 5.1% versus a cost of equity of 3.5%.
PTR's 2025 Price Target of $57 is based on these forecasts and reflects an estimated value of existing assets of $50 and a value of future investments of $8.